")
Back to Journals » Diabetes, Metabolic Syndrome and Obesity » Volume 14
Estimation of the Prevalence of Nonalcoholic Fatty Liver Disease in an Adult Population in Northern China Using the Data Mining Approach
Received 18 May 2021
Accepted for publication 15 July 2021
Published 28 July 2021 Volume 2021:14 Pages 3437—3445
DOI https://doi.org/10.2147/DMSO.S320808
Checked for plagiarism Yes
Review by Single anonymous peer review
Peer reviewer comments 2
Editor who approved publication: Professor Ming-Hui Zou
TengFei Yang,1 Bo Zhao,2 Dongmei Pei1
1Department of Health Management, Shengjing Hospital of China Medical University, Shenyang, People’s Republic of China; 2Department of Pulmonary and Critical Care Medicine, Shengjing Hospital of China Medical University, Shenyang, People’s Republic of China
Correspondence: Dongmei Pei
Department of Health Management, Shengjing Hospital of China Medical University, No. 36, Sanhao Street, Heping District, Shenyang, 110004, People’s Republic of China
Email [email protected]
Background: Nonalcoholic fatty liver disease (NAFLD) is the commonest form of chronic liver disease worldwide and its prevalence is rapidly increasing. Screening and early diagnosis of high-risk groups are important for the prevention and treatment of NAFLD; however, traditional imaging examinations are expensive and difficult to perform on a large scale. This study aimed to develop a simple and reliable predictive model based on the risk factors for NAFLD using a decision tree algorithm for the diagnosis of NAFLD and reduction of healthcare costs.
Methods: This retrospective cross-sectional study included 22,819 participants who underwent annual health examinations between January 2019 and December 2019 at Physical Examination Center in Shengjing Hospital of China Medical University. After rigorous data screening, data of 9190 participants were retained in the final dataset for use in the J48 decision tree algorithm for the construction of predictive models. Approximately 66% of these patients (n=6065) were randomly assigned to the training dataset for the construction of the decision tree, while 34% of the patients (n=3125) were assigned to the test dataset to evaluate the performance of the decision tree.
Results: The results showed that the J48 decision tree classifier exhibited good performance (accuracy=0.830, precision=0.837, recall=0.830, F-measure=0.830, and area under the curve=0.905). The decision tree structure revealed waist circumference as the most significant attribute, followed by triglyceride levels, systolic blood pressure, sex, age, and total cholesterol level.
Conclusion: Our study suggests that a decision tree analysis can be used to screen high-risk individuals for NAFLD. The key attributes in the tree structure can further contribute to the prevention of NAFLD by suggesting implementable targeted community interventions, which can help improve the outcome of NAFLD and reduce the burden on the healthcare system.
Keywords: nonalcoholic fatty liver disease, J48 algorithm, decision tree, risk factors
Introduction
Nonalcoholic fatty liver disease (NAFLD) is a type of metabolic stress liver injury that is closely associated with insulin resistance and genetic susceptibility.1–3 If it is not managed early, it may progress to cirrhosis and liver cancer, which have a higher mortality.3 NAFLD is one of the commonest chronic liver diseases worldwide; approximately one-quarter of adults are affected by NAFLD. In the United States, the prevalence of adult NAFLD is 24.13% in 2015.4 In 2020, it was predicted that the prevalence of NAFLD will increase thereon at an annual rate of 0.5% in China.5 In recent years, the prevalence of fatty liver among younger patients is increasing. Among them, patients with NAFLD are more prone to severe cardiovascular and cerebrovascular diseases, which have high mortality and morbidity.6 Therefore, implementing population-based interventions for NAFLD prevention is an emergency; these interventions include early diagnosis of NAFLD, assistance of patients in modifying their lifestyle, and prescription of appropriate treatment.
The gold standard diagnostic method for NAFLD is liver tissue biopsy; however, it is not widely used in clinical practice because of its invasive nature, high technical requirements, and low patient acceptance.7,8 Biochemical criteria and imaging criteria (ultrasonography, computed tomography, and magnetic resonance imaging findings) are used in NAFLD diagnosis. However, imaging techniques are expensive and, therefore, not suitable for mass screening of asymptomatic individuals. Moreover, the accuracy of the imaging is subjective and rests on the operator’s assessment. Considering the ongoing coronavirus disease outbreak, the risk of infection should be minimized. Therefore, a simple, highly accurate, and non-invasive method should be developed to identify high-risk individuals for NAFLD.
There have been recent rapid advances in data mining techniques. Data mining is a practical branch of artificial intelligence that provides well defined and useful information on selecting, exploring, and modeling large amounts of data for the discovery of unknown patterns or relationships.9,10 Data mining includes the use of traditional and non-traditional statistical methods such as logistic regression and decision tree analysis. In this study, mining algorithms were used to study the patterns of NAFLD onset. Data mining can be used for screening high-risk patients for NAFLD because it allows the automated extraction of rules from large-scale data. It also assists in developing strategies for NAFLD prevention through education and counseling of high-risk individuals for NAFLD. Therefore, this study aimed to explore the feasibility of using common risk factors in screening patients for NAFLD and developing classifiers for NAFLD using exploratory data mining techniques.
Methodology
Study Population
Data of 22,819 adults who underwent annual health screening at Shengjing Hospital of China Medical University between January 2019 and December 2019 were obtained. This study was approved by the Ethics Committee of Shengjing Hospital of China Medical University (Institutional Review Board reference number: 2019PS089J). Of the 22,819 patients, 13,629 with (i) a mean alcohol consumption of >140 g/week for men and >70 g/week for women in the previous month, (ii) other specific diseases causing fatty liver, (iii) severe liver insufficiency, and (iv) missing data were excluded. Finally, 9190 patients were included in this study (Figure 1).
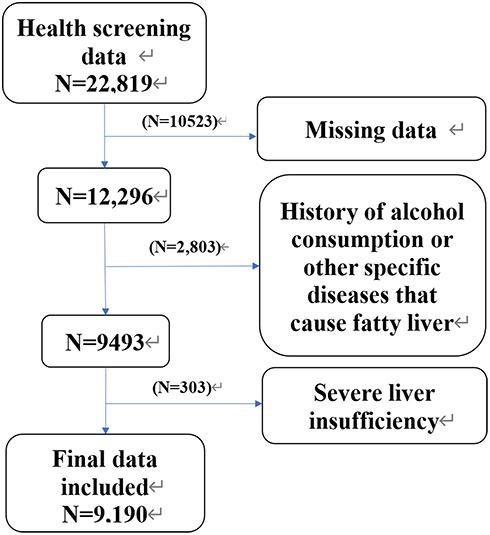 |
Figure 1 Flow chart of records that were excluded from the physical examination database. |
Selection of Variables in the Research Design
Six input variables from other predictive models of NAFLD or risk factor studies were selected for this study.11–13 The data collection process was as follows: ① Recording of healthy participants’ general conditions; ② Measurement of patients’ anthropometric indicators: the waist circumference was measured at the midpoint level of the line between the lower edge of the costal arch and iliac spine, and the average of two consecutive measurements accurate to 0.5 cm was considered; ③ Blood pressure measurement: blood pressure was measured three times with the patients at rest in one-minute intervals, and the average of the three measurements was calculated; ④ Blood biochemical tests: patients were prohibited from consuming food and water after 12:00 a.m. on the day of the physical examination, and venous blood was drawn at 8:00 a.m. Fasting blood glucose, triglyceride (TG), and total cholesterol (TC) levels were measured on the same day. All tests were performed using the same reagents and methods. The patients’ blood glucose level was measured using the glucose oxidation enzyme method, while the TG and TC levels were measured using the enzymatic method, which were performed by the laboratory staff members of Shengjing Hospital of China Medical University.
Diagnostic Criteria for NAFLD
The diagnostic criteria for NAFLD included patients 1) with a mean alcohol consumption of <140 g/week for men and <70 g/week for women in the previous month, 2) with negative hepatitis B serum antigen and/or anti-hepatitis C virus tests, 3) with a definite ultrasonography-based diagnosis of fatty liver, and 4) without other liver diseases, such as drug-related liver injury. The presence of at least two of the following ultrasonography findings was used for the primary diagnosis of NAFLD:1 (i) diffuse enhancement of near-field echoes in the liver, with echoes stronger than those in the kidneys, (ii) poor visualization of intrahepatic ductal structures, and (iii) progressive attenuation of far-field echoes in the liver. Abdominal ultrasonography was performed by experienced and uniformly trained ultrasonographers. The color Doppler ultrasound scanner model used was Philips iu22 linear array transducer, with a frequency range of 5–13 MHz.
Data Selection
Data mining algorithms, especially decision trees, are not good at processing data points with missing values. Therefore, records with missing variables must be removed from the dataset. Data of some patients were deleted: waist circumference (N = 8760, 38.3%), systolic blood pressure (N = 4689, 20.5%), TG level (N = 2589, 11.3%), and TC level (N = 421, 1.8%). After rigorous data screening, records of the remaining 9190 eligible participants were used for further analysis.
Choice of Decision Tree Algorithm
We applied five popular classifiers to train the dataset, including J48, AdaboostM1, SMO, Bayes Net, and Naïve Bayes. The performance results of all classifiers are shown in Table 1. Based on the favorable prediction results obtained from the runs, we chose the J48 algorithm. The J48 algorithm, which is capable of handling both continuous and discrete attributes, was used to construct the decision tree model, performed using WEKA software, version 3.8.1. The dependent variable (output variable), a binary categorical variable, was divided into two categories: 0 and 1, where 0 meant healthy and 1 meant having NAFLD. The independent variables (input variable) included age, waist circumference, sex (men=1, women=2), systolic blood pressure, TC level, and TG level; these were significant risk factors in the t-test or chi-square test.
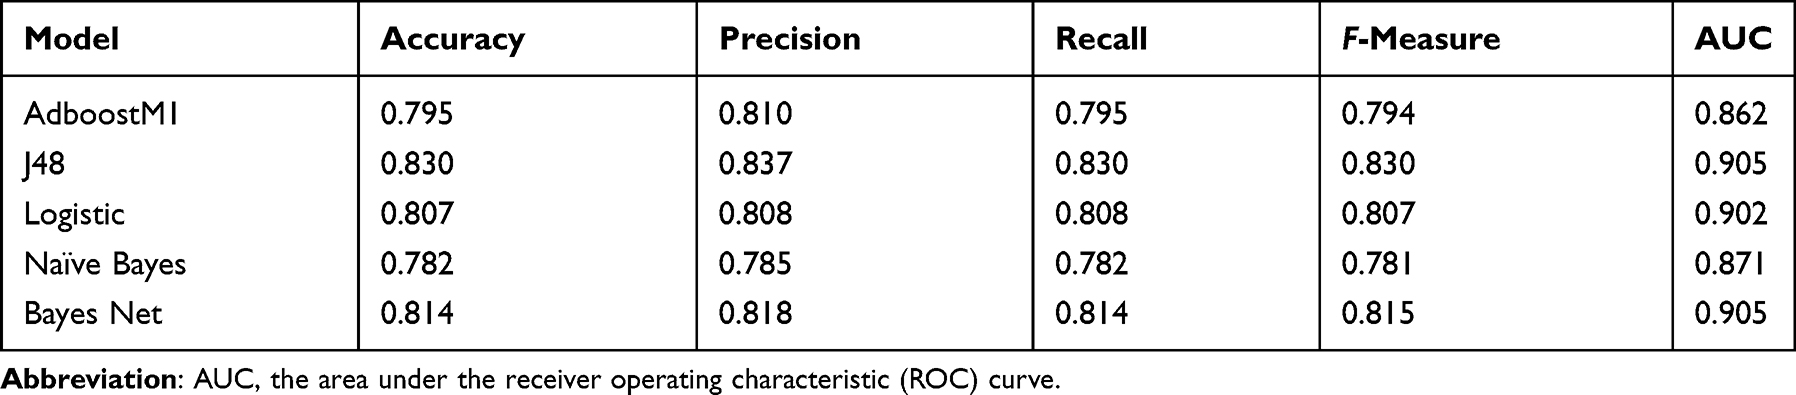 |
Table 1 The Results of Classification Algorithms. (Weighted Avg) |
In this study, the dataset was randomly divided into two groups: training dataset that contained the data of 66% of the participants (n=6065) and test dataset that contained the data of 34% of the participants (n=3125). The estimation model was constructed using data from the training dataset and then tested on the test dataset.14 The C4.5 algorithm can be used to construct a decision tree based on the characteristics of the data samples; the leaf nodes of the tree represent the specific categories obtained after classification, and the non-leaf nodes of the tree represent the attributes of the data; a path that forms from the root node to the leaf nodes is the classification rule. The essence of the algorithm is to generalize a set of classification rules from the training data; these classification rules are mutually exclusive and complete. To avoid overfitting and maintain parsimony, the model generated by the decision tree can be pruned by removing unimportant end branches according to the defined algorithm without affecting the classification accuracy.15
Model Evaluation
In this study, “patients with NAFLD” were defined as positive events, while “patients without NAFLD” were defined as negative events. True positives, true negatives, false positives, and false negatives were extracted separately using confusion matrices. Accuracy, precision, recall, F-measure, and area under the receiver operating characteristic curve (AUC) were used to evaluate the performance of these models. All variables were included in the descriptive statistical analysis. Quantitative data were expressed as  ±S, and the independent samples t-test was used to compare the two groups. Qualitative data were expressed as relative numbers, and the χ2 test was used to compare the two groups. A p value less than 0.05 was considered to be significant. All statistical analyses were performed using SPSS 19 statistical software. The subject characteristic curve (receiver operating characteristic [ROC] curve) was used to evaluate the predictive effect of each algorithm on NAFLD.
Results
Clinical Characteristics of the Study Participants
Data of 9190 patients (NAFLD: 4236 [46.09%]; healthy: 4954 [53.91%]). Clinical characteristics and test results of the participants in both groups are shown in Table 2. There were significant differences in age, waist circumference, sex, systolic blood pressure, TC level, and TG level between the two groups (p<0.05).
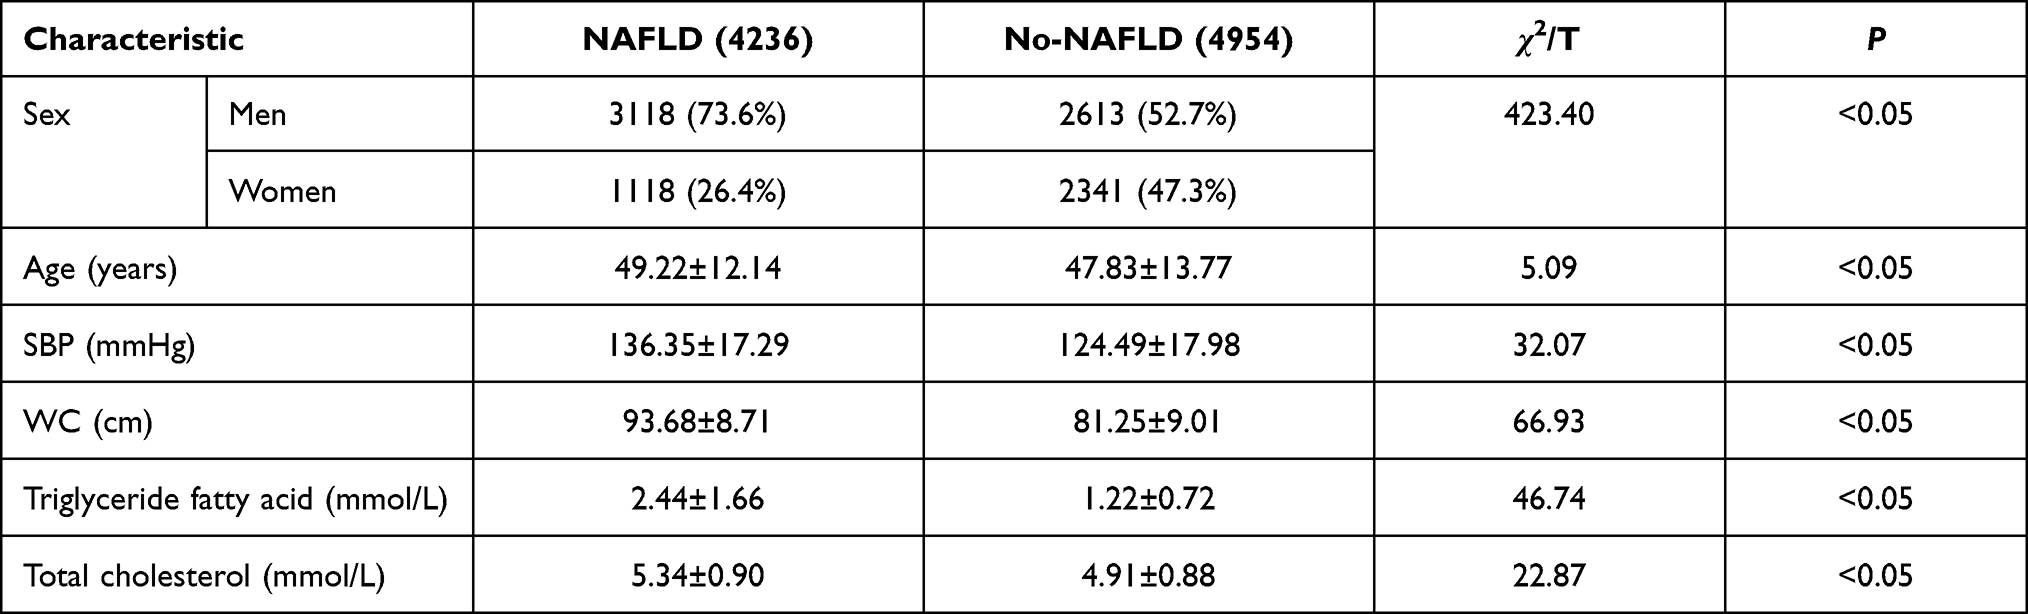 |
Table 2 Characteristics of Variables of the Study Participants |
Results of the Model
Data were divided into a training dataset (66% of the total, N=6065) and test dataset (the remaining 34%, N=3125). Six variables were used as input variables of the model. The accuracy of the model was further evaluated by performing a confusion matrix analysis on the test dataset (Class= NAFLD). The accuracy, precision, and recall of the model were evaluated. The results are shown in Table 3.
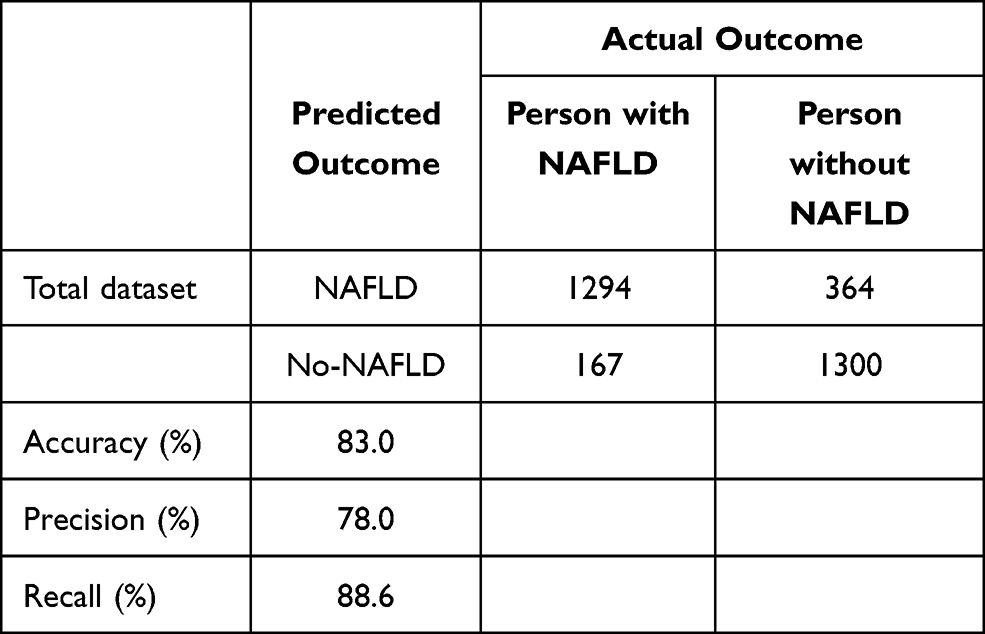 |
Table 3 Confusion Matrix of Test Dataset. (Class= NAFLD) |
The accuracy of the model was 83.0%. A total of 2594 of 3125 individuals were correctly classified, while 16.99% of 3125 individuals were incorrectly classified. The performance of all the classifiers is shown in Table 1. J48 showed better results than the other classifiers (accuracy=0.830, precision=0.837, recall=0.830, F-measure=0.830, and area under the curve=0.905). The ROC curves of all the classifiers are shown in Figure 2.
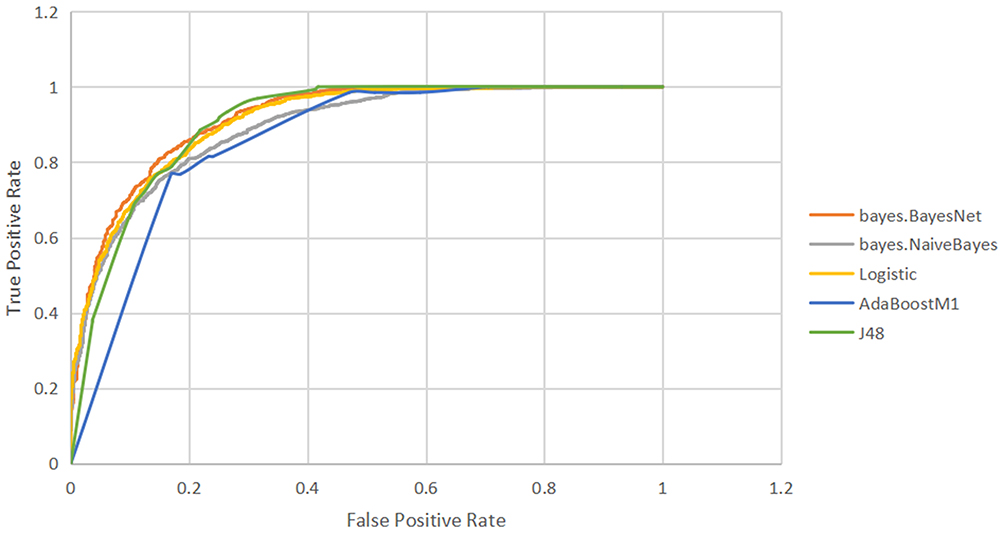 |
Figure 2 ROC curve of all algorithms. |
Decision Trees and Rules for Constructing Decision Trees
A decision tree with 22 nodes and 23 leaves was constructed using the J48 algorithm, and the results are shown in Figure 3. The decision tree structure showed that waist circumference was the most significant attribute, followed by TG level, systolic blood pressure, sex, age, and TC levels. The decision tree can be transformed into a set of IF-THEN rules by tracing the path from the root node to each terminal (leaf) node. The 22 IF-THEN rules created using the model are listed in Table 4. With the introduction of additional, highly correlated input variables for multiple segmentations, the decision column rules became more exhaustive. However, under similar situations, more unique interactions were observed between different input variables, more significant results were obtained, and the predictive values were good.
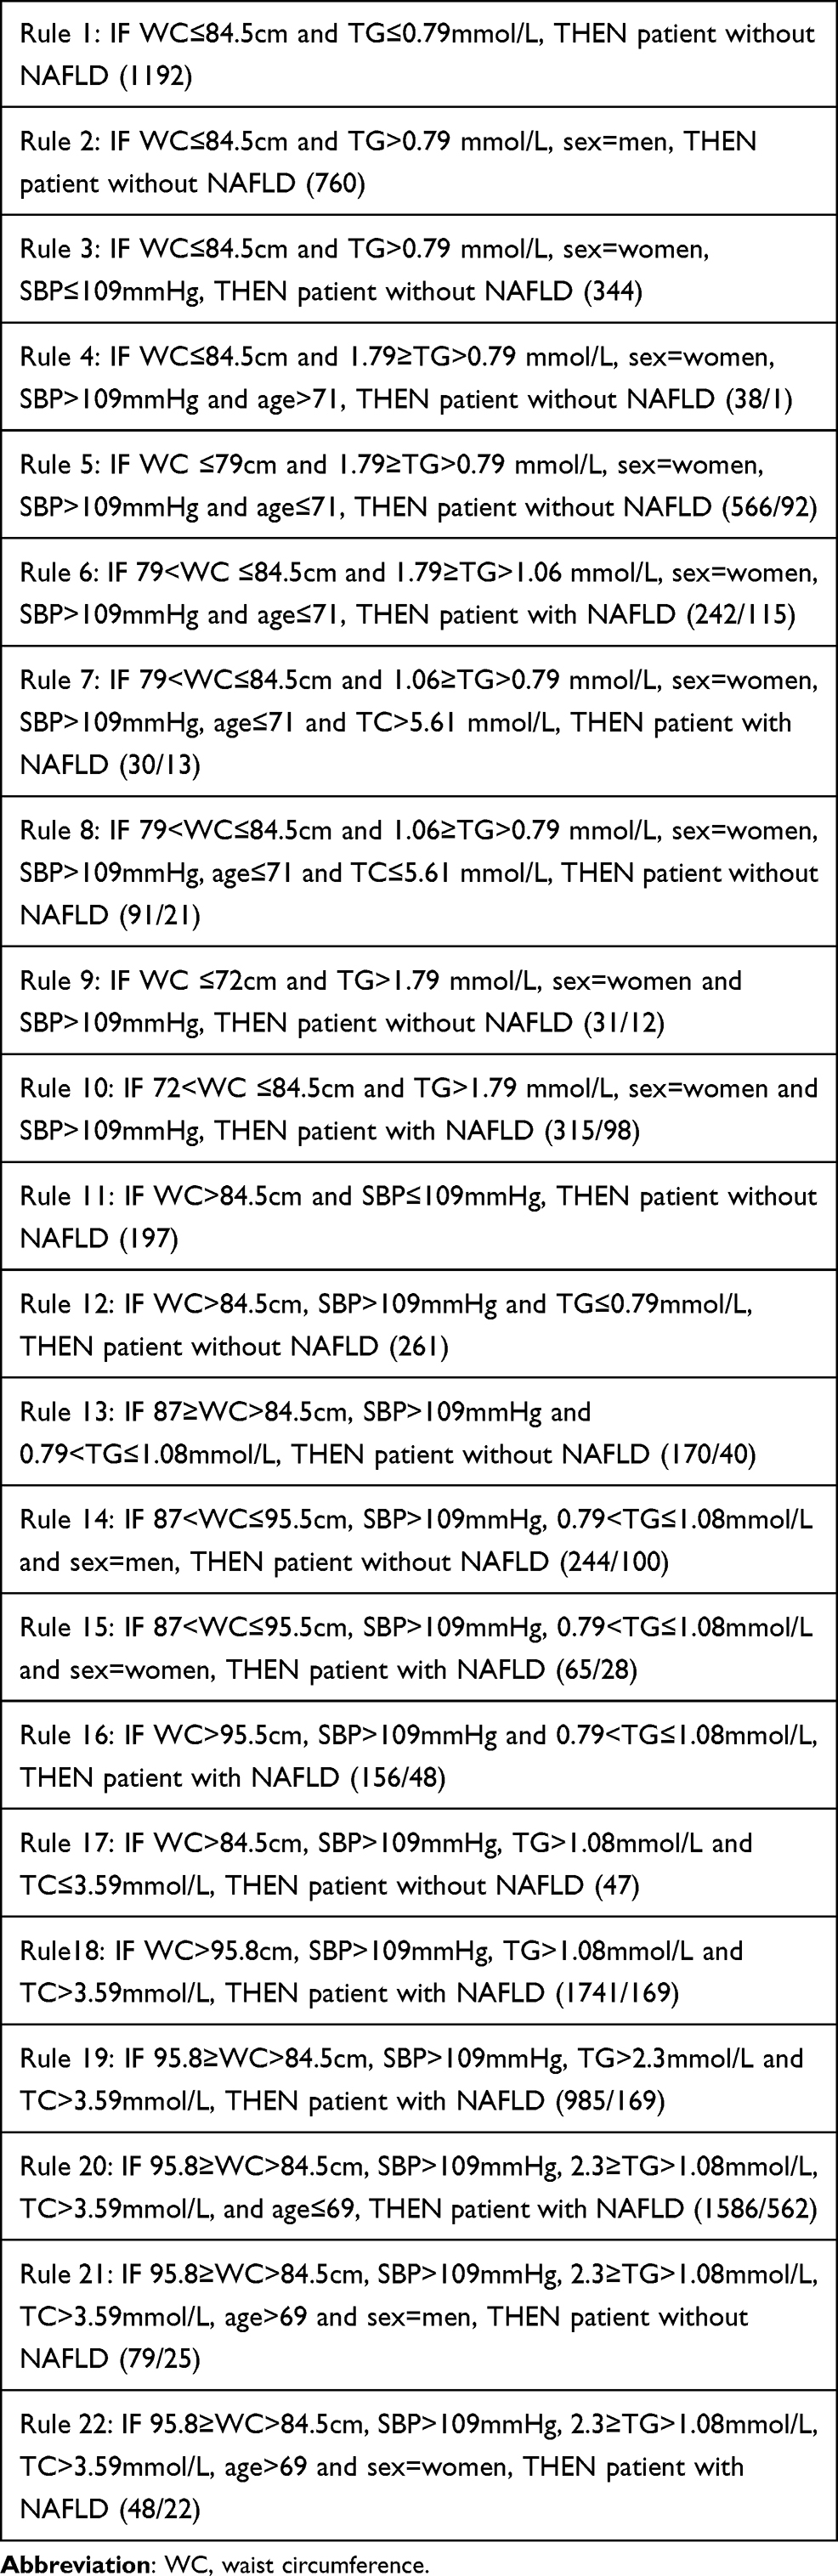 |
Table 4 A List of the 22 Rules Used for Constructing the Decision Tree |
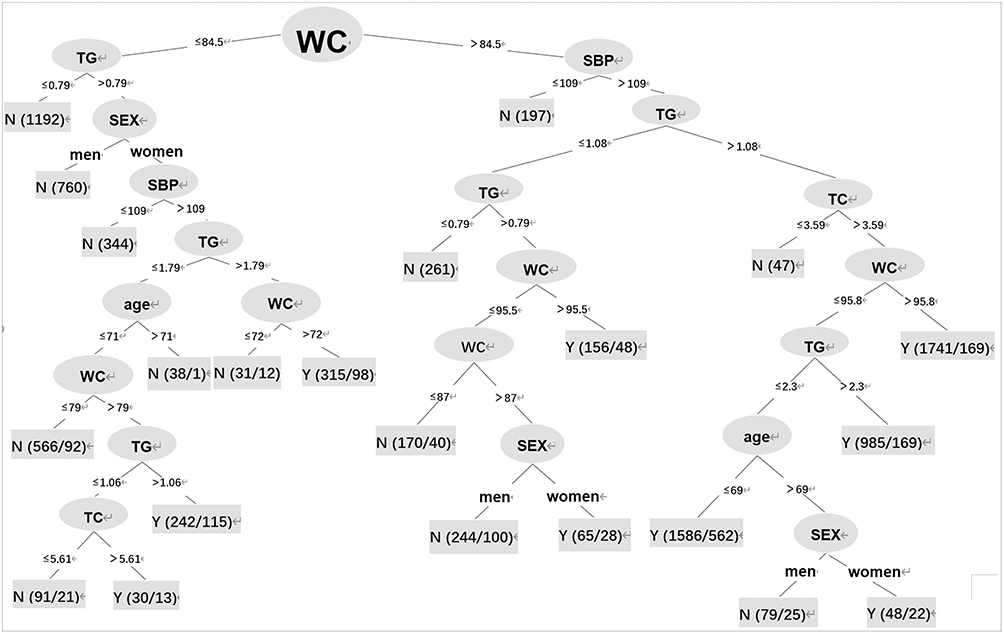 |
Figure 3 Decision tree of NAFLD classifiers. |
Discussion
In this study, a decision tree model for NAFLD screening was developed using data from a physically healthy population in northeastern China. Based on the model mined from the decision tree, waist circumference, TG level, systolic blood pressure, sex, age, and TC level were significant screening factors for NAFLD. Data on waist circumference, systolic blood pressure, sex, and age are easy to collect, and the devices used for measuring TC and TG levels are available and inexpensive. The aforementioned six indicators can be used to determine the high-risk groups among poor high-risk patients and in primary hospitals without liver imaging equipment.
In this study, five classification algorithms for the prediction of NAFLD were compared. Several evaluation metrics were used to determine the effectiveness of the classification algorithms on the WEKA data mining platform. Based on our findings, the J48 algorithm provided the best classification results on the NAFLD dataset. The J48 decision tree algorithm is widely valued and used for its advantages such as low computational load, easy-to-understand generated rules, ability to handle continuous and discrete attributes, automatic capture of multi-layer interactions between predictors, rule generation, and ease of interpretation and visualization.15,16 Decision trees are simple and can be used effectively in public health programs for early NAFLD screening and health interventions in future.17
In this study, the decision tree rules for NAFLD screening were constructed using a large sample of data from a physically healthy population; these data can be used in epidemiological screening activities of high-risk persons for NAFLD. The first variable in the tree (the root) is the most important factor, while consecutive variables that are distant from the root are considered secondary factors for data classification.15 The present study showed that waist circumference was the most important distinguishing factor for the presence/absence of NAFLD, followed by TG level, systolic blood pressure, sex, age, and TC level. The global prevalence of fatty liver is closely related to the rapidly increasing prevalence of obesity.18,19 Waist circumference is a convenient measure of abdominal obesity that correlates with abdominal fat volume and area.20 It is also an independent predictor of NAFLD severity and steatosis.21 Recent studies have reported a strong association between increased waist circumference and NAFLD risk.22 Based on these data, reducing one’s waist circumference can help in preventing NAFLD. This is a feasible community health care system intervention—several methods should be used to decrease the waist circumference in people with abdominal obesity.
Blood pressure has a significant impact on the development of NAFLD. In addition, it interacts with increased waist circumference. In a cross-sectional study of 5362 individuals,23 elevated blood pressure was found to be a risk factor for the ultrasound diagnosis of NAFLD. Moreover, the incidence of NAFLD was 30% higher in pre-hypertensive patients than in normotensive patients and up to 80% higher in patients with hypertension than in normotensive patients.
In this study, Rule 18 of the 22 rules showed that IF a patient had a waist circumference >95.8 cm, SBP >109 mmHg, TG level >1.08 mmol/L, and TC level >3.59 mmol/L, THEN the patient has NAFLD (1741/169). The accuracy was 90.3%. The introduction of waist circumference, TG level, cholesterol level, and systolic blood pressure as input variables into the algorithm ensured efficient detection of patients with NAFLD. The significance of this finding lies in that NAFLD can be prevented by reducing the risk factors and developing more cost-effective measures. The rules applied in our tree model construction suggest that reducing the waist circumference and controlling the lipid and blood pressure levels through lifestyle modification can decrease the prevalence of NAFLD.
Moreover, this is the first study investigating the screening method for NAFLD in people with a normal waist circumference. The left number branch in the decision tree diagram focuses on the screening rules for NAFLD when the waistline is less than 84.5 cm. For example, Rule 10 suggests that IF a person has 72< waist circumference ≤84.5 cm, TG level >1.79 mmol/L, SBP >109 mmHg, and is sex=woman, THEN the patient has NAFLD (315/98). In particular, it provides ideas for screening patients with NAFLD in women with a normal waist circumference. Although the classifier rule has a slightly lower diagnostic efficacy for screening NAFLD in people with a normal waist circumference, it is still cost-effective and useful for rapidly screening for NAFLD during community health services in developing countries.
This study has some limitations. First, only participants who underwent physical examinations in northern China were included; this limits the generalizability of the findings. Most participants were employees in enterprises and institutions or jobless people with stable financial statuses; therefore, the population constitution was limited, which may explain the higher prevalence in our study than in previous studies. Therefore, the results should be validated by including participants with different ethnicities and genetic backgrounds in future studies. Second, this study used ultrasonography as the gold standard technique for diagnosing NAFLD and not liver tissue biopsy. Liver tissue biopsy cannot be used on a large scale, unlike ultrasonography, which has a high degree of accuracy and is the most used method in population-based studies. Finally, the results of this retrospective cross-sectional study need to be validated in a large prospective study assessing the outcomes of some interventions such as reduction of waist circumference for NAFLD prevention.
Conclusion
We proposed the decision tree-based classification model that can help clinicians in developing countries at the grassroots level to rapidly screen patients for NAFLD. The key attributes of the decision tree can further contribute to the prevention of NAFLD by the implementation of targeted community interventions, improvement of NAFLD outcomes, and reduction of the burden on the healthcare system. More comprehensive and rigorous prospective studies should be conducted in the future to explore the sensitivity and specificity of waist circumference, blood pressure, and lipid levels on the early diagnosis and treatment of NAFLD.
Data Sharing Statement
The datasets used and analyzed in the present study could be available from the corresponding author upon reasonable request.
Ethics Approval and Consent to Participate
This human study was approved by Shengjing Hospital of China Medical University Ethics Committee (ref. Ethics 2019PS089J). It was a retrospective study with no direct intervention. All patient data were anonymized. The patients’ information and privacy were fully protected. Therefore, the institutional review board waived the need for written informed consent from the participants. This study complied with the Declaration of Helsinki.
Author Contributions
All authors made a significant contribution to the work reported, whether in the conception, study design, execution, acquisition of data, analysis, and interpretation or all; took part in drafting, revising or critically reviewing the article; gave final approval of the version to be published; agreed on the manuscript to be submitted; and agreed to be accountable for all aspects of the work.
Funding
This study was funded by China Medical Board under the grant number #15-219.
Disclosure
All authors declare that they have no conflicts of interests.
References
1. The Chinese National Workshop on Fatty Liver and Alcoholic Liver disease for the Chinese Liver Disease Association. Guidelines for management of nonalcoholic fatty liver disease: anupdated and revised edition. Chin J Hepatol. 2010;18:163–166.
2. Rinella ME. Nonalcoholic fatty liver disease: a systematic review. JAMA. 2015;313:2263–2273. doi:10.1001/jama.2015.5370
3. Diehl AM, Day C, Longo DL. Cause, pathogenesis, and treatment of nonalcoholic steatohepatitis. N Engl J Med. 2017;377(21):2063–2072. doi:10.1056/NEJMra1503519
4. Younossi ZM, Koenig AB, Abdelatif D, et al. Global epidemiology of nonalcoholic fatty liver disease-meta-analytic assessment of prevalence, incidence, and outcomes. Hepatology. 2016;64:73–84. doi:10.1002/hep.28431
5. Zhu JZ, Zhou QY, Wang YM, et al. Prevalence of fatty liver disease and the economy in China: a systematic review. World J Gastroenterol. 2015;21:5695–5706. doi:10.3748/wjg.v21.i18.5695
6. Lazo M, Hernaez R, Eberhardt MS, et al. Prevalence of nonalcoholic fatty liver disease in the United States: the third national health and nutrition examination survey, 1988–1994. Am J Epidemiol. 2013;178:38–45. doi:10.1093/aje/kws448
7. Wong VW, Chan WK, Chitturi S, et al. Asia-Pacific Working Party on non-alcoholic fatty liver disease guidelines 2017-part 1: definition, risk factors and assessment. J Gastroenterol Hepatol. 2018;33:70–85. doi:10.1111/jgh.13857
8. Sinn DH, Kang D, Jang HR, et al. Development of chronic kidney disease in patients with non-alcoholic fatty liver disease: a cohort study. J Hepatol. 2017;67:1274–1280. doi:10.1016/j.jhep.2017.08.024
9. Ekins S, Clark AM, Dole K, et al. Data mining and computational modeling of high-throughput screening datasets. Methods Mol Biol. 2018;1755:197–221.
10. Sumathi A, Meganathan S. Semi supervised data mining model for the prognosis of pre-diabetic conditions in type 2 diabetes mellitus. Bioinformation. 2019;15:875–882. doi:10.6026/97320630015875
11. Vilar-Gomez E, Chalasani N. Non-invasive assessment of non-alcoholic fatty liver disease: clinical prediction rules and blood-based biomarkers. J Hepatol. 2018;68:305–315. doi:10.1016/j.jhep.2017.11.013
12. Nabi O, Lacombe K, Boursier J, et al. Prevalence and risk factors of nonalcoholic fatty liver disease and advanced fibrosis in general population: the French Nationwide NASH-CO Study. Gastroenterology. 2020;159:791–793.e2. doi:10.1053/j.gastro.2020.04.048
13. Huang TD, Behary J, Zekry A. Non-alcoholic fatty liver disease: a review of epidemiology, risk factors, diagnosis and management. Intern Med J. 2020;50:1038–1047. doi:10.1111/imj.14709
14. Al-Turaiki I, Alshahrani M, Almutairi T. Building predictive models for MERS-CoV infections using data mining techniques. J Infect Public Health. 2016;9:744–748. doi:10.1016/j.jiph.2016.09.007
15. Ramezankhani A, Pournik O, Shahrabi J, et al. Applying decision tree for identification of a low risk population for type 2 diabetes. Tehran Lipid and Glucose Study. Diabetes Res Clin Pract. 2014;105:391–398. doi:10.1016/j.diabres.2014.07.003
16. Kammerer JS, McNabb SJ, Becerra JE, et al. Tuberculosis transmission in nontraditional settings: a decision-tree approach. Am J Prev Med. 2005;28:201–207. doi:10.1016/j.amepre.2004.10.011
17. Yoo I, Alafaireet P, Marinov M, et al. Data mining in healthcare and biomedicine: a survey of the literature. J Med Syst. 2012;36:2431–2448. doi:10.1007/s10916-011-9710-5
18. Polyzos SA, Kountouras J, Mantzoros CS. Obesity and nonalcoholic fatty liver disease: from pathophysiology to therapeutics. Metabolism. 2019;92:82–97. doi:10.1016/j.metabol.2018.11.014
19. Softic S, Kahn CR. Fatty liver disease: is it nonalcoholic fatty liver disease or obesity-associated fatty liver disease. Eur J Gastroenterol Hepatol. 2019;31:143. doi:10.1097/MEG.0000000000001279
20. Pouliot MC, Després JP, Lemieux S, et al. Waist circumference and abdominal sagittal diameter: best simple anthropometric indexes of abdominal visceral adipose tissue accumulation and related cardiovascular risk in men and women. Am J Cardiol. 1994;73:460–468. doi:10.1016/0002-9149(94)90676-9
21. Clouston AD, Powell EE. Nonalcoholic fatty liver disease: is all the fat bad. Intern Med J. 2004;34:187–191. doi:10.1111/j.1444-0903.2004.00574.x
22. Rocha R, Cotrim HP, Carvalho FM, et al. Body mass index and waist circumference in non-alcoholic fatty liver disease. J Hum Nutr Diet. 2005;18:365–370. doi:10.1111/j.1365-277X.2005.00634.x
23. Aneni EC, Oni ET, Martin SS, et al. Blood pressure is associated with the presence and severity of nonalcoholic fatty liver disease across the spectrum of cardiometabolic risk. J Hypertens. 2015;33:1207–1214. doi:10.1097/HJH.0000000000000532
 © 2021 The Author(s). This work is published and licensed by Dove Medical Press Limited. The full terms of this license are available at https://www.dovepress.com/terms.php and incorporate the Creative Commons Attribution - Non Commercial (unported, v3.0) License.
By accessing the work you hereby accept the Terms. Non-commercial uses of the work are permitted without any further permission from Dove Medical Press Limited, provided the work is properly attributed. For permission for commercial use of this work, please see paragraphs 4.2 and 5 of our Terms.
© 2021 The Author(s). This work is published and licensed by Dove Medical Press Limited. The full terms of this license are available at https://www.dovepress.com/terms.php and incorporate the Creative Commons Attribution - Non Commercial (unported, v3.0) License.
By accessing the work you hereby accept the Terms. Non-commercial uses of the work are permitted without any further permission from Dove Medical Press Limited, provided the work is properly attributed. For permission for commercial use of this work, please see paragraphs 4.2 and 5 of our Terms.