")
Back to Journals » Risk Management and Healthcare Policy » Volume 13
Estimation of Generalized Impact Fraction and Population Attributable Fraction of Hypertension Based on JNC-IV and 2017 ACC/AHA Guidelines for Cardiovascular Diseases Using Parametric G-Formula: Tehran Lipid and Glucose Study (TLGS)
Authors Saatchi M, Mansournia MA , Khalili D , Daroudi R, Yazdani K
Received 9 June 2020
Accepted for publication 21 July 2020
Published 5 August 2020 Volume 2020:13 Pages 1015—1028
DOI https://doi.org/10.2147/RMHP.S265887
Checked for plagiarism Yes
Review by Single anonymous peer review
Peer reviewer comments 2
Editor who approved publication: Professor Marco Carotenuto
Mohammad Saatchi,1 Mohammad Ali Mansournia,1 Davood Khalili,2 Rajabali Daroudi,3 Kamran Yazdani1
1Department of Epidemiology and Biostatistics, School of Public Health, Tehran University of Medical Sciences, Tehran, Iran; 2Prevention of Metabolic Disorders Research Center, Research Institute for Endocrine Sciences, Shahid Beheshti University of Medical Sciences, Tehran, Iran; 3Department of Health Management and Economics, School of Public Health, Tehran University of Medical Sciences, Tehran, Iran
Correspondence: Kamran Yazdani
Department of Epidemiology and Biostatistics, School of Public Health, Tehran University of Medical Sciences, P.O. Box 644614155, Tehran, Iran
Tel +98 912 297 9264
Email [email protected]
Purpose: An area of interest to health policymakers is the effect of interventions aimed at risk factors on decreasing the number of new cardiovascular disease (CVD) cases. The aim of this study was to estimate the generalized impact fraction (GIF) and population attributable fraction (PAF) of hypertension (HTN) for CVD in Tehran.
Patients and Methods: In this population-based cohort study, 8071 participants aged ≥ 30 years were followed for a median of 16 years. A survival model was used to estimate the 10- and 18-year risk of CVD. JNC-IV and 2017 ACC/AHA guidelines were used to categorize blood pressure (BP). PAF and GIF were estimated in different scenarios using the parametric G-formula.
Results: Of 7378 participants included in analyses, 22.7% and 52.3% were classified as hypertensive according to the JNC-IV and 2017 ACC/AHA guidelines, respectively. According to the 2017 ACC/AHA, the 10-year risk of CVD was 5.1% (4.3– 6.0%), 8.9% (6.7– 12.0%), and 7.1% (6.1– 8.4%) for normal BP, elevated BP, and stage 1 HTN, respectively, and 20.8% (18.8– 23.0%) for stage 2 of the 2017 ACC/AHA and JNC-IV. The PAF of stage 2 vs stage 1 and vs normal BP for CVD was 17.4% (11.5– 21.8%) and 20.4% (14.6– 26.4%), respectively. The GIF of 30% reduction in the prevalence of stage 2 HTN to stage 1 and to normal BP for CVD was 5.1% (3.4– 6.6%) and 6.1% (4.4– 8.0%), respectively. Based on JNC-IV, the PAF and GIF of 30% for CVD were 17.8% (12.7– 22.9%) and 5.4% (4.0– 6.9%), respectively.
Conclusion: By reducing the prevalence of HTN by 30%, a remarkable number of new CVD cases would be prevented. In an Iranian population, the comparison of HTN cases with normal BP showed no association between stage 1 HTN and CVD, whereas elevated BP was a significant risk factor for the incidence of CVD.
Keywords: generalized impact fraction, GIF, population attributable fraction, PAF, hypertension, cardiovascular diseases, 2017 ACC/AHA guidelines, parametric G-formula
Introduction
According to the 2003 Seventh Report of the Joint National Committee (JNC-7), the prevalence of hypertension (HTN) (ie systolic blood pressure [SBP] ≤140 or diastolic blood pressure [DBP] ≥90) is reported to be 26.6% in Iran (2007–2011),1 29% in the US (2007–2010), 30% in England (2006), and 19.5% in Canada (2007–2009).2 Using 2017 American College of Cardiology/American Heart Association (2017 ACC/AHA) guidelines for defining HTN (SBP ≥130 or DBP ≥80),3 this prevalence increased dramatically from 12.6% to 42.7% (2012–2015)4 in Tehran and from 28.0% to 47.9% in South Korea (2014).5
An area of interest to health policymakers is the effect of interventions aimed at risk factors on decreasing the number of new CVD cases. The population attributable fraction (PAF) and generalized impact fraction (GIF), both of which are affected by the prevalence of risk factors as well as the strength of association between the risk factors and the disease, estimate the disease risk in the population in case of “complete removal” and “partial reduction” of the exposure, respectively.6–8
The rigors of complete removal of the risk factors as well as the drawbacks of classic methods limit the application of these measures for policymaking.9,10 To estimate biased-free PAF and GIF, the use of causal methods, especially model-based standardization (MBS), is suggested.11,12 The parametric G-formula is an MBS method for the unbiased estimation of the effect of interventions on disease reduction based on time-fixed and time-varying confounder approaches, using proper models.13–15 The purpose of the present study was to estimate the GIF and PAF of HTN for CVD in Tehran base on JNC-IV and 2017 ACC/AHA guidelines using the parametric G-formula.
Patients and Methods
Study Design and Participants
The details of the study design have been published elsewhere.16 In brief, Tehran Lipid and Glucose Study (TLGS) is a prospective cohort population-based study of the risk factors of non-communicable diseases (NCDs) in Tehran, district 13, that has been ongoing since 1999. In the first phase (cross-sectional), 15,005 people aged ≥3 years were recruited from February 1999 to August 2001 through applying the multistage random sampling method. The baseline, clinical, and laboratory data of 8071 participants aged ≥30 years from the first phase were used. The follow-up data in the sixth phase (2015–2018) including CVD events (CHD or stroke) and follow-up time was also used. At baseline, participants with CVD, a positive history of CHD or stroke, and missing data were excluded (Figure 1).
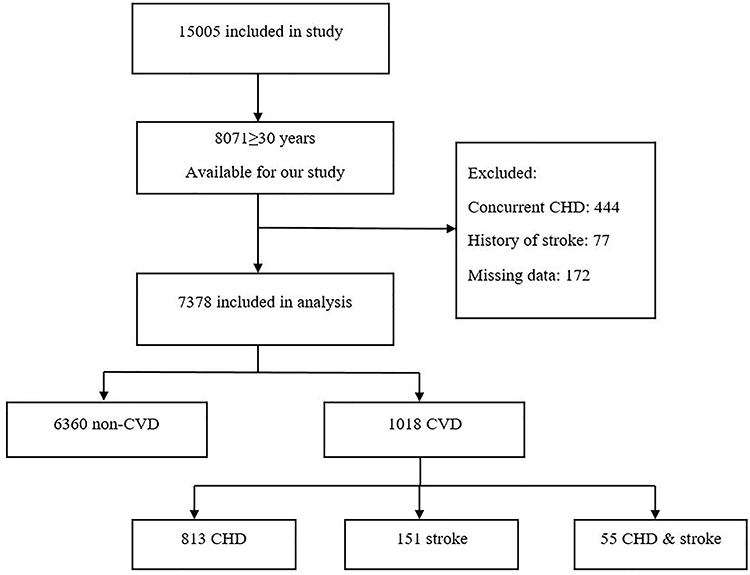 |
Figure 1 Flowchart of participant selection and follow-up data in TLGS (1999–2018). |
This article is part of a PhD dissertation in epidemiology at Tehran University of Medical Sciences; its proposal was approved by the Ethics Committee of the School of Public Health (ID: IR.TUMS.SPH.REC.1398.156). Moreover, the protocol for TLGS was approved by the Research Ethics Committee of the Research Institute for Endocrine Sciences (RIES), Shahid Beheshti University of Medical Sciences. This study was conducted in accordance with the Declaration of Helsinki. Written informed consent was obtained from all participants, and all data were anonymous and used only in the present study.
Clinical and Laboratory Measurements
The different categories of CVD-related factors used in this study and measured in the first phase of TLGS are defined in Table 1. BP was measured twice at intervals of at least 30 s with the patient in the sitting position after a 15-min rest and averaged as SBP and DBP. The JNC-IV and 2017ACC/AHA guidelines were used to define normal BP and HTN.
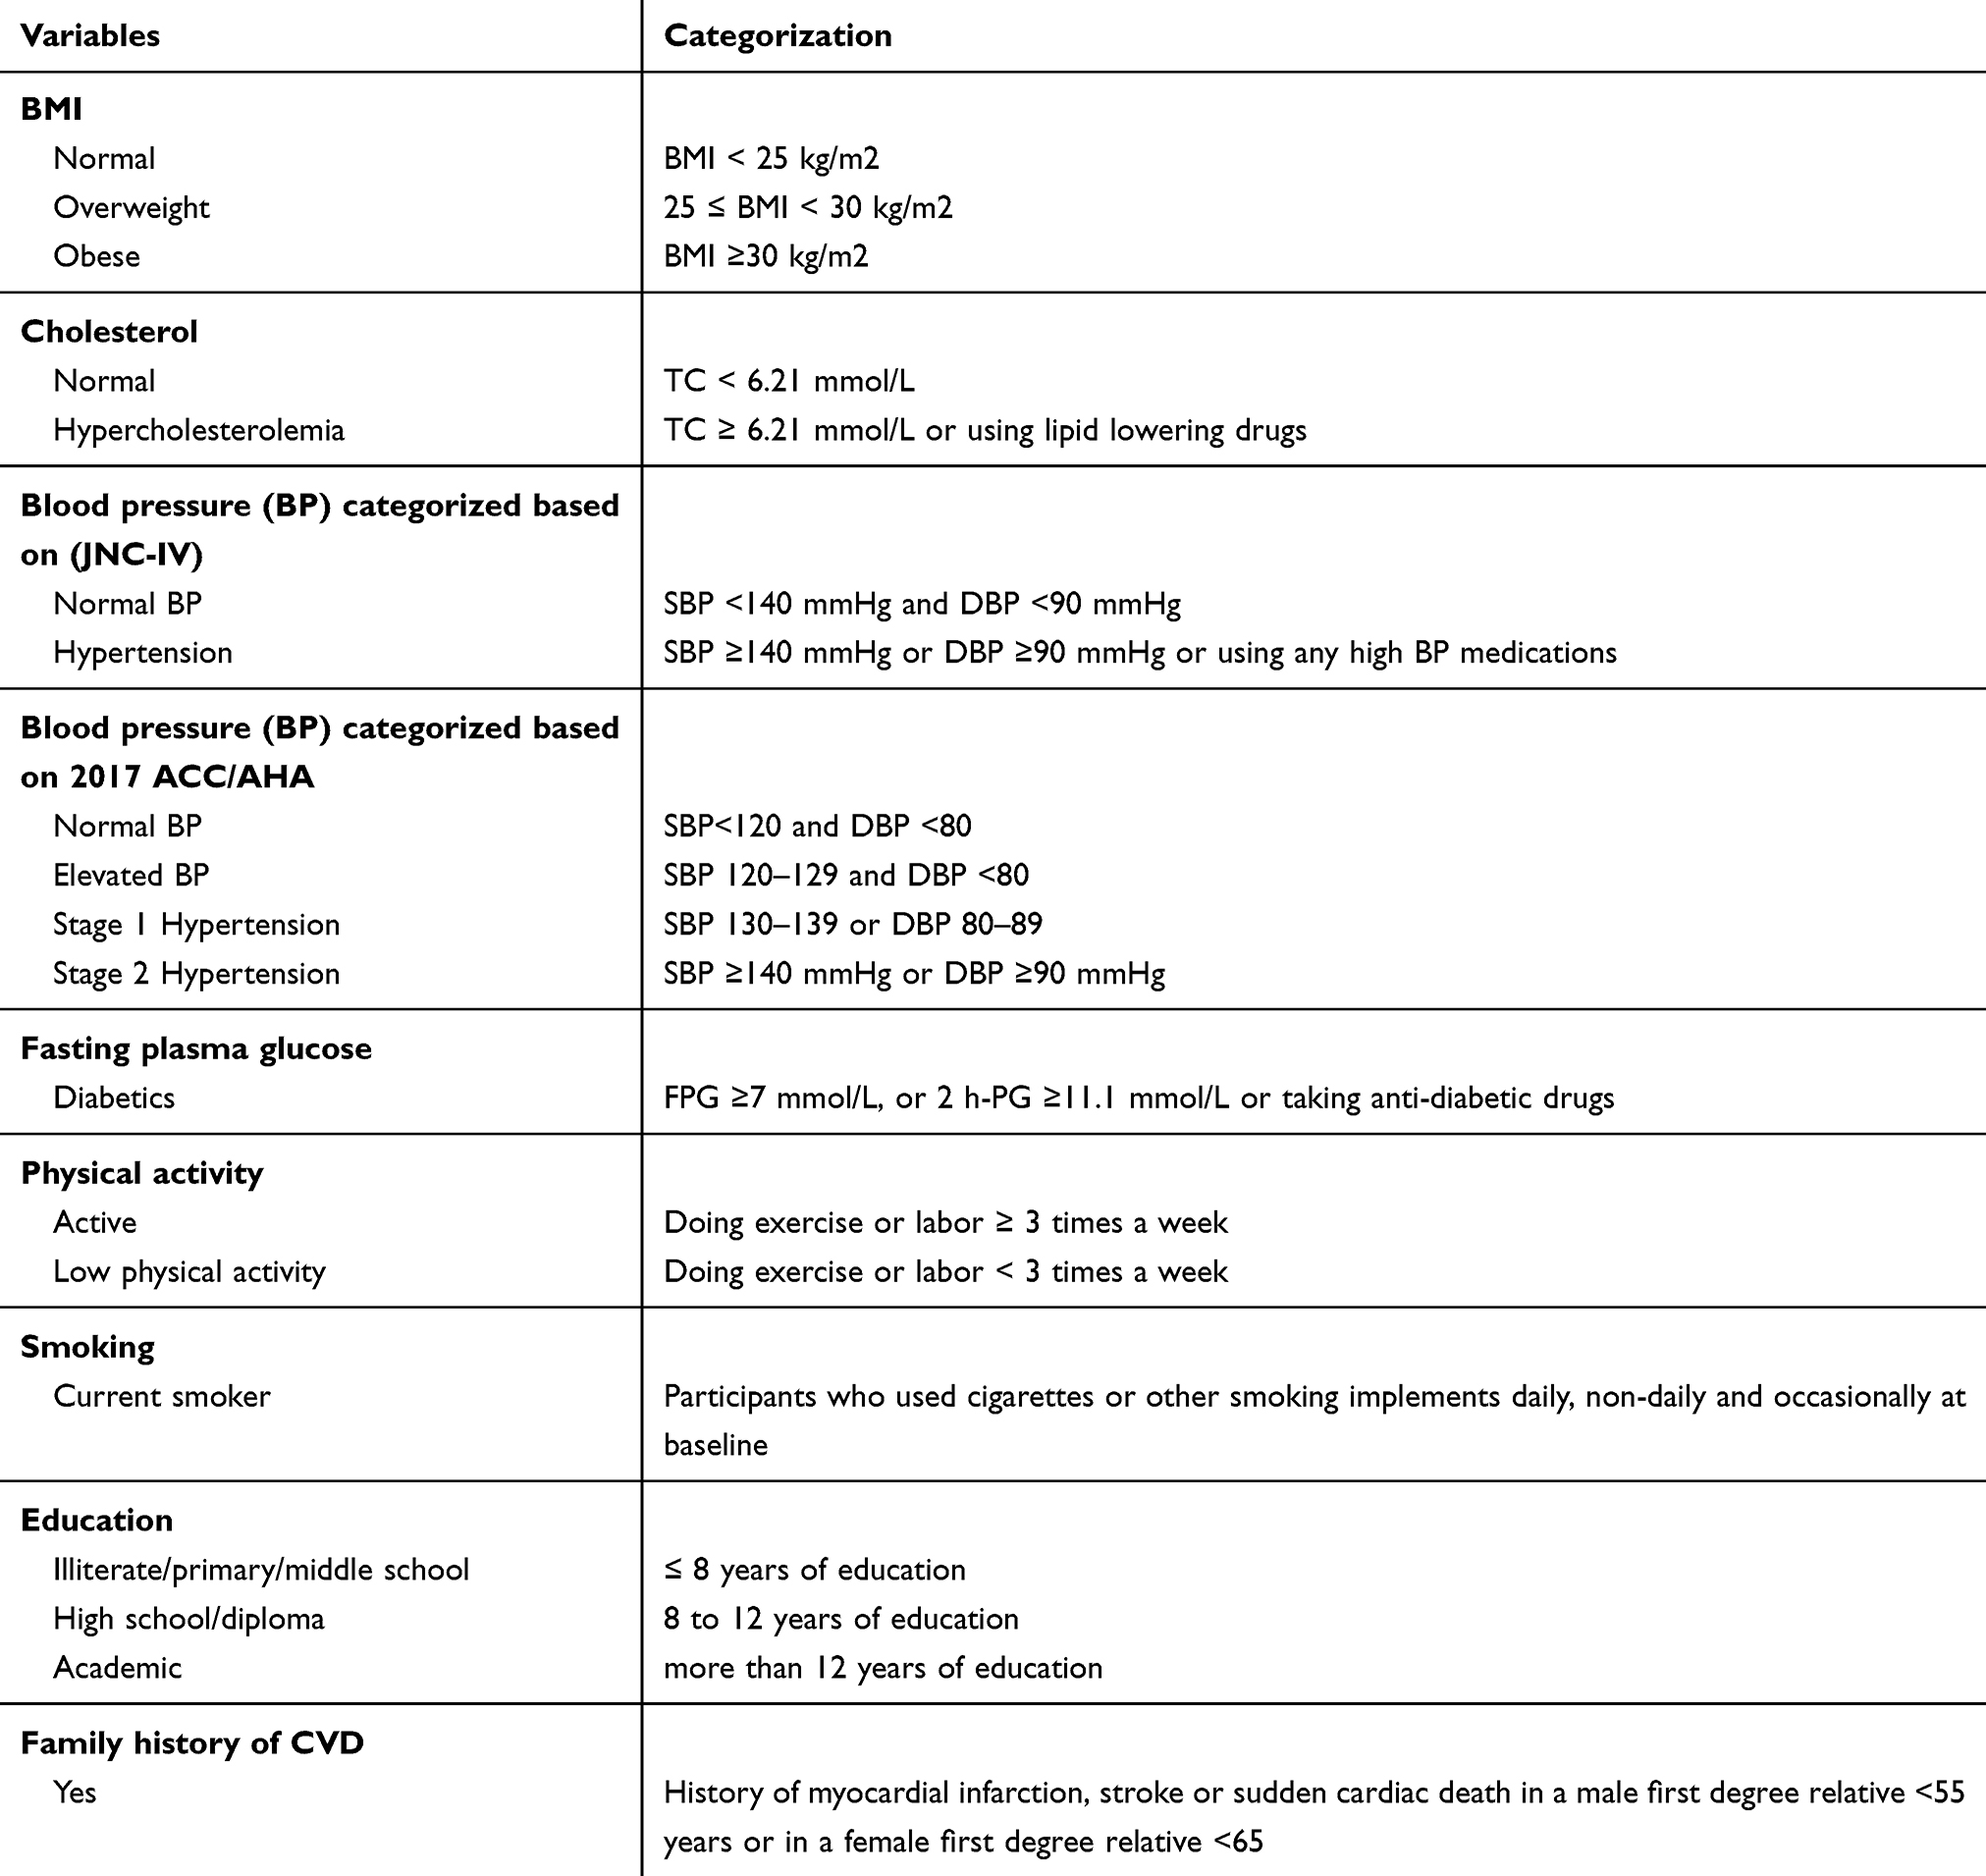 |
Table 1 Definition of Related Factors of Cardiovascular Disease in TLGS |
The participants were followed up annually for any CVD events during the past year by trained nurses through phone calls; in case of any events, required data were collected by a trained physician through home visits or reviewing hospital records, and ultimately, the diagnosis was confirmed by the Cohort Outcome Panel. Myocardial infarction (MI), probable MI, unstable angina pectoris, and angiography proven CAD were considered as CHD. Stroke was defined as all cases of definite or possible stroke based on the World Health Organization’s definition.17 Stroke or CHD was considered as CVD, and the time of first occurrence of stroke or CHD was considered as time to event.
Hypothetical Interventions
Table 2 presents different hypothetical intervention scenarios to reduce 30%, 50%, 70%, and 100% of the prevalence of HTN according to the JNC-IV and 2017 ACC/AHA guidelines and decrease the risk of CVD, CHD, and stroke. Theoretical minimum risk level or a 100% reduction in the prevalence of HTN was considered as PAF, and other scenarios estimated the GIF index. The basis for GIF estimation to reduce the prevalence of HTN by 30% was the World Health Organization’s objective for the prevention of NCDs in Iran by 2025 (plausible minimum risk level).18 The logic for estimating other GIFs was the effect of preventive interventions on reducing the prevalence of HTN resulting from other studies in other populations (feasible minimum risk level). PAF and GIF were calculated based on the comparison of higher and lower levels in all scenarios. Age-specific (≤60 years vs ≥60 years) and sex-specific GIF and PAF were estimated in all scenarios.
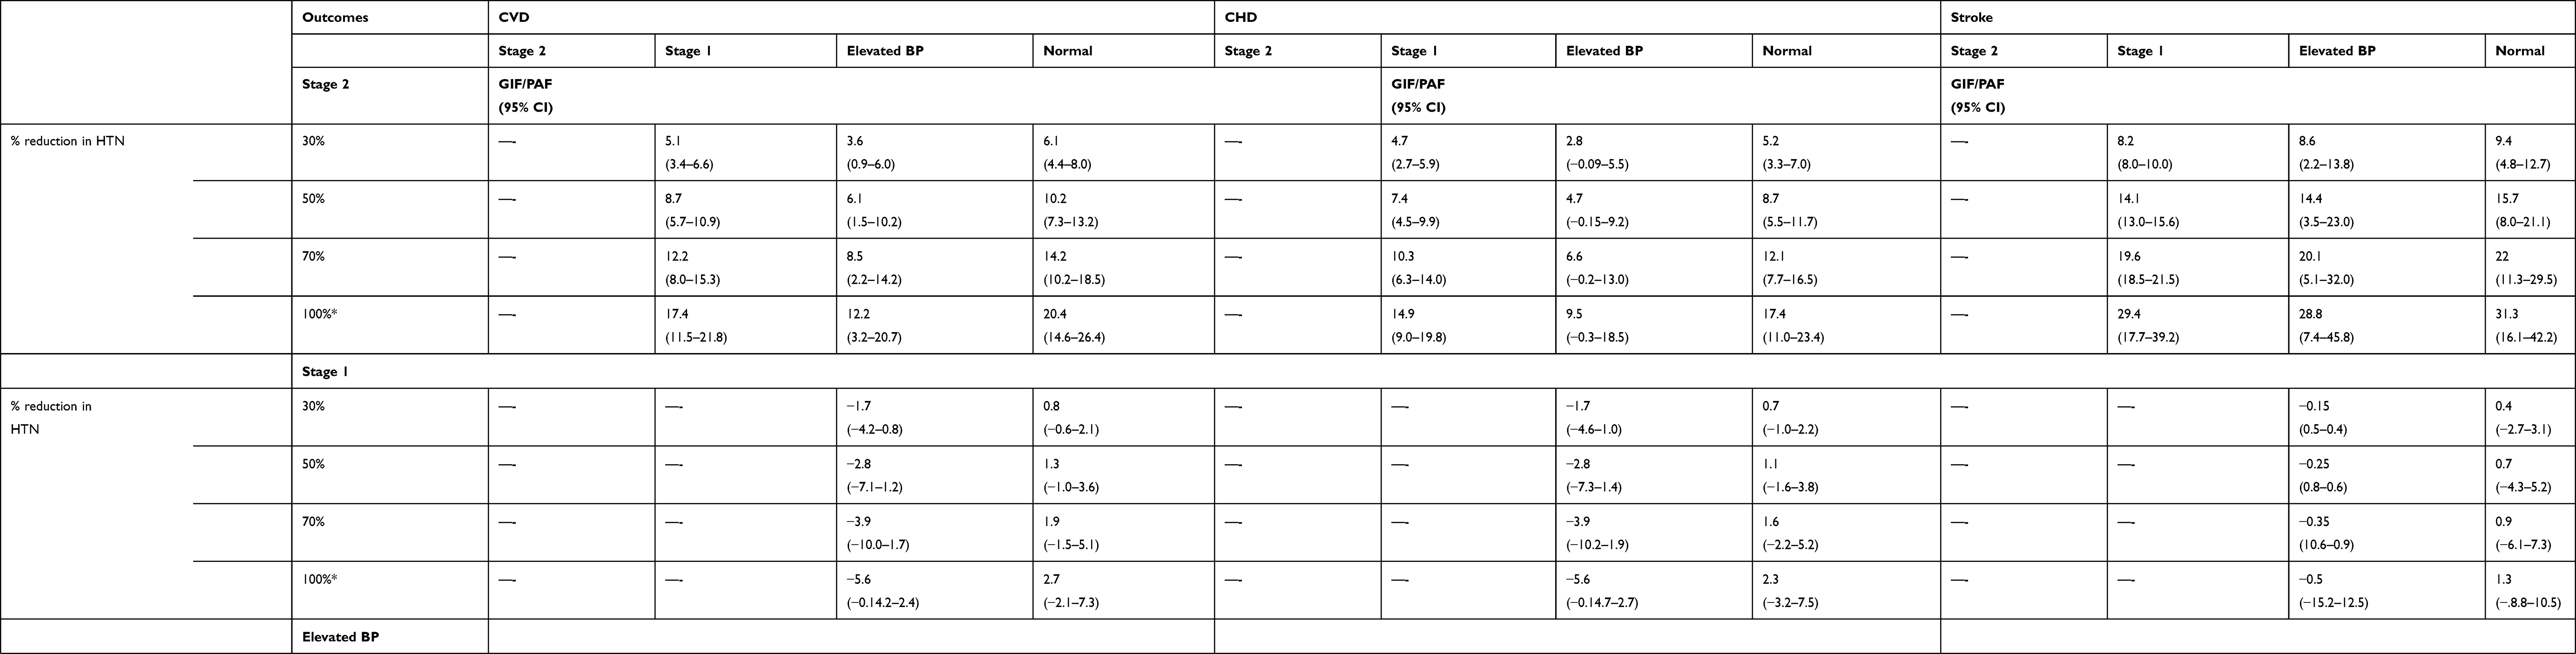 |
Table 2 PAF and GIF for CVD, CHD and Stroke by BP Categories |
Statistical Analyses
The baseline characteristics of the participants are summarized and reported as mean (SD) and frequency (percentage) for continuous and categorical variables, respectively. Chi-square, one-way analysis of variance (ANOVA), and independent t-test were used to analyze the variables. The 10- and 18-year risk and incidence rates of stroke, CHD, and CVD and their 95% confidence intervals (95% CIs) were calculated using the survival model. The hazard ratio (HR) and 95% CI of each outcome of interest for HTN was estimated using the Cox proportional hazards models.
PAF and GIF were estimated in three steps using the parametric G-formula model. In the first step, CVD, CHD, and stroke were modeled based on HTN and all confounding variables using a multivariable logistic regression analysis. Next, the probability of an outcome for each person was projected and the number of observed cases (Ocases) was calculated by totaling the probabilities. In the second step, a pseudo-population was generated and the prevalence of HTN was set to zero for PAF estimates. To compute GIF, 30%, 50%, and 70% of hypertensive patients were randomly selected, and their HTN status was changed to normal BP (SBP <140 and DBP <90) or to lower levels based on both JNC and 2017 ACC/AHA classifications.
The predicted outcome probabilities of all individuals were totaled to estimate the expected number of cases (Ecases) (Equation 1).

In the third step, PAF or GIF was calculated using Equation 2:

According to the three steps, a GIF of 1% and a proportional relationship between every 1% reduction in HTN prevalence and PAF/GIF were estimated.
Age-specific and sex-specific PAF and GIF of HTN for the outcomes of interest were computed. Non-parametric bootstrap methods were used in 2000 resamples with replacement to estimate 95% uncertainty intervals. All analyses were performed using STATA software version 14 (Stata Corp LP Texas, USA).
Results
The prevalence of HTN based on the JNC-IV and 2017 ACC/AHA guidelines as well as the baseline characteristics in the levels of BP is shown in Table 3. The prevalence of HTN (JNC-IV) and similarly stage 2 HTN (2017 ACC/AHA) was 22.7% (95% CI: 21.7–23.6%).
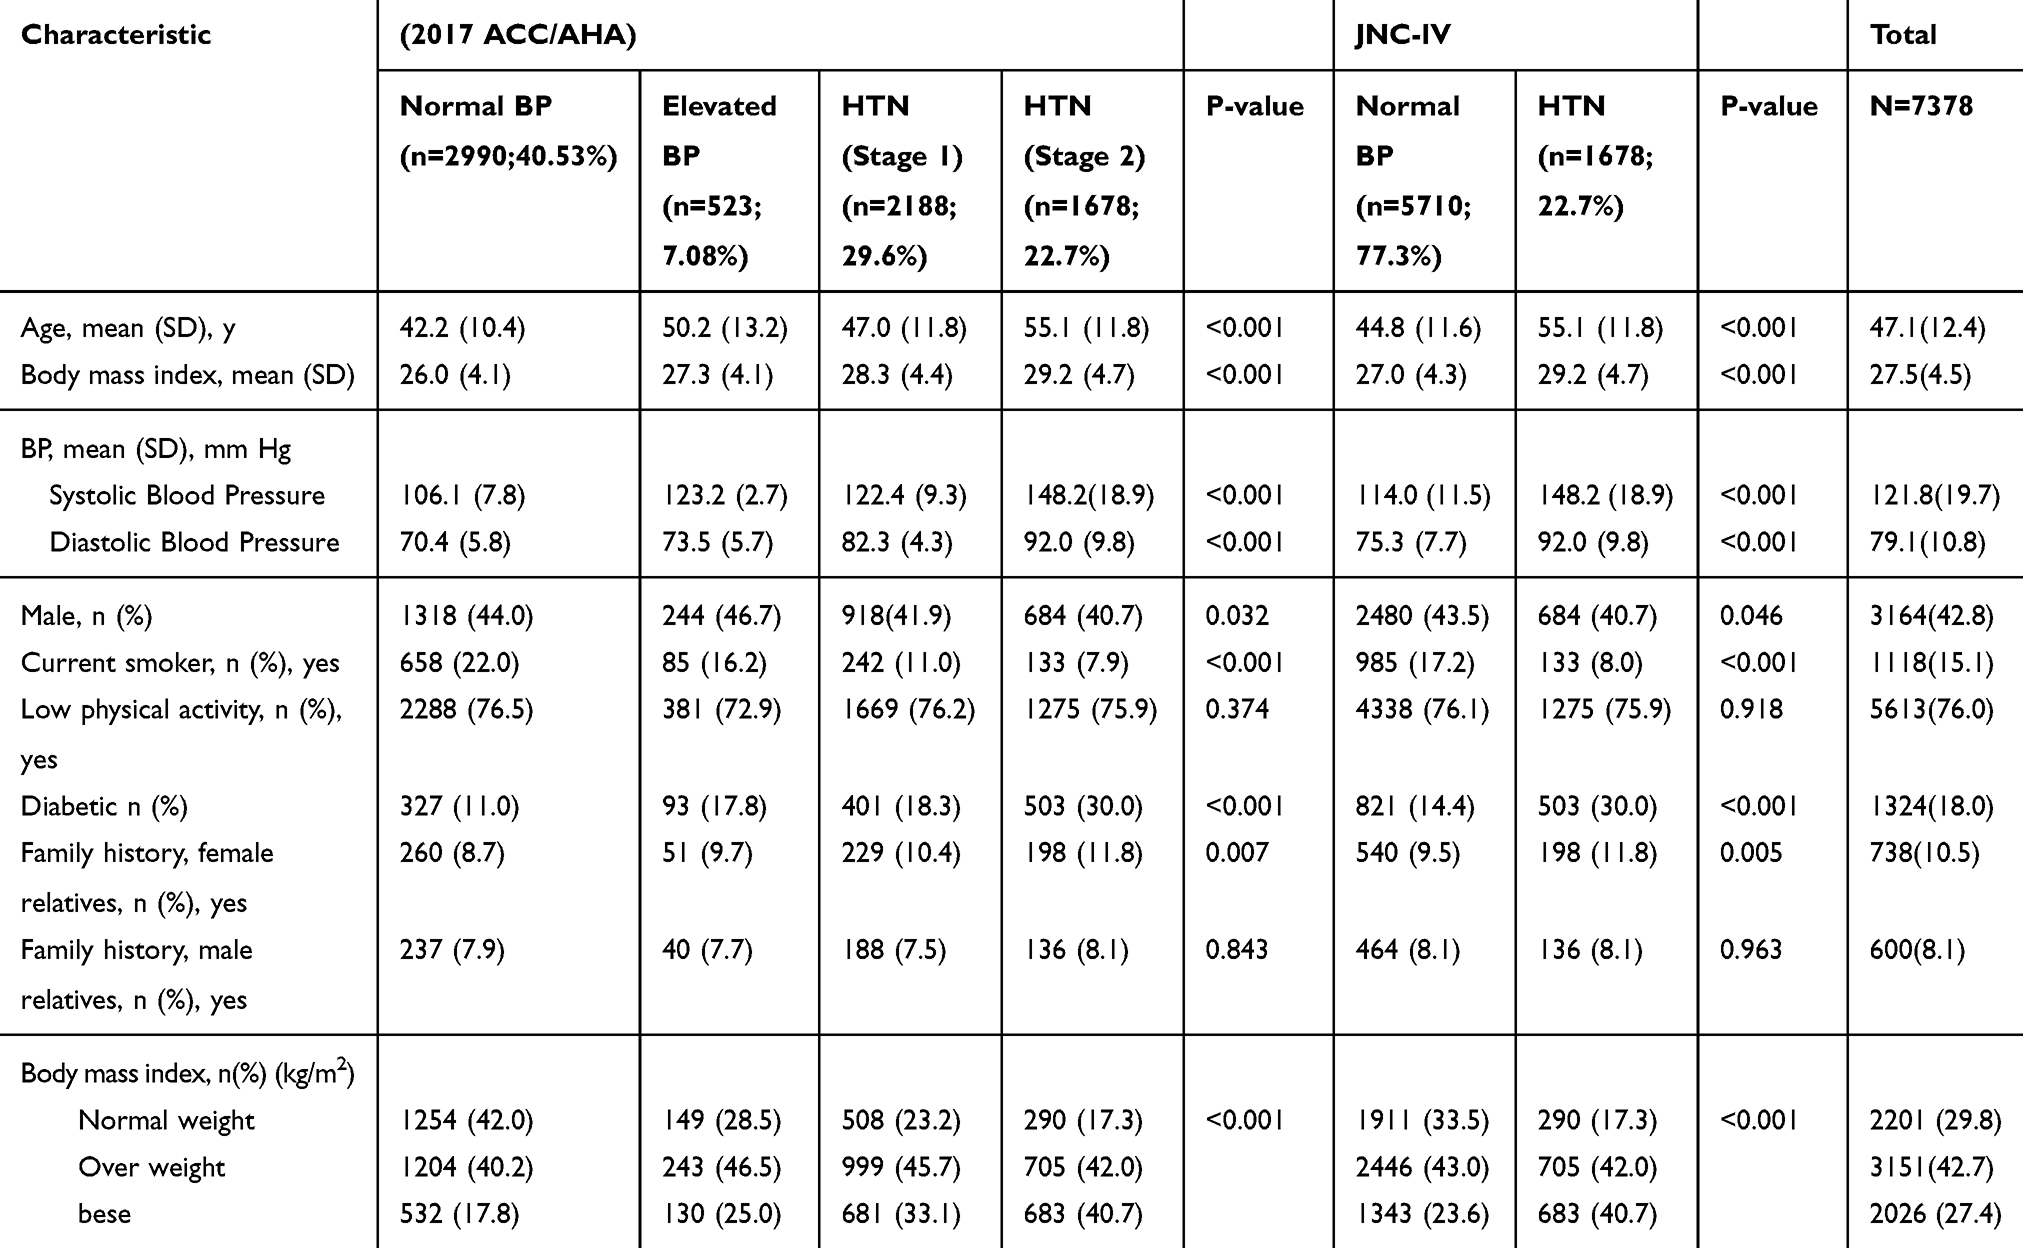 |
Table 3 Baseline Characteristics of TLGS Study Participants by BP Category |
The 10- and 18-year risk, incidence rate, and adjusted HRs for the outcomes of interest with median follow-up times of about 9 and 16 years based on the two guidelines are shown in Table 4.
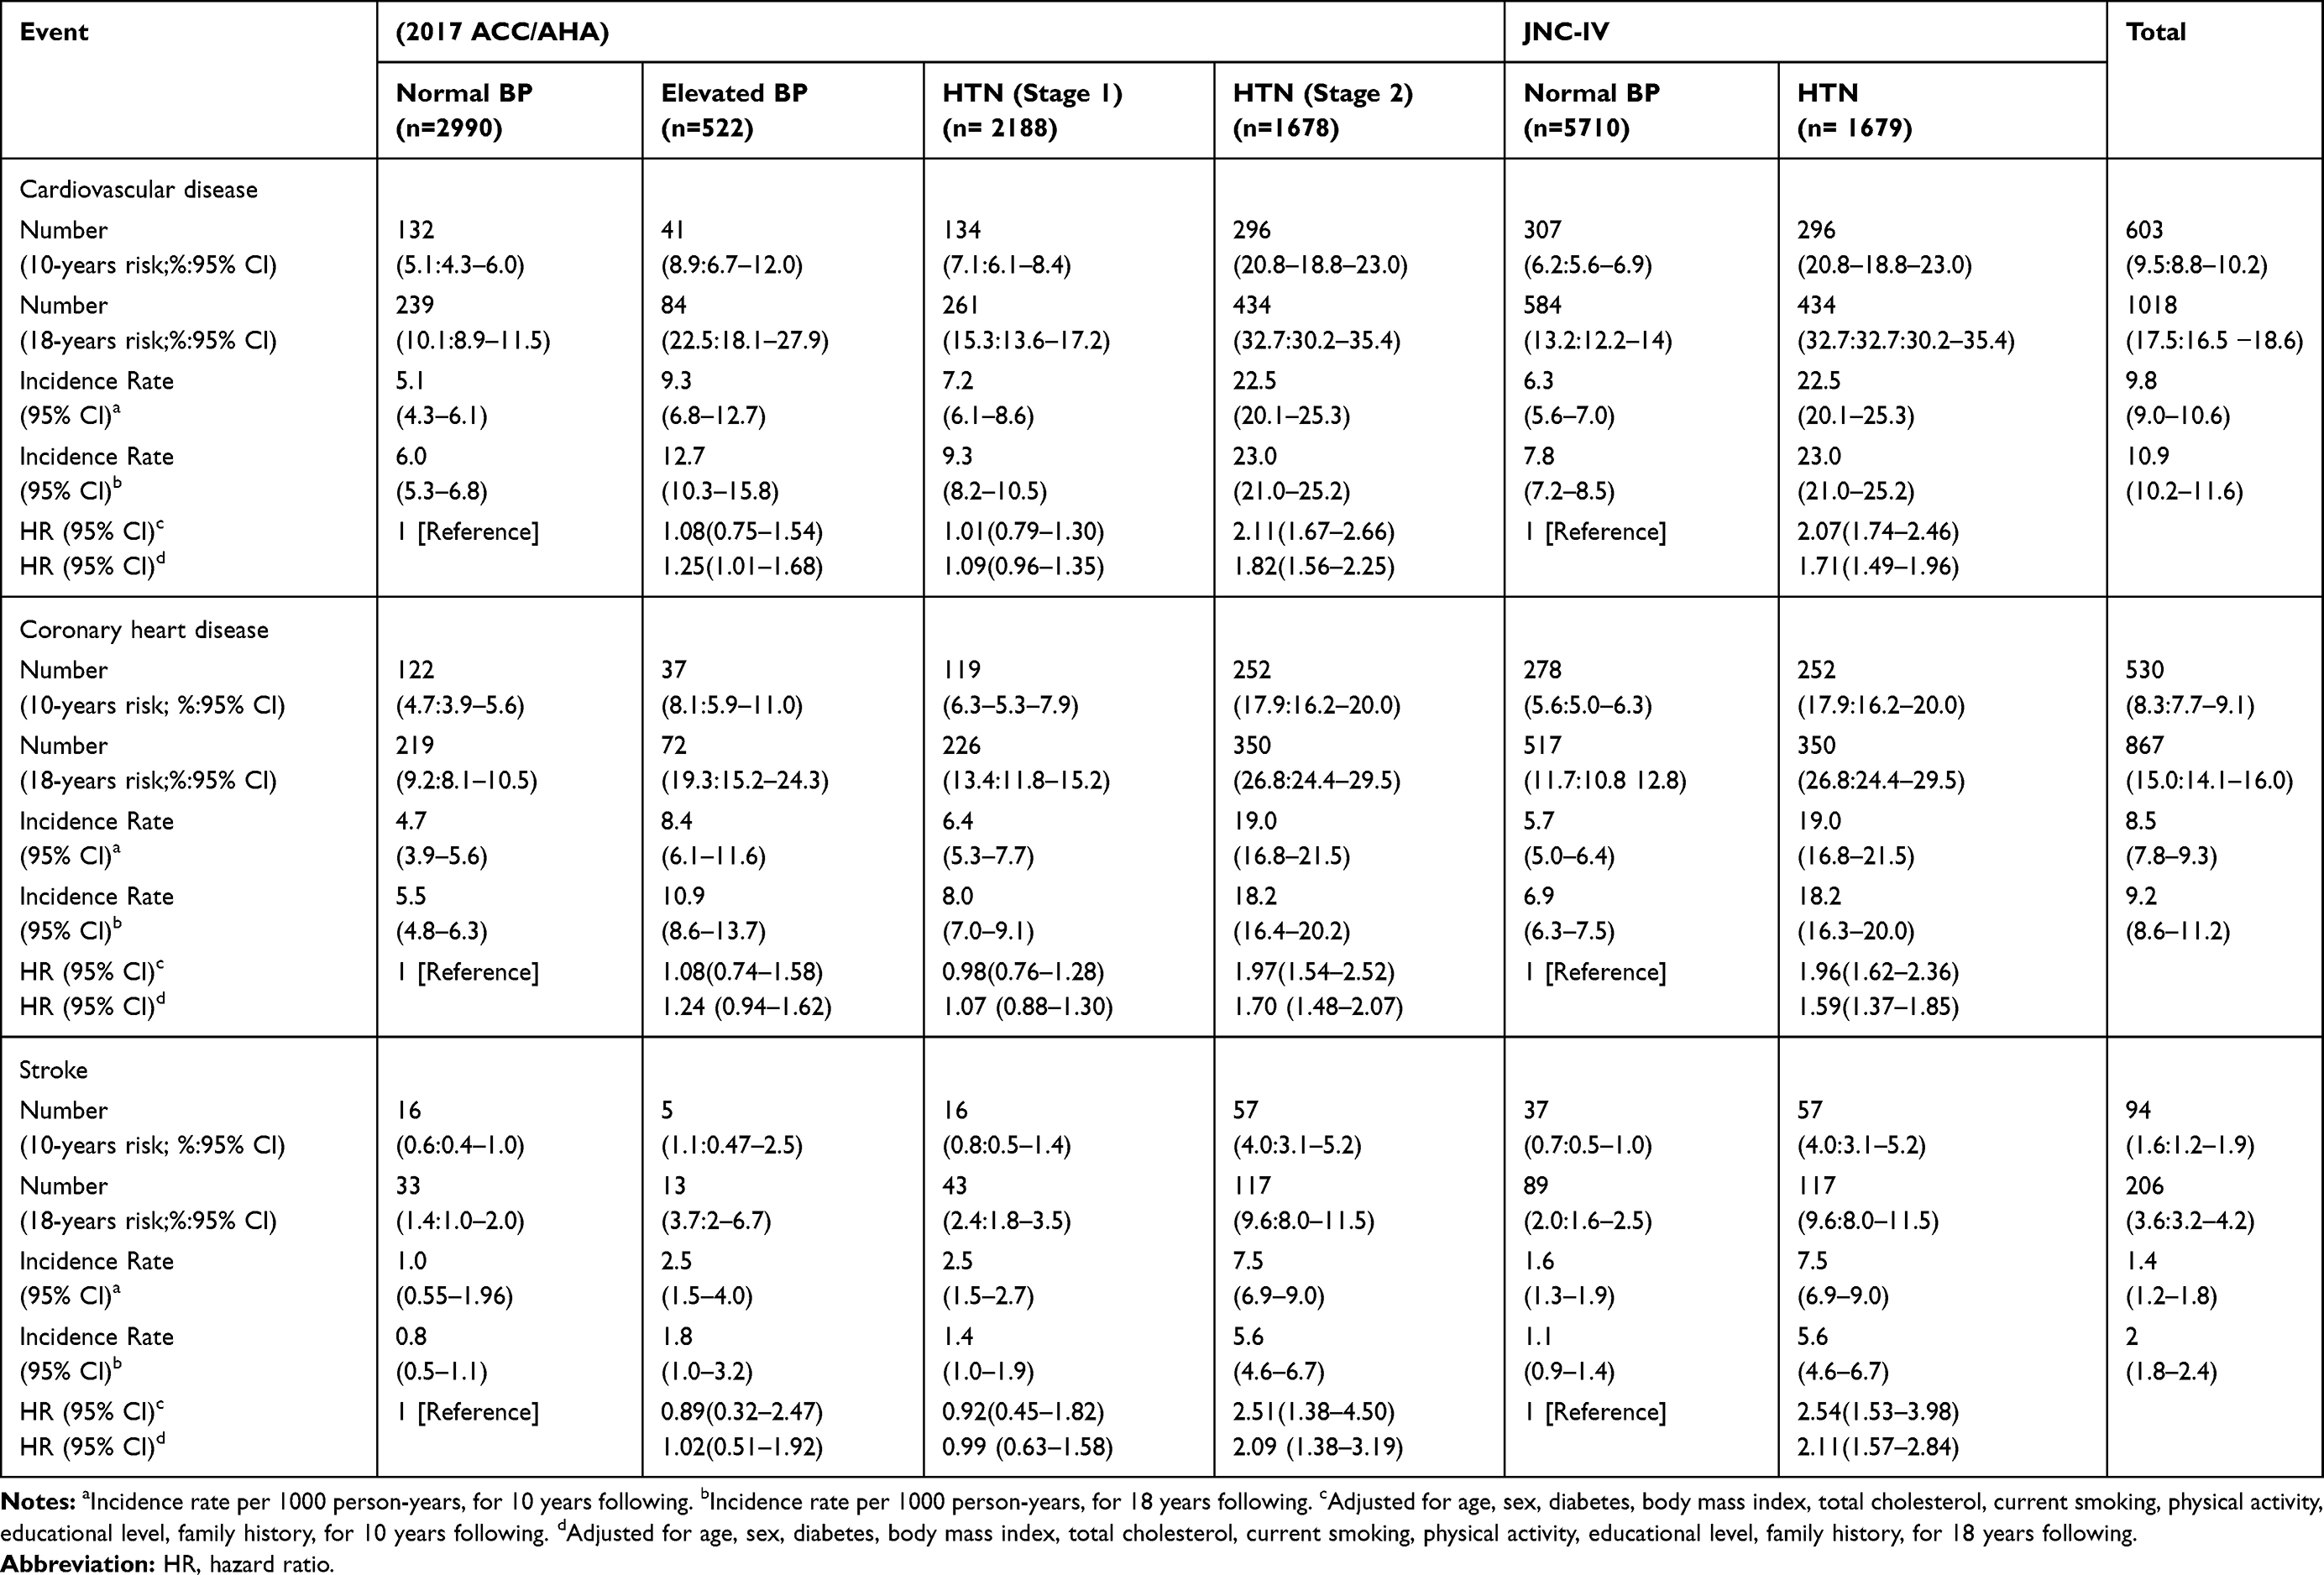 |
Table 4 Risks, Incidence Rates and Adjusted HRs of Cardiovascular Events by BP Categories in TLGS Study |
Based on JNC-IV and 2017 ACC/AHA, in comparison with normal BP, the 10-year risk of CHD was about 3.2 times and 4 times greater in hypertensive patients, respectively (17.9% vs 5.6% and 17.9% vs 4.7%). The 10-year risk of stroke was about 5.7 times greater in hypertensive patients based on both guidelines (4% vs 0.7% and 4% vs 0.6%). This proportion for CHD and stroke was higher in the elevated BP group than in the stage 1 hypertensive patients.
Among the adjusted HRs reported in Table 4, the HR of stroke for the 10 subsequent years was the highest (HR=2.54) compared with normal BP, according to JNC-IV guidelines. Elevated BP and stage 1 HTN were not significant risk factors for CHD or stroke.
Based on the JNC-IV, the PAF and GIF of HTN for various outcomes are shown in Table 2. The PAF of HTN for stroke (30.1%) was about 2 times as high as that for CHD (15.2%). Similarly, a 30% reduction in the prevalence of HTN reduced the number of new cases of stroke by twice that of CHD.
Based on the 2017 ACC/AHA guidelines, the PAFs and GIFs of stage 2 HTN vs normal BP for CVD, CHD, and stroke were up to 3% greater than stage 2 vs stage 1. Various combinations of PAF can be calculated according to the 2017 ACC/AHA levels. For instance, 22.6% of CVD cases will be prevented (20.4% for stage 2 and 2.2% for elevated BP) in cases where both stage 2 HTN and elevated blood pressure are reduced to normal levels.
A strong proportional relationship was observed between HTN reduction percentage and GIF (Figure 2). The incidence of CVD, CHD, and stroke decreased by 0.18%, 0.15%, and 0.3%, respectively, for a 1% decrease in HTN. For example, the decreased CVD incidence created by a 30% reduction in HTN prevalence can be shown by the following formula based on the JNC definition:
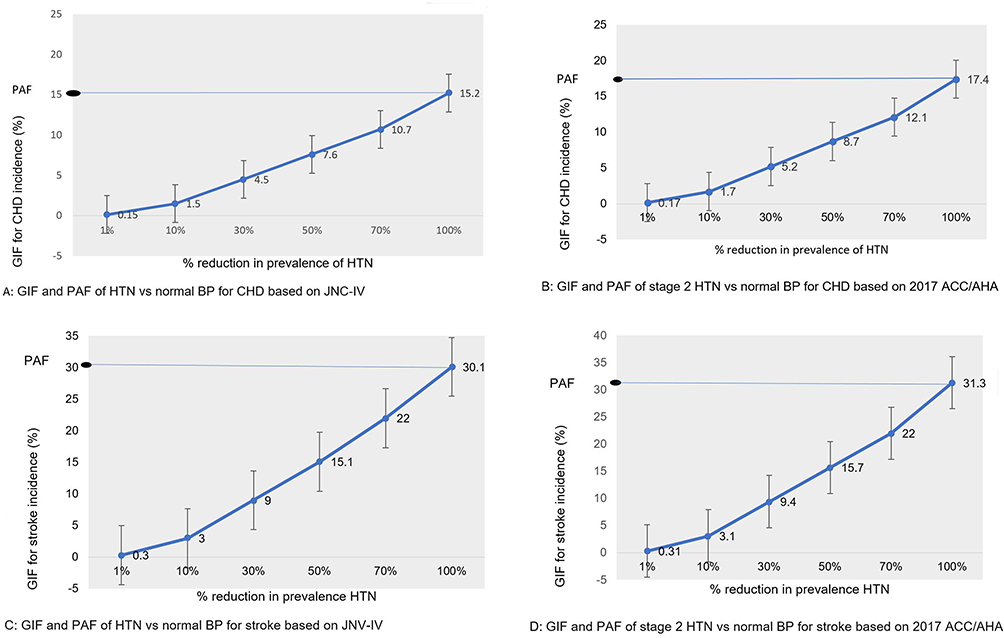 |
Figure 2 GIFs and PAFs of HTN/stage 2 HTN vs normal BP for CHD and stroke based on JNC-IV and 2017 ACC/AHA. |
GIF of HTN for CVD = 0.18% × (% reduction in HTN)
Table 5 shows the PAF and GIF of HTN for CVD, CHD, and stroke by age and sex according to the two guidelines. The PAF and GIF of HTN for CVD and CHD were higher in individuals over 60 years of age and in females compared to individuals under 60 years of age and males, respectively, based on the JNC-IV guideline. The PAF of HTN for stroke was highest (37%) in males. Due to the lack of a significant association between HTN and stroke in females, the PAF and GIF were not calculated.
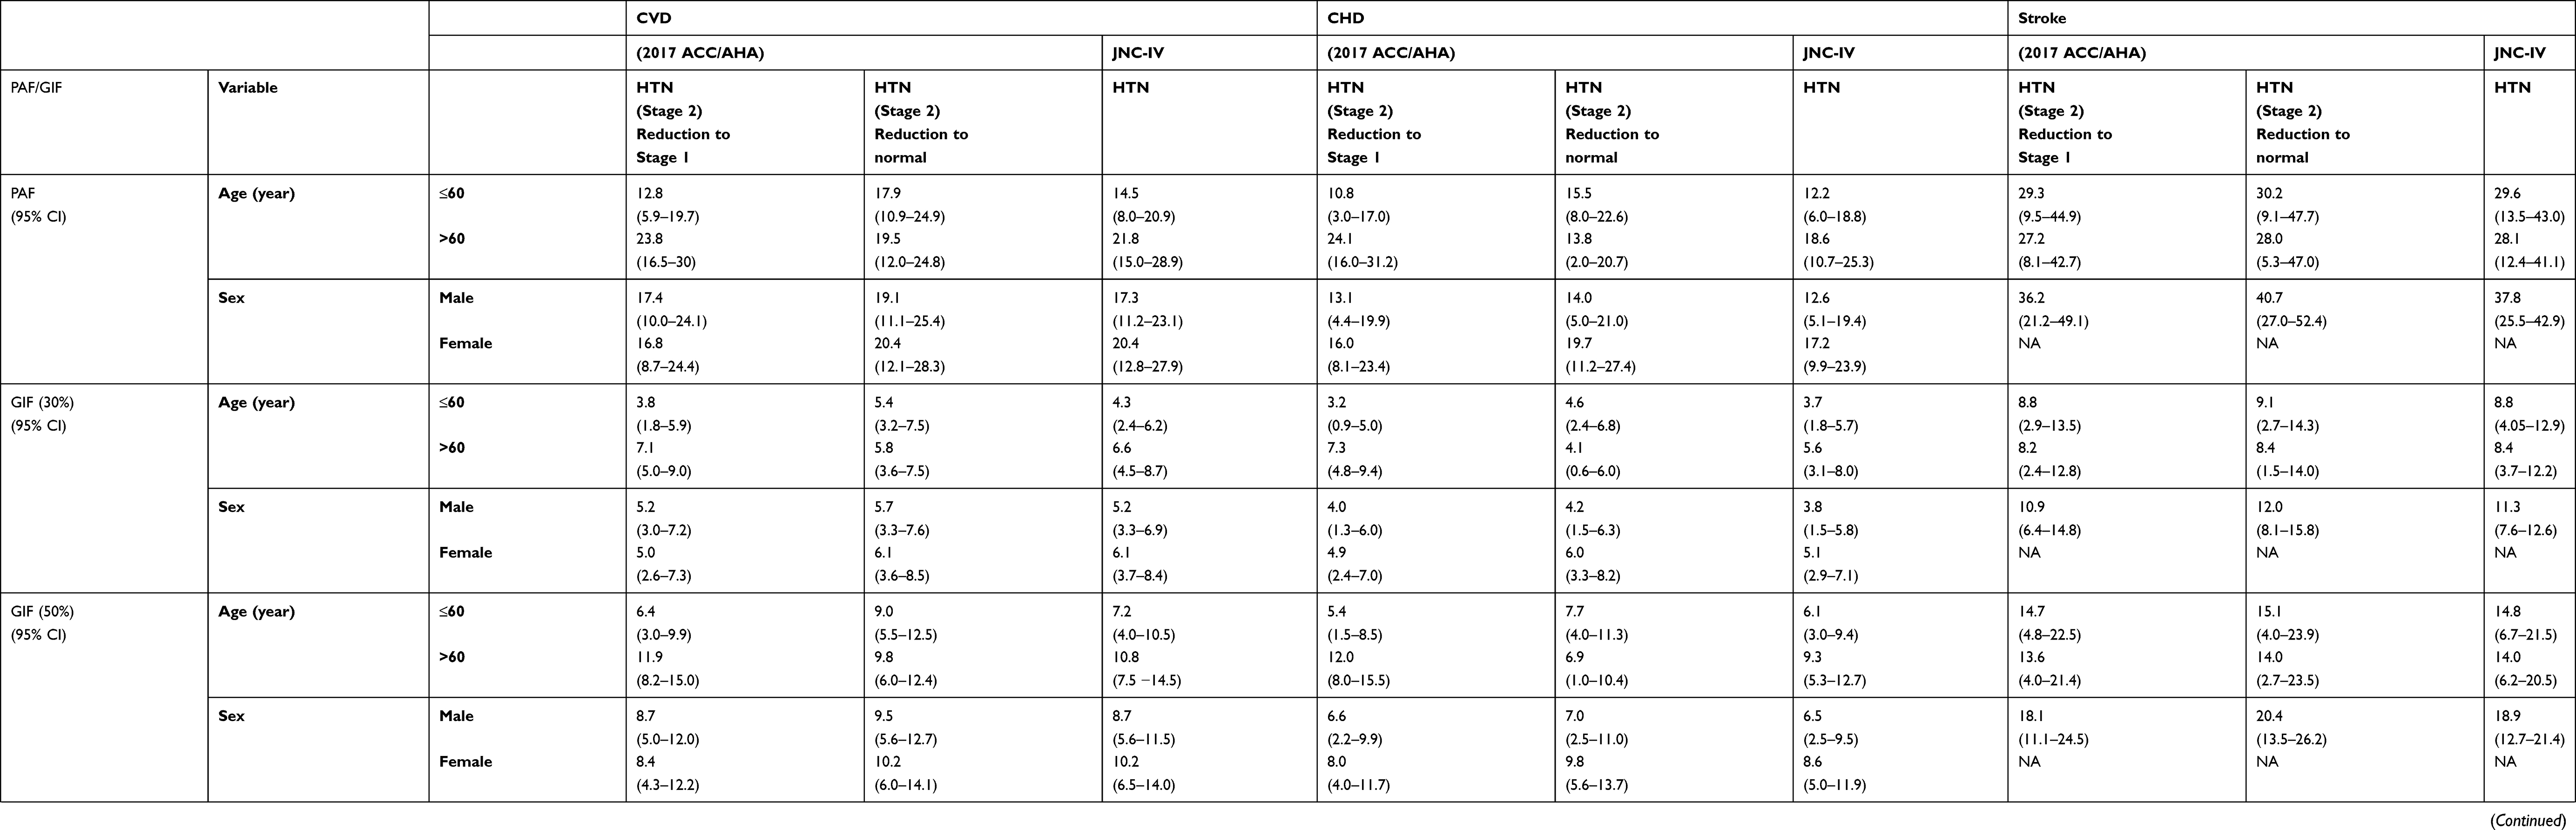 |
Table 5 PAF and GIF for CVD, CHD, and Stroke BP Categories in Age and Sex Groups |
Discussion
The current study found that the prevalence of HTN, based on the JNC-IV and 2017 ACC/AHA (stage 1 plus stage 2) guidelines, were 22.7% and 52.3%, respectively. According to the JNC-IV, if 100% or 30% of hypertensive patients have a normal BP, the incidence of CVD will decrease by about 18% and 5%, respectively; according to the 2017 ACC/AHA guidelines, the corresponding values will be 20% and 6%, respectively.
The blood pressure threshold for diagnosis and management of hypertensive patients has decreased dramatically over the past four decades, resulting in a high increase in the prevalence of HTN; eg two to three times in the current study, China, Peru, the USA, Canada, and other studies in Iran, based on the 2017 ACC/AHA guidelines.4,19–22 Defining stage 1 HTN based on the 2017 ACC/AHA guidelines plays the most important role in increasing the prevalence of HTN as well as the proportion of hypertensive young adults.20,23,24 Asgari et al reported similar findings and showed that 90% of hypertensive young adults were low risk for CVD.4 In the present study, the patients classified as stage 1 HTN were about 7 years younger than the stage 2 patients and 3 years younger than the elevated BP patients; they did not show any significant difference with the elevated BP and normal BP groups in the prevalence of the leading risk factors shown in Table 3.
As seen in Table 4, there was no significant association between stage 1 HTN and CHD, stroke, or CVD. In this respect, the results of other studies are inconsistent.25–27 In a study by Son et al, 62% of the subjects with stage 1 HTN had isolated diastolic HTN (IDH) (SBP <130, DBP ≥80 mmHg), which did not have a significant effect on the incidence of CVD.27 About 72% of patients with stage 1 HTN had IDH in the present study (data not shown), and there was no significant difference in the risk of CVD between these subjects and the normal group. A similar finding was also observed in the ARIC study28 and in a 20-year follow-up in Chinese rural areas.29
Unlike the current results, stage 1 HTN has been reported as a risk factor for CVD in some cohort studies.27,30 In the study conducted by Qi et al,19 the HRs for CVD, CHD, and stroke associated with stage 1 HTN were 1.78, 1.77, and 1.79, respectively. A recent meta-analysis of cohort studies also found that CVD was more common in stage 1 HTN compared to normal BP (HR: 1.38, 95% CI 1.28–1.49).31 Although the most recent definition may increase the public sensitivity to lifestyle modification, it may be associated with several challenges, including increased medical referrals and costs, unnecessary consumption of medications and the related complications, limitations in service provision to high-priority patients, and psychological effects in the population.19,22,32
According to the JNC-IV and in line with the existing evidence, the current findings showed that 30% of stroke cases and 15% of CHD cases in the studied population could be prevented by reducing SBP and DBP to normal. The PAF of HTN for CVD ranges from 13% to 55% in different countries,33–37 depending on the prevalence and adjusted relative risk of HTN for CVD as well as the method of calculation. The INTERSTROKE study, one of the largest international case–control studies conducted in 32 countries, found that the PAF of HTN for stroke was 47.9%, ranging from 32% in Western Europe to 60% in Southwest Asia.38 A meta-analysis of randomized trials by Ettehad et al39 showed that a 10 mmHg reduction in SBP reduced the risk of stroke by 27%. The PAF of HTN for CHD in Southeast Asia,34,40 a Mediterranean population,41 and Western Europe35 was about 25%, 40%, and 31%, respectively.
For the first time in Iran, using the 2017 ACC/AHA guidelines in a population-based cohort study, the current results showed that by reducing stage 2 to stage 1 HTN or to normal BP, the number of new CVD cases would be reduced by about 17% and 20%, respectively. Few studies have reported the PAF for the 2017ACC/AHA guidelines, and some of these studies have merged stage 1 and stage 2 HTN.42 In the analysis of 12,497 Black Americans above 21 years of age with a median follow-up of 14.3 years, the PAF of stage 1 and stage 2 HTN compared with normal BP for CVD, CHD, heart failure, and stroke were 32.5%, 42.5%, 21.5%, and 38.9%, respectively.42 Contrary to the current results, a multi-provincial cohort study in China estimated a PAF of 13.5% for stage 1 HTN vs normal BP in the age group of 30–59 years.19 Using adjusted HR in Levin’s formula, a meta-analysis of 11 cohort studies showed that management of stage 1 HTN could prevent more than 10% of CVD events.31 Due to the lack of a significant association between stage 1 HTN and the outcomes, its PAF included negative and zero values.
Qi et al19 and Clark et al42 also reported that compared with normal BP, the PAF of stage 1 HTN for CVD in people older than 60 years and the PAF of elevated BP for heart failure were both zero.
The complete removal of risk factors in a target population is not always possible because of practical and financial constraints. The plausible minimum risk level is the least conceivable level of prevalence decrease for risk factors, and the current findings showed that, based on JNC-IV and 2017 ACC/AHA guidelines, 5.1% and 6.1% of CVD cases could be prevented by a 30% reduction in HTN prevalence, respectively. Shadmani et al used the scenario of plausible minimum risk level and reported the GIF of HTN for CVD to be 9.3% and 14.7% for males and females, respectively.43 Mazloumi et al44 reported the corresponding value of 25% reduction in the prevalence of HTN for CVD-related mortality among EMRO countries to be 11.8%. It is suggested that the plausible minimum level be determined to reduce the prevalence of important CVD risk factors and to calculate the GIF using the joint intervention approach to develop applicable policies.
Methodological Issues
In addition to the limitations of using the results of PAF estimation studies in policymaking, the calculation methods of this impact measure are different and sometimes biased in studies. Levin’s formula and the Miettinen formula for PAF estimation and Morgenstern’s proposed method for GIF estimation are the conventional methods.45 A lack of confounders and effect modification, the use of the crude risk ratio (RR),46,47 the complexity of estimating the effect of joint interventions, and the inability to adjust time-varying confounders are the most important limitations of the formulas mentioned.10
The parametric G-formula can provide valid PAF or GIF estimates by overcoming the limitations of the conventional methods for PAF and GIF estimation through generating a counterfactual population and using appropriate models.48,49 Vangen-Lønne et al50 applied the parametric G-formula to investigate the effect of joint interventions for complete or partial elimination of stroke risk factors on the 18-year cumulative stroke risk. Their findings showed that the risk of stroke would be reduced by 28% if SBP decreased to less than 140 mmHg in all individuals. Furthermore, they found that the incidence of stroke would decrease by 32% if 13% of smokers quit smoking, 20% of alcohol drinkers quit drinking, all overweight or obese participants lost weight by 10%, and all individuals maintained cholesterol and blood pressure levels in the normal range.
Another interesting finding of the present study was a proportional relationship between the PAF value and the partial reduction of HTN designated for the GIF value. As shown in Tables 2 and 5, multiplying the PAF by the designated 30%, 50%, and 70% values for HTN reduction would produce the same results as the G-formula. O’Neill et al also found a linear relationship between GIF and PAF.51 If this relationship is also determined using other risk factors, the effect of different percentages of reducing each risk factor on disease incidence can be easily estimated by knowing the PAF value of the risk factor.
Strengths and Limitations
For the first time in Iran, the risk of CVD was estimated based on JNC-IV as well as the 2017 ACC/AHA guidelines using a representative large population-based cohort and valid statistical modeling in Tehran. The results also showed the impact of complete removal and partial reduction of HTN prevalence for CVD using both guidelines.
The current study had some limitations. First, time-varying confounders were not adjusted in this study. Therefore, the preventive effect of removing or decreasing HTN in this study might have been under- or over-estimated. However, despite this limitation, the findings were not very different from the results of the studies by Vangen-Lønne50 and Jain et al52 that controlled time-varying confounders for estimating the PAF of HTN for stroke. Second, this study did not control some confounders such as alcohol consumption and nutritional patterns, which challenges the “limited bias” assumption for PAF estimation.
Conclusion
Compared to the JNC-IV guidelines, the new definition of HTN doubled its prevalence in the current study. Stage 1 HTN, as the most important reason for this marked increase, was not a risk factor for the incidence of CVD in the Iranian population. Health policymakers may find the results interesting, because it is impossible to eliminate HTN from the community; instead, a 30% reduction in the BP of hypertensive patients to less than 120/80 prevents 6.1% of CVD cases. Due to the large number of annual CVD cases in Iran, this preventive effect is noticeable.
Abbreviations
GIF, generalized impact fraction; PAF, population attributable fraction; HTN, hypertension; BP, blood pressure; SBP, systolic blood pressure; DBP, diastolic blood pressure; CVD, cardiovascular diseases; CHD, coronary heart disease; 2017 ACC/AHA, 2017 American College of Cardiology/American Heart Association guideline; MBS, model-based standardization; NCDs, non-communicable diseases; TLGS, Tehran Lipid and Glucose Study; HR, hazard ratio; Ocases, observed cases; E cases, expected cases.
Acknowledgments
The authors wish to thank all TLGS staff and managers for collecting and providing the data.
Funding
There is no funding to report.
Disclosure
The authors declare that they have no potential conflict of interest.
References
1. Esteghamati A, Etemad K, Koohpayehzadeh J, et al. Awareness, treatment and control of pre-hypertension and hypertension among adults in Iran. Arch Iran Med. 2016;19(7):456–464. doi:0161907/AIM.003
2. Joffres M, Falaschetti E, Gillespie C, et al. Hypertension prevalence, awareness, treatment and control in national surveys from England, the USA and Canada, and correlation with stroke and ischaemic heart disease mortality: a cross-sectional study. BMJ Open. 2013;3(8):e003423. doi:10.1136/bmjopen-2013-003423
3. Whelton. 2017 ACC/AHA/AAPA/ABC/ACPM/AGS/APhA/ASH/ASPC/NMA/PCNA guideline for the prevention, detection, evaluation, and management of high blood pressure in adults: executive summary: a report of the American College of Cardiology/American Heart Association Task Force on clinical practice guidelines. Hypertension. 2018;71(6):E136–E139. doi:10.1161/HYP.0000000000000075
4. Asgari S, Khaloo P, Khalili D, Azizi F, Hadaegh F. Status of hypertension in Tehran: potential impact of the ACC/AHA 2017 and JNC7 guidelines, 2012–2015. Sci Rep. 2019;9(1):6382. doi:10.1038/s41598-019-42809-3
5. Kim HC, Jeon YW, Heo ST. Global impact of the 2017 American College of Cardiology/American Heart Association hypertension guidelines. Circulation. 2018;138(21):2312–2314. doi:10.1161/CIRCULATIONAHA.118.036312
6. Rothman KJ, Greenland S. Modern Epidemiology. Lippincott Williams& Wilkins; 2008.
7. Levin ML. The occurrence of lung cancer in man. Acta Unio Int Contra Cancrum. 1953;9(3):531–541.
8. Cole P, MacMahon B. Attributable risk percent in case-control studies. Br J Prev Soc Med. 1971;25(4):242–244. doi:10.1136/jech.25.4.242
9. Khosravi A, Mansournia MA. Recommendation on unbiased estimation of population attributable fraction calculated in “prevalence and risk factors of active pulmonary tuberculosis among elderly people in China: a population based cross-sectional study”. Infect Dis Poverty. 2019;8(1). doi:10.1186/s40249-019-0587-8
10. Mansournia MA, Altman DG. Population attributable fraction. BMJ (Online). 2018;360.
11. Greenland S. Estimating standardized parameters from generalized linear models. Stat Med. 1991;10(7):1069–1074. doi:10.1002/sim.4780100707
12. Gharibzadeh S, Mohammad K, Rahimiforoushani A, Amouzegar A, Mansournia MA. Standardization as a tool for causal inference in medical research. Arch Iran Med. 2016;19(9):0–0.
13. van der Wal WM, Prins M, Lumbreras B, Geskus R. A simple G‐computation algorithm to quantify the causal effect of a secondary illness on the progression of a chronic disease. Stat Med. 2009;28(18):2325–2337. doi:10.1002/sim.3629
14. Snowden JM, Rose S, Mortimer KM. Implementation of G-computation on a simulated data set: demonstration of a causal inference technique. Am J Epidemiol. 2011;173(7):731–738. doi:10.1093/aje/kwq472
15. Taubman SL, Robins JM, Mittleman MA, Hernán MA. Intervening on risk factors for coronary heart disease: an application of the parametric g-formula. Int J Epidemiol. 2009;38(6):1599–1611. doi:10.1093/ije/dyp192
16. Azizi F, Rahmani M, Emami H, et al. Cardiovascular risk factors in an Iranian urban population: Tehran lipid and glucose study (phase 1). Soz Praventivmed. 2002;47(6):408–426. doi:10.1007/s000380200008
17. Organization WH. Cerebrovascular Disorders: A Clinical and Research Classification. World Health Organization; 1978.
18. National Document for the Prevention and Control of Non-Communicable Diseases and Related Risk Factors in the Islamic Republic of Iran, from 2015 to 2025. Tehran. 2015:81.
19. Qi Y, Han X, Zhao D, et al. Long-term cardiovascular risk associated with stage 1 hypertension defined by the 2017 ACC/AHA hypertension guideline. J Am Coll Cardiol. 2018;72(11):1201–1210. doi:10.1016/j.jacc.2018.06.056
20. Hernández-Vásquez A, Santero M. New 2017 ACC/AHA hypertension guideline: implications for a Latin American country like Peru. Eur J Prev Cardiol. 2019;26(6):668–670. doi:10.1177/2047487318799489
21. Muntner P, Carey RM, Gidding S, et al. Potential US population impact of the 2017 ACC/AHA high blood pressure guideline. Circulation. 2018;137(2):109–118. doi:10.1161/CIRCULATIONAHA.117.032582
22. Garies S, Hao S, McBrien K, et al. Prevalence of hypertension, treatment, and blood pressure targets in Canada associated with the 2017 American College of Cardiology and American Heart Association blood pressure guidelines. JAMA Netw Open. 2019;2(3):e190406–e190406. doi:10.1001/jamanetworkopen.2019.0406
23. Wang Z, Chen Z, Zhang L, et al. Status of hypertension in China: results from the China hypertension survey, 2012–2015. Circulation. 2018;137(22):2344–2356. doi:10.1161/CIRCULATIONAHA.117.032380
24. Al Kibria GM, Swasey K, Hasan MZ, et al. Determinants of hypertension among adults in Bangladesh as per the Joint National Committee 7 and 2017 American College of Cardiology/American Hypertension Association hypertension guidelines. J Am Soc Hypertens. 2018;12(11):e45–e55. doi:10.1016/j.jash.2018.10.004
25. Talaei M, Hosseini N, Koh AS, Yuan JM, Koh WP. Association of “elevated blood pressure” and “stage 1 hypertension” with cardiovascular mortality among an Asian population. J Am Heart Assoc. 2018;7(8):e008911. doi:10.1161/JAHA.118.008911
26. Atasoy S, Johar H, Peters A, Ladwig K-H. Association of hypertension cut-off values with 10-year cardiovascular mortality and clinical consequences: a real-world perspective from the prospective MONICA/KORA study. Eur Heart J. 2019;40(9):732–738. doi:10.1093/eurheartj/ehy694
27. Son JS, Choi S, Kim K, et al. Association of blood pressure classification in Korean young adults according to the 2017 American College of Cardiology/American Heart Association guidelines with subsequent cardiovascular disease events. JAMA. 2018;320(17):1783–1792. doi:10.1001/jama.2018.16501
28. McEvoy JW, Daya N, Rahman F, et al. Association of isolated diastolic hypertension as defined by the 2017 ACC/AHA blood pressure guideline with incident cardiovascular outcomes. JAMA. 2020;323(4):329–338. doi:10.1001/jama.2019.21402
29. Wang M, Wu T, Yu C, et al. Association between blood pressure levels and cardiovascular deaths: a 20-year follow-up study in rural China. BMJ Open. 2020;10(2):e035190–e035190. doi:10.1136/bmjopen-2019-035190
30. Gao J, Dai Y, Xie Y, et al. The association of stage 1 hypertension defined by the 2017 ACC/AHA guideline with stroke and its subtypes among elderly Chinese. Biomed Res Int. 2020;2020:4023787. doi:10.1155/2020/4023787
31. Han M, Chen Q, Liu L, et al. Stage 1 hypertension by the 2017 American College of Cardiology/American Heart Association hypertension guidelines and risk of cardiovascular disease events: systematic review, meta-analysis, and estimation of population etiologic fraction of prospective cohort studies. J Hypertens. 2020;38(4):573–578. doi:10.1097/HJH.0000000000002321
32. Johnson HM, Warner RC, LaMantia JN, Bowers BJ. “I have to live like I’m old.” Young adults’ perspectives on managing hypertension: a multi-center qualitative study. BMC Fam Pract. 2016;17(1):31. doi:10.1186/s12875-016-0428-9
33. Trajkova S, d’Errico A, Ricceri F, et al. Impact of preventable risk factors on stroke in the EPICOR study: does gender matter? Int J Public Health. 2017;62(7):775–786. doi:10.1007/s00038-017-0993-2
34. Kaur P, Ramachandra Rao S, Venkatachalam R, et al. Risk factors for cardiovascular disease in rural South India: cohort study. BMJ Open. 2019;9(10):e029759. doi:10.1136/bmjopen-2019-029759
35. Félix-Redondo FJ, Lozano Mera L, Alvarez-Palacios Arrighi P, Grau Magana M, Ramírez-Romero JM, Fernández-Bergés D. Impact of cardiovascular risk factors in the Extremadura population: HERMEX cohort contributions for a preventive strategy. Atencion Primaria. 2020;52(1):3–13. doi:10.1016/j.aprim.2018.11.006
36. Sardarinia M, Akbarpour S, Lotfaliany M, et al. Risk factors for incidence of cardiovascular diseases and all-cause mortality in a middle eastern population over a decade follow-up: Tehran lipid and glucose study. PLoS One. 2016;11(12):e0167623. doi:10.1371/journal.pone.0167623
37. Dong K, Yang Q, Duan F, et al. Stroke and (or) myocardial infarction attributable to modifiable risk factors in Henan, China. J Am Soc Hypertens. 2018;12(7):524–533. doi:10.1016/j.jash.2018.03.013
38. O’Donnell MJ, Chin SL, Rangarajan S, et al. Global and regional effects of potentially modifiable risk factors associated with acute stroke in 32 countries (INTERSTROKE): a case-control study. Lancet. 2016;388(10046):761–775. doi:10.1016/S0140-6736(16)30506-2
39. Ettehad D, Emdin CA, Kiran A, et al. Blood pressure lowering for prevention of cardiovascular disease and death: a systematic review and meta-analysis. Lancet. 2016;387(10022):957–967. doi:10.1016/S0140-6736(15)01225-8
40. Hussain MA, Al Mamun A, Peters SA, Woodward M, Huxley RR. The burden of cardiovascular disease attributable to major modifiable risk factors in Indonesia. J Epidemiol. 2016;26(10):515–521. doi:10.2188/jea.JE20150178
41. Redon J, Tellez-Plaza M, Orozco-Beltran D, et al. Impact of hypertension on mortality and cardiovascular disease burden in patients with cardiovascular risk factors from a general practice setting: the ESCARVAL-risk study. J Hypertens. 2016;34(6):1075–1083. doi:10.1097/HJH.0000000000000930
42. Clark D, Colantonio LD, Min YI, et al. Population-attributable risk for cardiovascular disease associated with hypertension in black adults. JAMA Cardiol. 2019;4(12):1194–1202. doi:10.1001/jamacardio.2019.3773
43. Shadmani FK, Karami M. Joint effect of modifying selected risk factors on attributable burden of cardiovascular diseases. Int J Prev Med. 2013;4(12):1461–1467.
44. Mazloumi E, Poorolajal J, Sarrafzadegan N, Roohafza HR, Faradmal J, Karami M. Avoidable burden of cardiovascular diseases in the eastern mediterranean region: contribution of selected risk factors for cardiovascular-related deaths. High Blood Pressure Cardiovasc Prev. 2019;26(3):227–237. doi:10.1007/s40292-019-00319-3
45. Khosravi A, Nielsen RO, Mansournia MA. Methods matter: population attributable fraction (PAF) in sport and exercise medicine. Br J Sports Med. 2020;
46. Zhang C-Y, Zhao F, Xia -Y-Y, et al. Prevalence and risk factors of active pulmonary tuberculosis among elderly people in China: a population based cross-sectional study. Infect Dis Poverty. 2019;8(1):7. doi:10.1186/s40249-019-0515-y
47. Lin C-K, Lin R-T, Chen T, Zigler C, Wei Y, Christiani DC. A global perspective on coal-fired power plants and burden of lung cancer. Environ Health. 2019;18(1):9. doi:10.1186/s12940-019-0448-8
48. Cai Z, Brumback BA. Model‐based standardization to adjust for unmeasured cluster‐level confounders with complex survey data. Stat Med. 2015;34(15):2368–2380. doi:10.1002/sim.6504
49. Mokhayeri Y, Hashemi-Nazari SS, Khodakarim S, et al. Effects of hypothetical interventions on ischemic stroke using parametric G-formula. Stroke. 2019;50(11):3286–3288. doi:10.1161/STROKEAHA.119.025749
50. Vangen-Lonne AM, Ueda P, Gulayin P, Wilsgaard T, Mathiesen EB, Danaei G. Hypothetical interventions to prevent stroke: an application of the parametric g-formula to a healthy middle-aged population. Eur J Epidemiol. 2018;33(6):557–566. doi:10.1007/s10654-017-0344-x
51. O’Neill KN, Fitzgerald AP, Kearney PM. Impact of population distribution shifts in sugar-sweetened beverage consumption on type II diabetes incidence in Ireland. Ann Epidemiol. 2020;41:1–6. doi:10.1016/j.annepidem.2019.12.007
52. Jain P, Suemoto CK, Rexrode K, et al. Hypothetical lifestyle strategies in middle-aged women and the long-term risk of stroke. Stroke. 2020;51(5):1381–1387. doi:10.1161/STROKEAHA.119.026761
 © 2020 The Author(s). This work is published and licensed by Dove Medical Press Limited. The full terms of this license are available at https://www.dovepress.com/terms.php and incorporate the Creative Commons Attribution - Non Commercial (unported, v3.0) License.
By accessing the work you hereby accept the Terms. Non-commercial uses of the work are permitted without any further permission from Dove Medical Press Limited, provided the work is properly attributed. For permission for commercial use of this work, please see paragraphs 4.2 and 5 of our Terms.
© 2020 The Author(s). This work is published and licensed by Dove Medical Press Limited. The full terms of this license are available at https://www.dovepress.com/terms.php and incorporate the Creative Commons Attribution - Non Commercial (unported, v3.0) License.
By accessing the work you hereby accept the Terms. Non-commercial uses of the work are permitted without any further permission from Dove Medical Press Limited, provided the work is properly attributed. For permission for commercial use of this work, please see paragraphs 4.2 and 5 of our Terms.