")
Back to Journals » Diabetes, Metabolic Syndrome and Obesity » Volume 13
Estimation of Diabetes in a High-Risk Adult Chinese Population Using J48 Decision Tree Model
Authors Pei D, Yang T, Zhang C
Received 28 August 2020
Accepted for publication 27 October 2020
Published 26 November 2020 Volume 2020:13 Pages 4621—4630
DOI https://doi.org/10.2147/DMSO.S279329
Checked for plagiarism Yes
Review by Single anonymous peer review
Peer reviewer comments 4
Editor who approved publication: Dr Konstantinos Tziomalos
Dongmei Pei, Tengfei Yang, Chengpu Zhang
Department of Health Management, Shengjing Hospital of China Medical University, Shenyang, People’s Republic of China
Correspondence: Dongmei Pei
Department of Health Management, Shengjing Hospital of China Medical University, No. 36, Sanhao Street, Heping District, Shenyang 110004, People’s Republic of China
Email [email protected]
Background: To predict and make an early diagnosis of diabetes is a critical approach in a population with high risk of diabetes, one of the devastating diseases globally. Traditional and conventional blood tests are recommended for screening the suspected patients; however, applying these tests could have health side effects and expensive cost. The goal of this study was to establish a simple and reliable predictive model based on the risk factors associated with diabetes using a decision tree algorithm.
Methods: A retrospective cross-sectional study was used in this study. A total of 10,436 participants who had a health check-up from January 2017 to July 2017 were recruited. With appropriate data mining approaches, 3454 participants remained in the final dataset for further analysis. Seventy percent of these participants (2420 cases) were then randomly allocated to either the training dataset for the construction of the decision tree or the testing dataset (30%, 1034 cases) for evaluation of the performance of the decision tree. For this purpose, the cost-sensitive J48 algorithm was used to develop the decision tree model.
Results: Utilizing all the key features of the dataset consisting of 14 input variables and two output variables, the constructed decision tree model identified several key factors that are closely linked to the development of diabetes and are also modifiable. Furthermore, our model achieved an accuracy of classification of 90.3% with a precision of 89.7% and a recall of 90.3%.
Conclusion: By applying simple and cost-effective classification rules, our decision tree model estimates the development of diabetes in a high-risk adult Chinese population with strong potential for implementation of diabetes management.
Keywords: diabetes, J48 algorithm, decision tree, risk factors
Introduction
Diabetes mellitus is a lifelong chronic disease associated with high mortality, morbidity, and huge health-system costs globally.1,2 The worldwide incidence of diabetes is increasing in a pandemic pattern, being potentially ranked as the seventh leading cause of death in 2030.3,4
Over the past 100 years, the diagnosis of diabetes has been primarily based on the determination of raised blood glucose concentrations during a postprandial period or after a fasting condition.5 Measurement of fasting glucose levels in the blood is the simplest but invasive laboratory-based method to identify diabetes. Furthermore, approximately a half of the patients with diabetes are virtually unaware of their disease conditions6,7 prior to blood glucose tests. One of the main challenges in diabetes screening involves the repeated blood glucose tests and a massive human labor effort, both of which represent a certain degree of burden to patients and medical care systems financially and could be even more detrimental to medical care systems in developing countries.8 This is particularly relevant for China, where 52.7% of adult Chinese patients with diabetes (50 million) are actually undiagnosed.9 Perhaps even more alarming is the fact that the prevalence of prediabetes exhibits a tendency to increase rapidly among individuals at high risk of diabetes. The World Health Organization (WHO) thus recommends the development of simple strategies to identify patients with a risk of diabetes and provide them with early lifestyle interventions and modifications.10 Attempts to prevent type 2 diabetes mellitus (T2DM) in apparently healthy subjects could thus be more successful if the intervention is commenced in a timely manner as blood glucose levels in these subjects may still be in the nondiabetic range and resistance to endogenous insulin may have not developed in these patients yet.11 Therefore, it is an urgent need to implement population-based interventions that can be used to prevent development of diabetes by enhancing the early detection, modifying lifestyle and initiating appropriate pharmacological interventions.12
Risk evaluation of certain disease relies on a large dataset. From the point of statistical modelling, the prediction of diabetes in a high-risk population could be postulated and determined. Given the nature of a large dataset embedded with many known and unknown variables, an implementation of classification schemes becomes necessary, especially in a machine learning based study. To this end, data mining constitutes an essential tool. Data mining is the process of selecting, exploring and modeling large amounts of data in order to discover unknown patterns or relationships that provide well-defined and useful information, and, in general, this technique has developed rapidly in recent years.13,14 Data mining includes the use of traditional and non-traditional statistical methods, such as logistic regression and decision tree analysis, respectively. We had previously applied a predictive model to identify potential type II diabetes with a sensitive and a highly accurate decision-tree approach.15 In this regard, through data mining techniques, the previously unknown patterns and tendencies hidden in a large dataset could be retrieved, and newly discovered information can subsequently be used to eventually create models that enable prediction and decision-making in new and novel situations.16 However, there is a relatively less research in the field in which data mining methodology has been applied to construct the corresponding models for predicting the incidence of diabetes based on those known risk factors.
It is important to emphasize that an early and accurate prediction of diabetes may play a pivotal role in the diagnosis and clinical managements of diabetes. It could also offer benefits in designing strategies to prevent this condition through education and consultation for those with high-risk of diabetes. Therefore, the purpose of this study was to determine the feasibility of applying common risk factors to screen potential diabetes, and, specifically, to develop a diabetes classifier by taking advantage of the knowledge discovery capabilities of data mining techniques. Moreover, in the present study, we expanded to include more variables than previously implemented in our model15 to establish a much more comprehensive decision-tree through which a holistic approach with high accuracy, precision and effectiveness toward an individual with potential for developing diabetes could be developed. Our approach could thus be more applicable to the areas where the epidemiologic risk of diabetes is high and medical expenses are less affordable.
Methods
Study Participants
A total of 10,436 participants aged 20 years old or older were recruited after they underwent a routine health check-up at the Shengjing Hospital of China Medical University between January 2017 and July 2017. This study was approved by the Ethics Committee of Shengjing Hospital of China Medical University (the IRB reference number: 2017PS42K). Among 10,436 records, a total of 6982 records were excluded due to missing data for BMI, blood pressure, family history of diabetes, history of cardiovascular disease or stroke, physical activity, work stress, or salty food preference. Records with past history of diabetes (423 records) were also excluded because we focused on estimating prediabetes and diabetes. Finally, a total of 3454 records were included in this study as shown in Figure 1.
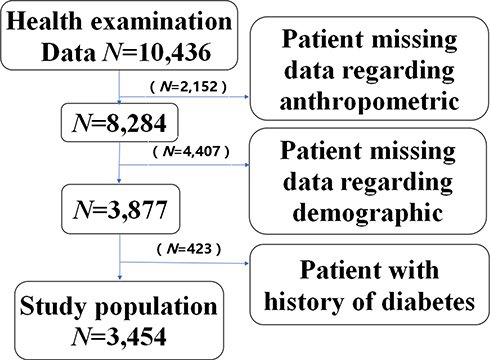 |
Figure 1 Flow chart of records that were excluded from the physical examination database of Shengjing Hospital of China Medical University (January–July, 2017). |
Selection of Variables in the Study
Demographic characteristics such as age, gender, marital status, education level and annual income were analyzed for all the participants; an individual with a positive family history of diabetes, hypertension, cardiovascular disease or stroke and hyperlipidemia, was defined as any family member of the participant previously having been diagnosed with any one of the aforementioned disorders (Yes=1,No=0).
In this study the lifestyle risk factors encompassed the following variables: smoking was defined as a person who smoked at least 500 cigarettes in one’s life (Yes=1,No=0); alcohol consumption was defined as a person who drank at least 100 g of alcohol per week for 1 year or longer (Yes=1,No=0); tea preference was defined as someone who drank tea more than once a week (Yes=1,No=0); the preferences for fruits, fish, vegetables, meats and milks were defined as a person who consumed fruit or fish or vegetable or meat or milk more than three times a week (Yes=1,No=0); sleep duration has three levels according to the participants’ sleep time (short≤4 hours=2, normal 4–6 hours=1, and long ≥6 hours=0); physical activity referred to those that spent at least more than 30 minutes of exercise for 3 days in a week (More=1, Less=0); work-related stress was assessed by the participants’ subjective impression (Yes=1,No=0); workweek referred to those who work more than 40 hours in a week (More=1, Less=0); anthropometric information contains body mass index (BMI) which was calculated as weight in kilograms divided by the square of height in meters (kg/m2), and a BMI≥25 was defined as overweight/obese.
Diabetes diagnoses were made as either prediabetes or diabetes based on the measurements of fasting plasma glucose with a cut-off value of ≥5.6 mmol/L.17,18
Data Selection and Classification Algorithm
Based on the favorable prediction results obtained from the preliminary runs, in this study we chose to use J48 (C4.5 algorithm), which was implemented in WEKA 3.8.1 (Waikato Environment for Knowledge Analysis, University of Waikato, New Zealand),19 to build our decision tree method for its capability of identifying a robust statistical classifier and operating with numeric and nominal attributes. Since data mining algorithms, particularly the decision tree, do not work well with missing values, any data even with a single missing value in one variable was deleted from the dataset. As a result, marital status (N = 328, 3.1%), education levels (N =370, 3.5%), and annual incomes (N =415, 4.0%), family history of diabetes, hypertension, cardiovascular disease or stroke or hyperlipidemia (N =312, 3.0%), history of Hypertension, cardiovascular disease or stroke, hyperlipidemia (N =512, 4.9%), smoking (N =303, 2.9%), alcohol consumption (N =454, 4.4%), the preferences for tea, fruits, fish, vegetables, meats or milks (N =236, 2.3%), sleep duration (N =335, 3.2%), physical activity (N =373, 3.6%), work-related stress (N =455, 4.4%), workweek (N =314, 3.0%), BMI (N =1031, 9.9%), age (N =795, 7.6%), and gender (N =326, 3.1%) were discarded. With such a strict data filtration, the remaining 3454 records from the eligible participants were used for further analysis in this study.
Descriptive statistical analyses were carried out for all variables. The Chi-square test was used to examine differences between proportions and a p value less than 0.05 was considered significant. All statistical analyses were performed using SPSS 19 statistical program. All the results of the descriptive and Chi-square tests are shown in Table 1.
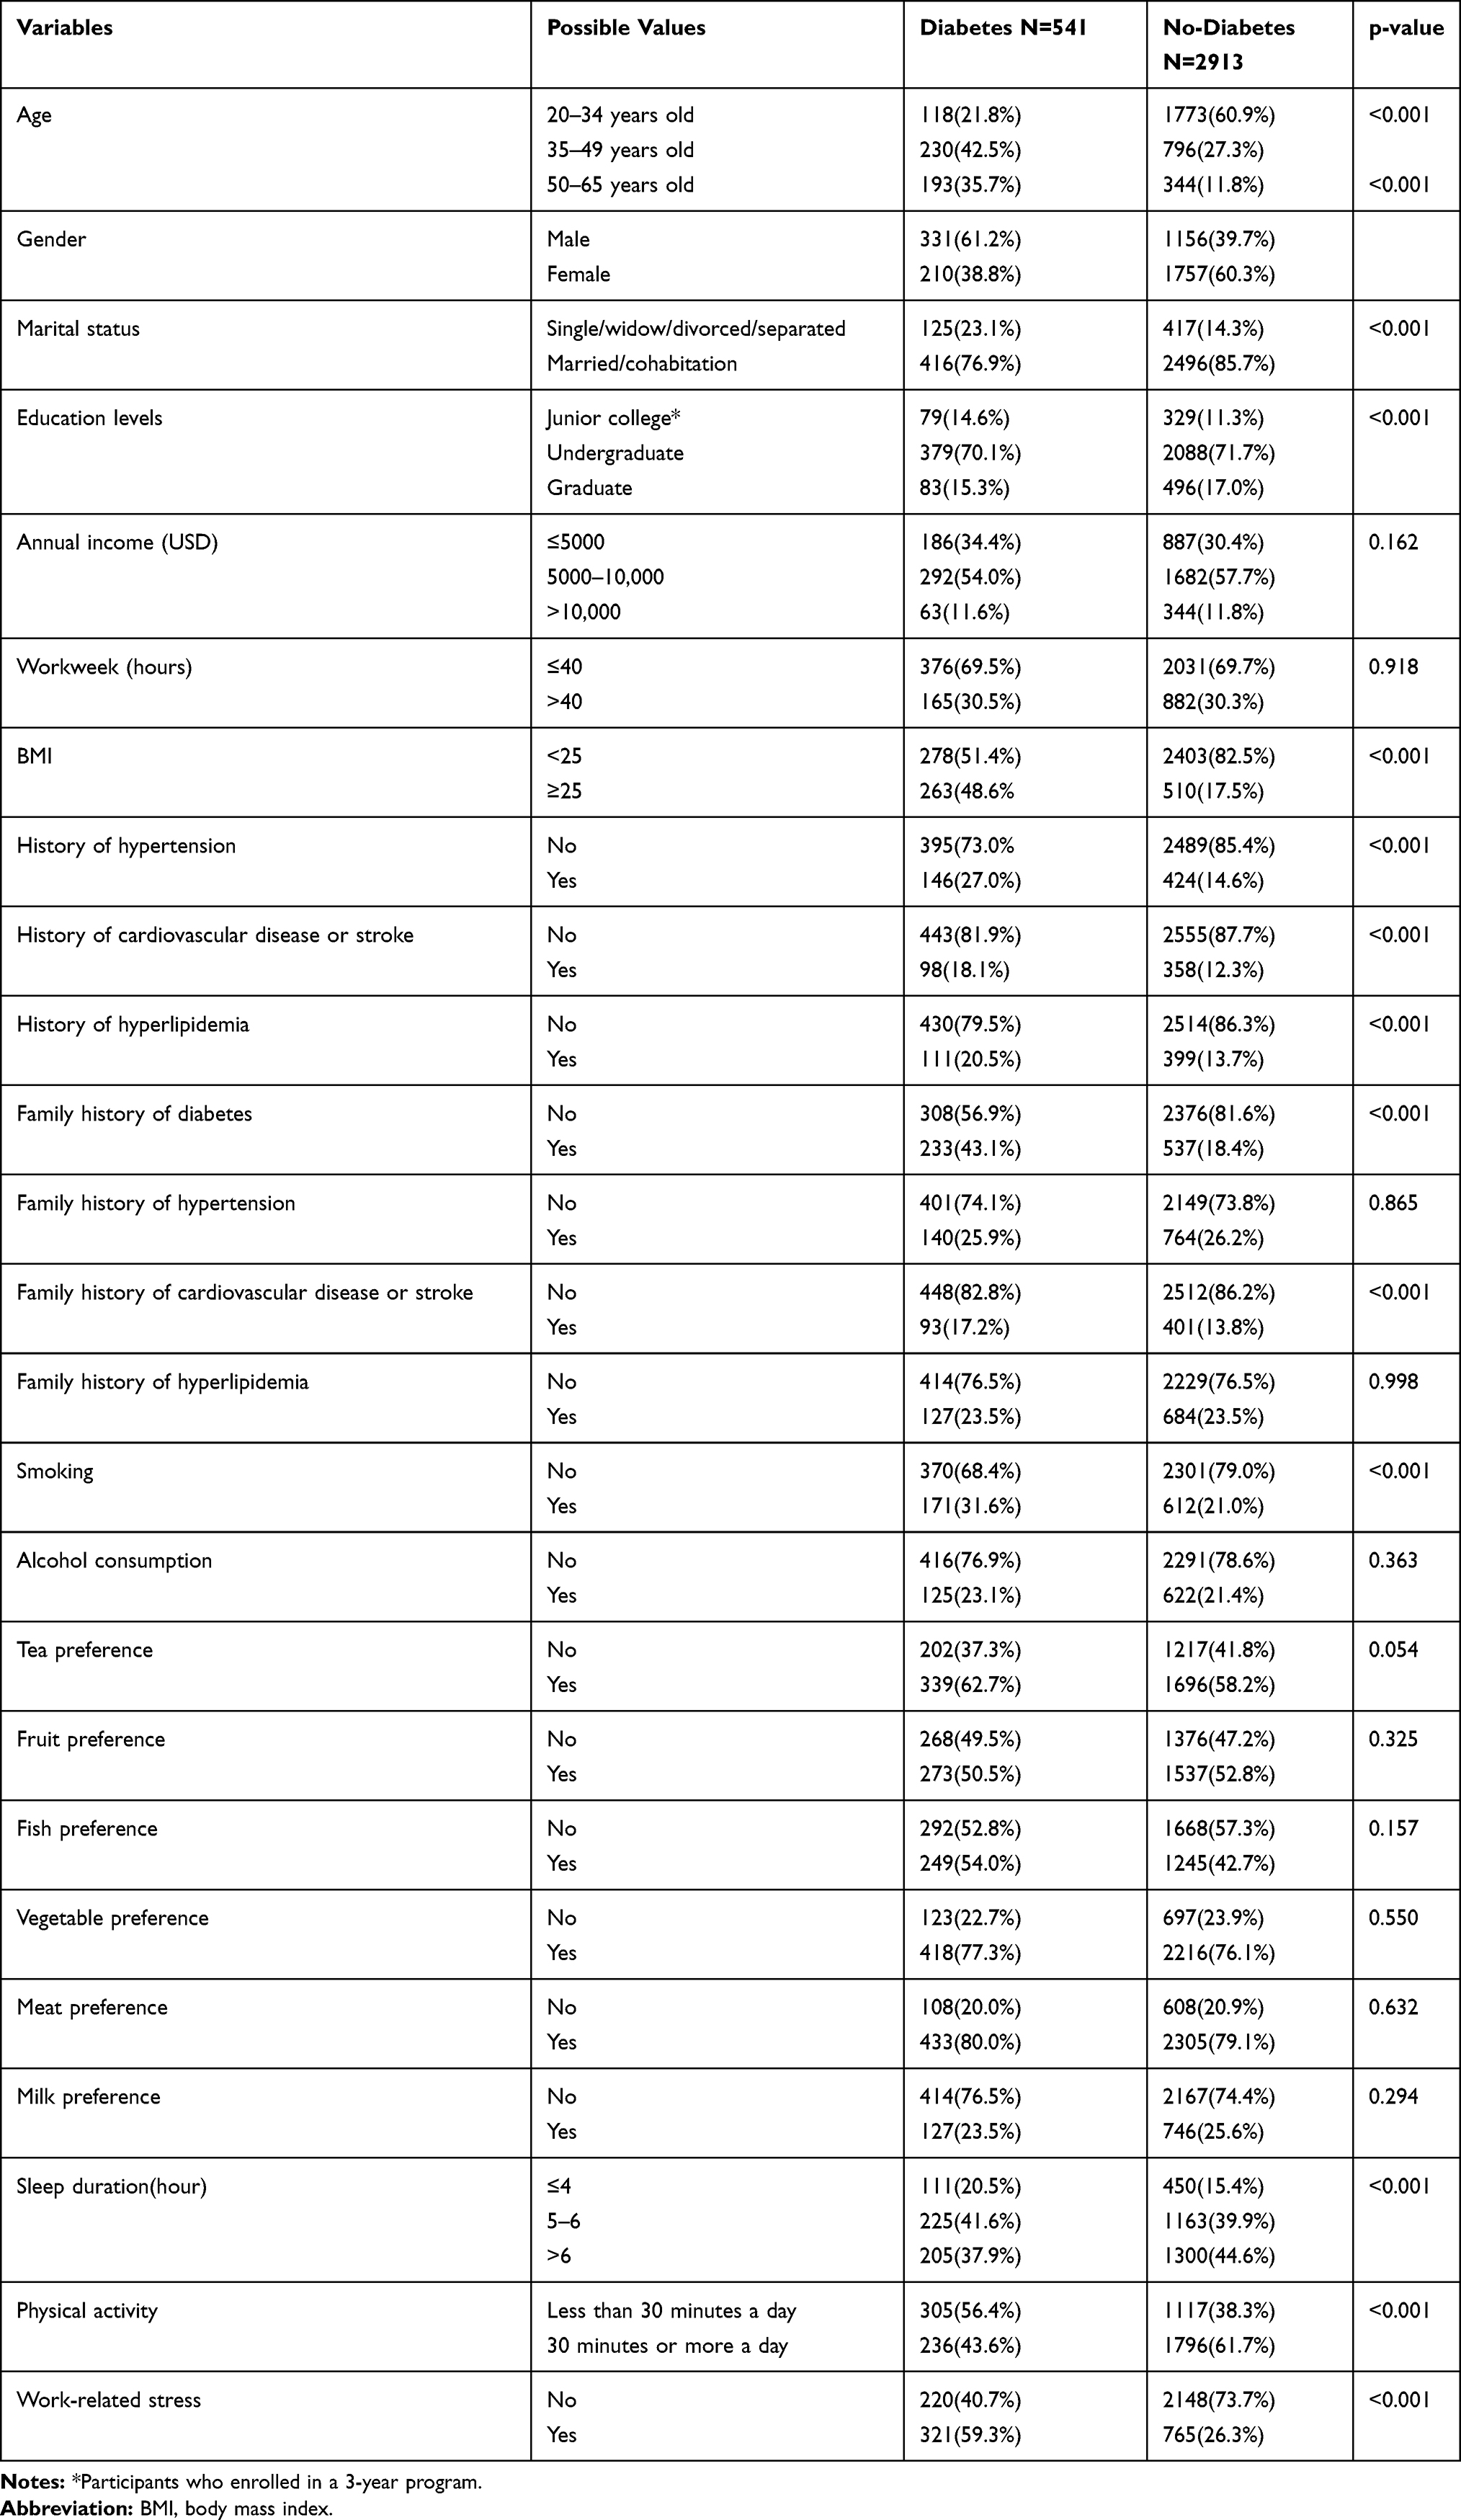 |
Table 1 Characteristics of Variables of the Study Participants |
All the variables that were significantly different between diabetes and non-diabetes participants were considered as input variables. The dependent variable (output variable) was a binary categorical variable with two categories: 0 and 1, where 0 equals normal and 1 represents either diabetes or prediabetes. The independent variables (input variables) consist of the 14 risk factors that were statistically significant on the Chi-square test. They were age, gender, marital status, educational level, BMI, history of hypertension, cardiovascular disease or stroke, history of hyperlipidemia, family history of diabetes, cardiovascular disease or stroke, smoking, sleep duration, physical activity levels and work-related stress.
In this study, the dataset was randomly divided into two datasets: the training dataset containing about 70% of the participants (2420 cases), and the testing dataset containing 30% of the participants (1034 cases). The estimation model is first constructed on the data from the training dataset and then tested on the testing dataset.20 The tree was subsequently built from the training data. In the decision tree, the first variable (root) was the most important factor and the variables orderly split away from the root were the next important factors in classifying the data.21 All the variables in one path were considered as predictors (If part) and the class label of the leaf node was an expected outcome (Then part). To avoid over-fitting and maintain parsimony, the model that generated by tree may be pruned by removing the nonessential terminal branches based on the defined algorithms without affecting the classification accuracy.21,22
Model Evaluation
In this study “person with diabetes” was defined as positive event and “person without diabetes” was defined as negative event. The confusion matrix for two classes was used to extract true positives, true negatives, false positives and false negatives, respectively. We used Accuracy, Precision and Recall to measure the performance of the model.
Results
Clinical Characteristics of the Study Participants
A total of 3454 records (1967 females and 1487males) were selected for this analysis, which included 541 (15.66%) diabetes diagnoses and 2913 (84.33%) normal patients. The clinical characteristics of the study participants and Pearson Chi-square test results between two groups are shown in Table 1. Among them, annual income (p = 0.162), weekly work time (p = 0.918), family history of hypertension (p = 0.865), hyperlipidemia (p = 0.998), alcohol consumption (p = 0.363), tea preference (p = 0.054), fruit preference (p = 0.325), fish preference (p = 0.157), vegetable preference (p = 0.550), meat preference (p = 0.632), and milk preference (0.294) had no statistical significance. However, all other 14 factors exhibited statistically significant differences between the two groups (p< 0.05) as shown in Table 1.
Outcomes of the Model
Data were divided into a training dataset (70% of the total, N = 2420) and testing dataset (the remaining 30%, N = 1034). In the model, 14 variables were used as input variables. The model was further evaluated for its accuracy by applying a confusion matrix analysis on the testing dataset. The model was evaluated based on Accuracy, Precision and Recall. Table 2 shows the results in a tabular format.
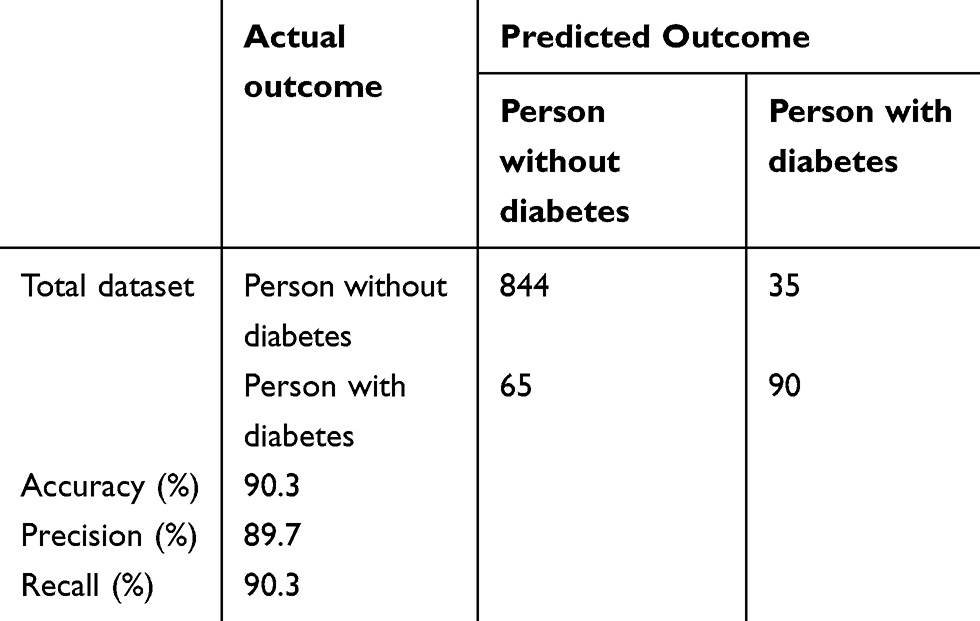 |
Table 2 Confusion Matrix of Test Dataset |
This estimation model had an accuracy of 90.3%, 934 out of 1034individuals were correctly classified, whereas only 9.7% (100 out of 1034 individuals) was incorrectly classified. Table 3 presents the performance of all classifiers, and shows that J48 exhibits better results than others (accuracy=0.903, precision=0.897, recall=0.903, F-measure=0.899, and AUC=0.872).
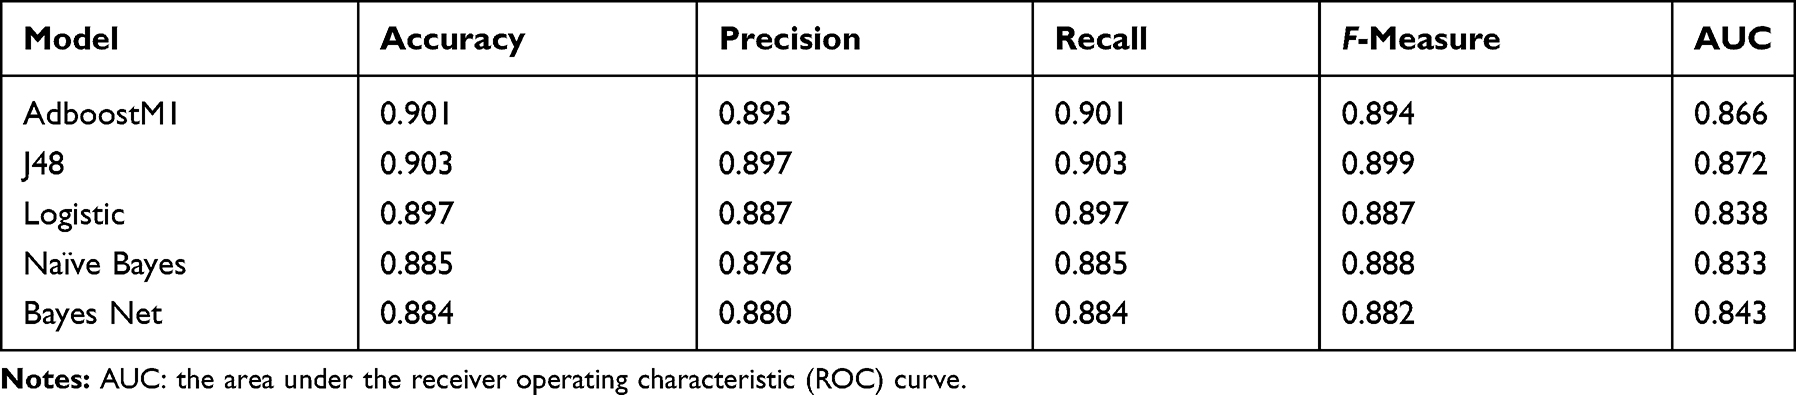 |
Table 3 The Results of Classification Algorithms |
Decision Tree and Rules for Constructing the Decision Tree
As shown in Figure 2, the decision-tree in the rules-based with a predictive manner was constructed based on 14 input variables of the participants and the IF-THEN rules or statements consisting of a condition and an estimation within the model are fully described in Box 1. With BMI being the feature value or the root classifier, this model consists of 10 layers with 40 nodes and 20 leaves to visualize all possible outcomes. After the many splits upon introducing additional and highly relevant input variables, the decision list became more complicated and exhaustive but revealed more distinctive interactions among the different input variables under a similar circumstance with the distinctive outcomes, which are highly visible with good predictive values.
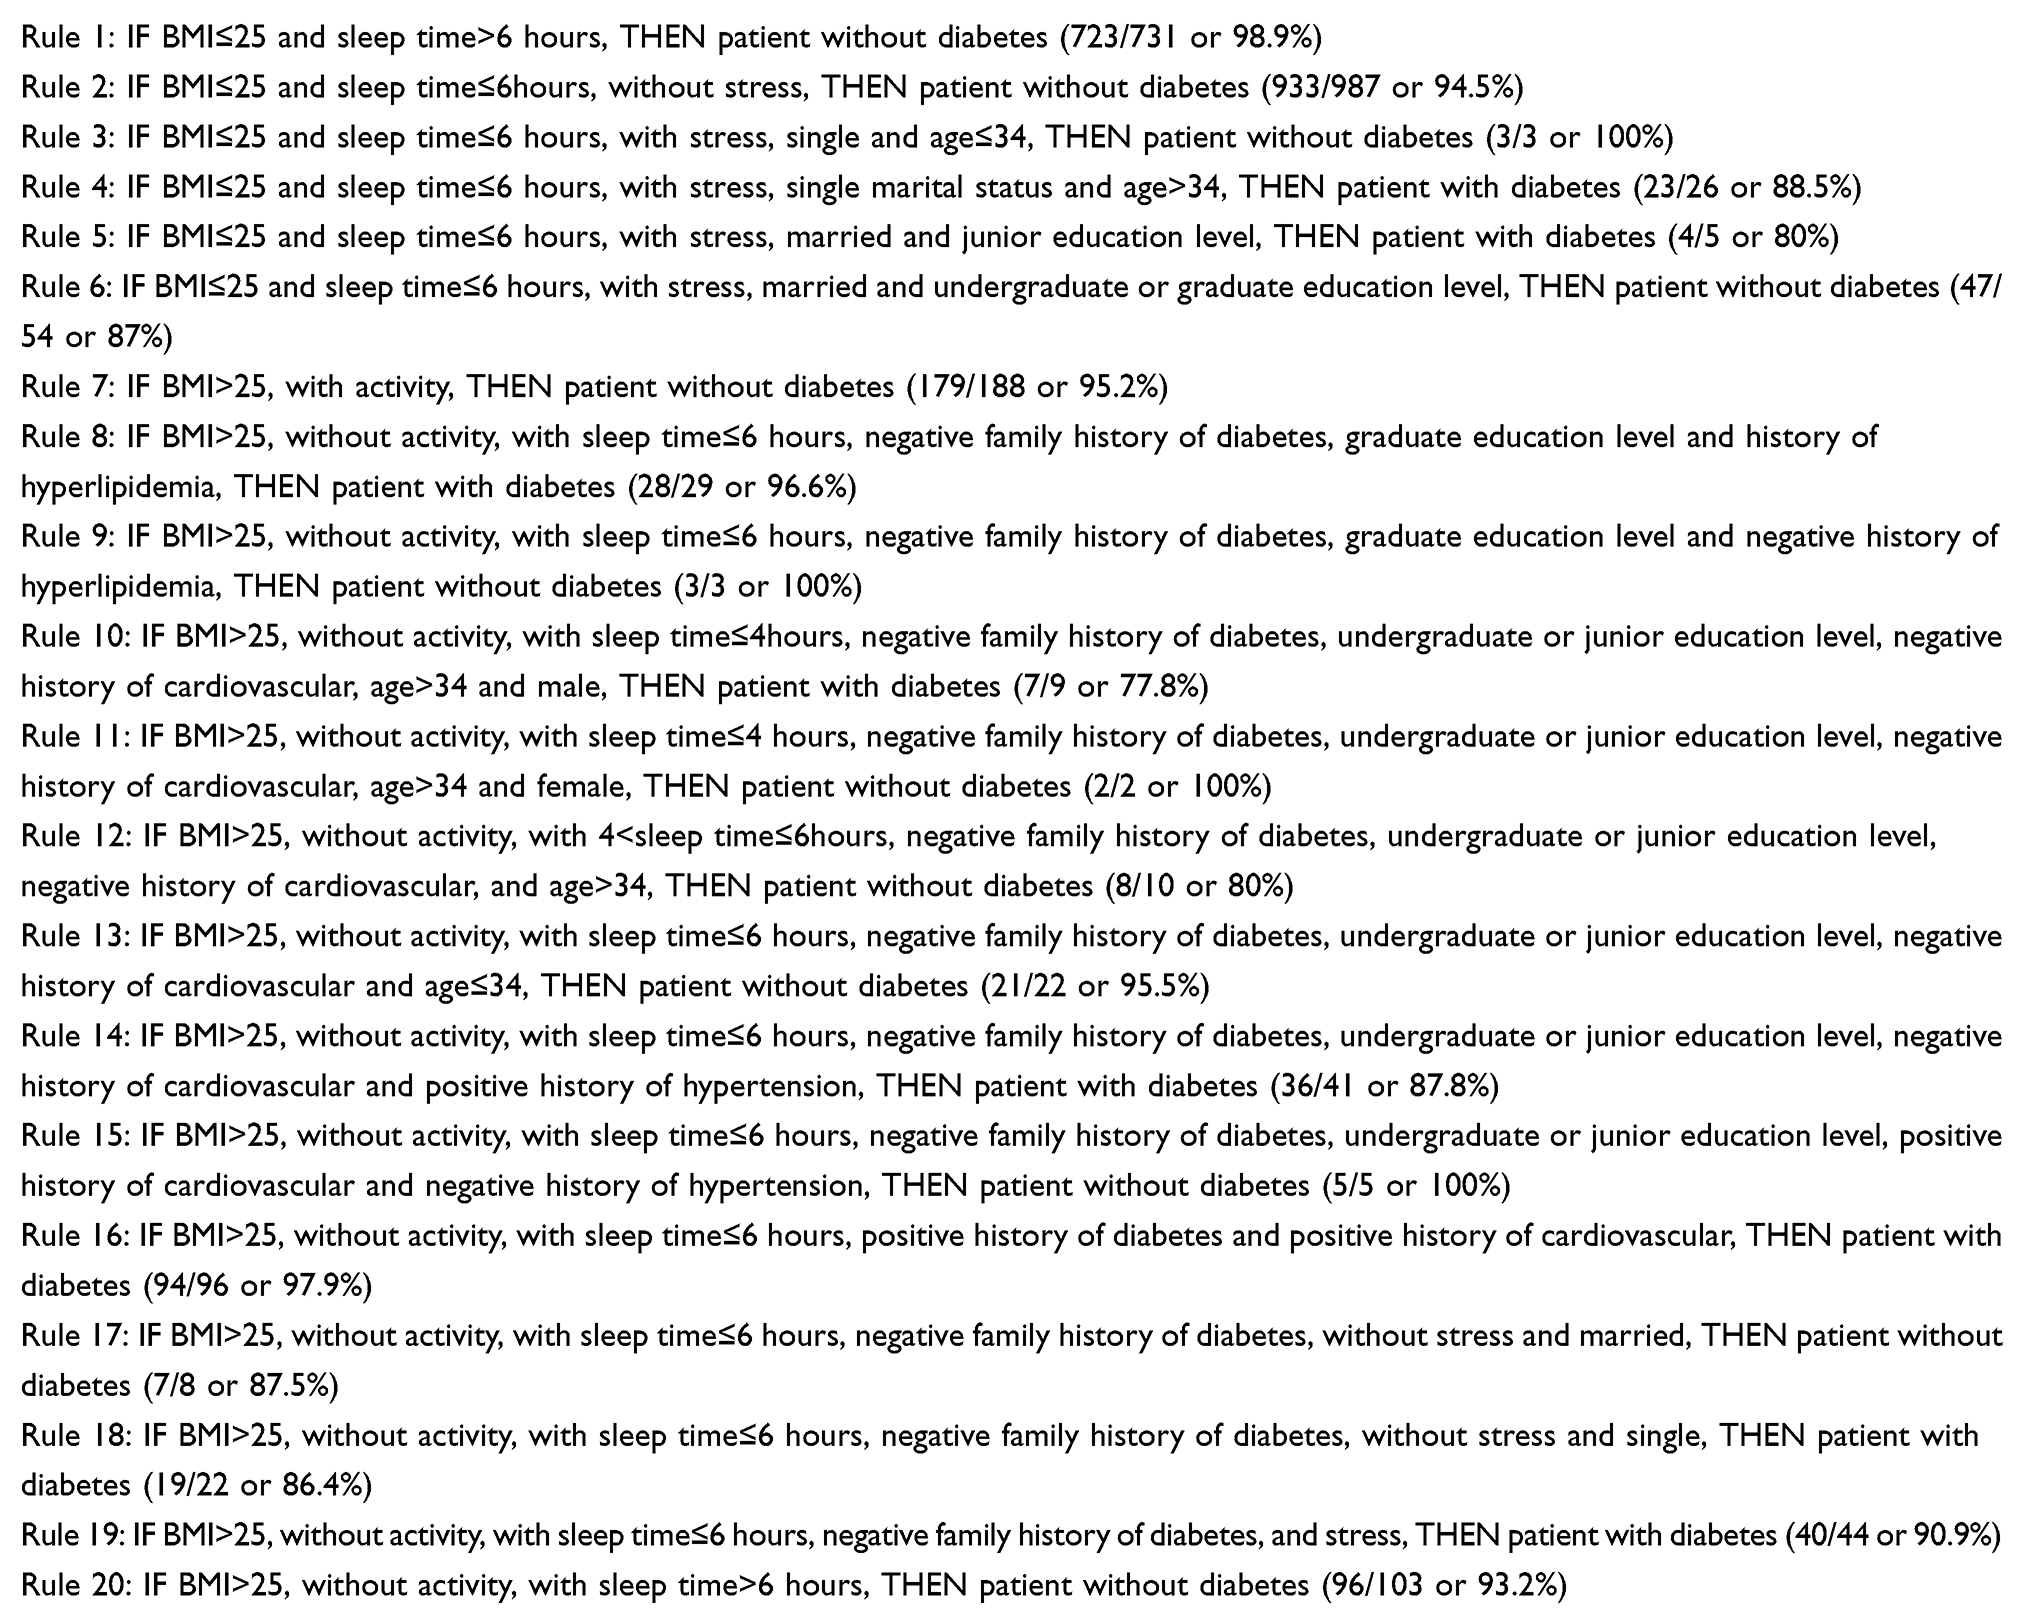 |
Box 1 A List of the 20 Rules Used for Constructing the Decision Tree |
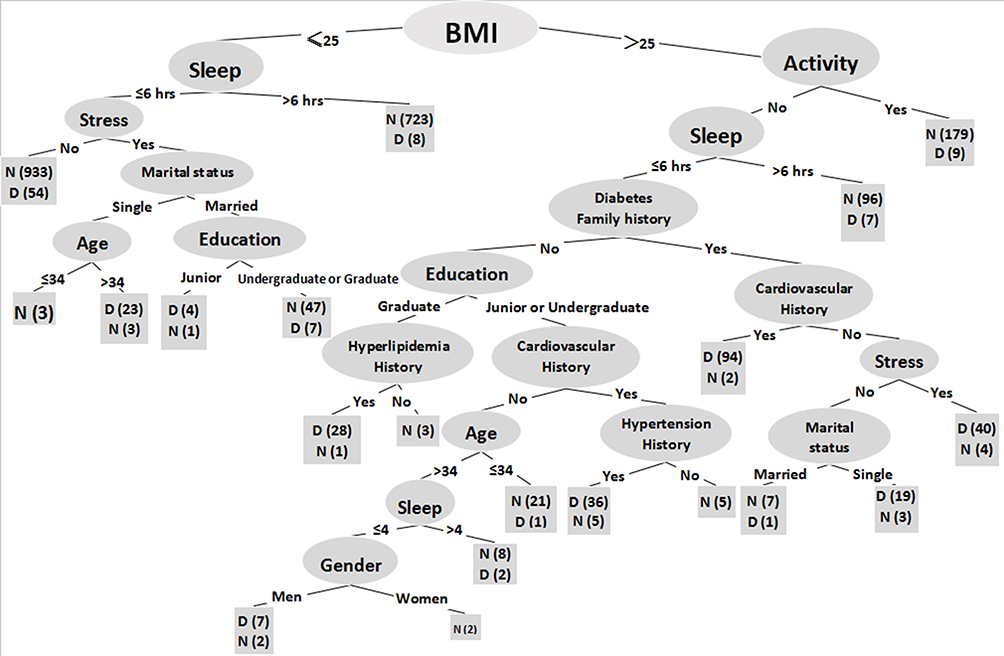 |
Figure 2 Graphical representation of the decision tree model of dataset. Sample sizes were devoted in the brackets for each node. |
Discussion
In this study, a decision-tree model was built based on a large dataset collected from a Chinse population with high risk for diabetes with the promising outcomes of prevention of diabetes. By having factored 14 key variables, which were traditionally considered the cardinal risk factors for diabetes, into the sensitive decision-tree model for the prediction of the potential of development of diabetes, this decision-tree approach or model yielded invaluable as well as novel information critically linked with pre-diabetes conditions. The likelihood of developing diabetes in an adult Chinese population was explored at the level of the interactive effect of multiple risk factors. In addition, a high accuracy of 90.3% coupled with balanced precision (89.7%) and recall (90.3%), strongly argues for a favorable fitness of our model in identifying those risk but modifiable factors such as BMI, exercise and smoking, etc., constituting the novelty of the present study.
To the best of our knowledge, this is the first study on the application of the decision-tree based algorithm assisted with data mining techniques on a lager database of diabetes exclusively collected from an adult Chinese population. As one of the key components of machine learning approaches to the sophisticated dataset analyses, a significant aspect of the decision tree modelling is to integrate different input variables or many predictors into a dynamic algorithm to search for those variables critical for disease such as diabetes. Indeed, our finding not only highlights the ability to foresee a future modification in health conditions in an individual prone to diabetes but also the feasibility of this model could easily expand to include other chronic diseases such as cardiovascular disorders and cancers.
Although diabetes can be effectively managed therapeutically and by diet controls and exercise, the development of life-threatening compilations and the huge costs of long-term care impinged upon diabetics and medical care system prioritizes the importance of the prevention of diabetes, and an early detection of diabetes impacts on the outcome of disease dramatically. It has been well known that there are many risk factors of diabetes such as smoking, hypertension, obesity, regular activity level, daily consumption of various foods and so on, and the detection and modifications of these risk factors with diabetes reduction have been proposed.23–25 Although most of the risk factors appear to be similar in male and female in various age groups, disparity in risk factors do exist. Lack of proper identification of a stronger risk factor by giving consideration to multiple factors in a systemic analysis manner usually hindered the implementation of a more rigorous, effective method of prevention. To this end, our finding provides novel evidence to focus on the modification of the risk factor that could exert its stronger influence on the outcome of a disease. For instance, our results indicate that, among all important 14 variables examined, BMI stood out from all the variables as the predictive factor which could play a dominate role in the potential development of diabetes. It highlights the fact that, by simply reducing BMI itself, a favorable outcome of diabetes prevention is achievable in most participants. This has a practical significance in a community-based medical care system owing to its universal accessibility to any patient with strong motivation or incentive to control their BMI by all means. Next to BMI, both sleep duration and physical activity also demonstrated as significant contributors to the development of diabetes and their interactions with BMI, when introduced into the algorithm as input variables, further revealed that modification of the concomitant risk factors leads to a much better outcome of diabetes prevention by targeting the critical risk factors. This finding is prominent and could pave the way to reduce risk factors and develop more cost-effective measures to deal with diabetes effectively. Moreover, the remaining variables such as age, gender, marital status, education levels, history of hypertension, history of cardiovascular disease or stroke, history of hyperlipidemia, family history of diabetes, family history of cardiovascular disease or stroke, smoking, and work-related stress, each along or in conjunction with others, are also invaluable elements attributed to formulating an early prediction of diabetes even prior to beginning the expensive laboratory tests.
One of the strengths of the present study is its ability to explore the likelihood of having diabetes in an individual with one or more risk factors. For example, the participants with BMI being less than 25 and more than 6 hours in sleep are 98.9% free of diabetes, indicating a low BMI and an adequate amount of sleep time carry the lowest risk for having diabetes as demonstrated in the rule 1 under our study conditions. However, after the work-related stress factor was introduced into the same scenario, it was 94.5% of participants with diabetes free seen under the rule 2, or there is a slight increase in diabetes from those participants presenting signs of stress in the same scenario. In contrast, the risk for having diabetes in their life could increase with introducing more risk factors into the vignette even if BMI is still kept below 25; this was evident in those participants with BMI kept less than 25 but spent less time in sleep, stressed out and slightly older, about 88.5% (23/26) participants under these circumstances might develop diabetes (see the rule 4). Furthermore, as suggested by the rules for constructing decision tree model, the results derived from the rules 1 and 2 (see Box 1) strongly argue for the point that a favorable goal of prevention of diabetes by modifying one or a combination of several key elements of one’s life styles could be reached.
By capturing the interactive effect of the predictive risk factors on the outcome of a prediction further revealed an inherent relationship of multiple predictors when considered collectively. Such an inherent relationship or interactive effect further enhances the accuracy of the assessment of the contributions of each risk factor to predict whether a participant should be considered high risk for development of diabetes in his or her life. As suggested by the rules where multiple risk factors are concomitantly considered, a decision to accurately predict patients with diabetes could be reached, therefore, an effective measure aiming to reduce the influences of the risk factors on an individual health could be initiated accordingly.
Indeed, several large-scale trials have demonstrated the benefits of preventing diabetes with simple lifestyle modifications.17,18,26–29 As reported in Tuomilehto’s study,28 the overall incidence of type 2 diabetes was reduced by 58% by changes in the lifestyles in those women and men at high risk for the disease. Hence, the risk factors identified as the key features in the decision-tree structure consolidate the notion that diabetes prevention could be achieved through simple lifestyle changes which could be accomplished without great difficulty even in a community-based setting for people in various age group. Moreover, our current findings could be helpful in making the policy of prevention efforts of diabetes in a community basis.
This study was not without limitations. Since this study was solely based on Chinese participants the interpretation of the finding should be cautious and the limit of generalizability of the findings should be considered. Therefore, the results should be validated in future studies in which participants with different ethnic and genetic background should be involved. Additionally, the substantial findings generated from the decision tree which was built upon only 14 key input variables pertinent to diabetes risk are overwhelmingly solid, however, the nature of the complexity of and the causes of diabetes certainly calls for investigating the interactive and integrative effects of all minor and major risk factors to make a much more accurate prediction.
Conclusion
As a promising approach to stratify the risk factors of diabetes in a large data set, the outcomes of decision tree modelling translates the risk factors to the development of preventive strategies. The integration of 14 prominent input variables with predictive potential into this powerful analytical algorithm results in the optimal selection of a stronger risk factor amongst many other risk factors. By focusing on the modifications of these prominent risk factors, it facilitates diabetes prevention and management and reduces the costs to patients and medical care systems.
Abbreviations
BMI, body mass index; WHO, World Health Organization; SPSS, Statistical Package for Social Sciences; WEKA, Waikato Environment for Knowledge Analysis; T2DM, type 2 diabetes mellitus.
Data Sharing Statement
The datasets used and analyzed in the present study could be available from the corresponding author upon a reasonable request.
Ethics Approval and Consent to Participate
This human study was approved by Shengjing Hospital of China Medical University Ethics Committee (ref. Ethics 2017PS42K). All participants in this study received informed consent and agreed to participate in the study. This study complied with the Declaration of Helsinki.
Acknowledgments
We are grateful to Lincoln C. Chen, president of China Medical Board, for supporting this work and researchers.
Author Contributions
All authors made a significant contribution to the work reported, whether that is in the conception, study design, execution, acquisition of data, analysis and interpretation, or in all these areas; took part in drafting, revising or critically reviewing the article; gave final approval of the version to be published; have agreed on the journal to which the article has been submitted; and agree to be accountable for all aspects of the work.
Funding
This study was funded by China Medical Board under the grant number #15-219.
Disclosure
All authors declare that they have no conflicts of interests.
References
1. Global Burden of Metabolic Risk Factors for Chronic Diseases Collaboration. Cardiovascular disease, chronic kidney disease, and diabetes mortality burden of cardiometabolic risk factors from 1980 to 2010: a comparative risk assessment. Lancet Diabetes Endocrinol. 2014;2(8):634–647. doi:10.1016/S2213-8587(14)70102-0
2. Seuring T, Archangelidi O, Suhrcke M. The economic costs of type 2 diabetes: a global systematic review. Pharmacoeconomics. 2015;33(8):811–831. doi:10.1007/s40273-015-0268-9
3. Organization WH. Global report on diabetes 2016. http://apps.who.int/iris/bitstream/10665/204871/1/9789241565257_eng.pdf.
4. Hossain P, Kawar B, El Nahas M. Obesity and diabetes in the developing world–a growing challenge. N Engl J Med. 2007;356(3):213–215. doi:10.1056/NEJMp068177
5. Groop L. Genetics and neonatal diabetes: towards precision medicine. Lancet. 2015;386(9997):934–935. doi:10.1016/S0140-6736(15)61428-3
6. Hadaegh F, Bozorgmanesh MR, Ghasemi A, Harati H, Saadat N, Azizi F. High prevalence of undiagnosed diabetes and abnormal glucose tolerance in the Iranian urban population: tehran lipid and glucose study. BMC Public Health. 2008;8:176. doi:10.1186/1471-2458-8-176
7. Jahani M, Mahdavi M. Comparison of predictive models for the early diagnosis of diabetes. Healthc Inform Res. 2016;22(2):95–100. doi:10.4258/hir.2016.22.2.95
8. Lélis VM, Guzmán E, Belmonte MV. A statistical classifier to support diagnose meningitis in less developed areas of Brazil. J Med Syst. 2017;41(9):145. doi:10.1007/s10916-017-0785-5
9. Federation ID. IDF diabetes atlas seventh edition. http://www.diabetesatlas.org/across-the-globe.html.,2015.
10. Organization WH 2008–2013 action plan for the global strategy for the prevention and control of non-communicable disease. https://apps.who.int/iris/bitstream/handle/10665/94384/9789241506236_eng.pdf;jsessionid=AAACAA9C0607BDB7BBA4BB517037C94C?sequence=1.
11. Sicree RA, Zimmet PZ, King HO, Coventry JS. Plasma insulin response among nauruans. Prediction of deterioration in glucose tolerance over 6 yr. Diabetes. 1987;36(2):179–186. doi:10.2337/diab.36.2.179
12. NCD Risk Factor Collaboration (NCD-RisC). Worldwide trends in diabetes since 1980: a pooled analysis of 751 population-based studies with 4.4 million participants. Lancet. 2016;387(10027):1513–1530. doi:10.1016/S0140-6736(16)00618-8
13. Ekins S, Clark AM, Dole K, et al. Data mining and computational modeling of high-throughput screening datasets. Methods Mol Biol. 2018;1755:197–221.
14. Sumathi A, Meganathan S. Semi supervised data mining model for the prognosis of pre-diabetic conditions in type 2 Diabetes Mellitus. Bioinformation. 2019;15(12):875–882. doi:10.6026/97320630015875
15. Pei D, Zhang C, Quan Y, Guo Q. Identification of potential type ii diabetes in a chinese population with a sensitive decision tree approach. J Diabetes Res. 2019;2019:4248218. doi:10.1155/2019/4248218
16. Fernández L, Mediano P, García R, Rodríguez JM, Risk Factors MM. Predicting infectious lactational mastitis: decision tree approach versus logistic regression analysis. Matern Child Health J. 2016;20(9):1895–1903. doi:10.1007/s10995-016-2000-6
17. Choi SB, Kim WJ, Yoo TK, et al. Screening for prediabetes using machine learning models. Comput Math Methods Med. 2014;2014:618976. doi:10.1155/2014/618976
18. Meng XH, Huang YX, Rao DP, Zhang Q, Liu Q. Comparison of three data mining models for predicting diabetes or prediabetes by risk factors. Kaohsiung J Med Sci. 2013;29(2):93–99. doi:10.1016/j.kjms.2012.08.016
19. Worachartcheewan A, Nantasenamat C, Isarankura-Na-Ayudhya C, Pidetcha P, Prachayasittikul V. Identification of metabolic syndrome using decision tree analysis. Diabetes Res Clin Pract. 2010;90(1):e15–18. doi:10.1016/j.diabres.2010.06.009
20. Al-Turaiki I, Alshahrani M, Almutairi T. Building predictive models for MERS-CoV infections using data mining techniques. J Infect Public Health. 2016;9(6):744–748. doi:10.1016/j.jiph.2016.09.007
21. Ramezankhani A, Pournik O, Shahrabi J, Khalili D, Azizi F, Hadaegh F. Applying decision tree for identification of a low risk population for type 2 diabetes. Tehran lipid and glucose study. Diabetes Res Clin Pract. 2014;105(3):391–398. doi:10.1016/j.diabres.2014.07.003
22. Samanta B, Bird GL, Kuijpers M, et al. Prediction of periventricular leukomalacia. Part I: selection of hemodynamic features using logistic regression and decision tree algorithms. Artif Intell Med. 2009;46(3):201–215. doi:10.1016/j.artmed.2008.12.005
23. Carbone S, Del Buono MG, Ozemek C, Lavie CJ. Obesity, risk of diabetes and role of physical activity, exercise training and cardiorespiratory fitness. Prog Cardiovasc Dis. 2019;62(4):327–333. doi:10.1016/j.pcad.2019.08.004
24. Weickert MO, Pfeiffer A. Impact of dietary fiber consumption on insulin resistance and the prevention of type 2 diabetes. J Nutr. 2018;148(1):7–12. doi:10.1093/jn/nxx008
25. Kim JH, Noh J, Choi JW, Park EC. Association of education and smoking status on risk of diabetes mellitus: a population-based nationwide cross-sectional study. Int J Environ Res Public Health. 2017;14:6. doi:10.3390/ijerph14060655
26. Li G, Zhang P, Wang J, et al. The long-term effect of lifestyle interventions to prevent diabetes in the china da qing diabetes prevention study: a 20-year follow-up study. Lancet. 2008;371(9626):1783–1789. doi:10.1016/S0140-6736(08)60766-7
27. Saaristo T, Moilanen L, Korpi-Hyövälti E, et al. Lifestyle intervention for prevention of type 2 diabetes in primary health care: one-year follow-up of the finnish national diabetes prevention program (FIN-D2D). Diabetes Care. 2010;33(10):2146–2151. doi:10.2337/dc10-0410
28. Tuomilehto J, Lindström J, Eriksson JG, et al. Prevention of type 2 diabetes mellitus by changes in lifestyle among subjects with impaired glucose tolerance. N Engl J Med. 2001;344(18):1343–1350. doi:10.1056/NEJM200105033441801
29. Anderson AE, Kerr WT, Thames A, Li T, Xiao J, Cohen MS. Electronic health record phenotyping improves detection and screening of type 2 diabetes in the general United States population: A cross-sectional, unselected, retrospective study. J Biomed Inform. 2016;60:162–168. doi:10.1016/j.jbi.2015.12.006
 © 2020 The Author(s). This work is published and licensed by Dove Medical Press Limited. The full terms of this license are available at https://www.dovepress.com/terms.php and incorporate the Creative Commons Attribution - Non Commercial (unported, v3.0) License.
By accessing the work you hereby accept the Terms. Non-commercial uses of the work are permitted without any further permission from Dove Medical Press Limited, provided the work is properly attributed. For permission for commercial use of this work, please see paragraphs 4.2 and 5 of our Terms.
© 2020 The Author(s). This work is published and licensed by Dove Medical Press Limited. The full terms of this license are available at https://www.dovepress.com/terms.php and incorporate the Creative Commons Attribution - Non Commercial (unported, v3.0) License.
By accessing the work you hereby accept the Terms. Non-commercial uses of the work are permitted without any further permission from Dove Medical Press Limited, provided the work is properly attributed. For permission for commercial use of this work, please see paragraphs 4.2 and 5 of our Terms.