")
Back to Journals » Infection and Drug Resistance » Volume 14
Estimating the Effects of the COVID-19 Outbreak on the Reductions in Tuberculosis Cases and the Epidemiological Trends in China: A Causal Impact Analysis
Authors Ding W, Li Y, Bai Y , Li Y, Wang L, Wang Y
Received 7 September 2021
Accepted for publication 22 October 2021
Published 6 November 2021 Volume 2021:14 Pages 4641—4655
DOI https://doi.org/10.2147/IDR.S337473
Checked for plagiarism Yes
Review by Single anonymous peer review
Peer reviewer comments 2
Editor who approved publication: Professor Suresh Antony
Wenhao Ding,1,* Yanyan Li,1,* Yichun Bai,1 Yuhong Li,2 Lei Wang,3 Yongbin Wang1
1Department of Epidemiology and Health Statistics, School of Public Health, Xinxiang Medical University, Xinxiang, Henan Province, People’s Republic of China; 2National Center for Tuberculosis Control and Prevention, China Center for Disease Control and Prevention, Beijing, People’s Republic of China; 3Center for Musculoskeletal Surgery, Charité–Universitätsmedizin Berlin, Corporate Member of Freie Universität Berlin, Humboldt–Universität Zu Berlin and Berlin Institute of Health, Berlin, Germany
*These authors contributed equally to this work
Correspondence: Yongbin Wang
Department of Epidemiology and Health Statistics, School of Public Health, Xinxiang Medical University, Xinxiang, Henan Province, 453000, People’s Republic of China
Email [email protected]
Objective: COVID-19 may have a demonstrable influence on disease patterns. However, it remained unknown how tuberculosis (TB) epidemics are impacted by the COVID-19 outbreak. The purposes of this study are to evaluate the impacts of the COVID-19 outbreak on the decreases in the TB case notifications and to forecast the epidemiological trends in China.
Methods: The monthly TB incidents from January 2005 to December 2020 were taken. Then, we investigated the causal impacts of the COVID-19 pandemic on the TB case reductions using intervention analysis under the Bayesian structural time series (BSTS) method. Next, we split the observed values into different training and testing horizons to validate the forecasting performance of the BSTS method.
Results: The TB incidence was falling during 2005– 2020, with an average annual percentage change of − 3.186 (95% confidence interval [CI] − 4.083 to − 2.281), and showed a peak in March–April and a trough in January–February per year. The BSTS method assessed a monthly average reduction of 14% (95% CI 3.8% to 24%) in the TB case notifications from January–December 2020 owing to COVID-19 (probability of causal effect=99.684%, P=0.003), and this method generated a highly accurate forecast for all the testing horizons considering the small forecasting error rates and estimated a continued downward trend from 2021 to 2035 (annual percentage change =− 2.869, 95% CI − 3.056 to − 2.681).
Conclusion: COVID-19 can cause medium- and longer-term consequences for the TB epidemics and the BSTS model has the potential to forecast the epidemiological trends of the TB incidence, which can be recommended as an automated application for public health policymaking in China. Considering the slow downward trend in the TB incidence, additional measures are required to accelerate the progress of the End TB Strategy.
Keywords: COVID-19, tuberculosis, BSTS, ARIMA, causal impact, nowcasting and forecasting
Introduction
Tuberculosis (TB) is an infectious disease as a result of the bacillus Mycobacterium tuberculosis infection.1 Albeit global efforts to contain the continued spreading of TB have made good progress in the past decades, with reductions of 19% and 14% in the TB incidence and death rates, respectively, between 2015 and 2019, TB is still among the top 10 causes of death across the world.2 According to the global TB report 2020, approximately 87% of the total case notifications were documented from 30 high TB burden countries. Of them, China accounted for 8.4% of the global totals (ranking the third).2 Also, drug-resistant TB has become a major public health concern in China,1 with the second-largest share (14%) of the global burden in 2019.2 Besides, the changing epidemiology of the TB-related risk factors leads to a recurring risk in some regions or countries in recent years,2,3 which has hindered the progress on track to reach 2030 and 2035 targets for 80% and 90% reductions, respectively, in the TB incidence, compared with 2015 baseline.2 Therefore, accurately estimating the temporal trajectories in the upcoming years based on effective and sufficient forecasting techniques plays an important role in informing the planning for the prevention and control of TB. However, accurate statistics for the incidence data are basic to the achievement of the accurate nowcasting and forecasting aims.
Since the occurrence of COVID-19, it has become a major global public health concern.4 To stop the ongoing spreading of COVID-19, a series of rigorous prevention and control strategies and measures have been implemented in different countries.4 In China, the effective measures to control the COVID-19 outbreak have been shown to play a pivotal role in suppressing the COVID-19 spreading.5 However, it is documented that these strict anti-contagion policies also have a demonstrable influence on disease patterns and deaths in that the health system is overburdened during the COVID-19 outbreak, leading to a reduction in non-urgent service requests.6,7 Moreover, the worry about being infected with COVID-19 and the mandatory nucleic acid testing make people reluctant to seek medical aid.8 All these could result in a decrease in case detection. Unfortunately, there is currently a paucity of evidence on how many contributions of such interventions to the TB case reductions in China. As a result, estimating the impacts of these measures on the case reductions in China is significantly interesting.
Time-series analysis is typically employed to do demand prediction for the development of prevention and control planning. Thereby, given the changing epidemiology of TB in China, the broad impacts of counter-COVID-19 measures on the disease patterns, and the attractive advantages of the Bayesian structural time series (BSTS) method,10,14 the main objectives of this study are to quantify the impacts of counter-COVID-19 measures on the reductions in the TB case notifications and to estimate whether the TB epidemics are on track to the targets by 2030 and 2035 of achieving a world free of TB using the advanced BSTS method. In the time-series analysis, the most common forecasting method is the autoregressive integrated moving average (ARIMA) model.9,10 Therefore, to test the predictive accuracy of the BSTS model, the ARIMA was also created to make a comparison with the BSTS model. Such a time-series analysis can inform some important hints to formulate effective strategies to deal with the evolving scenarios of the TB epidemics in China.
Materials and Methods
Data Collection
The monthly TB and COVID-19 case notifications from January 2005 to December 2020 were drawn from the National Notifiable Infectious Disease Surveillance System (NNIDSS) operated by the China CDC, and the population data were extracted from the Statistical Yearbook of China. A total of 16 years of data were collected and collated as the analytical time series. Typically, to build a sufficient and effective forecasting model, at least 50 observed values are used in the model-developing process.11 Given that the COVID-19 pandemic has an obvious effect on the disease patterns.8 Therefore, the TB incidence data between January 2005 and December 2019 were only used to demonstrate the forecasting potential of the BSTS approach and its suitability and sufficiency for the application in estimating the epidemiological trends of the TB incidence. To this end, the target series was divided into nine in-sample training horizons and out-of-sample validation horizons based on the periodic behaviors of the TB incidence (ie, the data between January 2005 and December 2018, between January 2005 and December 2017, between January 2005 and December 2016, between January 2005 and December 2015, between January 2005 and December 2014, between January 2005 and December 2013, between January 2005 and December 2012, and between January 2005 and December 2011 were treated as the training samples; whereas the remaining 12, 24, 36, 48, 60, 72, 84, 96, and 108 monthly data were deemed as the validation samples). Of them, the holdout 24, 48, 72, 84, and 108 periods were considered to perform sensitivity analyses to further test the predictive reliability and robustness of the BSTS model.
ARIMA Model
The full notation for an ARIMA approach is ARIMA (p, d, q) (P, D, Q)s, where p, d, and q are the orders of autoregression, integration, and moving-average involved, respectively; P, D, and Q signify the seasonal counterparts corresponding to the above-mentioned nonseasonal components, respectively.12 Usually, there are three steps (including identification, estimation and diagnosis, and forecasting) that allow searching for the best possible parameters in the ARIMA-building procedure.13 The first step is to determine the nonseasonal and seasonal parameters of the ARIMA approach. The identification of the above six key parameters needs a stationary series. Accordingly, an augmented Dickey–Fuller (ADF) test was applied to investigate the stationarity of the target series. If providing an indication of nonstationary series, differencing would be necessary until a stationary one is obtained.14 The plausible orders of nonseasonal and seasonal autoregression, integration, and moving average can then be specified according to the differenced autocorrelation function (ACF) and partial autocorrelation function (PACF). The second step is to estimate the best possible models.14 By comparing the model evaluation indices, such as Akaike information criterion (AIC), corrected AIC (CAIC), Bayesian information criterion (BIC), and Log-likelihood, the one that has a small value of AIC, CAIC, and BIC, along with a large value of Log-likelihood is expected to specify the best model. The third step is to diagnose the identified model. The model coefficients should be a statistical difference and the model residual series should not be significantly different from zero and should be without a pattern (white noise) under the ACF, PACF, and Ljung-Box Q tests.15 Once all the essential checks are passed, the TB epidemics in the years to come can be forecasted using the best ARIMA specification.
BSTS Model
In the past, studies devoting to estimating the epidemic patterns of diseases are mainly focused on the use of conventional statistical models, such as the static regression models and ARIMA model,16 and yet due to their different assumptions,17 resulting in certain limitations in applications. In general, the static regression models fit a time series in a deterministic way as the sum of its constituent latent subseries (trend, seasonality, and random fluctuation) and they are under the assumption of remaining stable over time in the epidemic patterns of diseases, which is rare in practice.16,17 ARIMA model typically produces a forecast based on the past patterns of the diseases and the preceding forecasting residuals.16 Besides, the above-mentioned methods may be over-fitting, particularly in the presence of regressors.17 Fortunately, the causal effects of the COVID-19 pandemic on the TB case reductions can be estimated using intervention analysis under the BSTS method that can produce a counterfactual forecast in a synthetic control series describing what would have taken place in the absence of these interventions during the COVID-19 outbreak.16,18–20 Compared with the classical intervention analysis of difference-in-difference, the BSTS method is capable of inferring the temporal changing patterns of potential effects, incorporating the empirical prior information on the parameters, and handling complex covariate structure.17,18 Further, this method can also accurately show the stochastic behavior of a time series and produce forecasting results based on the Bayesian model averaging over the preferred models.16,19,21 In contrast to the traditional methods, the proposed BSTS method is able to accommodate the issues encountered when performing a forecast with the static regression models and ARIMA model in that the BSTS method can allow for the time-varying model parameters, can deal with multitudes of covariates, and can present the stochastic characteristic of the target series.17,18,20 The BSTS method was developed by assembling three statistical models (including Kalman filters, Spike and slab regression, and Bayesian model averaging) into an integrated system.21 Among them, the Kalman filters were used to estimate the trend and seasonality of the target series, the Spike and slab regression was used to perform variable selection, and the Bayesian model averaging was used to make a final forecast.20 Importantly, the forecasting results under the BSTS method rarely rely on certain hypothesized specifications.17 Also, the BSTS method is capable of dealing with uncertainty in an elegant way as the posterior uncertainty of the constituent latent subseries can be quantified, the variance of the constituent latent subseries can be controlled, and the preceding beliefs on the model can be imposed.18,21 In an intervention analysis, the BSTS method can be employed to forecast the counterfactual, ie, how the outcome of interest would have evolved after the intervention if the intervention had no occurrence.18
Statistical Process
The average annual percentage change (AAPC) and annual percentage change (APC) were adopted to investigate the TB epidemic patterns during the study period, which was performed using the joinpoint regression program (Version 4.9.0.0). The ARIMA and BSTS models were constructed using R software (Version 3.4.3, The R Project for Statistical Computing, Vienna, Austria).The multiplicative decomposition technique was used to decompose the seasonal patterns of the TB epidemics.22 In making causal inferences, it is required to come to a valid conclusion under strong assumptions.23 Likewise, for the causal effect analysis using the BSTS method, it is required to design a control time series unable to be affected in the presence of interventions. Otherwise, the conclusions drawn are not convincing.23 Also, the BSTS method assumes that the association between regressors and response metric, as developed during the pre-period, is steady throughout the post-period.23 Early publications indicated that the seasonal patterns of infectious diseases can be deemed as a key predictor.24,25 The total population is related to the reported cases and remains stable under the interventions. Therefore, in analyzing the impacts of the COVID-19 outbreak on the decreases in the TB case notifications based on the BSTS model, the seasonal effect, time variable, and population data were considered as covariates.
When forecasting the TB epidemiological patterns using the BSTS model, the mean absolute deviation (MAD), root-mean-square error (RMSE), mean absolute percentage error (MAPE), mean error rate (MER), and root-mean-square percentage error (RMSPE) were used to measure the predictive accuracy.
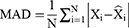
where Xi represents the monthly TB observed values, refers to the forecasting values,
 stands for the mean of the TB observed values, and N is the number of forecasts.
Results
Statistical Description
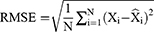
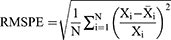
During 2005–2020, a total of 20,549,724 cases were reported with a monthly average notification of 107,030 cases, resulting in annualized and monthly average morbidity rates of 94.807 and 7.901 per 100,000 persons, respectively. Overall, a downward trend was observed in the number of TB reported cases (AAPC=−3.186, 95% CI −4.083 to−2.281; t=−6.818, P<0.001), and the variation trends seemed to undergo two stages: a slight rising from 2005 to 2008 (APC=0.577, 95% CI −3.959 to 5.329; t=0.275, P=0.789) and then a rapid reduction from 2008 to 2020 (APC=−4.105, 95% CI −4.691 to −3.516; t=15.051, P<0.001) (Figure S1). There were the maximum number of case notifications of 153,347 (115.764 per 100,000 persons) in 2008 and the minimum number of case notifications of 914,265 (65.030 per 100,000 persons) in 2020 (Figure S1). By investigating the seasonal patterns using the seasonal decomposition method, it was shown that the TB epidemics displayed an obvious seasonal fluctuation, a peak in March–April and a trough in January–February per year (Figure 1).
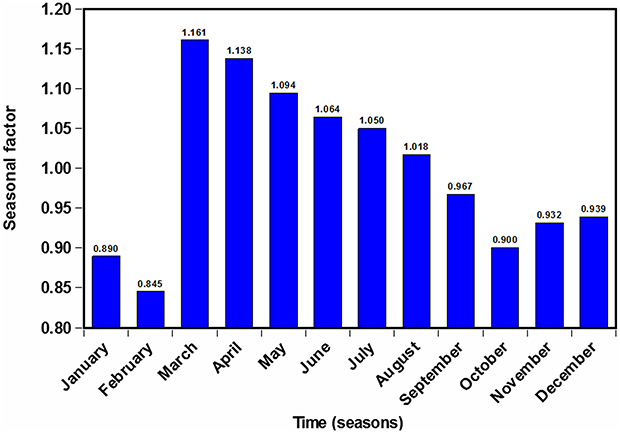 |
Figure 1 The decomposed seasonal factors for the TB morbidity series based on the multiplicative decomposition technique. The graph above shows that there is a predominant peak in March–April and a trough in January–February per year. |
Impacts of COVID-19 on the Reductions in the TB Case Notifications
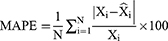
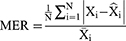
In China, strict prevention and control measures have been implemented to contain the COVID-19 spreading since January 2020, although these measures were lifted/relaxed at different stages according to the evolving scenarios.4 Therefore, the whole year of 2020 was considered as the intervention while performing an intervention analysis under the BSTS method. Then, the BSTS method predicted the expected cases under a counterfactual framework (ie, COVID-19 had never taken place), and the resulting forecasts were compared with the actual monthly notified cases. The generated expected figures are listed in Table 1, and the results indicated a monthly average reduction in the TB case notifications of 29% (95% CI 11% to 48%) from January to March 2020, 15% (95% CI 1.6% to 31%) from January to June 2020, and 14% (95% CI 3.8% to 24%) from January to December 2020 as a consequence of the COVID-19 outbreak. Importantly, the validity of the produced forecasts was investigated given posterior probabilities and probability of causal effects. What stands out in Table 1 is that posterior probabilities leading to these impacts as random events can be rejected, whereas the probabilities of causal effects can be accepted, pinpointing a significant contribution of the COVID-19 outbreak to the reductions in the TB case notifications (Figures 2 and 3).
 |
Table 1 Estimated Causal Impact of the COVID-19 Outbreak on the Decrease in the Monthly Average and Cumulative Notifications of TB Cases from January to December 2020 |
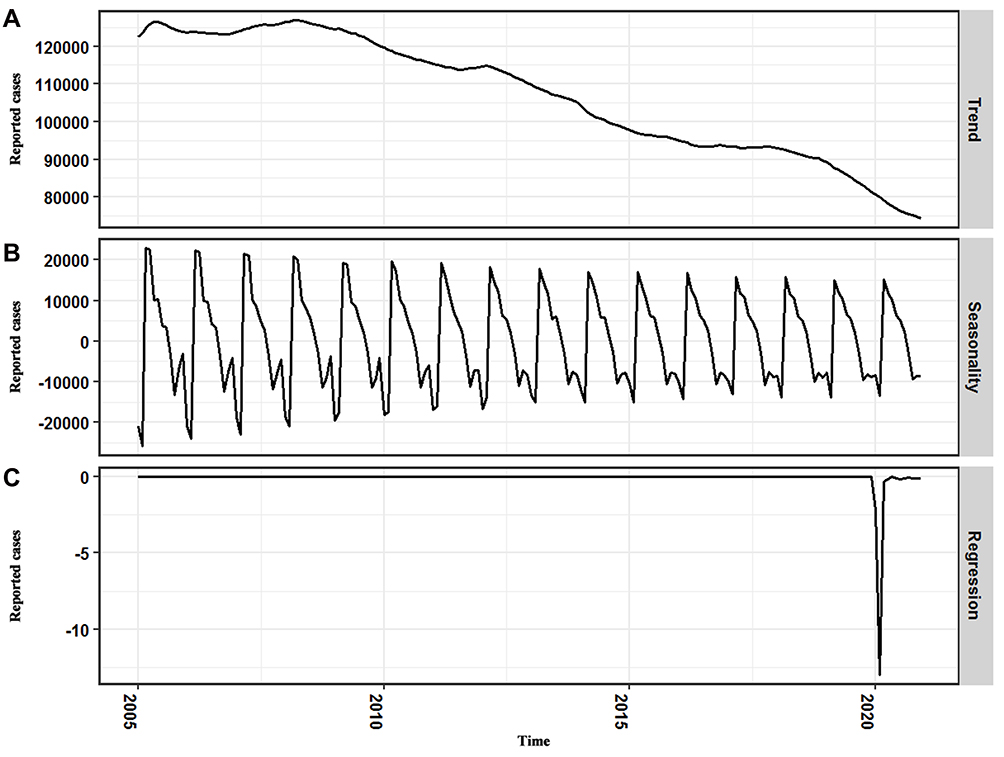 |
Figure 2 Investigation of the trend, seasonality, and regression components to the TB incidence. (A) Contribution of trend pattern. (B) Contribution of seasonal pattern. (C) Contribution of regression component. As seen, the TB incidence shows an obvious seasonal pattern and the COVID-19 outbreak leads to a notable reduction in the TB cases. |
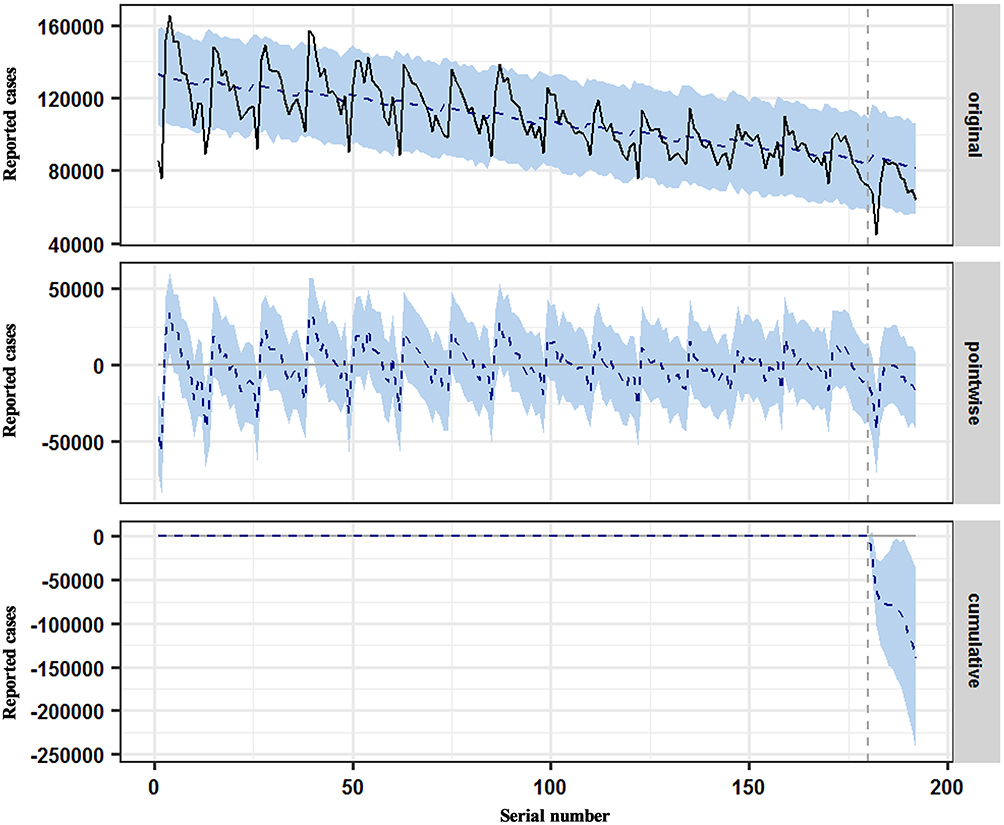 |
Figure 3 Time series plot displaying the estimated causal effects of the COVID-19 outbreak on the reductions in the TB case notifications from January to December 2020. The first panel displays the TB case notifications and counterfactual forecasted results for the post-outbreak period. The second panel describes the pointwise causal effect that suggests the difference between actual values and forecasted values. The third panel shows a cumulative effect of the COVID-19 outbreak via adding up the pointwise contributions from the second panel. |
Nowcasting and Forecasting the Epidemiological Trends
For the sake of achieving the prediction for the TB epidemic trends in the years to come, the forecasting accuracy level under the BSTS model was first examined by comparison with that under the most commonly used ARIMA model. In accordance with the modelling procedures of the ARIMA model, the ARIMA (1,0,1)(2,1,1)12, ARIMA (1,0,1)(2,1,0)12, ARIMA (0,1,1)(2,1,1)12, and ARIMA (1,0,1)(2,1,0)12 specifications were identified as being the best possible models for forecasting the 12, 36, 60, and 96 holdout periods, respectively (Table 2). The diagnostic investigations for these plausible models are reported in Table 2 and Figures S2–S5, and the resulting results indicated that the above-identified models were correctly specified. In developing the BSTS method, we found that such a BSTS method by adding a local linear trend model to the state specification was the best-suited to forecast our data. As a result, the forecasts with their 95% CI were produced by averaging across the 500 Markov Chain Monte Carlo (MCMC) draws under the BSTS method. Table 3 presents the results of MAD, RMSE, MAPE, MER, and RMSPE measuring the forecasting accuracy level under the BSTS and ARIMA methods. It was discovered that the resultant measurement metrics under the BSTS models were smaller compared with those under the ARIMA models, meaning that the forecasts under the BSTS models were in closer proximity to the observed values (Figure 4). Further, we performed sensitivity analyses based on the holdout 24, 48, 72, 84, and 108 periods, and the resultant comparative results are listed in Figures S6–S10. Likewise, the forecasting accuracy level was higher under the BSTS models than under the ARIMA models in these five sensitivity analyses (Table S1), further intimating that the BSTS model is adequate for capturing the dynamic dependency features in this time series. Therefore, to investigate whether China could be on track to reach the 2025 milestones, together with the 2030 and 2035 targets of the End TB Strategy, we added the reduced cases to the actual case notifications and then re-developing the BSTS model based on the 16 years of data to project into 2035. The forecasts are reported in Figures 5 and S11, although indicating that a downward trend in the TB incidence would go on from 2021 to 2035 (APC=−2.869, 95% CI −3.056 to −2.681; t=32.347, P<0.001), it appeared to face a great challenge to achieve the aim of a world free of TB in China.
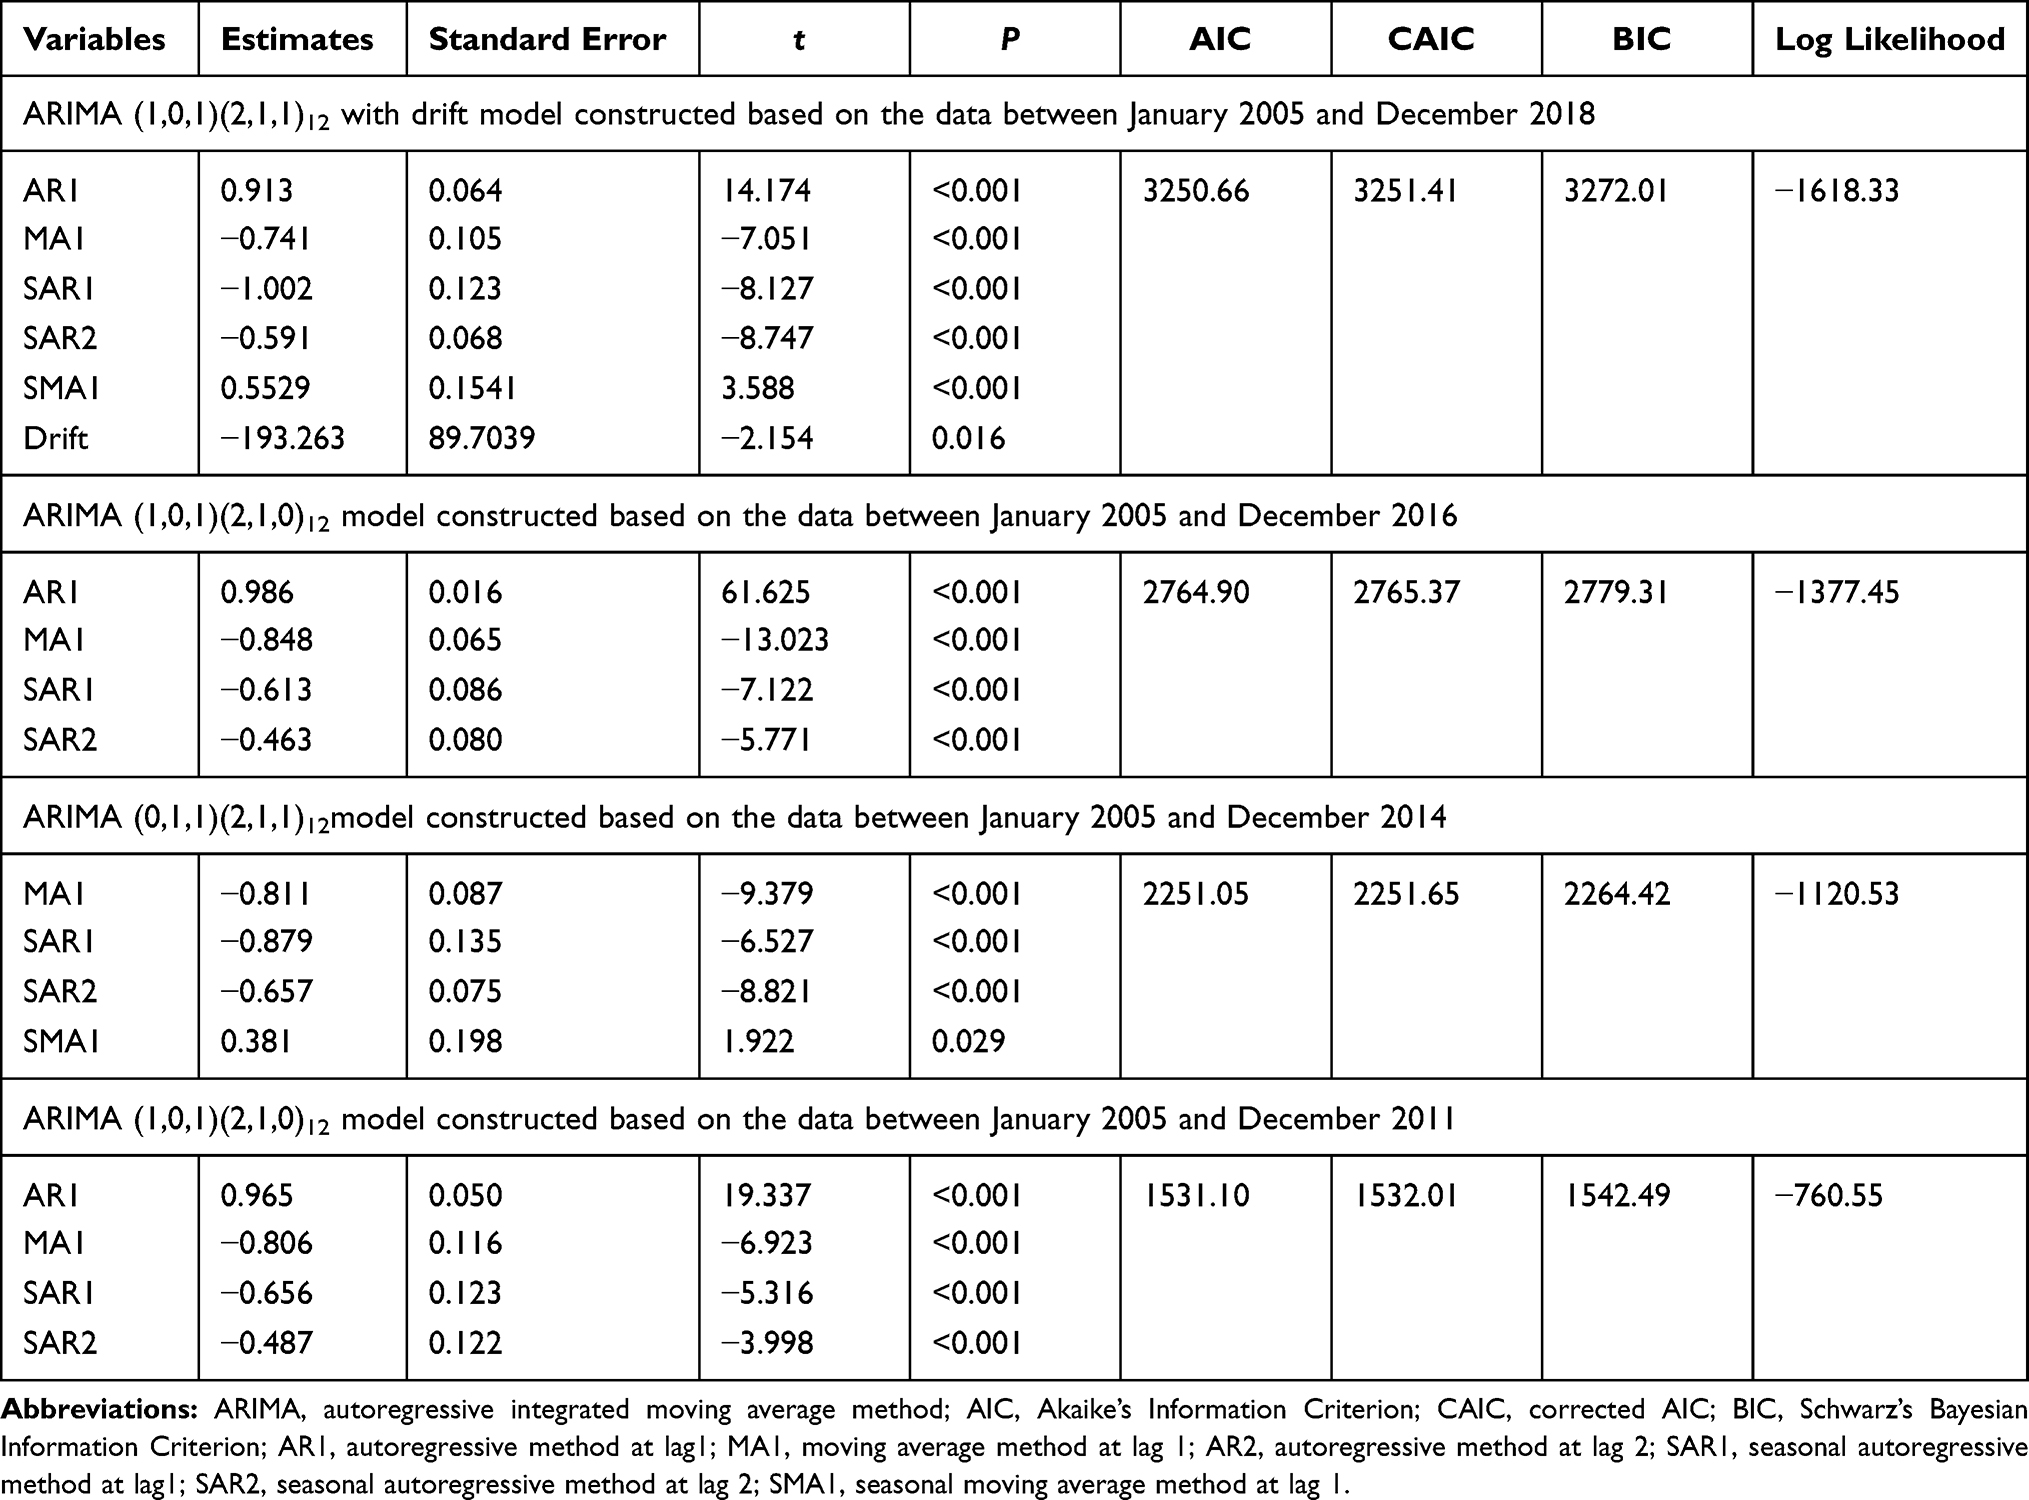 |
Table 2 The Identified Best Possible ARIMA Models and Their Corresponding Information Criteria Based on Different Datasets |
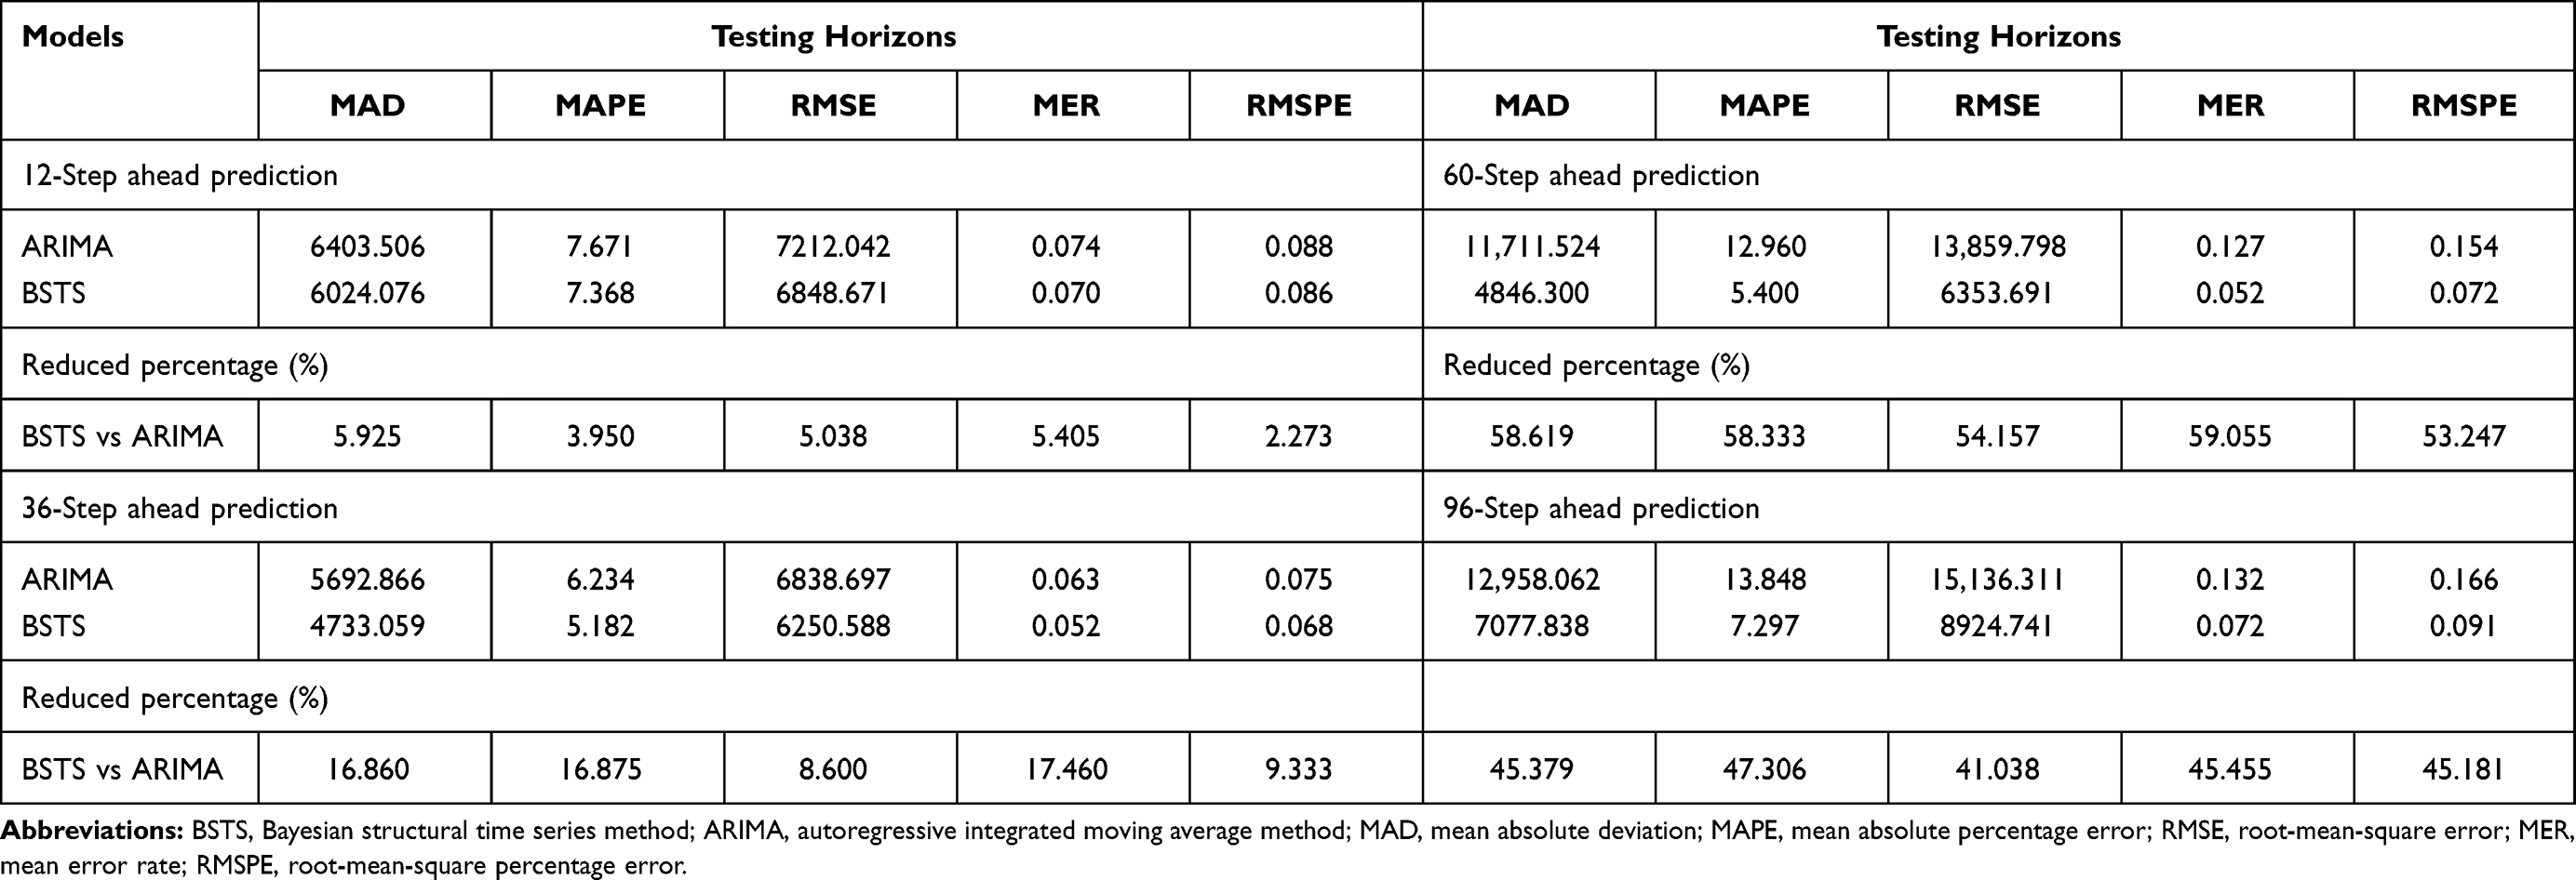 |
Table 3 Measures of Predicted Performance for BSTS Methods and ARIMA Methods |
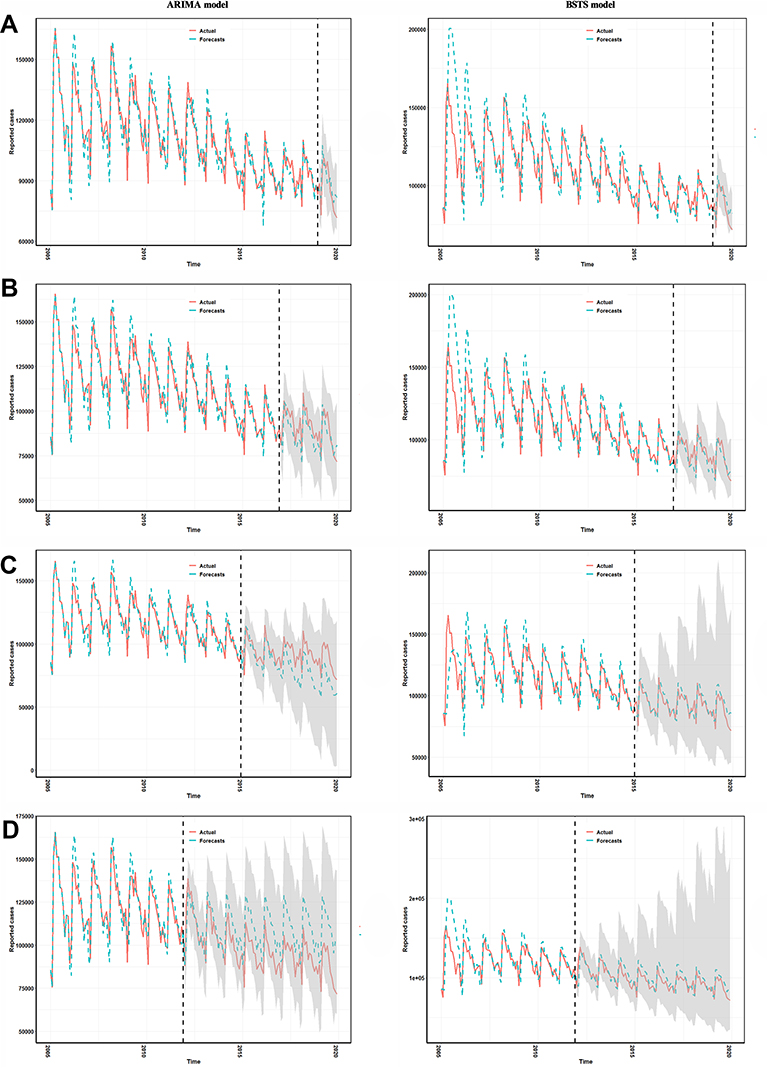 |
Figure 4 Time series plot illustrating the comparisons of the predictive TB incidence results between ARIMA models and BSTS models. (A) Comparisons of 12 holdout periods between ARIMA models and BSTS models. (B) Comparisons of 36 holdout periods between the two models. (C) Comparisons of 60 holdout periods between the two models. (D) Comparisons of 96 holdout periods between the two models. It is apparent that the forecasts under the BSTS models are closer to the actual TB epidemics compared to that under the ARIMA models. Importantly, since the 60-step ahead forecasts, the forecasts under the ARIMA models have deviated from the TB epidemic trajectories; whereas the forecasts under the BSTS models still agree pretty well with the actual trends, suggesting that the BSTS approach provides an adequate predictive model for TB epidemics. |
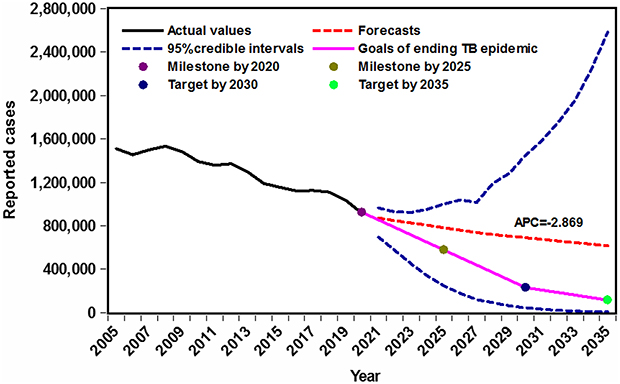 |
Figure 5 Projections of the TB incidence into 2035 based on the BSTS models. Visible in this figure, although the TB incidence continues to be falling between 2021 and 2035 (APC=−2.869, 95% CI −3.056 to −2.681), it seems to pose a major challenge ahead to reach the WHO’s targets ending the TB epidemics. |
Discussion
Since the beginning of 2020, the rapid evolutions of COVID-19 across the globe have resulted in enormous health, social and economic impacts.8 Subsequently, albeit some of these impacts have been mitigated or contained with the implementation of strict prevention and control measures, this pandemic may have medium- or longer-term effects on the disease patterns except for a short-term consequence. However, it remained unexplored how the TB epidemics are affected by the COVID-19 outbreak. This study, for the first time, investigates the impacts of the COVID-19 pandemic on the TB epidemics using an intervention analysis under the BSTS model and predicts whether the TB epidemiological trends are on track to reach the WHO’s End TB Strategy.2 The BSTS method is able to be effectively adopted for the prioritization, development, and implementation of intervention strategies in response to the adverse health outcomes within public health.16 It has been used to perform a forecast of alcohol-related harms in England16 and to analyze the causal effects of new local alcohol licensing policies on hospital admissions and crime.19 Our analyses indicated a monthly average reduction in the TB case notifications of 29% from January to March 2020 (the hardest-hit period during the COVID-19 outbreak), 15% from January to June 2020 (work resumption was taking place across China from March to June), and 14% from January to December 2020 as a result of the COVID-19 pandemic. Also, the BSTS method generated a more highly accurate estimate for the 10 multiple holdout periods compared to the most frequently used ARIMA model because of the MAPE values less than 10% in the different validation samples.26 The highly accurate predictive results under the BSTS model may be owing to the attractive advantages of the BSTS model that is capable of effectively showing the stochastic behavior of the target series and producing a forecast based on the Bayesian model averaging over the preferred models. These results mean that the BSTS method can act as a rewarding tool to better model the TB epidemics in the years to come and to measure the prevention and intervention effects. Additionally, even though the forecasting performances under the ARIMA model underperformed the BSTS model, the ARIMA model also generated relatively accurate forecasting results before 60 holdout periods. This further substantiates the suitability of the ARIMA model for the application in performing a short- or medium-term prediction.
For the relative effect of 29% in the first 3 months, this provides reasonably consistent evidence of the WHO’s estimation for the TB epidemics, which intimates that a decrease by 25%–50% in the TB incidence for these 3 months during the COVID-19 pandemic was considered plausible based on an estimation from some of high TB burden countries.2 Albeit strict counter-virus measures may help to reduce the TB transmission during the COVID-19 outbreak, this effect could be offset by a longer duration of infectiousness, the increased household exposed likelihood to the TB infection, the worsening treatment outcomes, and the higher levels of poverty.2 In the lack of effective prevention and control measures (eg, social protection and health insurance), some of the factors related to TB occurrence (particularly the prevalence of under-nutrition) can easily be worsened by severe economic contractions and unemployment (especially among the most susceptible populations) during the COVID-19 pandemic.2 The BSTS model has a powerful potential to infer the temporal changing patterns of potential impacts, to incorporate the empirical prior information on the parameters, and to handle complex covariate structure.17,18 In our study, given the resulting Bayesian CI and posterior tail-area probabilities, suggesting that posterior probabilities causing these impacts as random events are too small; instead, providing strong evidence for a true causal effect. Also, the current findings mean that COVID-19 could cause medium- and longer-term consequences for the TB epidemics, consistent with the report showing that COVID-19 will have medium- and long-term effects on disease patterns.2 It appeared that plausible explanations for the impacts of the COVID-19 outbreak on the reduction in the TB case notifications include the following:2,4,7,8,27,28 First, people with chronic conditions or mild symptoms have been discouraged from seeking medical aid to attenuate crowding in hospitals. Second, people with TB infection may be reluctant to have a medical check-up due to the strict prevention and control measures and the mandatory requirement for the negative results of nucleic acid testing. Third, hospitals may reject non-urgent service requests, particularly when the medical system is overburdened during the COVID-19 pandemic. Fourth, the number of health facilities providing TB diagnostic and treatment services is significantly reduced. Fifth, limited TB medical personnel and molecular diagnostic platforms may be reallocated to the COVID-19 response. Sixth, procurement and transportation of pharmaceutical and laboratory consumables may be interrupted owing to the strict traffic control measures and the regulation of production activities. Seventh, strict counter-virus policies resulted in restrictions in movement, together with sudden and sharp economic disruption, which makes it harder for infected individuals to visit hospitals. Eighth, there are some similarities in the clinical features of TB (eg, fever and cough) with that of COVID-19, leading to concerns about stigma. Lastly, there may be some delays in recording and reporting confirmed cases during the COVID-19 outbreak.
Understanding the seasonal profile of infectious diseases plays an important role in analyzing and assessing their epidemic behaviors. The seasonal variation in the TB incidence has been reported in many countries and regions across the world.29–32 Our results also indicated a strong seasonal variation in the TB incidence, a peak in spring and a trough in winter per year, the TB incidence in the remaining months remained a relatively stable fluctuation. Such a seasonal pattern showed good consistency with the findings in the preceding published work from across China33,34 and most of the regions of China (eg, Jiangsu, Guangxi, and Qinghai).3,30,35 Similar seasonal variation was also reported in the USA, Korea, Mongolia, and Kuwait.36 An earlier systematic review indicating that a seasonal variation of TB was predominantly found during the spring based on 12 studies performed between 1971 and 2006 from 11 countries/regions worldwide also lends support to our current finding. However, our results showed inconsistency with those in Pakistan and Ethiopia (peaking in April–June),37,38 Japan (which had a semi-annual seasonal variation peaking in June–December, apart from November), and Tunisia (peaking in winter and spring).39 This discrepancy may be attributable to the different geographical distributions, socioeconomic status, healthcare facilities, climatic conditions, and lifestyles of residents. Considering that it is required to undergo an average incubation period of 4–8 weeks from the TB infection to the onset of symptoms and around a 2-month lag from the appearance of the symptom to the clinical diagnosis.40 The following plausible reasons may account for the seasonal peak activities. First, growing evidence is showing that air pollution may be closely related to the occurrence of TB. Currently, China is afflicted with air quality deterioration. Particularly in winter, the key indicators (eg, PM2.5, SO2, PM10, and NO2) of air pollution are significantly higher compared to the WHO’s standards, despite a remarkable improvement in recent years. Second, a recent systematic review suggested that vitamin D deficiency (VDD) and vitamin D insufficiency remained significantly prevalent among TB patients in Africa, and the lack of sun exposure and seasonality were identified as the key determinants related to VDD.29 Besides, more indoor activities in winter may also increase the likelihood of TB infection among people.41 Third, TB is a preventable and treatable disease. Therefore, to contain the TB ongoing spreading, more and more health education-raising activities concerning the knowledge-attitude-behavior, diagnosis and treatment, coupled with prevention and control measures of TB were undertaken on World Tuberculosis Day,42 which enables people to access medical and health institutions when they have corresponding symptoms. Finally, the spring festival is the most important festival in China, which often falls in mid-February. “Spring festival effect” may serve as an underlying trigger for the TB transmission among people in that spring carry is the largest-scale collective on the world that migrates by different means of transportation. Importantly, this festival is also responsible for the trough in the TB incidence as people are enjoying a family reunion, leading to their extreme reluctance to seek medical help during the spring festival, even if a person is suffering from a symptom.
Worldwide, the TB morbidity is falling at a yearly average rate of 1.8% between 2015 and 2019.2 Our study also indicated that a reduction in the TB morbidity was seen during the study period, with AAPC=−3.186 (95% CI −4.083 to −2.281); a striking decrease since 2008, with APC=−4.105 (95% CI −4.691 to −3.516), attributable to the Chinese government’s continued endeavors (eg, the increasing scale-up of vaccination coverage, the development of the powerful surveillance systems in monitoring the epidemic status of communicable diseases, the rapidly increasing budget, and the effective control and treatment). Targets for the reductions in the TB disease burden set in WHO’s End TB Strategy were 50% by 2025, 80% by 2030, and 90% by 2035 compared with the 2015 baseline. Toward these ends, it is required to accelerate the reductions in the TB incidence to an annualized average of 10% by 2025, and 17% from 2025 to 2035 across the world. In our study, to investigate whether the TB epidemics can realize the goals of the WHO’s End TB Strategy, we forecasted the TB epidemiological trends into 2035. The resulting results indicated that a downward trend in the TB incidence would go on (APC=−2.869, 95% CI −3.056 to −2.681) under current interventions, and yet such a reduction being achieved falls far short of what is needed to accomplish the WHO’s goals at different periods.2 Our estimated reductions in the TB morbidity are becoming slow, this is aligned with some earlier reports,1,2,33 which also signals a slow falling or a recurring risk in the TB morbidity in some countries in recent years because of climate change, large-scale population migration, increasing drug-resistant TB, under-nutrition, co-infection with HIV, alcohol use disorders, smoking, together with the co-morbid conditions of diabetes and hypertension.2,43 Accordingly, to ensure that China is on track to reach the WHO’s End TB Strategy, some additional technological breakthroughs that can substantially reduce the risk of developing TB among the susceptible population and comprehensive interventions (eg, optimization of the current prevention measures and the development of an effective post-exposure vaccine or a short, efficacious and safe treatment for TB infection2,43) are required.
This study is subject to potential limitations as well. First, accurate statistics on the TB incidence are crucial for the estimation of the causal effects and epidemiological trends. However, under-reporting or under-diagnosis or delayed reporting may be inevitable for a passive monitoring system. Second, weekly or daily data may provide more detailed information regarding the temporal differences between years. Nevertheless, this is unable to be further done owing to the unavailability of the TB incidence data. Third, the forecasts under the BSTS model may be improved by integrating some other influencing factors associated with the TB occurrence (eg, meteorological parameters and air quality indicators). As we perform this study based on the national data, it is very difficult to collect these ensemble data at a national level. Finally, the forecasting accuracy level under the BSTS model may vary between countries or regions, for policy decisions at different settings it is necessary to refine the model using local target data to further ensure its forecasting efficiency.
Conclusions
The importance and contribution of this study are to present an automated application for public health policymaking in China. Our results showed the BSTS method is not only applied to forecast the short-term and long-term epidemiological trends of TB but also to assess the causal impacts of the anti-contagion policies during the COVID-19 pandemic on the reductions in the TB incidence; whilst it is able to estimate whether these counter-virus measures play a positive or negative role. For example, we adopted new optimized interventions to stop the spreading of diseases. If the new measures were to have positive impacts, the model would predict a lower epidemic level relative to that under the preceding interventions; otherwise, the new interventions have no or negative impacts. Taken together, the BSTS method can be recommended as a flexible and useful tool capable of informing effective and timely public planning for the allocation of the limited medical resources and the prioritization of current interventions to control the continued spreading of TB and to estimate the effects of the COVID-19 outbreak on the reductions in the TB morbidity in China.
Data Sharing Statement
All the data supporting the findings of the work are contained within the Supplementary material (see Table S2).
Ethics Approval and Consent to Participate
The study protocol was approved by the study institutional review board of the Xinxiang Medical University (No: XYLL-2019072). All relevant guidelines were followed for the study. Informed consent is not required from the participants because the monthly TB and COVID-19 incidents without personal information are public access in China and the same is approved by the China Center for Disease Control and Prevention.
Acknowledgments
We appreciate the Chinese CDC for providing the monthly number of TB cases. This project was supported by the Innovation and Entrepreneurship Training Project for University Students of Henan Province (S202110472047 and S202010472007) and Xinxiang Medical University (XYXSKYZ201932) and the Key Scientific Research Project of Universities in Henan (21A330004).
Author Contributions
All authors contributed to data analysis, drafting or revising the article, have agreed on the journal to which the article will be submitted, gave final approval of the version to be published, and agree to be accountable for all aspects of the work.
Disclosure
The authors report no conflicts of interest in this work.
References
1. Ding C, Wang S, Shangguan Y, et al. Epidemic trends of tuberculosis in China from 1990 to 2017: evidence from the Global Burden of Disease Study. Infect Drug Resist. 2020;13:1663–1672. doi:10.2147/idr.s249698
2. World Health Organization. Global tuberculosis report 2020. Available from:https://apps.who.int/iris/handle/10665/336069.
3. Wang Y, Xu C, Li Y, et al. An advanced data-driven hybrid model of SARIMA-NNNAR for tuberculosis incidence time series forecasting in Qinghai Province, China. Infect Drug Resist. 2020;13:867–880. doi:10.2147/IDR.S232854
4. Pan A, Liu L, Wang C, et al. Association of public health interventions with the epidemiology of the COVID-19 outbreak in Wuhan, China. JAMA. 2020;323(19):1915. doi:10.1001/jama.2020.6130
5. Hao X, Cheng S, Wu D, Wu T, Lin X, Wang C. Reconstruction of the full transmission dynamics of COVID-19 in Wuhan. Nature. 2020;584(7821):420–424. doi:10.1038/s41586-020-2554-8
6. Tian H, Liu Y, Li Y, et al. An investigation of transmission control measures during the first 50 days of the COVID-19 epidemic in China. Science. 2020;368(6491):638–642. doi:10.1126/science.abb6105
7. Coibion O, Gorodnichenko Y, Weber M Labor markets during the Covid-19 crisis: a preliminary view. Department of Economics, Working Paper Series. 2020.
8. Qi J, Zhang D, Zhang X, et al. Do lockdowns bring about additional mortality benefits or costs? Evidence based on death records from 300 million Chinese people. medRxiv. 2021. doi:10.1101/2020.08.28.20183699
9. Wang Y, Xu C, Yao S, et al. Estimating the prevalence and mortality of coronavirus disease 2019 (COVID-19) in the USA, the UK, Russia, and India. Infect Drug Resist. 2020;13:3335–3350. doi:10.2147/idr.s265292
10. Tian CW, Wang H, Luo XM. Time-series modelling and forecasting of hand, foot and mouth disease cases in China from 2008 to 2018. Epidemiol Infect. 2019;147:e82. doi:10.1017/S095026881800362X
11. Bartholomew D, Box GEP, Jenkins GM. Time Series Analysis: Forecasting and Control.
12. Qiu H, Zhao H, Xiang H, et al. Forecasting the incidence of mumps in Chongqing based on a SARIMA model. BMC Public Health. 2021;21(1):373. doi:10.1186/s12889-021-10383-x
13. Li Z, Wang Z, Song H, et al. Application of a hybrid model in predicting the incidence of tuberculosis in a Chinese population. Infect Drug Resist. 2019;12:1011–1020. doi:10.2147/idr.s190418
14. Liu Q, Li Z, Ji Y, et al. Forecasting the seasonality and trend of pulmonary tuberculosis in Jiangsu Province of China using advanced statistical time-series analyses. Infect Drug Resist. 2019;12:2311–2322. doi:10.2147/idr.s207809
15. Lv CX, An SY, Qiao BJ, Wu W. Time series analysis of hemorrhagic fever with renal syndrome in mainland China by using an XGBoost forecasting model. BMC Infect Dis. 2021;21(1):839. doi:10.1186/s12879-021-06503-y
16. McQuire C, Tilling K, Hickman M, de Vocht F. Forecasting the 2021 local burden of population alcohol-related harms using Bayesian structural time-series. Addiction. 2019;114(6):994–1003. doi:10.1111/add.14568
17. Feroze N. Forecasting the patterns of COVID-19 and causal impacts of lockdown in top five affected countries using Bayesian Structural Time Series Models. Chaos Solitons Fractals. 2020;140:110196. doi:10.1016/j.chaos.2020.110196
18. Brodersen KH, Gallusser F, Koehler J, Remy N, Scott SL. Inferring causal impact using Bayesian structural time-series models. Ann Applied Statistics. 2015;9(1):247–274. doi:10.1214/14-AOAS788
19. de Vocht F, Tilling K, Pliakas T, et al. The intervention effect of local alcohol licensing policies on hospital admission and crime: a natural experiment using a novel Bayesian synthetic time-series method. J Epidemiol Community Health. 2017;71(9):912–918. doi:10.1136/jech-2017-208931
20. Scott SL, Varian HR. Bayesian Variable Selection for Nowcasting Economic Time Series. NBER Working Paper Series. Cambridge; 2013. doi:10.3386/w19567
21. Scott SL, Varian HR. Predicting the present with Bayesian structural time series. Int J Mathematical Modelling Numerical Optimisation. 2014;5(1/2):4. doi:10.1504/IJMMNO.2014.059942
22. Saxena A, Surana SL, Saini D. Hybrid approach of additive and multiplicative decomposition method for electricity price forecasting. Skit Res J. 2017;7(1):13–20.
23. Brodersen KH, Hauser A. CausalImpact. Available from: https://google.github.io/CausalImpact/CausalImpact.html.
24. Wang Y, Xu C, Zhang S, et al. Temporal trends analysis of tuberculosis morbidity in mainland China from 1997 to 2025 using a new SARIMA-NARNNX hybrid model. BMJ Open. 2019;9(7):e024409. doi:10.1136/bmjopen-2018-024409
25. Zhou L, Yu L, Wang Y, et al. A hybrid model for predicting the prevalence of schistosomiasis in humans of Qianjiang City, China. PLoS One. 2014;9(8):e104875. doi:10.1371/journal.pone.0104875
26. Pao HT. Forecasting energy consumption in Taiwan using hybrid nonlinear models. Energy. 2009;34(10):1438–1446. doi:10.1016/j.energy.2009.04.026
27. Teslya A, Pham TM, Godijk NG, Kretzschmar ME, Bootsma MCJ, Rozhnova G. Impact of self-imposed prevention measures and short-term government-imposed social distancing on mitigating and delaying a COVID-19 epidemic: a modelling study. PLoS Med. 2020;17(7):e1003166. doi:10.1371/journal.pmed.1003166
28. Collins OC, Duffy KJ. Estimating the impact of lock-down, quarantine and sensitization in a COVID-19 outbreak: lessons from the COVID-19 outbreak in China. PeerJ. 2020;8:e9933. doi:10.7717/peerj.9933
29. Keflie TS, Nölle N, Lambert C, Nohr D, Biesalski HK. Vitamin D deficiencies among tuberculosis patients in Africa: a systematic review. Nutrition. 2015;31(10):1204–1212. doi:10.1016/j.nut.2015.05.003
30. Li Y, Zhu L, Lu W, Chen C, Yang H. Seasonal variation in notified tuberculosis cases from 2014 to 2018 in eastern China. J Int Med Res. 2020;48(8):300060520949031. doi:10.1177/0300060520949031
31. Jaganath D, Wobudeya E, Sekadde MP, Nsangi B, Haq H, Cattamanchi A. Seasonality of childhood tuberculosis cases in Kampala, Uganda, 2010–2015. PLoS One. 2019;14(4):e0214555. doi:10.1371/journal.pone.0214555
32. Manabe T, Takasaki J, Kudo K. Seasonality of newly notified pulmonary tuberculosis in Japan, 2007–2015. BMC Infect Dis. 2019;19(1):497. doi:10.1186/s12879-019-3957-8
33. Wang Y, Xu C, Ren J, et al. Secular seasonality and trend forecasting of tuberculosis incidence rate in China using the advanced error-trend-seasonal framework. Infect Drug Resist. 2020;13:733–747. doi:10.2147/IDR.S238225
34. Wang H, Tian CW, Wang WM, Luo XM. Time-series analysis of tuberculosis from 2005 to 2017 in China. Epidemiol Infect. 2018;146(8):935–939. doi:10.1017/s0950268818001115
35. Zheng Y, Zhang L, Wang L, Rifhat R. Statistical methods for predicting tuberculosis incidence based on data from Guangxi, China. BMC Infect Dis. 2020;20(1):300. doi:10.1186/s12879-020-05033-3
36. Kim EH, Bae JM. Seasonality of tuberculosis in the Republic of Korea, 2006–2016. Epidemiol Health. 2018;40:e2018051. doi:10.4178/epih.e2018051
37. Butt MF, Younis S, Wu Z, Hadi SH, Latif A, Martineau AR. The relationship between seasonality, latitude and tuberculosis notifications in Pakistan. BMC Infect Dis. 2021;21(1):210. doi:10.1186/s12879-021-05899-x
38. Gashu Z, Jerene D, Datiko DG, et al. Seasonal patterns of tuberculosis case notification in the tropics of Africa: a six-year trend analysis in Ethiopia. PLoS One. 2018;13(11):e0207552. doi:10.1371/journal.pone.0207552
39. Aissa S, Maoua M, Benzarti W, et al. Seasonality of pulmonary tuberculosis in Sousse (Tunisia). Tunis Med. 2019;97(6):808–817.
40. Li XX, Wang LX, Zhang H, et al. Seasonal variations in notification of active tuberculosis cases in China, 2005–2012. PLoS One. 2013;8(7):e68102. doi:10.1371/journal.pone.0068102
41. Fares A. Seasonality of tuberculosis. J Glob Infect Dis. 2011;3(1):46–55. doi:10.4103/0974-777X.77296
42. Zhang YQ, Li XX, Li WB, et al. Analysis and predication of tuberculosis registration rates in Henan Province, China: an exponential smoothing model study. Infect Dis Poverty. 2020;9(1):123. doi:10.1186/s40249-020-00742-y
43. Li J, Li Y, Ye M, et al. Forecasting the tuberculosis incidence using a novel ensemble empirical mode decomposition-based data-driven hybrid model in Tibet, China. Infect Drug Resist. 2021;14:1941–1955. doi:10.2147/IDR.S299704
 © 2021 The Author(s). This work is published and licensed by Dove Medical Press Limited. The full terms of this license are available at https://www.dovepress.com/terms.php and incorporate the Creative Commons Attribution - Non Commercial (unported, v3.0) License.
By accessing the work you hereby accept the Terms. Non-commercial uses of the work are permitted without any further permission from Dove Medical Press Limited, provided the work is properly attributed. For permission for commercial use of this work, please see paragraphs 4.2 and 5 of our Terms.
© 2021 The Author(s). This work is published and licensed by Dove Medical Press Limited. The full terms of this license are available at https://www.dovepress.com/terms.php and incorporate the Creative Commons Attribution - Non Commercial (unported, v3.0) License.
By accessing the work you hereby accept the Terms. Non-commercial uses of the work are permitted without any further permission from Dove Medical Press Limited, provided the work is properly attributed. For permission for commercial use of this work, please see paragraphs 4.2 and 5 of our Terms.