")
Back to Journals » Therapeutics and Clinical Risk Management » Volume 17
Establishment of a Clinical Nomogram Model to Predict the Progression of COVID-19 to Severe Disease
Authors Tu C, Wang G , Geng Y, Guo N, Cui N, Liu J
Received 3 March 2021
Accepted for publication 17 May 2021
Published 1 June 2021 Volume 2021:17 Pages 553—561
DOI https://doi.org/10.2147/TCRM.S308961
Checked for plagiarism Yes
Review by Single anonymous peer review
Peer reviewer comments 3
Editor who approved publication: Dr Deyun Wang
Changli Tu,1,* Guojie Wang,2,* Yayuan Geng,3 Na Guo,3 Ning Cui,4 Jing Liu1
1Department of Pulmonary and Critical Care Medicine (PCCM), The Fifth Affiliated Hospital of Sun Yat-sen University, Zhuhai, People’s Republic of China; 2Department of Radiology, The Fifth Affiliated Hospital of Sun Yat-sen University, Zhuhai, People’s Republic of China; 3Huiying Medical Technology Co., Ltd, Room A206, B2, Dongsheng Science and Technology Park, Beijing, People’s Republic of China; 4Medical Imaging Center, Shiyan Taihe Hospital, Shiyan, People’s Republic of China
*These authors contributed equally to this work
Correspondence: Ning Cui; Jing Liu
Department of Pulmonary and Critical Care Medicine (PCCM), Fifth Affiliated Hospital of Sun Yat-sen University, 52 East Meihua Road, Zhuhai, People’s Republic of China
Tel +867562528733
Email [email protected]; [email protected]
Background: Coronavirus disease 2019 (COVID-19) is a worldwide public health pandemic with a high mortality rate, among severe cases. The disease is caused by severe acute respiratory syndrome coronavirus 2 (SARS-CoV-2) virus. It is important to ensure early detection of the virus to curb disease progression to severe COVID-19. This study aims to establish a clinical-nomogram model to predict the progression to severe COVID-19 in a timely and efficient manner.
Methods: This retrospective study included 202 patients with COVID-19 who were admitted to the Fifth Affiliated Hospital of Sun Yat-sen University and Shiyan Taihe Hospital from January 17 to April 30, 2020. The patients were randomly assigned to the training dataset (n = 163, with 43 progressing to severe COVID-19) or the validation dataset (n = 39, with 10 progressing to severe COVID-19) at a ratio of 8:2. The optimal subset algorithm was applied to filter for the clinical factors most relevant to the disease progression. Based on these factors, the logistic regression model was fit to distinguish severe (including severe and critical cases) from non-severe (including mild and moderate cases) COVID-19. Sensitivity, specificity, and area under the curve (AUC) were calculated using the R software package to evaluate prediction performance. A clinical nomogram was established and performance assessed using the discrimination curve.
Results: Risk factors, including demographic data, symptoms, laboratory and image findings, were recorded for the 202 patients. Eight of the 53 variables that were entered into the selection process were selected via the best subset algorithm to establish the predictive model; they included gender, age, BMI, CRP, D-dimer, TP, ALB, and involved-lobe. AUC, sensitivity, and specificity were 0.91, 0.84 and 0.86 for the training dataset, and 0.87, 0.66, and 0.80 for the validation dataset.
Conclusion: We established an efficient and reliable clinical nomogram model which showed that gender, age, and initial indexes including BMI, CRP, D-dimer, involved-lobe, TP, and ALB could predict the risk of progression to severe COVID-19.
Keywords: clinical nomogram model, COVID-19, progression risk, logistic regression
Introduction
The rapid spread of the novel coronavirus disease 2019 (COVID-19) outbreak has caused a global pandemic. As of 24:00 on January 12, 2021, there were 87,706 confirmed patients and 4634 deaths in 31 provinces in China, with a mortality rate of 5.42%.1 Globally, as of 10:32 am CEST, 8 October 2020, there have been 35,897,739 confirmed cases of COVID-19, including 1,048,781 deaths reported to WHO,2 with a mortality rate of 2.92%. According to Chinese epidemic statistics, the distribution of critical, severe and mild types of COVID-19 was 5%, 14%, and 81%, respectively, in the population.3 Studies4 have shown that mortality rates for severe COVID-19, common pneumonia and absence of pneumonia are 5.88%, 0.12%, and 0%, respectively, among patients diagnosed with COVID-19. Thus, the early detection and prediction of the progression of COVID-19 is critical. Nomograms are simple and convenient for clinical use, and show good discrimination characteristics in predicting outcomes. Recent studies indicate that Nomograms based on laboratory investigation, CT imaging, or immunological features can predict the progression to severe disease of COVID-19.5–7 However, most of previous studies used only part of these data. Our objective was to establish a clinical nomogram combining clinical and imaging data to improve the accuracy of prediction.
Methods
Study Design and Patient Population
This retrospective study included 202 confirmed COVID-19 patients (≥18 years of age) admitted to the Fifth Affiliated Hospital of Sun Yat-sen University and Shiyan Taihe Hospital between January 17 and April 30, 2020. A confirmed case of COVID-19 was defined as positive SARS-CoV-2 virus nucleic acids on the nasal and pharyngeal swab specimens by real-time reverse-transcriptase polymerase chain reaction (RT-PCR) assay.
COVID-19 was diagnosed and classified clinically according to the new coronavirus pneumonia diagnosis and treatment plan (trial version 7)8 drafted by the National Health Committee of the People’s Republic of China. Clinical classification of COVID-19 was; (1) mild, with mild symptoms and no obvious signs of pneumonia on imaging, (2) moderate, with fever, respiratory-tract symptoms and obvious signs on imaging indicating pneumonia, (3) severe, with one of the following; (a) respiratory rate ≥30 beats per min (bpm), (b) mean oxygen saturation in the resting state ≤93%, (c) ratio of arterial oxygen partial pressure (PaO2) to the fraction of inspiration (FiO2) ≤300 mmHg (1 mmHg = 0.133 kPa), or (d) pulmonary imaging showing an increase in manifestations of >50% within 24~48 h, (4) critical, with one of the following, (a) respiratory failure requiring mechanical ventilation, (b) shock, or (c) intensive-care unit (ICU) admission due to multiple-organ failure. The non-severe group comprised mild and moderate cases, whereas the severe group comprised the severe and critical cases. The inclusion criteria were as follows: 1) Admission within 7 days from the onset of symptoms, 2) completed laboratory or medical examinations and questionnaires, 3) presence of the first lung CT examination. All the participants were followed until the end of the disease course; cure or death. This retrospective observational study was approved by the Research Ethics Committee of The Fifth Affiliated Hospital of Sun Yat-sen University and Ethics Committee of Shiyan Taihe Hospital. The need for informed consent was waived due to the retrospective study design.
Clinical Data
Clinical data, including basic demographics, symptoms, vital signs, clinical classification, and complications, were extracted from electronic medical records. Laboratory evaluations included total blood cell count, coagulation function, liver and kidney function, electrolyte levels, lactate dehydrogenase (LDH), creatine kinase (CK), creatine kinase isoenzyme MB (CK-MB), alpha-hydroxybutyrate dehydrogenase (α-HBDH), C-reactive protein (CRP), blood gas analysis and D-dimer if the patient was breathing room air. Categorical variables were presented as frequency and percentages, whereas continuous variables as mean (±SD, standard deviation) and median (interquartile range, IQR) values.
CT Scanning Protocol
Each patient was placed in the supine position on the CT machine (uCT760 or Umi780, United Imaging, Shanghai, China; Precison32, Campo imaging, Shenyang, China) and scanned during the inspiratory phase. Images were reconstructed with a slice thickness of 1 mm and an interval of 1 mm.
Lung CT images were screened by three imaging physicians who were blind to the RT-PCR results and clinical information. The CT images were independently read by two radiologists with more than 5 years’ experience in the diagnosis of chest CT scans. In case of dispute, they discussed and reached a consensus that was reviewed by a senior imaging physician with more than 10 years of experience.
Feature Selection and Model Establishment
Patients were randomly assigned to the training dataset (n = 163, with 43 in the severe group) or the validation dataset (n = 39, with 10 in the severe group) at a ratio of 8:2. Univariate analysis was applied to select candidate features with significant differences (p < 0.05) between non-severe and severe groups. Best subset selection via an exhaustive algorithm was then performed to establish the predictive model.
The features were selected using the leaps and rms package in R (version 3.6.2) which were used to fit the logistic regression model and nomogram, respectively. A decision curve analysis was performed by calculating the net benefits for a range of threshold probabilities in the whole cohort to assess the clinical efficiency of the nomogram. The prediction performance of the logistic regression model was evaluated based on sensitivity, specificity, and area under the receiver operator characteristic (ROC) curve (AUC).
Results
High Ratio of Severe to Critical COVID-19 Patients
The study excluded 92 patients with an interval >7 days between the first lung CT examination/admission and onset of symptoms because it aimed to establish a nomogram prediction model in the early stage of COVID-19. Ultimately, 202 patients were included in the study; 149 non-severe and 53 severe cases (Figure 1).
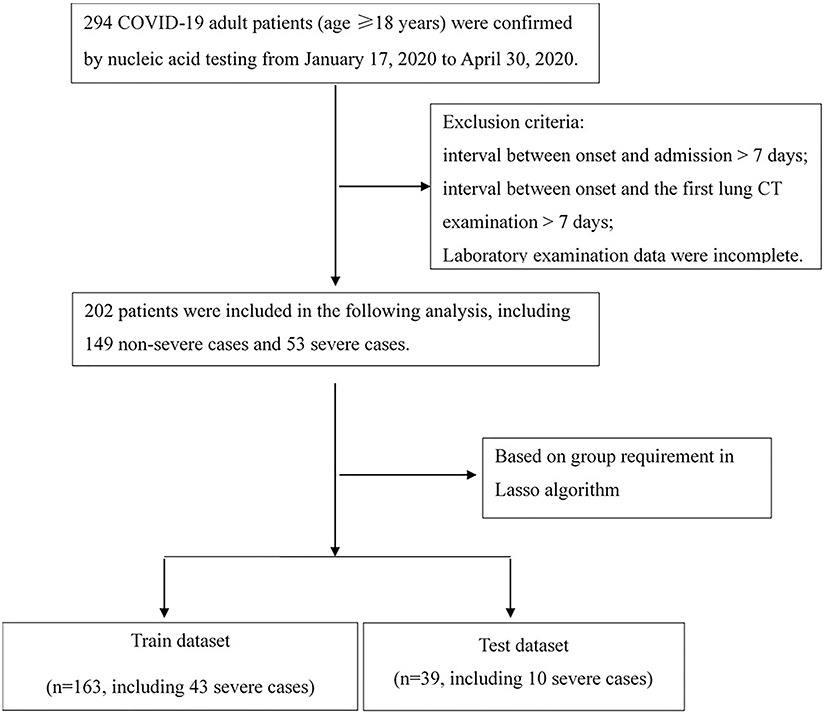 |
Figure 1 Flow chart for screening for COVID-19. |
Original Clinical Characteristics of COVID-19 Patients
Fifty-six clinical indexes were recorded and analyzed (Table 1). The average age was 44 years, with a higher fraction of older patients in the severe than the non-severe group (P<0.001). The most common symptoms were fever (63.4%), cough (44.1%), fatigue (14.9%), and myalgia (14.4%). Most patients (68.8%) had abnormal chest CT findings. There was a higher number of lung lobes involved in the severe COVID-19 cases than in non-severe cases (P < 0.05). The most common imaging sign in COVID-19 patients was ground-glass opacity (GGO; Figures 2 and 3).
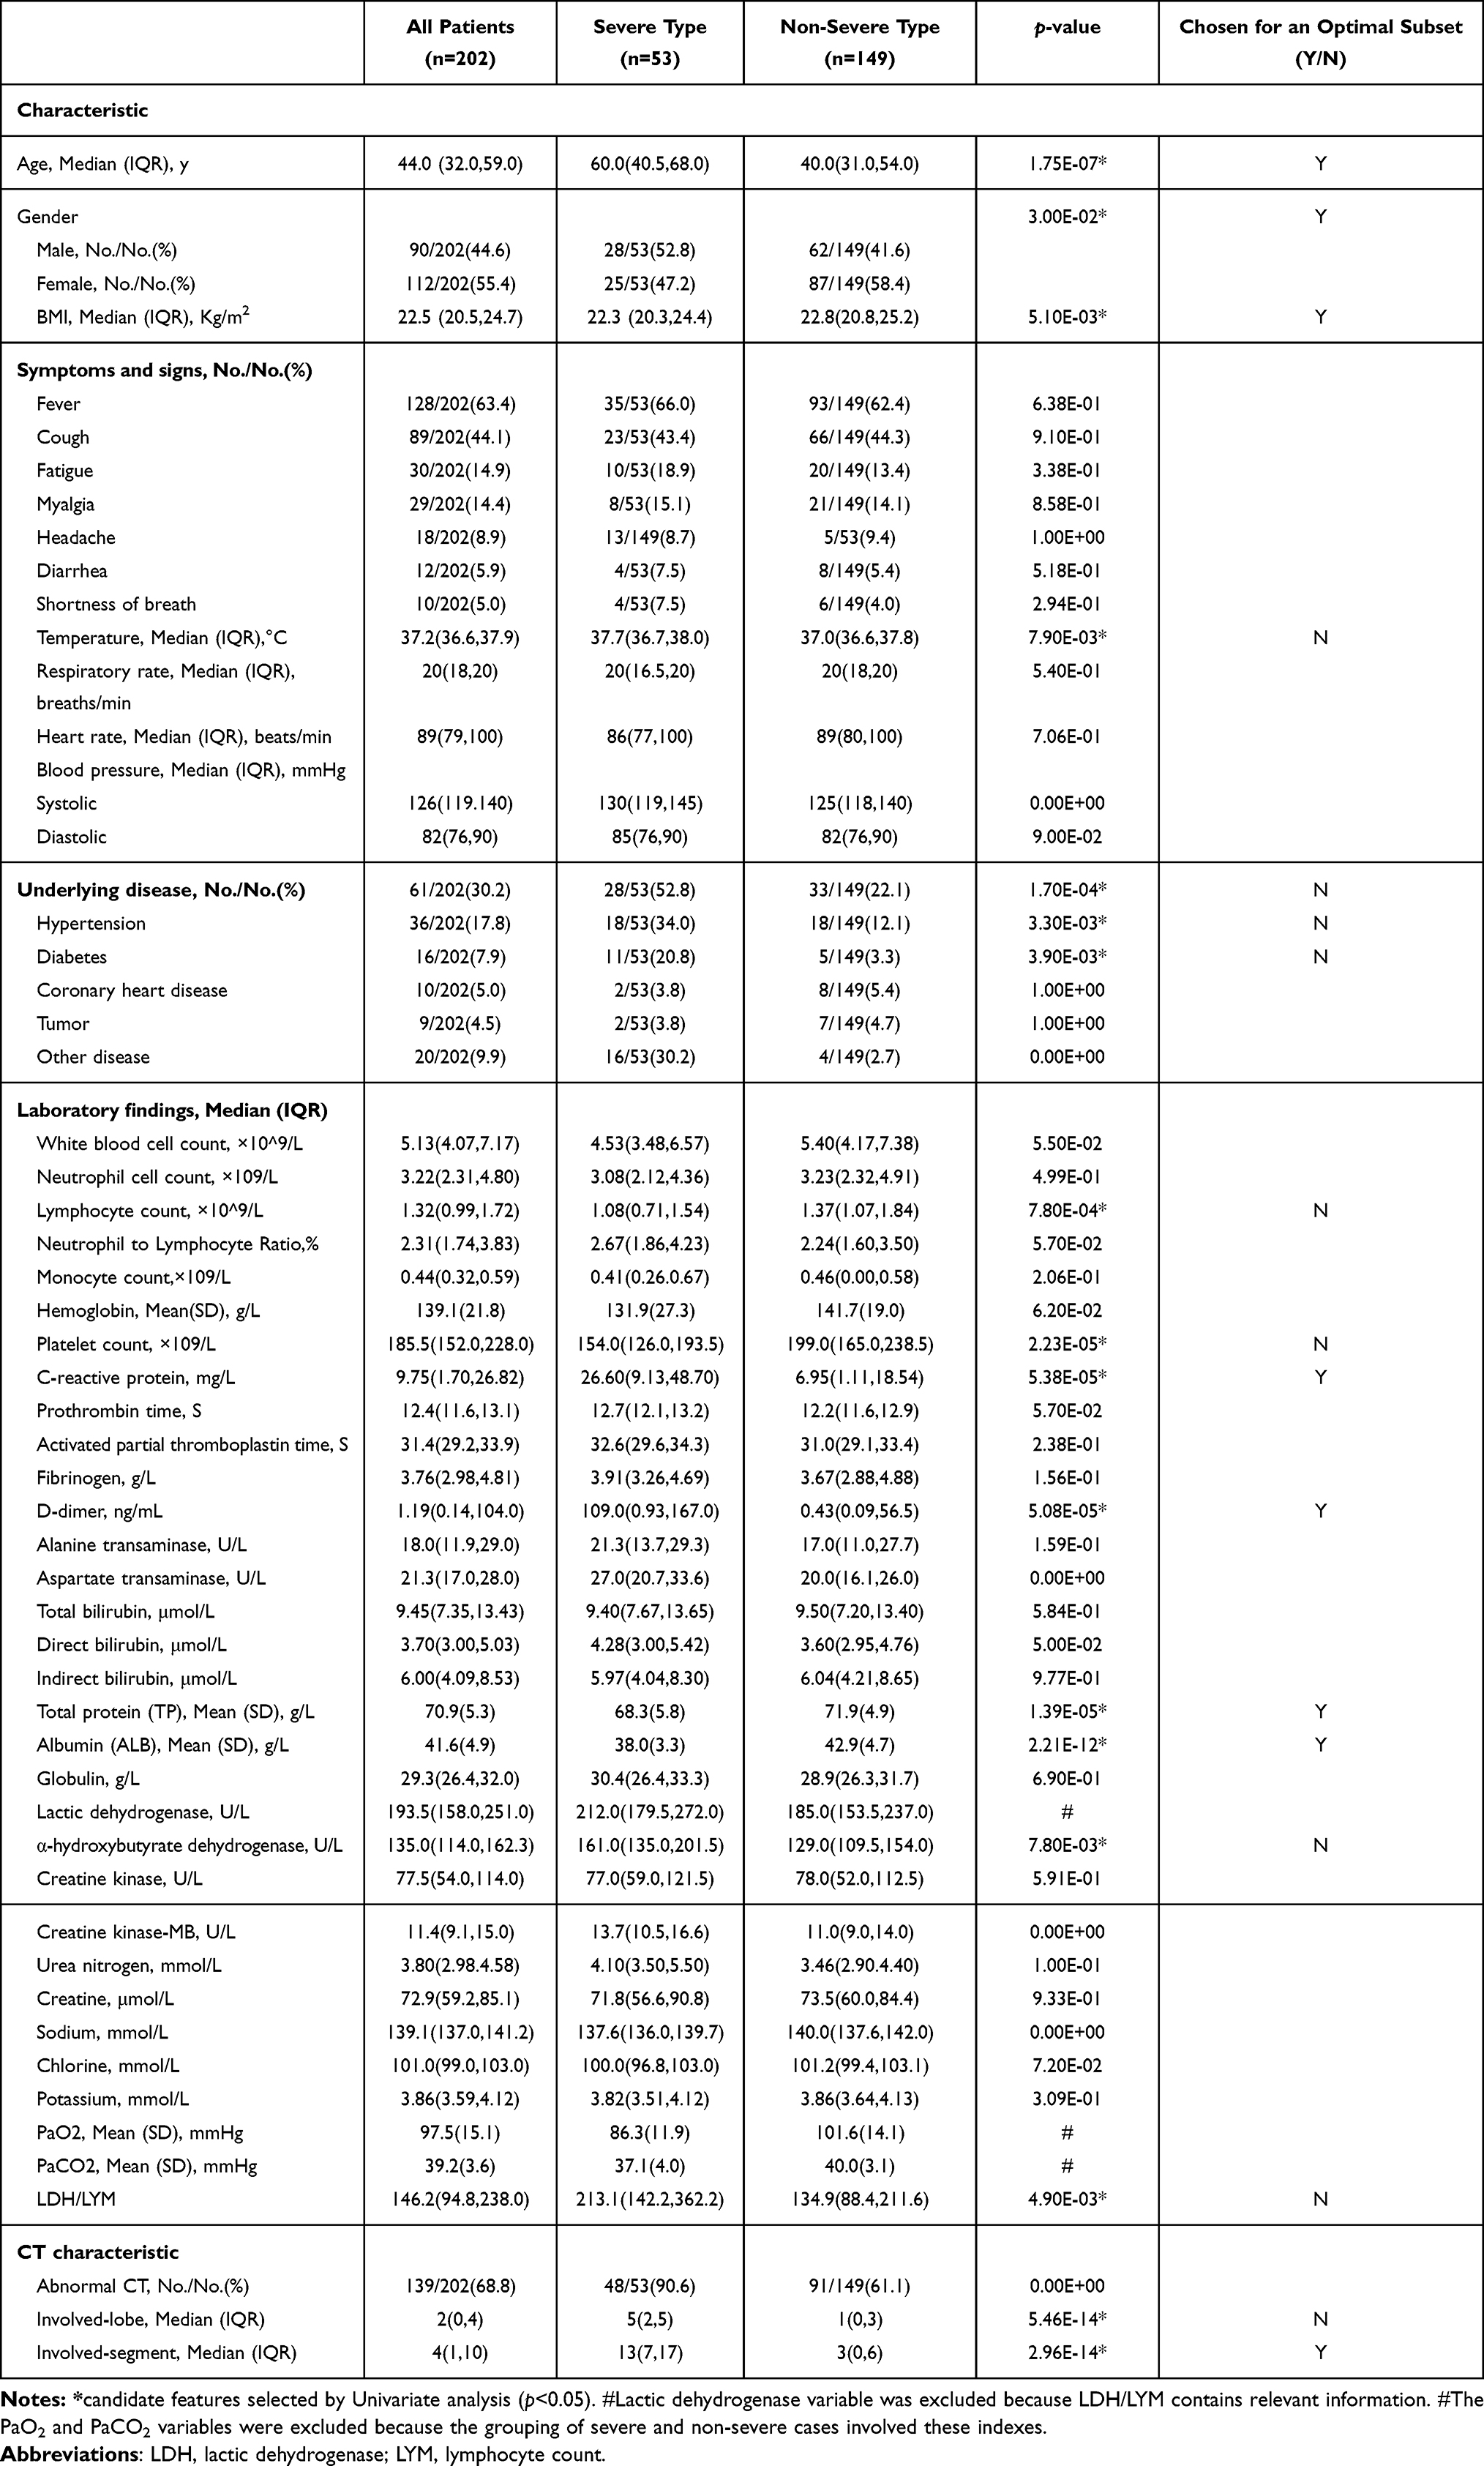 |
Table 1 Clinical Characteristics Among COVID-19 Patients and Variables to the Establishment of a Clinical-Nomogram Model to Predict the Progression of COVID-19 to Severe Disease |
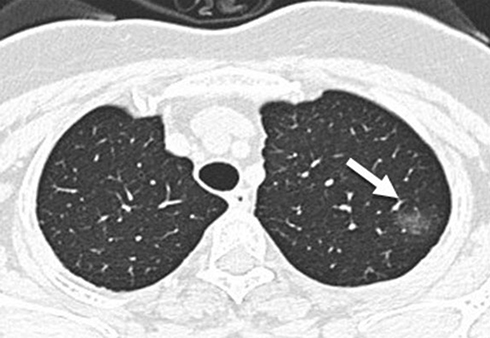 |
Figure 2 Typical chest image of non-severe COVID-19 patient. A 35-year-old male patient with mild COVID-19, was admitted to the hospital 3 days after developing a fever. Axial thin-section CT images show ground-glass opacity (GGO) in the left upper lobe indicated by the arrow. |
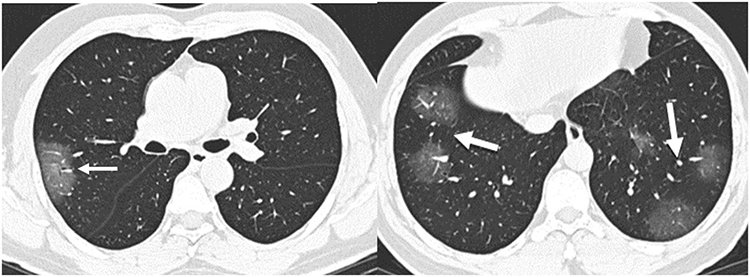 |
Figure 3 Typical chest images of severe COVID-19 patient. A 44-year-old male patient with severe COVID-19, presenting with fever and cough, was admitted to the hospital 1 day later. Axial thin-section CT images show multiple GGO in bilateral-lung indicated by the arrows. |
Selection of Significant Predictive Factors and Establishment of a Clinical-Nomogram Model to Predict the Risk of Progression to Severe COVID-19
The PaO2 and PaCO2 variables were excluded because the grouping of severe and non-severe cases involved these indexes; Lactic dehydrogenase variable was excluded because LDH/LYM contains relevant information; 53 variables were entered into the feature selection part.
The following 17 significant variables were chosen (Table 1): Gender, Age, Underlying disease, Hypertension, Diabetes, Body Mass Index (BMI), Temperature (TEMP), Lymphocyte (LYM), Lactate dehydrogenase to Lymphocyte Ratio (LDH/LYM), Platelet (PLT), CRP, D-dimer, Total protein (TP), Albumin (ALB), α-HBDH, involved lobe (involved lung lobe), and the involved lung segment. An optimal subset of eight factors was attained with subset selection method based on adjusted R2, including Gender (coefficient =−0.12), Age (0.0030), BMI (0.017), CRP (0.0030), D-dimer (0.00037), TP (−0.014), ALB (−0.018) and involved-lobe (0.084). The model was established and analyzed according to the eight clinical indicators (Figure 4). AUC, sensitivity, and the specificity of the training cohort were 0.91 (95% CI, 0.87–0.96), 0.84, and 0.86, respectively, the corresponding indexes of the validation cohort group were 0.87 (95% CI, 0.76–0.99), 0.66, and 0.80, respectively (Table 2 and Figure 5). Decision curve analysis (DCA) showed that the nomogram had an overall net benefit of differentiating severe from the non-severe group for the majority of the reasonable threshold probabilities (Figure 6).
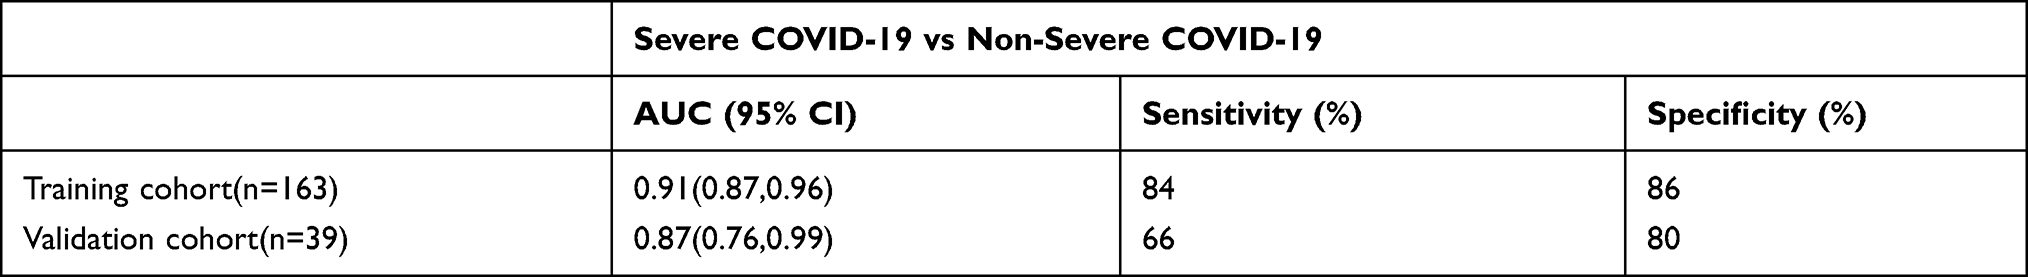 |
Table 2 Performance of Nomogram for Early Prediction of Severe COVID-19 |
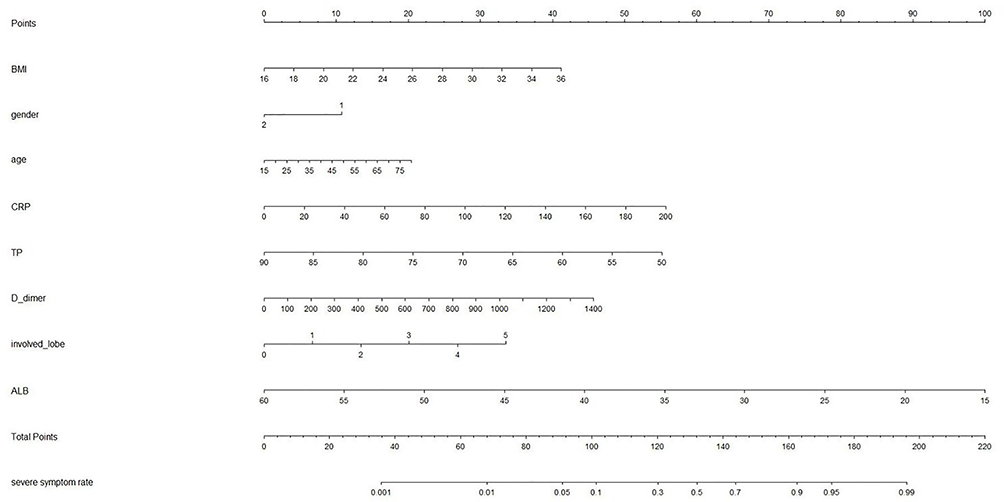 |
Figure 4 Nomogram predicting the probability of severe disease in patients with COVID-19. The nomogram, combining BMI, Gender, Age, CRP, TP, D-dimer, involved-lobe, and ALB, developed in the training set. |
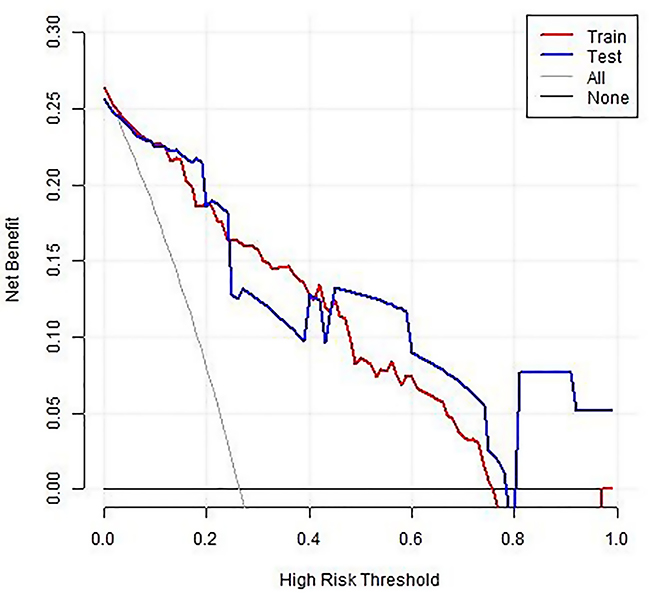 |
Figure 5 The ROC curves of the nomogram. The ROC curves of the nomogram in the training and validation sets, respectively. |
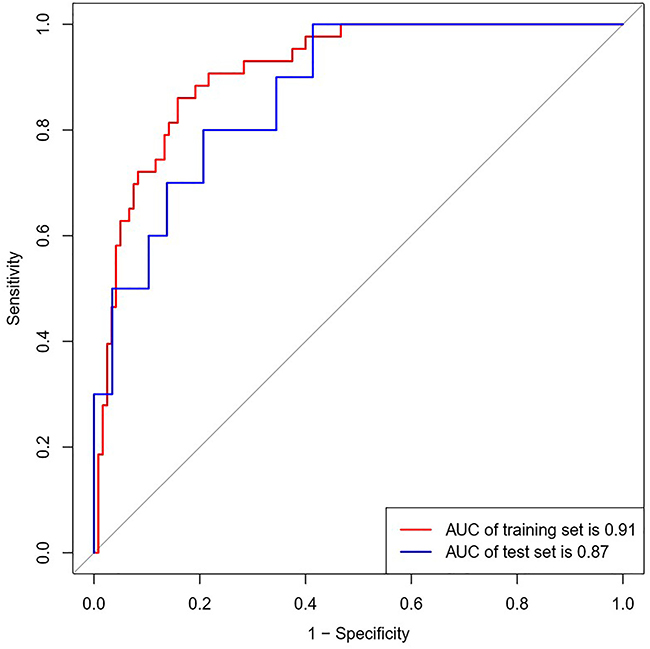 |
Figure 6 Decision curve analysis for the nomogram. The y-axis indicates the net benefit; the x-axis indicates threshold probability. The blue and red lines represent the net benefit of the nomogram in the training and validation sets, respectively. This nomogram outperformed simple diagnoses such as those categorising patients as severe or non-severe across the full range of threshold probabilities at which a patient would be diagnosed as severe. |
Discussion
This study found that older males with more involved lung lobes, higher CRP, D-dimer and BMI, and lower TP and ALB on admission may have higher odds of severe COVID-19. A clinical nomogram model, comprising eight factors, to predict the risk of progression to severe disease was developed and validated. The performance of this nomogram model was satisfactory with an AUC of 0.91 on the training dataset and 0.87 on the validation dataset. The nomogram model can be used by clinicians to estimate a patient’s risk of developing severe illness and provide reliable evidence for early intervention to reduce mortality.
Nomogram analysis can generate an accurate individualized risk assessment through an intuitive and visual graphical model, compared with other predictive statistical methods.9,10 Several studies have reported risk factors for severe COVID-19 such as demographics, symptoms, laboratory, and imaging findings.5–7 Gong et al5 found that old age, C-reactive protein, and lower albumin are associated with severe COVID-19. Huang et al11 found that BMI ≥ 28 kg/m2 was an independent risk factor in predicting severe illness in patients with COVID-19. In a US single-center study, 83.8% of COVID-19 patients who received invasive mechanical ventilation were male.12 Older and obese patients usually have more underlying diseases and lower immunity, and are more likely to become severe patients due to severe alveolar damage.13 In the meantime, the elevation of CRP in isolation or in combination with other markers may reveal higher inflammatory response. Our study found that the median CRP of severe type was higher than those of non-severe type (26.60 mg/L vs 6.95 mg/L). The hallmark of severe COVID-19 includes an interplay of some of the mechanisms behind hypoalbuminemia, such as increased capillary permeability, decreased protein synthesis, decreased half-life of serum albumin, decreased serum albumin total mass, increased volume of distribution, and increase expression of vascular endothelial growth factor.14–16 Interestingly, we found that higher D-dimer was also an important prognostic predictor for severe COVID-19, which is consistent with recent evidence of lung pathology dissection that it has shown occlusion and micro-thrombosis formation in pulmonary small vessels of patients critically ill with COVID-19.17
Pulmonary imaging has been widely used to predict the severity of pulmonary diseases and patient survival rates.5,18 Abnormalities in the chest radiography were included in the COVID-19 risk score to predict the occurrence of critical illness in hospitalized patients with COVID-19. High-resolution CT (HRCT) of the chest is critical for early detection, disease severity evaluation and follow-up of COVID-19 patients;19 therefore, a predictor containing pulmonary imaging would be more credible. Gong et al5 developed a nomogram that showed similar AUC in the training and validation dataset (0.91/0.85 vs 0.91/0.87) as in this study; however, it did not include pulmonary imaging data. The nomogram in this study showed good differentiation performance as indicated by AUC values in the training and validation datasets.
Our study had several limitations. First, the design was retrospective. A prospective research study is required to validate the feasibility and effectiveness of the nomogram. Second, the results were preliminary and need to be verified by additional studies performed with a larger number of samples. Third, although the study is two center, the results cannot be generalized to other populations. Further studies on different populations, outside China, with larger patient cohorts, are required to validate our findings.
Conclusions
An efficient and reliable clinical nomogram model for determining the progression of COVID-19 to the severe disease form was established. It was based on eight factors that were comprehensive, relatively inexpensive, and easy to obtain from clinical data. This prediction model will help in making early assessments, regulating treatment, and containing the disease progression to severe COVID-19.
Data Sharing Statement
The data sets used in this study are available from the corresponding author-Jing Liu (Email [email protected]) on reasonable request.
Ethics Approval and Consent to Participate
This study adhered to the principles of the Declaration of Helsinki, and it was approved by the Ethics Committee of the Fifth Affiliated Hospital of Sun Yat-sen University and the Ethics Commission of Shiyan Taihe Hospital (No. K153-1).
Informed Consent
As all subjects were anonymized in this retrospective study, written informed consent was waived due to urgent need.
Acknowledgments
The previous results of this study were published on the preprint website, and the link is as follows: https://www.researchsquare.com/article/rs-44136/v1. The authors added cases according to the reviewers’ opinions in the later stage, and adjusted the author’s ranking according to the contribution of the follow-up study. The authors wish to thank the following persons for their contribution to this study, including Cuiyan Tan, Meizhu Chen, Zijun Xiang, Hu Peng, Ying Wang, Yingjian Lian, Yiying Huang, Zhenguo Wang, Jian Wu, Qizhen Cao, Qiang Han, Lin Xu, Jin Huang, Xiaobin Zheng, Xiaorong Zhou, Xinran Liu, and Hong Shan.
Author Contributions
All authors made substantial contributions to conception and design, acquisition of data, or analysis and interpretation of data, took part in drafting the article or revising it critically for important intellectual content, agreed to submit to the current journal, gave final approval for the version to be published, and agree to be accountable for all aspects of the work.
Funding
This work was supported by “The program of Zhuhai Municipal Special Fund for Emergency Science and Technology Research in 2020 (ZH22036302200031PWC)”.
Disclosure
The authors declared no potential conflicts of interest with respect to the research, authorship, and/or publication of this article.
References
1. National Health Commission of the People’s Republic of China. The latest news on health emergency office; 2020. Available from: http://en.nhc.gov.cn/2021-01/13/c_82736.htm.
2. WHO. Coronavirus Disease (COVID-19) Dashboard. Available from: https://covid19.who.int/.
3. Wu Z, McGoogan JM. Disease 2019 (COVID-19) Outbreak in China: summary of a Report of 72 314 Cases From the Chinese Center for Disease Control and Prevention [published online ahead of print, 2020 Feb 24]. JAMA. 2020. doi:10.1001/jama.2020.2648
4. Epidemiology Working Group for NCIP Epidemic Response, Chinese Center for Disease Control and Prevention. The Epidemiological Characteristics of an Outbreak of 2019 Novel Coronavirus Diseases (COVID-19) in China. Zhonghua Liu Xing Bing Xue Za Zhi. 2020;41(2):
5. Gong J, Ou J, Qiu X, et al. A Tool for Early Prediction of Severe Coronavirus Disease 2019 (COVID-19): a Multicenter Study Using the Risk Nomogram in Wuhan and Guangdong, China. Clin Infect Dis. 2020;71(15):833–840. doi:10.1093/cid/ciaa443
6. Bao Y, Liu R, Hu S, et al. Nomogram to identify severe coronavirus disease 2019 (COVID-19) based on initial clinical and CT characteristics: a multi-center study. BMC Med Imaging. 2020;20(1):111. doi:10.1186/s12880-020-00513-z
7. Cai L, Zhou X, Wang M, et al. Predictive Nomogram for Severe COVID-19 and Identification of Mortality-Related Immune Features. J Allergy Clin Immunol Pract. 2021;9(1):177–184.e3. doi:10.1016/j.jaip.2020.10.043
8. National Health Commission of the People’s Republic of China. Diagnosis and Treatment Protocol for COVID-19 (Trial Version 7) 2020; 2020. Available from: https://www.chinadaily.com.cn/pdf/2020/1.Clinical.Protocols.for.the.Diagnosis.and.Treatment.of.COVID-19.V7.pdf.
9. Lu J, Hu S, Fan R, et al. ACP Risk Grade: A Simple Mortality Index for Patients with Confirmed or Suspected Severe Acute Respiratory Syndrome Coronavirus 2 Disease (COVID-19) During the Early Stage of Outbreak in Wuhan, China (February 20, 2020): Social Science Electronic Publishing. 2020. doi:10.2139/ssrn.3543603
10. Liu J, Liu Y, Xiang P, et al. Neutrophil-to-lymphocyte ratio predicts critical illness patients with 2019 coronavirus disease in the early stage. J Transl Med. 2020;18(1):206. doi:10.1186/s12967-020-02374-0
11. Huang R, Zhu L, Xue L, et al. Clinical findings of patients with coronavirus disease 2019 in Jiangsu province, China: a retrospective, multi-center study. PLoS Negl Trop Dis. 2020;14(5). doi:10.1371/journal.pntd.0008280
12. Mughal MS, Kaur IP, Jaffery AR, et al. COVID-19 patients in a tertiary US hospital: assessment of clinical course and predictors of the disease severity. Respir Med. 2020;172:106130. doi:10.1016/j.rmed.2020.106130
13. Xu Z, Shi L, Wang Y, et al. Pathological findings of COVID-19 associated with acute respiratory distress syndrome. Lancet Respir Med. 2020;8(4):420–422. doi:10.1016/S2213-2600(20)30076-X
14. Aziz M, Fatima R, Assaly R. Elevated interleukin-6 and severe COVID-19: a meta-analysis. J Med Virol. 2020;92(11):2283–2285. doi:10.1002/jmv.25948
15. Soeters PB, Wolfe RR, Shenkin A. Hypoalbuminemia: pathogenesis and Clinical Significance. JPEN J Parenter Enteral Nutr. 2019;43:181–193. doi:10.1002/jpen.1451
16. Bi X, Su Z, Yan H, et al. Prediction of severe illness due to COVID-19 based on an analysis of initial Fibrinogen to Albumin Ratio and Platelet count. Platelets. 2020;31(5):674–679. doi:10.1080/09537104.2020.1760230
17. Lin L, Lu L, Cao W, et al. Hypothesis for potential pathogenesis of SARS-CoV-2 infection-a review of immune changes in patients with viral pneumonia. Emerg Microbes Infect. 2020;9(1):727–732. doi:10.1080/22221751.2020.1746199
18. Cao MS, Sheng J, Wang TZ, et al. Acute exacerbation of idiopathic pulmonary fibrosis: usual interstitial pneumonitis vs. possible usual interstitial pneumonitis pattern. Chin Med J. 2019;132(18):
19. Pan Y, Guan H, Zhou S, et al. Initial CT findings and temporal changes in patients with the novel coronavirus pneumonia (2019-nCoV): a study of 63 patients in Wuhan, China. Eur Radiol. 2020;30(6):
 © 2021 The Author(s). This work is published and licensed by Dove Medical Press Limited. The full terms of this license are available at https://www.dovepress.com/terms.php and incorporate the Creative Commons Attribution - Non Commercial (unported, v3.0) License.
By accessing the work you hereby accept the Terms. Non-commercial uses of the work are permitted without any further permission from Dove Medical Press Limited, provided the work is properly attributed. For permission for commercial use of this work, please see paragraphs 4.2 and 5 of our Terms.
© 2021 The Author(s). This work is published and licensed by Dove Medical Press Limited. The full terms of this license are available at https://www.dovepress.com/terms.php and incorporate the Creative Commons Attribution - Non Commercial (unported, v3.0) License.
By accessing the work you hereby accept the Terms. Non-commercial uses of the work are permitted without any further permission from Dove Medical Press Limited, provided the work is properly attributed. For permission for commercial use of this work, please see paragraphs 4.2 and 5 of our Terms.