")
Back to Journals » Journal of Inflammation Research » Volume 14
Establishment and Clinical Application of a Method for Detecting T Lymphocyte Subsets by Cellular Immunochip Technology
Authors Chen C, Liu YM, Xuan SX, Zhou MF, Zhou P, Cheng B, Lin JD, Yin WG, Li LH
Received 9 October 2021
Accepted for publication 10 December 2021
Published 31 December 2021 Volume 2021:14 Pages 7529—7537
DOI https://doi.org/10.2147/JIR.S343636
Checked for plagiarism Yes
Review by Single anonymous peer review
Peer reviewer comments 2
Editor who approved publication: Professor Ning Quan
Chen Chen,* Yan-Mei Liu,* Shu-Xia Xuan, Mei-Fang Zhou, Peng Zhou, Bin Cheng, Jin-Duan Lin, Wei-Guo Yin, Lin-Hai Li
Department of Laboratory Medicine, The Sixth Affiliated Hospital of Guangzhou Medical University, Qingyuan People’s Hospital, Qingyuan, People’s Republic of China
*These authors contributed equally to this work
Correspondence: Wei-Guo Yin; Lin-Hai Li
Department of Laboratory Medicine, The Sixth Affiliated Hospital of Guangzhou Medical University, Qingyuan People’s Hospital, Qingyuan, 511518, People’s Republic of China
Tel +86 763 311 3890
Email [email protected]; [email protected]
Objective: To establish and verify the method for detecting the immune phenotype of peripheral blood T lymphocytes by cellular immune chip technology, analyze the immune status, and discuss its clinical diagnostic value of different populations in the Qingyuan area.
Methods: First, a cellular immune chip was used to detect the number of T lymphocyte subsets CD3+, CD4+, CD8+, and CD4/CD8, followed by evaluating the accuracy and precision through a comparison with flow cytometry. After passing the performance verification, a large-scale detection was performed by a cellular immune chip in 8389 cases. Immunochip technology detects the expression of T lymphocyte subsets and analyzes the differences in cellular immune function among people with physical examination, inflammation, and cancer, as well as different cancer types and in genders.
Results: The cell immunochip method and flow cytometry method have the same accuracy and precision in detecting specimens, and the former is fast and simple, and is suitable for clinical use; big data analysis is expected to establish a reference range for CD3+, CD4+, and CD8+ T cell counts in Qingyuan. There are statistical differences in CD3+, CD4+, CD8+ T cell counts in physical examination, inflammation and cancer populations; there are also certain differences in CD3+, CD4+, CD8+ T cell counts and CD4/CD8 ratios between different cancer types and different diseases.
Conclusion: The method of cell immunochip technology to detect T lymphocyte subsets is simple and practical, with accurate results and rapid detection. It can be used for immune function monitoring and treatment prognosis evaluation of people with different diseases, and it is worthy of popularization and application in clinical practice.
Keywords: T lymphocyte, physical examination, CD4/CD8, cellular immune chip
Introduction
T lymphocytes are an important part of cellular immunity and an important part of humoral immunity and play an important role in maintaining the immune function of the body. T lymphocytes can express nearly 200 kinds of membrane proteins (CD), among which CD3+ molecules are the surface markers of mature T lymphocytes, reflecting the status of immune function. According to the expression of CD antigens, T lymphocytes can be divided into different cell subgroups, mainly CD4 +T and CD8+T cell subsets. The decrease in the number and functional defects of CD3+, CD4+, and CD8+ T cells can lead to various opportunistic infections and tumors.1,2 Therefore, the CD cell count has a guiding role in the early diagnosis and treatment of diseases with low cellular immune function and the judgment of the course of the disease. Other T cell detection methods such as MRI detection tracking,3 In Situ MHC Tetramer Staining,4 The Flow-Through cell Counting Assay (FTCA1),5 the optofluidic ring resonator,6 Enzyme-Linked Immunospot Assays7 and many more.
At present, the gold standard flow cytometry is mostly used to detect CD cell counts in clinical practice. The quality of the monoclonal antibody, the type of flow cytometer, the preparation method of the specimen, and the research object (ethnicity) vary. In addition, the number of statistical samples is small, resulting in large differences in the reference values reported by various laboratories, and it is difficult to establish a unified reference interval. This laboratory introduces cellular immune chip technology, which is a new specific cell technology platform that uses monoclonal antibodies to specifically capture T lymphocytes, and accurately counts cells through intuitive and continuous visual scanning. This study aims to use immune chip technology to establish its own reference range based on large sample data of healthy people, evaluate the differences in T lymphocyte immune function among people with different diseases, and provide clinical evidence for the prevention, diagnosis and treatment of related diseases in Qingyuan.
Objects and Methods
Objects
From June 19, 2020, to April 25, 2021, 8389 specimens were collected from the inpatient department and physical examination department of our hospital, including 4423 males and 3966 females. Their ages were 52.24 ± 15.13 years. All physical examination subjects met the following conditions: recent infectious diseases excluded, no autoimmune diseases or immunodeficiency diseases, and none had recently used drugs that affect the immune system. The study was conducted in accordance with the Declaration of Helsinki (as was revised in 2013). The study was approved by Ethics Committee of the Sixth Affiliated Hospital of Guangzhou Medical University. Written informed consent was obtained from all participants.
Specimen Collection
From June 2020 to October 2020, between 8:00 AM and 15:00 PM, 1–2 mL of fresh intravenous whole blood was collected with an EDTA anticoagulation tube. All specimens were placed at room temperature, and the specimens were processed within eight hours.
Detection Reagents and Instruments
Reagents: CD3-FITC/CD8-PE/CD4-APC fluorescent monoclonal antibody kit (flow cytometry) Beijing Tongsheng Times Biological Co., Ltd. (National Machinery Note 20173404319); CD series (CD3/4/8) Cell detection slides, 2.5–3.5% hydrogen peroxide solution, staining solution for blood cell analysis, phosphate buffer (Shanghai Huizhong Cell Biotechnology Co., Ltd.).
Instruments: BeckmanCytoFlex flow cytometer, BM2000 biological microscope.
Experimental Method
Cellular Immune Chip Detection Technology
Principle: Fix and coat the specific antibody of the target cell on the chip in advance, capture the target cells (such as CD3, CD4, CD8 cell) through the specific reaction of the antigen and antibody, and separate the excess cells through washing, staining and other steps. The cells are separated and fixed on the chip, and an automatic counter is used to complete the absolute cell count detection.
Experimental steps: Fasting venous blood of 1–2 mL was collected from the subject and sent to the EDTA anticoagulation tube for testing. Then, 20 μL to 380 μL PBS was added and mixed well. Five µL of the diluted blood sample was drawn into the CD3+, CD4+, and CD8+ antibody-coated areas, respectively. The slides were placed horizontally in a humid box and incubated for 40 minutes. Immerse in PBS to wash away the excess visible blood cells, soak in peroxidase staining solution and hydrogen peroxide solution in order to capture and fix the corresponding cells by the antibody but are weakly expressed by CD antigen and other cells such as monocytes are distinguished from T lymphocytes. This removes non-specific cells. Wash with ethanol to remove impurities and fix the cell morphology. After drying, immerse the slide in the staining solution for blood cell analysis (ie, basic fuchsin) to stain the CD cells on the surface and finally wash the background with pure water and dry. Use BM2000 biological microscope to automatically count CD3+, CD4+, CD8+ cells, and calculate the number of CD cells per microliter according to the experimental dilution factor. All experimental operations were performed strictly in accordance with the kit instructions, specimen can present results within 2 hours.
Performance Evaluation Verifies the Accuracy and Precision of the Cellular Immune Chip Technology
Correctness experiment: The measurement was repeated 3 times on 3 different human peripheral blood samples, and they were verified by flow cytometry. According to the requirements of the State Food and Drug Administration, the relative deviation (CV) of the test results of the two methods was not higher than 15%.
Precision experiment: For intra-assay and inter-assay precision, the intra-assay precision is to use the same batch to repeat the determination of a human peripheral blood sample 5 times; the inter-assay precision is to use 3 batches of products, and each batch of products is respectively low Value, median, and high value of 3 human peripheral blood samples were measured once. Record the test results and calculate the CV (%) value. According to the requirements of the State Food and Drug Administration, the CV (%) of intra-assay and inter-assay precision is not higher than 20%.
Reference Interval Establishment
Select healthy people for physical examination, collect peripheral blood samples, use immunochip method for detection and analysis, and combine with the normal reference value of the overall level of Chinese T lymphocyte subsets to establish the CD3+, CD4+, CD8+ T cell counts of the population in Qingyuan, Guangdong Province Normal reference range.8,9
Clinical Application
Collect blood samples from people with infections, tumors and healthy physical examinations for group detection and analysis, compare the CD3+, CD4+, CD8+ T cell counts and CD4/CD8 ratios between different groups. At the same time, further analyze the immune function status according to the disease populations suffering from lung cancer, bowel cancer and liver cancer.
Statistical Analysis
Statistical methods: GraphPad Prism 5.0 statistical software was used to analyze and graph the data. Measurement data are expressed as mean plus or minus standard deviation ( ). Differences between the two groups were analyzed by t-tests. Data comparison between multiple groups was by analysis of variance, and correlation was analyzed by Pearson’s. P < 0.05 indicated that the difference was statistically significant.
Experimental Results
Verification of Accuracy
Three different human peripheral blood samples were tested by cellular immunochip method and flow cytometry. The average values of CD3+, CD4+, and CD8+ T cell counts detected by the two methods are very similar and have a high correlation (r > 0.99). The maximum CV is only 3.08%, which shows that the results of the cell immunochip method and the flow cytometry method are consistent, and the product accuracy is high. The CV is less than 15%, which meets the requirements of the State Food and Drug Administration, and the repeatability meets the clinical requirements. See Figure 1, Table 1.
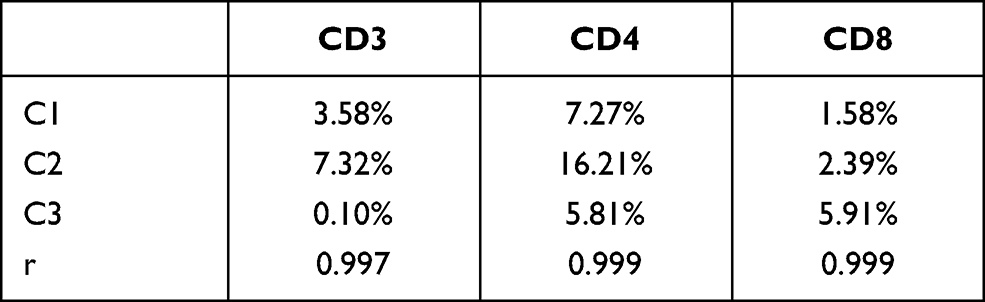 |
Table 1 Comparison of the Results of the Two Detection Methods |
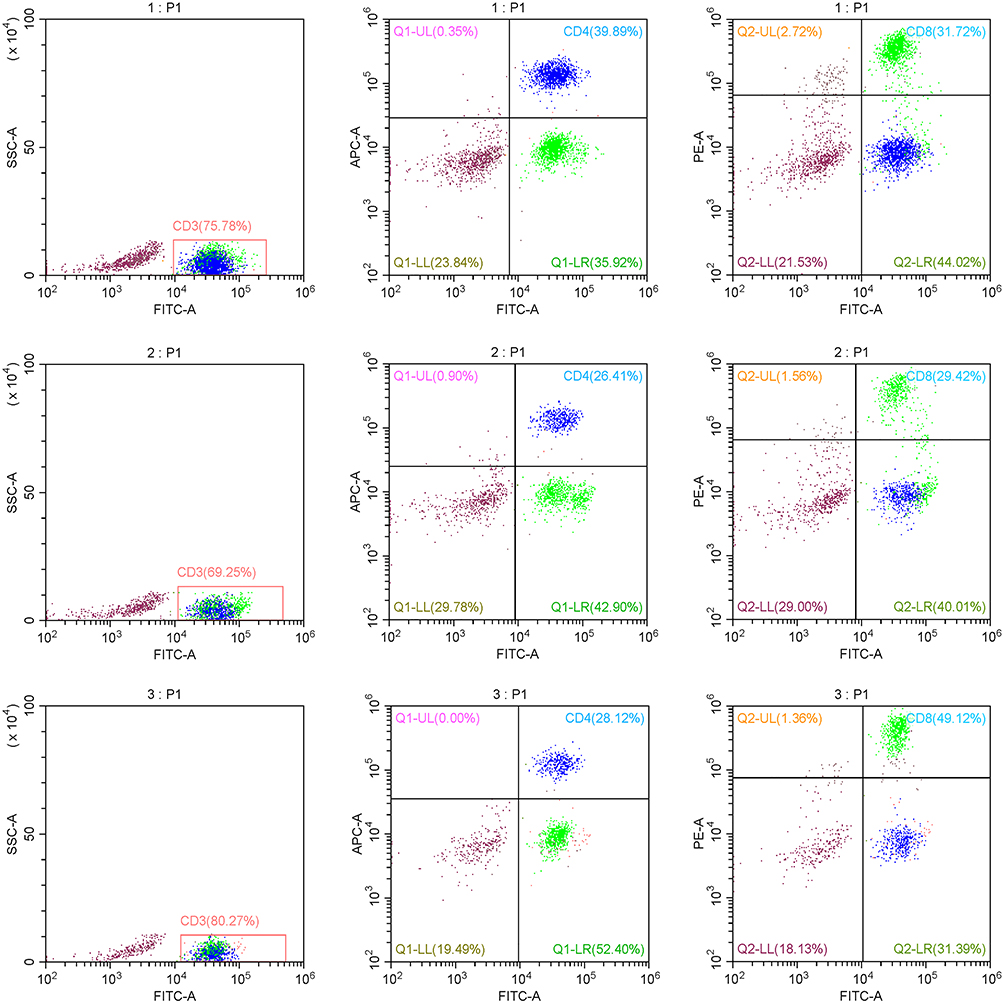 |
Figure 1 Flow cytometric verification chart. |
Precision Verification
CD3+, CD4+, CD8+ T cell count intra-assay precision and inter-assay precision CV (%) are all <20%, and CD3+, CD4+ T cell count intra-assay precision and inter-assay precision CV (%) ≤5%, good experimental repeatability, in line with the requirements of the State Food and Drug Administration, repeatability in line with clinical requirements. See Table 2.
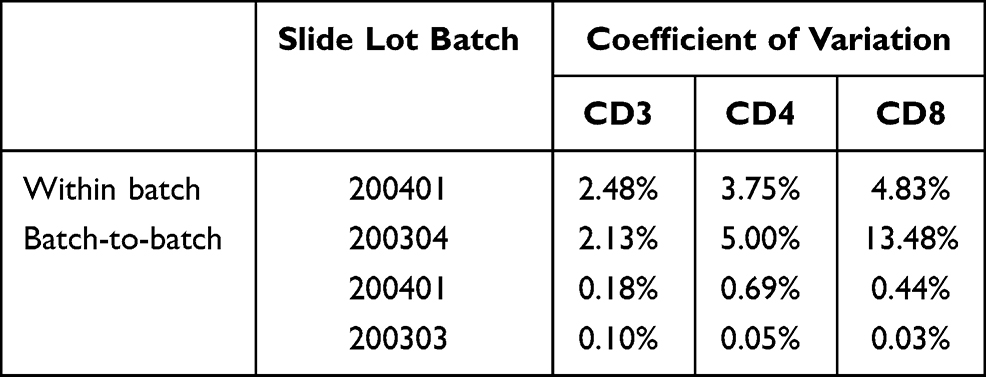 |
Table 2 Analysis Table of Precision Test Results |
Reference Range for Counting of T Cell Subsets in Normal Population
Collected 2839 physical examination samples, including 1500 males and 1339 females, aged 46.37±13.71 years old. The reference ranges for CD3+, CD4+, CD8+ T cell counts and CD4/CD8 ratios are all lower than the results verified by the manufacturer, but they are similar to the flow test data of the Guangdong Provincial Center for Disease Control and Prevention (GPCDCP). This shows that the laboratory needs to establish its own reference. The reference range of self-built CD3+, CD4+, CD8+ T cell count and CD4/CD8 ratio is in line with the basic population data in Qingyuan area, and can be used in clinical application guidance. See Table 3.
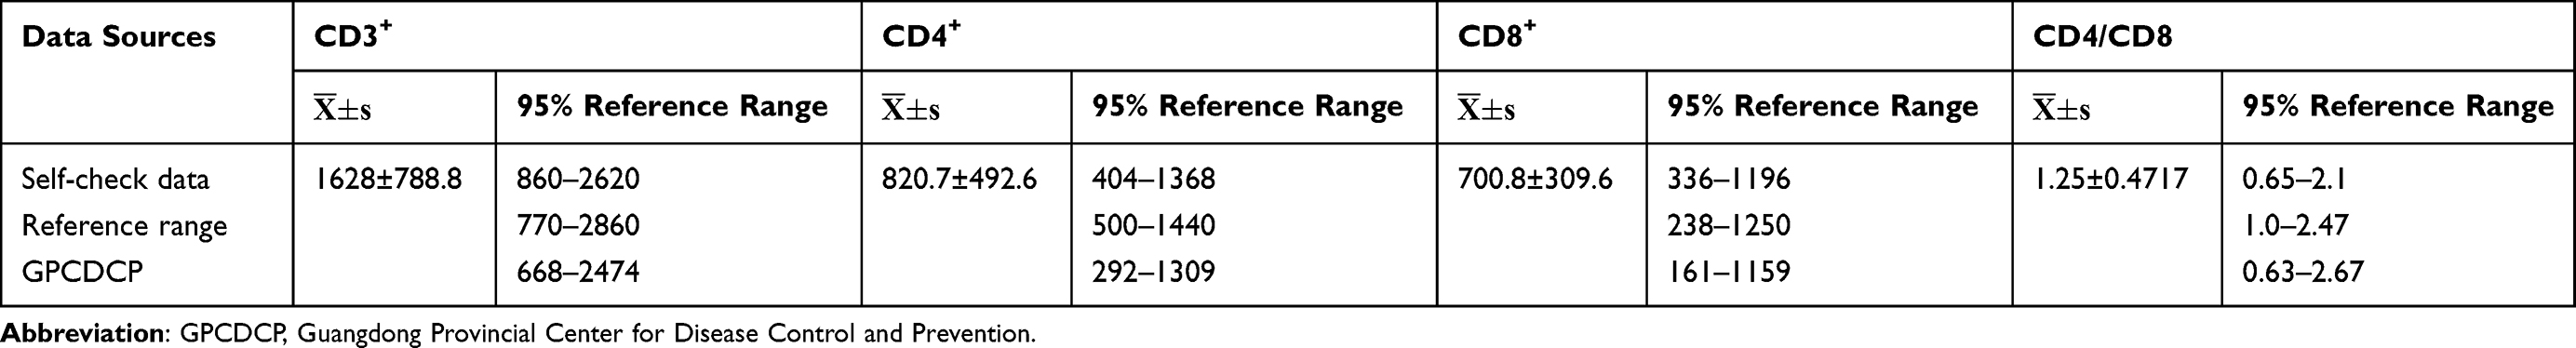 |
Table 3 Comparison of Adult Self-Examination Data and Reference Range of Physical Examination |
The CD3+, CD4+, and CD8+ T Cell Counts of People with Inflammation and Cancer Were Significantly Reduced, and the Ratio of CD4/CD8 Was Significantly Increased
The specimens were divided into physical examination (2839 cases), inflammation (667 cases) and cancer (2029 cases) populations for analysis, and the results found that the CD3+, CD4+, CD8+ T cell counts of inflammation and cancer were significantly lower than those of the physical examination population (P < 0.001), and the cancer population is lower than the physical examination population (P < 0.001 or P < 0.01); the CD4/CD8 ratio inflammation and cancer are significantly higher than the physical examination population (P < 0.001), and the cancer population is higher than the inflammation Crowd (P < 0.01). See Figure 2.
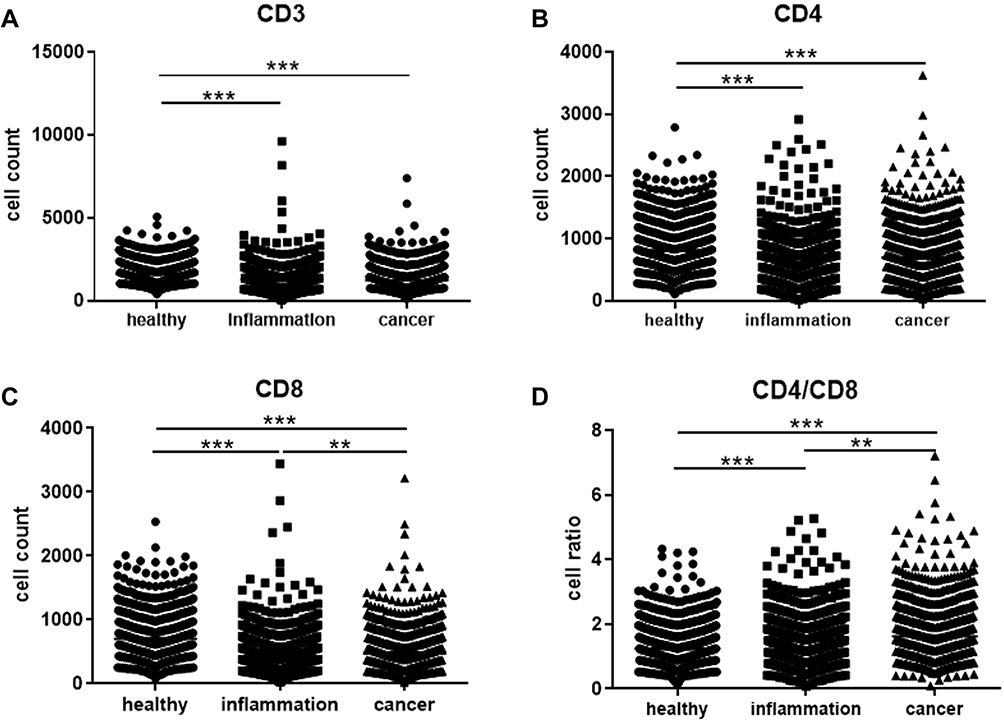 |
Figure 2 CD3+ (A), CD4+ (B), CD8+ (C) T cell counts and CD4/CD8 (D) ratio in physical examination, inflammation and cancer population (**P < 0.01; ***P < 0.001). |
There Were Certain Differences in CD3+, CD4+, CD8+ T Cell Counts, and CD4/CD8 Ratios Between the Male and Female Groups in Physical Examination, Inflammation, and Cancer
In order to compare the differences in immune function between men and women, we divided the physical examination, inflammation and cancer populations into two groups of men and women. The comparative analysis found that the CD3+ and CD4+ T cell counts and the CD4/CD8 ratio of women in the physical examination population were significantly higher than those of men (P < 0.001 or P < 0.01). The CD3+, CD4+, CD8+ T cell counts of men with inflammation are higher than those of women (P < 0.01); the CD3+, CD4+ T cell counts and CD4/CD8 ratios of men with cancer are significantly higher than those of women (P < 0.001 or P < 0.05), see Figure 3.
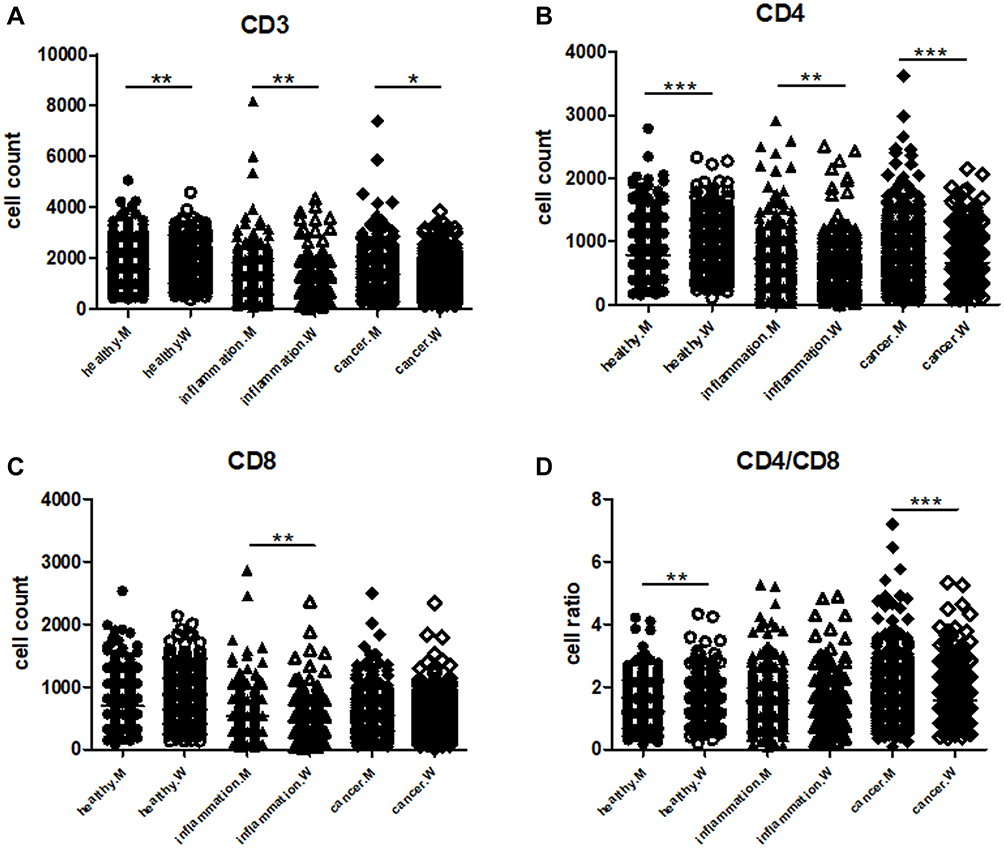 |
Figure 3 CD3+ (A), CD4+ (B), CD8+ (C) T cell counts and CD4/CD8 (D) ratios of men and women with different diseases (*P < 0.05; **P < 0.01; ***P < 0.001). |
Differences in CD3+, CD4+, CD8+ T Cell Counts, and CD4/CD8 Ratios of Different Cancers
Select the more common lung cancer (401 cases), bowel cancer (522 cases) and liver cancer (96 cases) into groups, and analyze their CD3+, CD4+, CD8+ T cell counts and the CD4/CD8 ratio, respectively. The results found that lung cancer and liver cancer All indicators are statistically different (P < 0.05 or P < 0.01). The CD3+, CD4+, and CD8+ T cell counts of bowel cancer and liver cancer were significantly different (P < 0.05 or P < 0.01), but there was no statistical difference between lung cancer and bowel cancer (P > 0.05). See Figure 4.
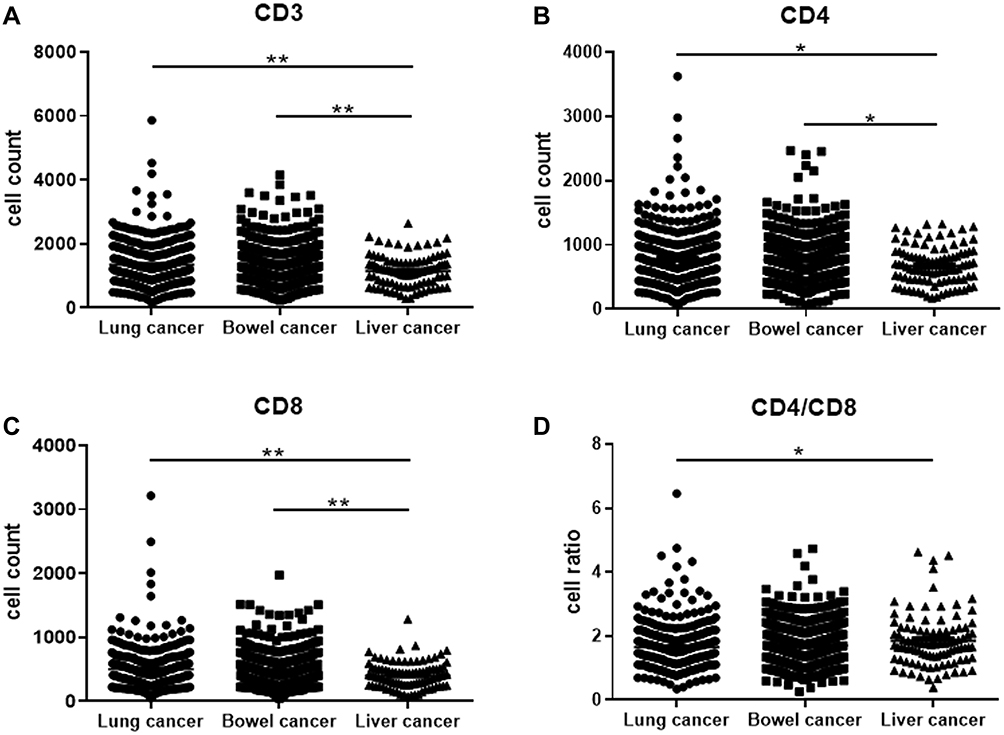 |
Figure 4 CD3+ (A), CD4+ (B), CD8+ (C) T cell counts and CD4/CD8 (D) ratio in lung cancer, bowel cancer and liver cancer population (*P < 0.05; **P < 0.01). |
Discussion
Lymphocytes are immunocompetent cells that participate in the body’s immune regulation and perform cellular immune functions.10 The number, function, and composition ratio of peripheral blood T lymphocytes reflect the body’s cellular immune status. CD3+, CD4+, CD8+ T cell count, and CD4/CD8 ratio can quickly determine whether the human immune function is disordered.11,12 This study showed that the CD3+, CD4+, and CD8+ T cell counts of the people with inflammation and cancer were significantly lower, and the ratio of CD4/CD8 was significantly higher than that of the physical examination population. It shows that the proportion of CD4+ and CD8+ T cells in the diseased population is seriously imbalanced, and cellular immune function is generally suppressed. The human body’s recognition and killing of abnormal cells is weakened, resulting in an imbalance of the body’s immune status.13–15 If it continues to decrease, consider whether there is an immunodeficiency. The CD3+, CD4+, CD8+ T cell counts and CD4/CD8 ratios of the inflammatory population are slightly lower than those of the cancer population. This may be due to the fact that the number of T lymphocyte subsets in the inflammation and cancer population is not only related to the state of the body and the severity of the disease but also to the disease Type-related.16 This study also found that there are certain differences in CD3+, CD4+, CD8+ T cell counts and CD4/CD8 ratios between men and women in different disease groups, and women are higher than men. This may be because women have a more complex immune system than men. Women have more immunoglobulins than men and have stronger natural immune defense capabilities. However, men smoke more, and the immune system’s homeostasis is easily broken. The therapeutic factors cannot be removed in time and effectively, which seriously threatens their health.17 It has been reported that most cancer patients are accompanied by CD3+, CD4+, CD8+ T cell counts and changes in the CD4/CD8 ratio.18–20 This study has confirmed this point of view. It is speculated that the tumor is a cellular immunodeficiency disease. Immune dysfunction or distortion of monitoring capabilities can cause abnormal cells with long-lasting proliferation capacity to be unable to eliminate.
At present, there is no laboratory reference range for specific T lymphocyte subsets in various regions. Most of the research is based on scientific research, and the research range is relatively narrow, which is not enough to establish a reference range for normal values. The normal values used in some hospitals are mainly determined by reference to the BD company’s flow cytometry to detect European and American indicators or combined with clinical sample research. There are certain differences depending on the equipment and reagents used. The reference range established in this study for a large sample of healthy people is lower than the results verified by the manufacturer. This may be related to the geographical difference of the reference population of the manufacturer and the small number of samples, while the reference range established by the Guangdong Provincial Center for Disease Control and Prevention by flow cytometry is very different. It is close, indicating that the accuracy and consistency of the cell immune chip technology and the flow cytometry test results are relatively close. It can be seen that it is very necessary for the laboratory to establish its own reference range, and the self-built reference range for CD3+, CD4+, CD8+ T cell count and CD4/CD8 ratio is in line with the basic population data in Qingyuan area, and the immune status assessment of the population in Qingyuan area is definitely helpful.
Cellular immunochip detection technology is a new technology for absolute count detection of T lymphocytes. Performance evaluations such as accuracy and precision have passed the CFDA approval and at the same time have been approved by the US Patent Office. Compared with flow cytometry, the instruments and detection reagents are expensive, require professionals and require high maintenance;21 MRI detection and tracking technology are tedious to operate, temporarily not suitable for clinical use;3 in situ MHC tetramer staining detection technology is not yet mature;4 circulation cells Counting analysis (FTCA1) is complicated and sophisticated, and the development is more challenging;5 ELISPOT technology mainly detects T cells secreted cytokines, and the absolute counting function is lacking;7 the microfluidic chip platform cell affinity chromatography detection is heavily dependent on fluorescent labeling and imaging.22 The operation of this project is simple, fast and easy to master. It does not require high technical requirements for experimental personnel. The instrument automatically reads and the visual analysis results are objective and accurate. The specimens do not need to be refrigerated. The slides can be stored for a long time. The report time is shortened. It is more suitable for popularization of clinical testing. Instruct clinicians in disease prevention, treatment and prognosis. However, this study still has certain limitations: ① The types of tumor diseases need to be widened. ② The samples included in the study are all case-control studies, there is no related cohort study, and there is insufficient research on the pathogenesis of the disease. ③ The method can only detect CD3+, CD4+, and CD8+ T cells, so it cannot meet the clinical needs for the detection of other subgroups of immune cells in the context of precision medicine.
In summary, the cellular immune chip method is simple and fast to operate, with high accuracy and precision, which can replace flow cytometry and is suitable for clinical use. At the same time, the reference range of CD3+, CD4+, CD8+ T cell counts in Qingyuan area has been established, which can be used for clinical diagnosis. And treatment provides an effective reference interval. The expression of T lymphocyte subsets in peripheral blood can more accurately understand the immune status of different populations, assist the clinic in determining the corresponding treatment prognosis plan, and make it more widely used in the diagnosis of immune-related diseases, disease course monitoring and efficacy evaluation.
Ethics Approval and Consent to Participate
The study was conducted in accordance with the Declaration of Helsinki (as was revised in 2013). The study was approved by Ethics Committee of the Sixth Affiliated Hospital of Guangzhou Medical University. Written informed consent was obtained from all participants.
Acknowledgments
We are particularly grateful to all the people who have given us help on our article.
Funding
This study was funded by the Natural Science Foundation of Guangdong Province (No.2018A030307065), Qingyuan Science and Technology Program Funding in Disease Prevention and Treatment (No.2019A035), Qingyuan People’s Hospital Medical Research Funding 2019 (20190214), Qingyuan Science and Technology Program Funding in the Field of Social Development (No.2018B029).
Disclosure
The authors declare that they have no competing interests.
References
1. Betts G, Jones E, Junaid S, et al. Suppression of tumour-specific CD4+ T cells by regulatory T cells is associated with progression of human colorectal cancer. Gut. 2012;61(8):1163–1171. doi:10.1136/gutjnl-2011-300970
2. Fernández-Ramos AA, Poindessous V, Marchetti-Laurent C, Pallet N, Loriot MA. The effect of immunosuppressive molecules on T-cell metabolic reprogramming. Biochimie. 2016;127:23–36. doi:10.1016/j.biochi.2016.04.016
3. Shebzukhov Y, Holtze S, Hirseland H, et al. Identification of cross-reactive antibodies for the detection of lymphocytes, myeloid cells and haematopoietic precursors in the naked mole rat. Eur J Immunol. 2019;49(11):2103–2110. doi:10.1002/eji.201948124
4. Abdelaal HM, Cartwright EK, Skinner PJ,. Detection of antigen-specific T cells using in situ MHC tetramer staining. Int J Mol Sci. 2019;20(20):5165. doi:10.3390/ijms20205165
5. Bystryak S, Bandwar RP, Santockyte R,. A flow-through cell counting assay for point-of-care enumeration of CD4 T-cells. J Virol Methods. 2019;271:113672. doi:10.1016/j.jviromet.2019.05.012
6. Gohring JT, Fan X,. Label free detection of CD4+ and CD8+ T cells using the optofluidic ring resonator. Sensors. 2010;10(6):5798–5808. doi:10.3390/s100605798
7. Calarota SA, Baldanti F,. Enumeration and characterization of human memory T cells by enzyme-linked immunospot assays. Clin Dev Immunol. 2013;2013:637649. doi:10.1155/2013/637649
8. Qin L, Jing X, Qiu Z, et al. Aging of immune system: immune signature from peripheral blood lymphocyte subsets in 1068 healthy adults. Aging. 2016;8(5):848–859. doi:10.18632/aging.100894
9. Sahmoudi K, El Allam A, El Fakihi S, et al. Moroccan lymphocyte subsets reference ranges: age, gender, ethnicity, and socio-economic factors dependent differences. J Immunoassay Immunochem. 2020;41(3):281–296. doi:10.1080/15321819.2020.1728543
10. Kägi MK, Wüthrich B, Montano E, Barandun J, Blaser K, Walker C. Differential cytokine profiles in peripheral blood lymphocyte supernatants and skin biopsies from patients with different forms of atopic dermatitis, psoriasis and normal individuals. Int Arch Allergy Immunol. 1994;103(4):332–340. doi:10.1159/000236651
11. Honda T, Miyachi Y, Kabashima K. Regulatory T cells in cutaneous immune responses. J Dermatol Sci. 2011;63(2):75–82. doi:10.1016/j.jdermsci.2011.06.004
12. Falay M, Senes M, Korkmaz S, et al. Biological variation of peripheral blood T-lymphocytes. J Immunol Methods. 2019;470:1–5. doi:10.1016/j.jim.2019.04.002
13. Plavina T, Muralidharan KK, Kuesters G, et al. Reversibility of the effects of natalizumab on peripheral immune cell dynamics in MS patients [published correction appears in Neurology. 2020 Oct 6;95(14):661]. Neurology. 2017;89(15):1584–1593. doi:10.1212/WNL.0000000000004485
14. Rubinkiewicz M, Siemińska I, Małczak P, et al. Perioperative changes in lymphocyte subpopulations in patients undergoing surgery for colorectal cancer. Acta Clin Croat. 2019;58(2):337–342. doi:10.20471/acc.2019.58.02.18
15. Wang L, Shen Y. Imbalance of circulating T-lymphocyte subpopulation in gastric cancer patients correlated with performance status. Clin Lab. 2013;59(3–4):429–433.
16. Chen T, Chen Y, Bao W, Lu W. T-lymphocyte subsets and Th1/Th2 cytokines in convalescent patients with Epstein-Barr virus-associated aplastic anemia. Hematology. 2020;25(1):11–16. doi:10.1080/16078454.2019.1702304
17. Fu C, Jiang A. Dendritic cells and CD8 T cell immunity in tumor microenvironment. Front Immunol. 2018;9:3059. doi:10.3389/fimmu.2018.03059
18. Wu Y, Ye S, Goswami S, et al. Clinical significance of peripheral blood and tumor tissue lymphocyte subsets in cervical cancer patients. BMC Cancer. 2020;20(1):173. doi:10.1186/s12885-020-6633-x
19. Gartrell RD, Marks DK, Hart TD, et al. Quantitative analysis of immune infiltrates in primary melanoma. Cancer Immunol Res. 2018;6(4):481–493. doi:10.1158/2326-6066.CIR-17-0360
20. Wang Y, Cheng XJ, Yin AH, et al. Relationship between sleep disorders and lymphocyte subsets and cytokines in patients with lung cancer. J Biol Regul Homeost Agents. 2018;32(5):1231–1237.
21. Strauss K, Hannet I, Engels S, et al. Performance evaluation of the FACSCount system: a dedicated system for clinical cellular analysis. Cytometry. 1996;26(1):52–59. doi:10.1002/(SICI)1097-0320(19960315)26:1<52::AID-CYTO8>3.0.CO;2-I
22. Cheng X, Irimia D, Dixon M, et al. A microfluidic device for practical label-free CD4(+) T cell counting of HIV-infected subjects. Lab Chip. 2007;7(2):170–178. doi:10.1039/B612966H
 © 2021 The Author(s). This work is published and licensed by Dove Medical Press Limited. The full terms of this license are available at https://www.dovepress.com/terms.php and incorporate the Creative Commons Attribution - Non Commercial (unported, v3.0) License.
By accessing the work you hereby accept the Terms. Non-commercial uses of the work are permitted without any further permission from Dove Medical Press Limited, provided the work is properly attributed. For permission for commercial use of this work, please see paragraphs 4.2 and 5 of our Terms.
© 2021 The Author(s). This work is published and licensed by Dove Medical Press Limited. The full terms of this license are available at https://www.dovepress.com/terms.php and incorporate the Creative Commons Attribution - Non Commercial (unported, v3.0) License.
By accessing the work you hereby accept the Terms. Non-commercial uses of the work are permitted without any further permission from Dove Medical Press Limited, provided the work is properly attributed. For permission for commercial use of this work, please see paragraphs 4.2 and 5 of our Terms.