")
Back to Journals » International Journal of General Medicine » Volume 15
Epithelial–Mesenchymal Transition-Based Gene Signature and Distinct Molecular Subtypes for Predicting Clinical Outcomes in Breast Cancer
Authors Hou L, Hou S, Yin L, Zhao S, Li X
Received 18 November 2021
Accepted for publication 14 January 2022
Published 30 March 2022 Volume 2022:15 Pages 3497—3515
DOI https://doi.org/10.2147/IJGM.S343885
Checked for plagiarism Yes
Review by Single anonymous peer review
Peer reviewer comments 2
Editor who approved publication: Dr Scott Fraser
Lili Hou,* Shuang Hou,* Lei Yin, Shuai Zhao, Xiaohua Li
Department of Breast and Thyroid Surgery, Wuzhong People’s Hospital of Suzhou City, Suzhou, 215128, People’s Republic of China
*These authors contributed equally to this work
Correspondence: Shuai Zhao; Xiaohua Li, Tel/Fax +86-18896587005 ; +86-13771721641, Email [email protected]; [email protected]
Purpose: Regulation of inducers and transcription factor families influence epithelial–mesenchymal transition (EMT), a contributing factor to breast cancer invasion and progression.
Methods: Molecular subtypes were classified based on EMT-related mRNAs using ConsensusClusterPlus package. Differences in tumor immune microenvironment and prognosis were assessed among subtypes. Based on EMT genes, a gene signature for prognosis was built using TCGA training set by performing multivariate and univariate Cox regression analyses. Prediction accuracy of the signature was validated by receiver operating characteristic (ROC) curves and overall survival analysis on internal and external datasets. By conducting univariate and multivariate Cox regression analyses, the risk signature as an independent prognostic indicator was assessed. A nomogram was constructed and validated by calibration analysis and decision curve analysis (DCA).
Results: Five molecular subtypes were characterized based on EMT genes. Patients in Cluster 2 exhibited an activated immune state and a better prognosis. An 11-EMT gene-signature was built to predict breast cancer prognosis. After validation, the signature showed independence and robustness in predicting clinical outcomes of patients. A nomogram combining the RiskScore and pTNM_stage accurately predicted 1-, 2-, 3-, and 5-year survival chance. In comparison with published model, the current model showed a higher area under the curve (AUC).
Conclusion: We characterized five breast cancer subtypes with distinct clinical outcomes and immune status. The study developed an 11-EMT gene-signature as an independent prognostic factor for predicting clinical outcomes of breast cancer.
Keywords: epithelial–mesenchymal transition, breast cancer, gene signature, molecular subtypes, nomogram
Introduction
The American Cancer Society’s Global Cancer Statistics 2020 showed that breast cancer, as a common female cancer, accounted for 30% of all cancers in women, ranking the first in incidence and second in mortality among female malignancies.1,2 Since 2004, the incidence of breast cancer continued to show a slow increase (about 0.3% per year).3 Current treatments for breast cancer are radiation therapy, surgery, hormone therapy, chemotherapy, immunotherapy and biologically targeted therapy,4–6 and due to continued advances in treatment, high-quality prevention and early detection, mortality of breast cancer has experienced a decline. However, there are still great challenges in improving the treatment of breast cancer, and patients continue to experience recurrence and metastasis.7 This also requires the discovery of new targets and biomarkers for predicting and treating breast cancer.
Epithelial cells transform into mesenchymal cells during the process of epithelial mesenchymal transition (EMT), which is characterized by downregulation in the expression of cell adhesion molecules7,8 and upregulation in the expression of waveform proteins.9,10 Breast cancer of epithelial origin accounts for 95% of all breast cancers,11 and basal-like breast cancers are more likely to undergo epithelial mesenchymal transition.12 It has been found that breast cancer cells with EMT are more prone to metastasis.13,14 Hiscox et al found that cell-cell junction loss during tamoxifen-resistant MCF7 (TAMR) cell culture, and that epithelial mesoplasmic transformation (EMT) cells show changes in morphological characteristics.15 Inhibition of tumor EMT progression has become an effective method in anti-tumor therapy, and combined treatment of CORM-A1 and DETA/NO can inhibit tumor EMT progression to achieve an anti-tumor effect.16 Still, more studies are needed to systematically elucidate the EMT phenotype of breast cancer and its relationship to prognosis.
Developments in high-throughput genetic testing and large-scale gene expression datasets allow researchers to more accurately identify the key molecular features and combine them with clinical features to better design individualized plans of treatment.17–19 Therefore, we aimed to identify EMT-related genes for breast cancer and predict patient survival.
Materials and Methods
Study Cohort and Data Preprocessing
Relevant clinical data of the samples and RNA-sequencing (RNA-seq) data of breast cancer were retrieved from The Cancer Genome Atlas (TCGA, https://portal.gdc.cancer.gov/) on December 13, 2019. Raw data were normalized and then converted by log2. After removing the samples with incomplete follow-up, 1043 samples of breast cancer were retained and randomly grouped according to the ratio of training set: validation set = 1:1 to ensure unbiased distribution of Age, Stage and Grade stages. Finally, 522 cases and 521 samples from TCGA training dataset and TCGA validation dataset were kept.
Three microarray ovarian carcinoma datasets (accession: GSE20685, GSE58812 and GSE31448) were acquired from the Gene Expression Omnibus (GEO; https://www.ncbi.nlm.nih.gov/geo/) database (on the GPL570 platform). The three datasets contained 327, 107, and 357 breast cancer patients, respectively, and served as external validation sets. See Table 1 for the clinical features of breast cancer samples in the validation and training sets.
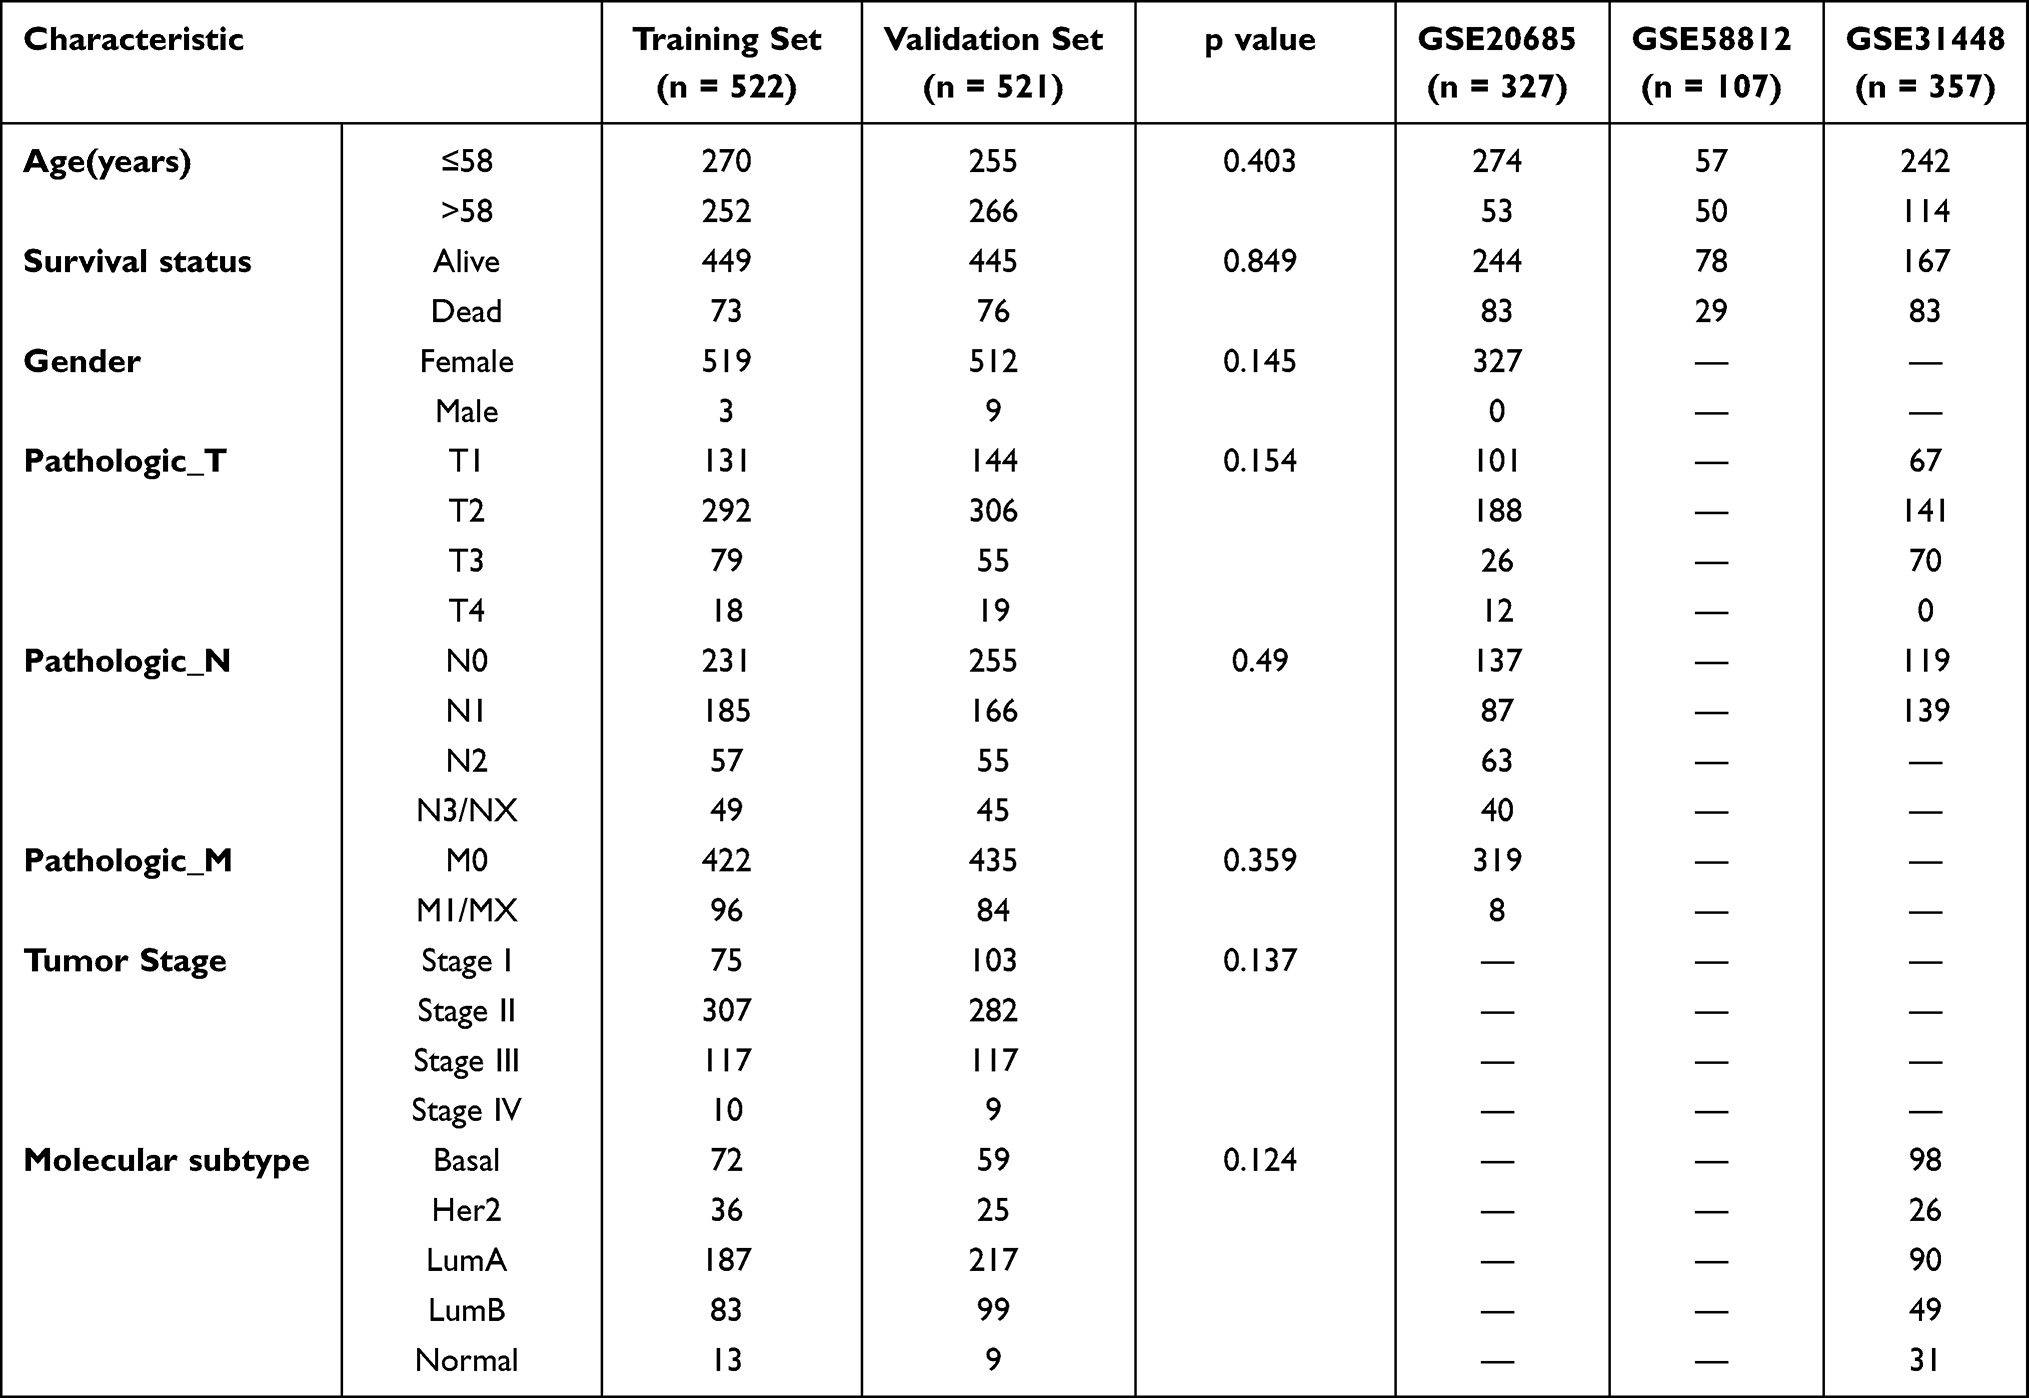 |
Table 1 Clinical Information of Datasets |
A total of 1011 EMT-related genes were collected from publicly open databases (dbEMT: http://dbemt.bioinfo-minzhao.org/20 MSigDB: http://software.broadinstitute.org/gsea/msigdb/index.jsp).
Classification of Breast Cancer
Clustering of ovarian carcinoma samples was based on the expression of EMT-related mRNAs using the ConsensusClusterPlus package in R (version 1.54.0),21 and 80% of the samples were re-sampled. The optimal k was clusters k = 2, 3, 4, ·····9 after multiple sampling to take the cumulative distribution function (CDF) index close to the approximate maximum. Next, principal component analysis (PCA) was performed to verify the current classification based on the mRNA expression profiles of breast cancer.
The Distribution of Clinicopathological Features in Subtypes
Samples with various clinicopathological features, including age (≥58 and <58), M stage, T stage, N stage, stage classical molecular subtypes of breast cancer and six immune subtypes, were distributed across the above five subtypes. In each subgroup, the cancer samples were classified into two risk groups (high and low). The distributions of clinicopathological features among subtypes were assessed by Log rank test.
Immune Cells Infiltration Analysis
TIMER (tumor immune estimation resource) was used to assess the six immune scores of CD8 T cell, CD4 T cell, B cell, Neutrophil, Macrophage, and Dendritic cell in the five Clusters. The ESTIMATE (version 2.0.0) package in R was applied to evaluate the StromalScore, ImmuneScore, and ESTIMATEScore in the five Clusters. Log rank test was performed for comparison.
Analysis on Differentially Expressed Genes (DEGs)
Under FDR < 0.05 and |logFC|≥1, DESeq2 package was used to identify DEGs from five clusters and normal samples. DGEs intersecting with EMT genes were regarded as EMT-related DEGs. KEGG pathways and Gene Ontology (GO) function enrichment (molecular functions (MF), cellular components (CC), biological processes (BP)) were conducted using R package ClusterProfiler. Then, a PPI network of DEGs was created using STRING database (https://string-db.org/),22 and the crucial sub-network was developed in Cytoscape 3.7.2 using the MCODE APP.23
Screening of Stable Feature Genes
Based on the DEGs obtained, prognosis-related EMT genes from TCGA training set were screened according to p < 0.05 using performing univariate Cox regression survival analysis. Subsequently, independent prognostic markers for breast cancer OS were filtered using LASSO Cox regression (in R package glmnet). The RiskScore was calculated using the following formula:

Coefficient(mRNAi) was the coefficient of each gene in which n shows gene number in a module. Expression(mRNAi) represented a gene mRNA expression.
Samples in the TCGA training were grouped into high-risk and low-risk groups by the cut-off of median RiskScore. The prognostic significance of RiskScore in the two groups was analyzed using Kaplan Meier. Receiver operating characteristic (ROC) curves were used to assess the sensitivity and specificity. The relationship between clinical parameters and RS was further studied.
We also validated the current risk signature in TCGA validation, the entire TCGA dataset, GSE20685, GSE58812 and GSE31448 dataset.
Independence of the Prognostic Model
Univariate Cox regression analysis was conducted to examine the relationships between age, pT, pN, pM, pTNM_stage, Luminal_subtype and RiskScore. Clinical factors that could independently predict the outcomes of breast cancer patients were determined by multivariate Cox regression survival analysis according to Hazard ratio (HR), 95% confidence interval (CI) and p-value.
A Predictive Nomogram Was Developed
RiskScore and pTNM_stage, which are the two independent prognostic factors, were incorporated into a nomogram model for predicting the 1-, 2-, 3-, and 5-year survival using R package rms. The calibration plots were generated to examine nomogram-predicted survival and actual survival using the rms package in R. Decision curve analysis (DCA) curve and AUC curve were employed to compare the prediction model combined with clinical outcome for evaluating whether the nomogram was suitable in clinical practice.
Comparison with Published Models
To verify the strong performance of our model, three recently published breast cancer prognosis models (four-mRNA model by Qi et al,24 19 genes signature by Su et al,25 and the six-gene signature by Wang et al26) were recruited for comparison. To ensure comparability, the same method was applied to calculate risk score of TCGA samples using the genes in the models. The ROC of each model and KM curve was analyzed.
Results
Five Molecular Subtypes of EMT-Related mRNAs in Breast Cancer
From 979 EMT genes, univariate Cox analysis filtered 119 EMT genes used, which showed different expression changes across 1043 breast cancer samples. Unsupervised hierarchical clustering on the 119 EMT genes classified five major sample clusters, namely, Cluster 1, Cluster 2, Cluster 3, Cluster 4 and Cluster 5 (Figure 1A). The results of PCA principal component analysis on 979 EMT genes indicated that the five subtypes had significant differences (Figure 1B). From the heat map analysis of genes, it could be observed that the overall EMT gene expression of Cluster 2 was low, while the EMT gene expression of Cluster 3 and 5 was high (Figure 1C). Based on the survival risk curve, patients in Cluster 2 showed a significantly longer overall survival, while Clusters 1 and 5 had obviously poor prognosis (Figure 1D).
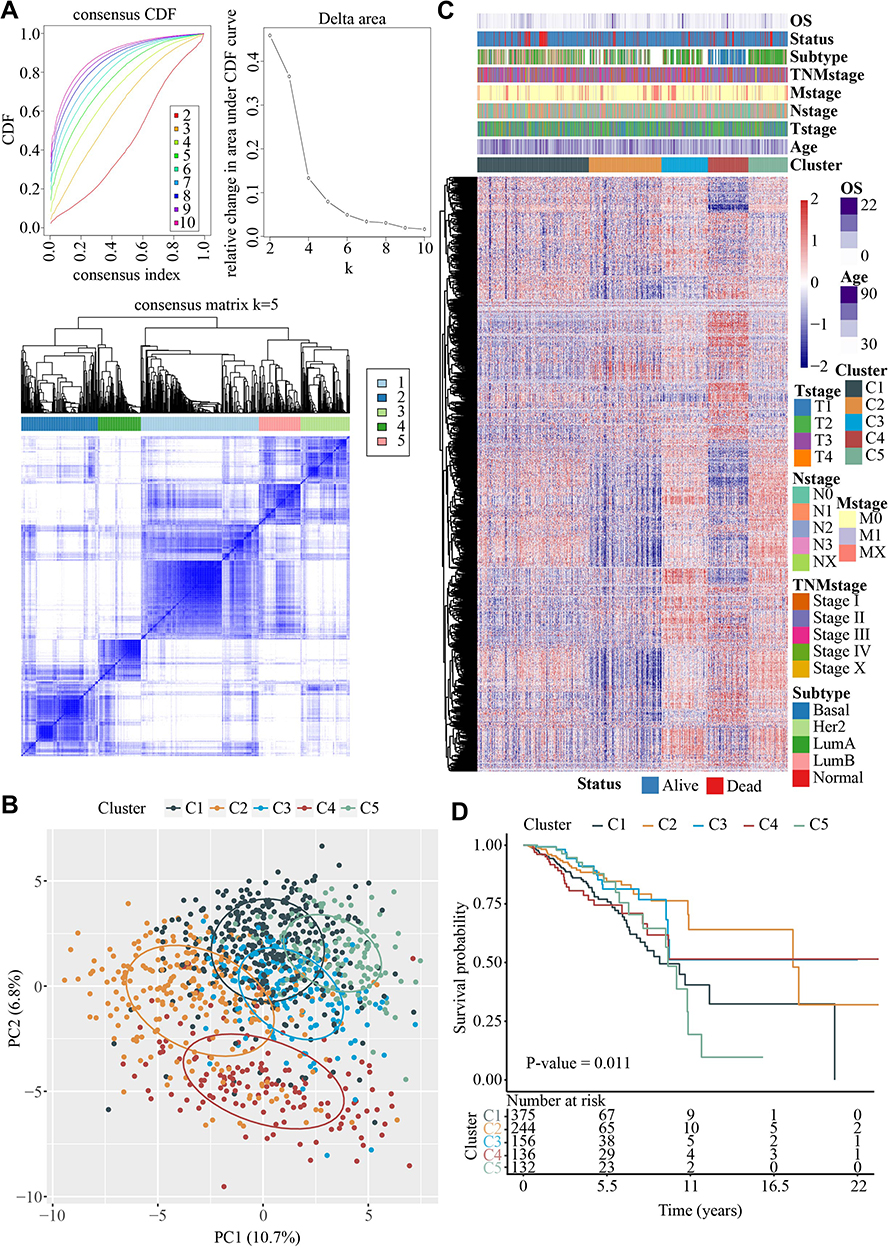 |
Figure 1 Five molecular subtypes of EMT-related mRNAs in breast cancer. (A) Upper left, CDF curves; Lower left, CDF Delta area curve; Right side, Delta area curve of consensus clustering, indicating the relative change in area under the cumulative distribution function (CDF) curve for each category number k compared with k-1. The horizontal axis represents the category number k and the vertical axis represents the relative change in area under CDF curve; Heatmap of sample clustering at k = 5. (B) Principal components analysis (PCA) among five clusters based on the EMT-related genes. (C) Heat map analysis of EMT-related genes showed that the overall EMT genes expression of Cluster 2 were low, while high in Cluster 3 and 5. (D) Kaplan-Meier prognosis curves of 5 clusters showed that samples in Cluster 2 had best prognosis. |
Association Between Five Subtypes, Clinical Features and Known Subtypes
In TCGA dataset, 1043 cases were included to analyze the relationship between clinicopathological characteristics and the clusters using chi-square test. It was found that the Cluster 4 samples were younger, and that all the clusters were significantly associated with clinicopathological characteristics (Figure 2).
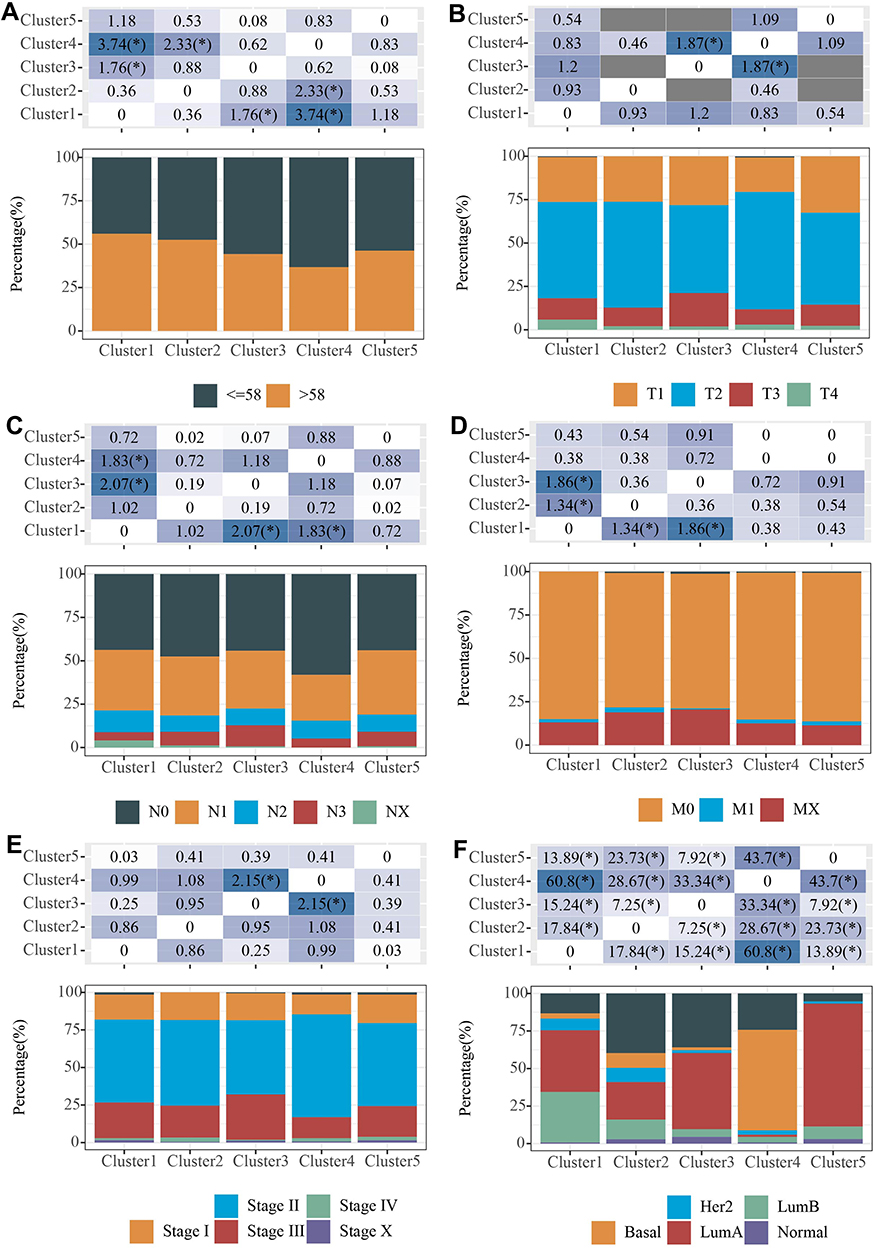 |
Figure 2 Association between five subtypes and clinical features. (A) Distribution of age samples in 5 subtypes; (B) Distribution of T-stage samples in 5 subtypes; (C) Distribution of N-stage samples in 5 subtypes. (D) Distribution of M-stage samples in 5 subtypes. (E) Distribution of Stage staged samples in 5 subtypes. (F) Distribution of typical molecular subtype samples in 5 subtypes. Chi-square test was used, *P<0.05. |
In 2018, Vesteinn Thorsson et al identified 6 immune subtypes for 33 tumors in TCGA (DOI: 10.1016/j.i mmuni. 2018.03.023), including C6 (TGF-beta advantage), C5 (silence on immunological), C4 (lymphocyte depletion), C3 (inflammation), C2 (INF-r dominant), and C1 (healing). Comparative analysis demonstrated that there was more C4 (lymphocyte depletion) samples in Cluster 1, more C2 (INF-R dominant) cases in Cluster 2 and Cluster 4, and more C3 (inflammation) patients in Cluster 3 and Cluster 5 (Figure 3A). Cluster 4 had higher Basal samples, and Cluster 3 and Cluster 5 had the highest percentage of LumA samples compared with classical subtypes (Figure 3B).
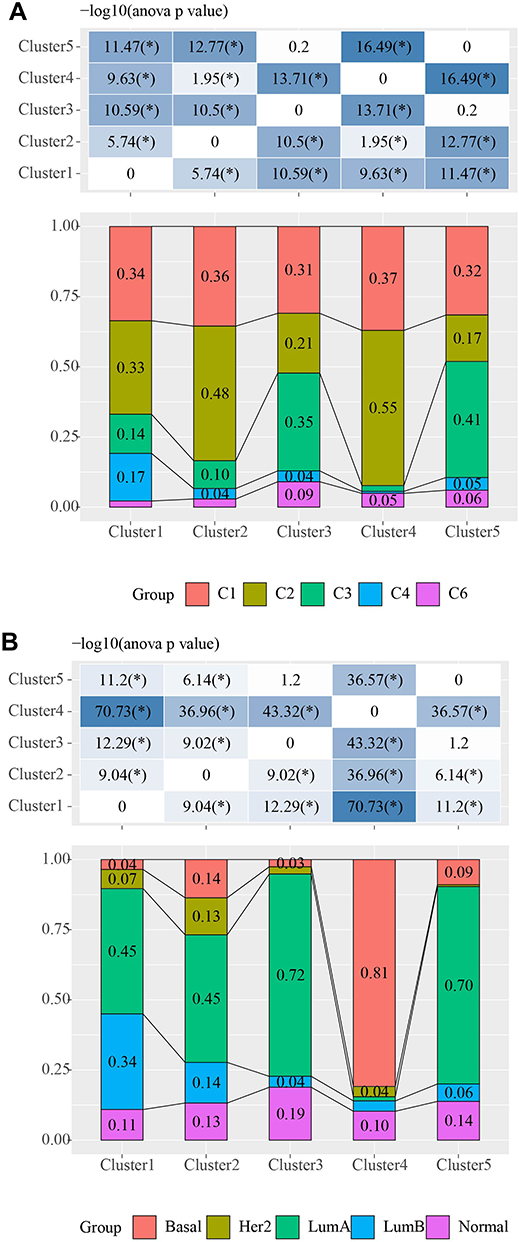 |
Figure 3 Association between five subtypes and known subtypes. (A) Distribution of published subtypes in 5 subtypes, where different colors represent published isoforms; (B) Distribution of typical molecular subtype (Basal, Her2, LumA, LumB and Normal) samples in 5 subtypes. Chi-square test was used, *P<0.05. |
Relations Between Tumor Immune Microenvironment and the Five Subtypes
Tumor immune microenvironment plays an important role in cancers. The association between tumor immune microenvironment and two subtypes was examined. TIMER tool was used to calculate CD4 T cell, B cell, Neutrophil, CD8 T cell, Macrophage and Dendritic cell score of each breast cancer sample in TCGA dataset, and the results showed that the scores of the six immune cells were higher in Cluster 3 and lower in Cluster 1 than those in the other subtypes (Figure 4A). Furthermore, the StromalScore, ImmuneScore and ESTIMATEScore of the breast cancer samples were determined using the ESTIMATE. Our data revealed that StromalScore was higher in Cluster 3, while ImmuneScore and ESTIMATEScore were higher in Cluster 2 (Figure 4B). It was found that the immune and matrix scores were higher in the group with favorable prognosis.
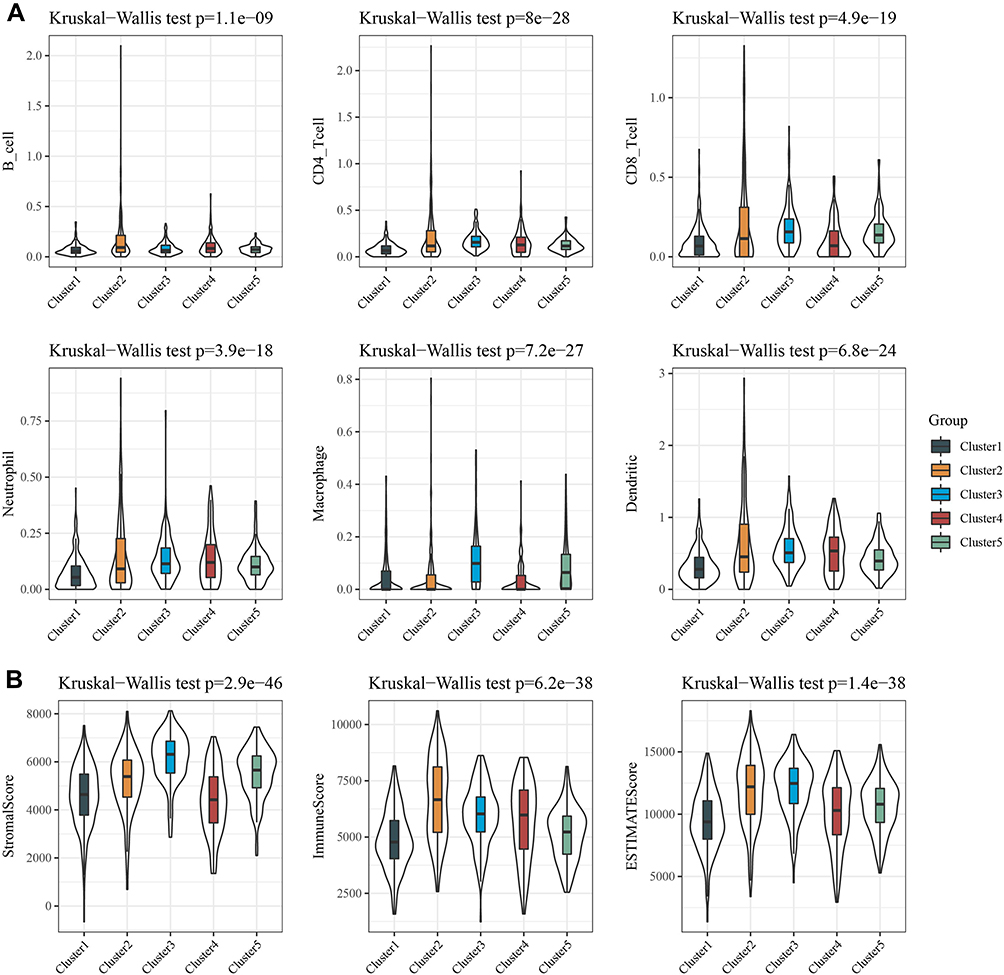 |
Figure 4 Association between five subtypes and tumor immune microenvironment. (A) B cell score, CD4 cell score, CD8 cell score, Neutrophil cell score, Macrophage cell score and Dendritic cell score were higher in Cluster 3, while lower in Cluster 1. (B) Immune Score, StromalScore and ESTIMATE Score in five molecular subtypes. |
Identification of Differentially Expressed Genes (DEGs)
Based on the gene expression profiles of breast cancer, EMT-associated DEGs among five subtypes and normal samples were selected using DESeq2. There were 5014 DEGs in Cluster 1, 5628 DEGs in Cluster 2, 3607 DEGs in Cluster 3, 5803 DEGs in Cluster 4, 4093 DEGs Cluster 5. Finally, a total of 4908 DEGs were filtered after the duplication has been removed (Figure 5A). Among them, there were a total of 387 intersections with EMT genes (Figure 5B).
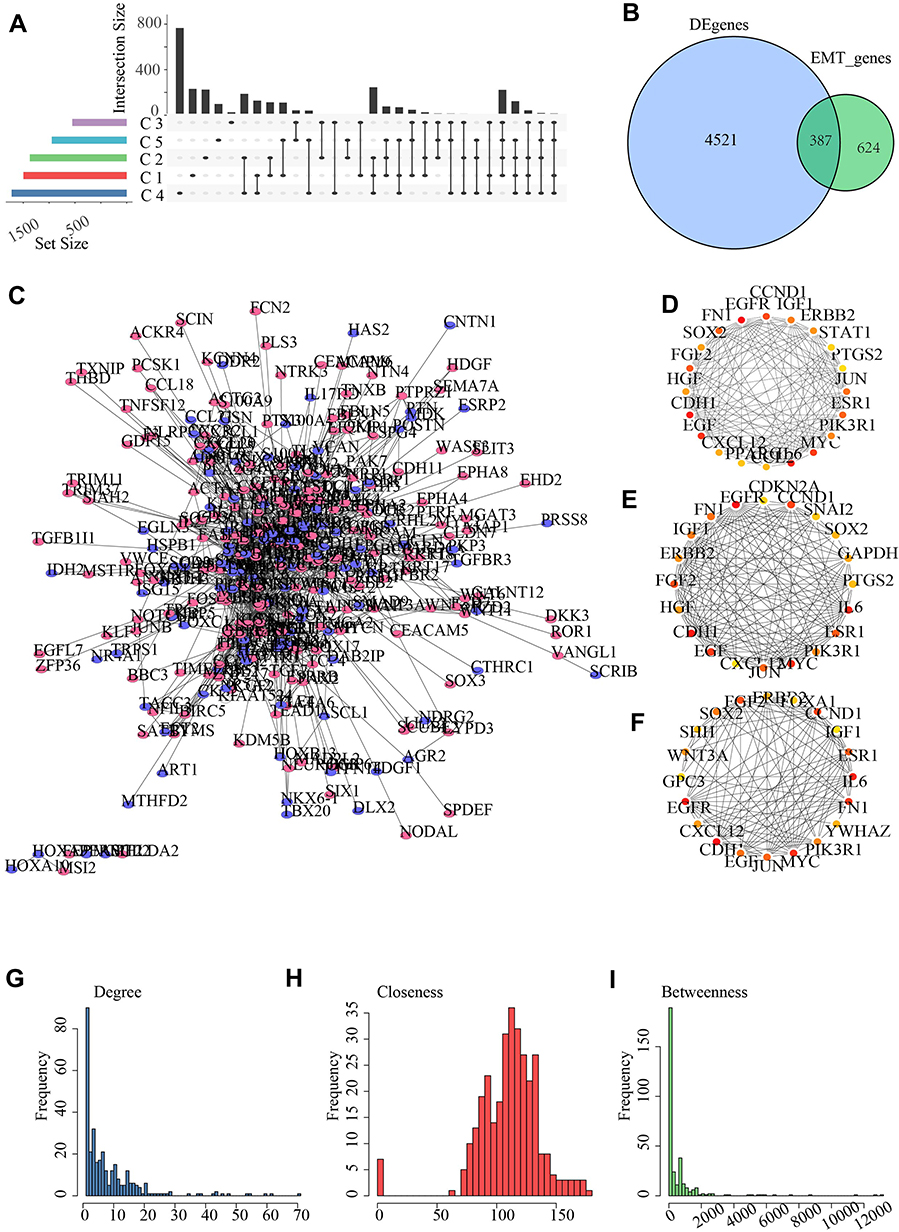 |
Figure 5 Identification of differentially expressed genes (DEGs). (A) The shared differentially expressed genes among the 5 subtypes. (B) The shared differentially expressed genes of subtypes intersected with EMT genes. (C) 387 genes mapped to the protein interactions network, red represents differentially up-regulated genes and purple represents differentially down-regulated genes; (D) Hub nodes identified by Degree method; (E) Hub nodes in the network identified by Closeness algorithm; (F) Hub nodes identified by Betweenness, where the redder color means higher score; (G–I) Degree distribution of the network, Closeness distribution of the network, and Betweenness distribution of the network. |
Next, the KEGG and GO function enrichment analysis was conducted using the R software package Clusterprofiler on 387 EMT-related DEGs. Based on the pathway enrichment analysis, the DEGs were enriched in 80 KEGG pathways, such as Wnt signaling pathway, PI3K-Akt signaling pathway, Breast cancer (Figure S1A). GO analysis results indicated that 387 genes were significantly enriched in 2277 BP terms, 53 CC terms and 92 MF terms (Figure S1B–D).
As the study of interaction network between proteins could help to mine key genes, to identify the potential regulatory genes for breast cancer, we mapped the 387 EMT-related DEGs into a human PPI network. The PPI network of DEGs was built with the use of STRING database, and then 387 genes were mapped to 1429 interaction relationships (Figure 5C). Based on the Closeness, Degree, and Betweenness methods, hub node identification was further used by Cytohubba module in Cytoscope, and hub genes obtained by the three analysis methods were basically the same (Figure 5D–F). The distribution of degrees in the network presented a power-law distribution (Figure 5G), the closeness of most nodes in the network was overall higher above 5 (Figure 5H), and the Betweenness of most nodes in the network was overall lower below 10 (Figure 5I). The nodes simultaneously meet Degree, Closeness and Betweenness and above their median value were considered as the hub gene of the pathway network. Here, a total of 113 genes were identified to closely participate in the initiation and development of breast cancer.
EMT-Associated Prognostic Markers Among DEGs and a Risk Signature Established
To identify EMT-associated prognostic markers from the DEGs, we conducted univariate Cox regression analysis on overall survival (OS) data from 522 TCGA training tumor samples and the RNAseq illuminaHiseq data. The results demonstrated that 11 DEGs were significantly related to the OS (p < 0.05). The most representative prognostic mRNA markers were screened by performing LASSO Cox regression analysis, the results showed (Figure 6A) 7 down-regulated genes and 4 up-regulated as the powerful representative prognostic markers. Furthermore, the risk score was calculated based on the coefficient of each marker obtained from the LASSO analysis as follows: RiskScore11 = −0.05*IRS2+0.274*EZR-0.027*VIM+0.188*F11R-0.245*MMP7-0.182*LEF1+0.077*ERBB2+0.349*SDC1-0.046*CCND2-0.086*CXCL9-0.117*TLN1.
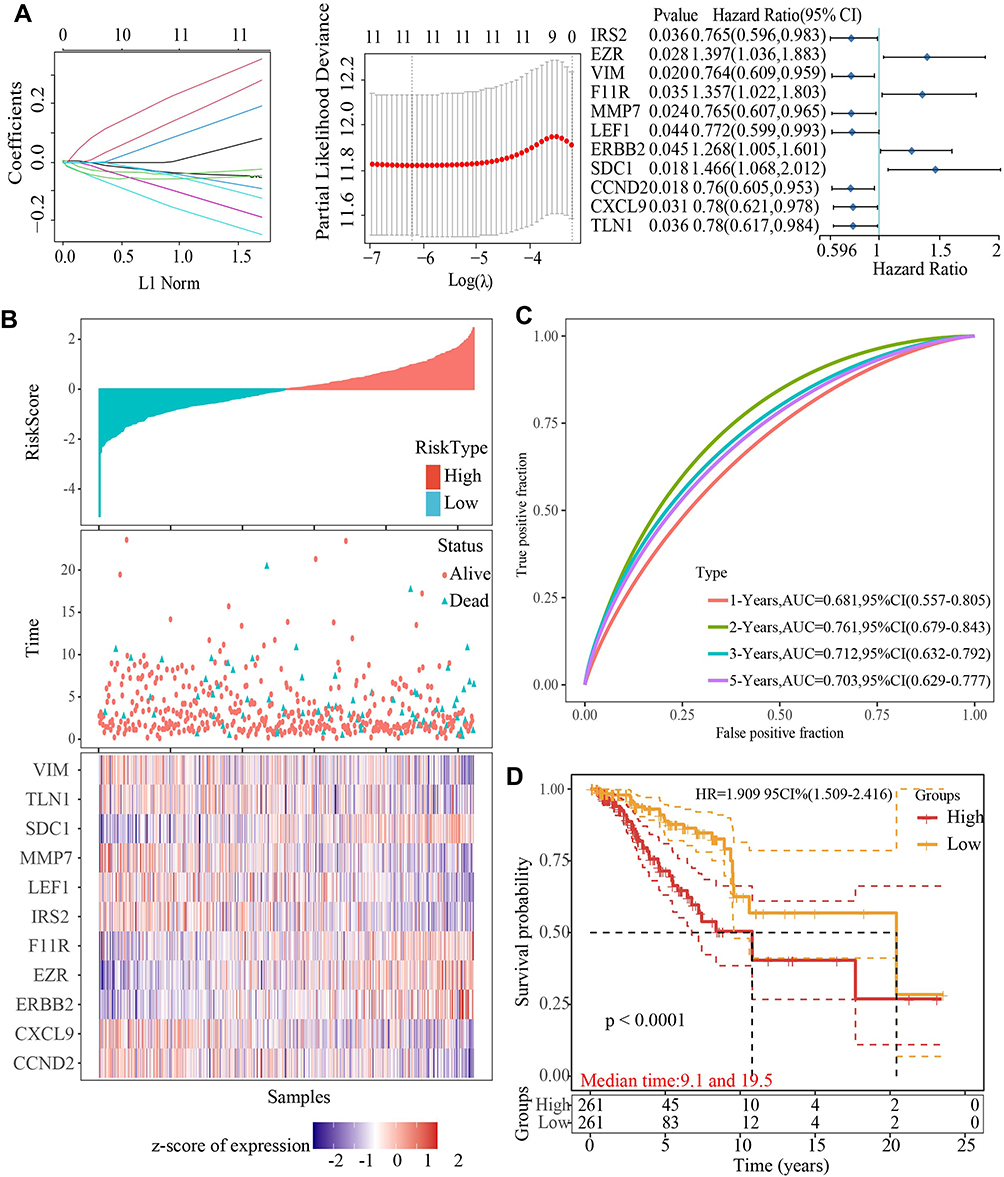 |
Figure 6 Establishment of an EMT-related genes risk signature. (A) The confidence interval under each lambda, the change trajectory of each independent variable, the horizontal axis represents the independent variable lambda value, and the vertical axis represents the coefficient of the independent variable; Univariate survival Cox result forest plot of 11 genes; (B) A: risk score, survival time and survival status and 11 gene expressions in the The Cancer Genome Atlas training set; (C) Receiver operating characteristic curve and area under the curve of 11-genes signature classification in The Cancer Genome Atlas training set; (D) Kaplan-Meier survival curve of 11-genes signature in the training set. |
Based on the median risk score value, TCGA training breast cancer patients were grouped into the low- and high-risk groups. The number of deceased patients was found to be gradually increasing as the risk score increased. Distinct differences in the expression of the 13 genes were detected between the two risk groups (Figure 6B). The sensitivity and specificity AUC values were 0.618, 0.761, 0.712 and 0.703 for 1-, 2-, 3-, and 5-year ROC curve (Figure 6C), respectively, suggesting a strong prediction ability. In the high-risk group, the OS of patients was lower than in the low-risk group (Figure 6D).
The Stability and Reliability of the Signature in Predicting Prognosis of Breast Cancer
The prognostic significance of the risk score was also validated based on 11 EMT-related genes screened from TCGA internal dataset and entire TCGA dataset. Consistent with the training set, the AUCs of the ROC curves for 1-, 2-, 3-, and 5-year OS were 0.784, 0.634, 0.652 and 0.634, respectively, which demonstrated a high accuracy and relatively high sensitivity of the model. Moreover, breast cancer patients of TCGA internal dataset in the high-risk group tended to show a shorter OS time than those in the low-risk group (Figure 7A). As expected, in entire TCGA dataset, the AUCs of the ROC curves for 1-, 2-, 3-, and 5-year OS were 0.724, 0.692, 0.697 and 0.667, respectively, and there were significant OS differences of the two risk groups (Figure 7B).
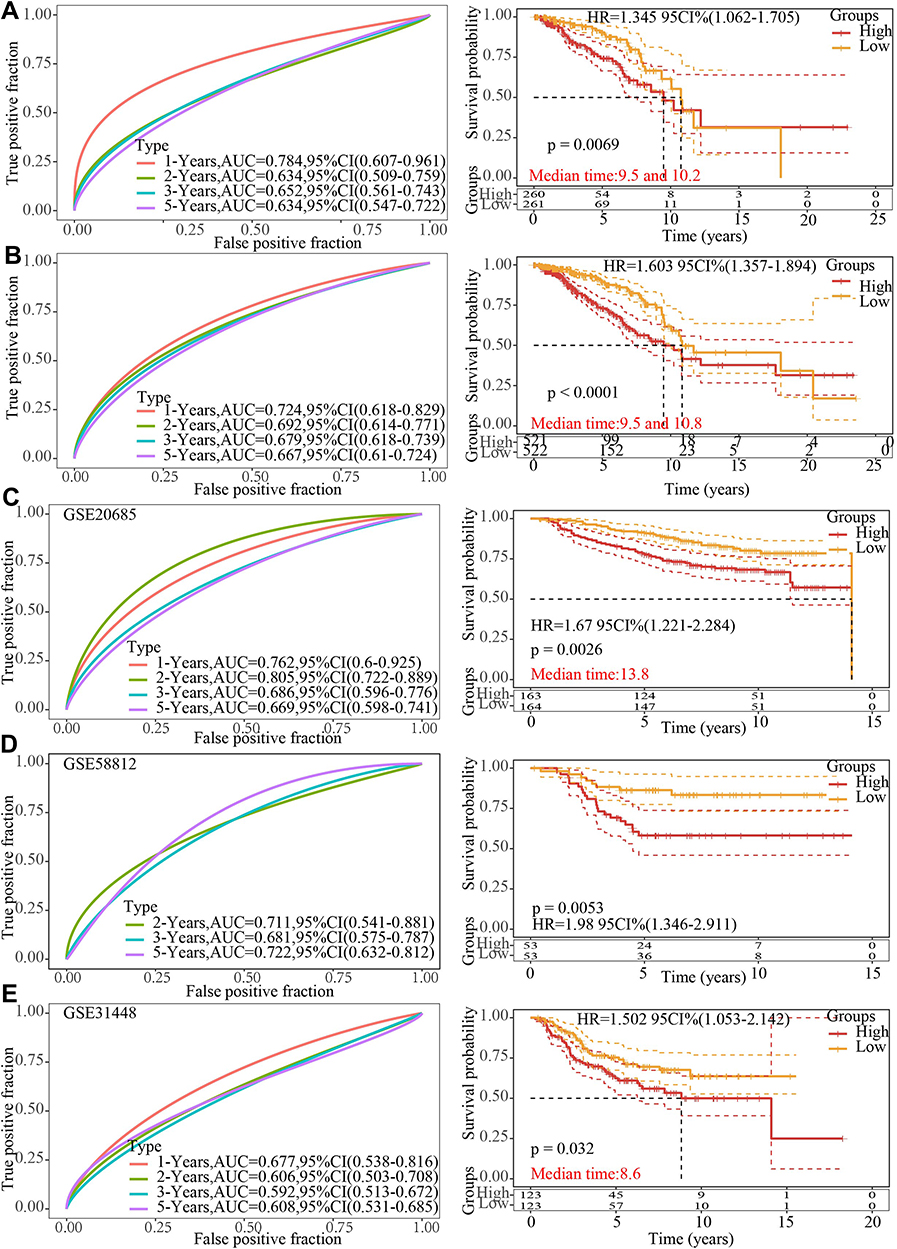 |
Figure 7 Evaluation of the stability and reliability of the signature. (A) Receiver-operating characteristic curve and Kaplan-Meier survival curve of 11-genes signature classification in The Cancer Genome Atlas internal validation set. (B) Receiver operating characteristic curve and Kaplan-Meier survival curve of 11-genes signature classification in entire The Cancer Genome Atlas dataset. (C) Receiver operating characteristic curve and Kaplan-Meier survival curve of 11-genes signature classification in GSE20685 dataset. (D) Receiver operating characteristic curve and Kaplan-Meier survival curve of 11-genes signature classification in GSE58812 dataset. (E) Receiver operating characteristic curve and Kaplan-Meier survival curve of 11-genes signature classification in GSE31448 dataset. |
Cross-platform validation could explain the broad applicability of the model, and three independent external datasets (GSE20685, GSE58812 and GSE31448 datasets) were used for verification. In GSE20685 dataset, the AUCs of the ROC curves for 1-, 2-, 3-, and 5-year OS were 0.762, 0.805, 0.686 and 0.669, respectively, and breast cancer patients in the low-risk group presented a longer OS than the high-risk group (Figure 7C). In GSE58812 dataset, the AUCs of the ROC curves for 2-, 3-, and 5-year OS were 0.711, 0.681 and 0.722, respectively, and those in the high-risk group had a poorer OS than the low-risk group (Figure 7D). In GSE58812 dataset, the AUCs of the ROC curves for 1-, 2-, 3-, and 5-year OS were 0.677, 0.606, 0.592 and 0.608, respectively, with significant differences of OS between two groups (Figure 7E).
Analysis RiskScore and Clinicopathological Features
Clinicopathological data, including T Stage, Age, S Stage, M Stage, N Stage, and classical classification, came from the TCGA dataset. Chi-square test demonstrated that, except for M Stage, all other clinical factors showed great differences between the two risk groups (high and low) (Figure S2A–F).
Risk score prognostic characteristics were investigated by stratification analysis. In ≥58 and <58 subgroups, patients with high risk scores developed a poor prognosis than those who scored as having a low risk. In the high-risk group, patients at stage II and III showed a poorer prognosis than those in the low-risk group. Regardless of whether it was a T2 or T3, high-risk score seemed to be related to a shorter time of survival than those with a low-risk score. At N2 and N3 stages, a high-risk group of patients demonstrated a shorter time of survival. We also found that at LumB stage, the high-risk score was indicative of a shorter survival (Figure S3).
The RiskScore as an Independent Factor for Breast Cancer Prognosis
The independence of the risk score on prognosis prediction of breast cancer was evaluated. The results of univariate cox regression analysis on the training set showed that prognosis of breast cancer patient was significantly associated with T stage [p < 0.0001 and HR (95% CI) = 1.46 (1.195–1.784)], Age [p < 0.0001 and HR (95% CI) = 1.035 (1.022–1.049)], Stage [p < 0.000 and HR (95% CI) = 1.737 (1.483–2.033)], N stage [p < 0.0001 and HR (95% CI) = 1.608 (1.405–1.839)], and risk score [p < 0.001 and HR (95% CI) = 2.176 (1.655–2.861)] (Figure 8A). Multivariate cox regression analysis demonstrated that risk score [p < 0.001 and HR (95% CI) = 1.667 (1.228–2.291)], Stage [p = 0.004 and HR (95% CI) = 1.81 (1.207–2.713)], and Age [p < 0.0001 and HR (95% CI) = 1.036 (1.228–2.291)] were the independent prognostic factors for breast cancer (Figure 8B).
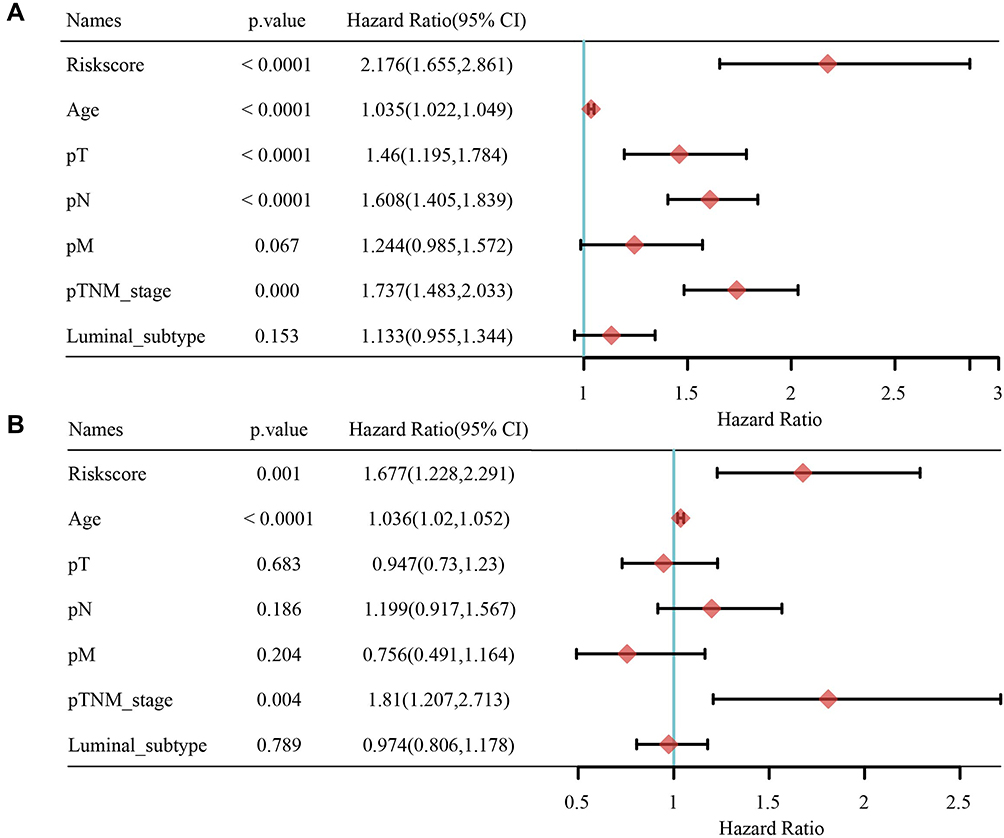 |
Figure 8 The RiskScore is an independent prognostic factor for breast cancer. (A) Univariate cox regression analysis of RiskScore and Clinicopathological Features. (B) Multivariate cox regression analysis of RiskScore and Clinicopathological Features. |
Development of a Personalized Prognostic Prediction Nomogram for Breast Cancer
Age, stage and risk scores were three independent prognostic factors used here to develop a nomogram to predict the 1-, 2-, 3-, and 5-year survival of the TCGA dataset samples (Figure 9A). The data showed that the 1-, 2-, 3-, and 5-year OS evaluated by the nomogram was highly close to the actual time of survival (Figure 9B). ROC analysis indicated a high potential of the nomogram in clinical application (AUC = 0.8) (Figure 9C). The performance of the nomogram model was reflected by the DCA curve (Figure 9D).
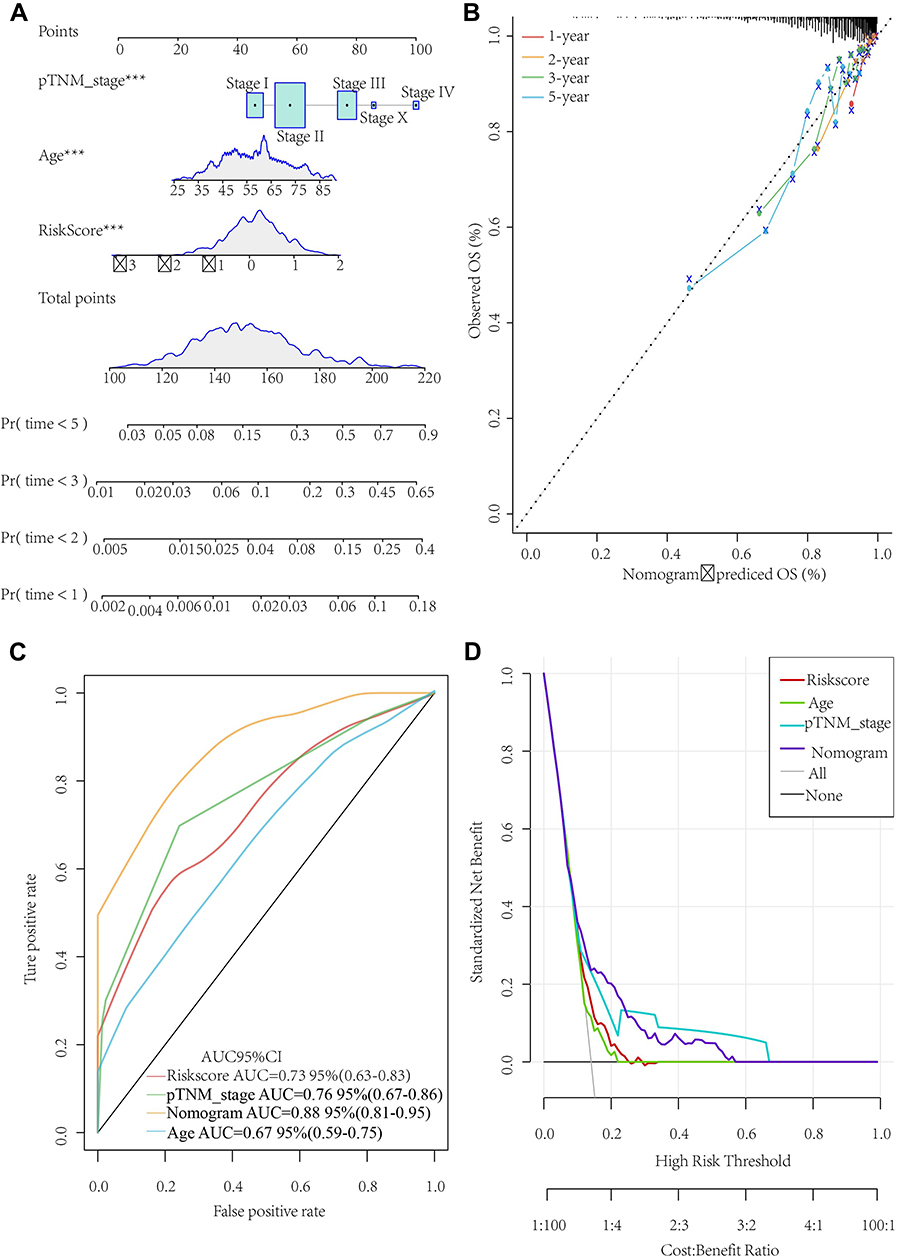 |
Figure 9 Development of a personalized prognostic prediction nomogram for breast cancer. (A) Nomogram for prediction of the 1-, 2-, 3-, and 5-year survival probability in the The Cancer Genome Atlas dataset. (B) The calibration plots for predicting patient 1-year, 2-year, 3-year and 5-year overall survival. (C) Receiver operating characteristic curve of Age, Stage, RiskScore and Nomogram. (D) Decision curve analysis curve of Age, Stage, RiskScore and Nomogram. |
Superiority of the Model
Three recently published breast cancer prognostic models (four-mRNA model by Qi, 19 genes signature by Su et al,25 six-gene signature by Wang) were compared with our model. To allow the models to be more comparable, the RiskScore of breast cancer samples in TCGA data was calculated with the same method using corresponding genes from the three models, the ROC of each model was determined, and subsequently the samples were divided into two groups (high-risk and low-risk), according to the median risk score. For Qi’s model, AUCs of the ROC curves for 2-, 3-, and 5-year OS were 0.52, 0.55 and 0.56, respectively, and marginal prognostic difference was detected between the two risk groups (Figure 10A). For Su’s model, the AUCs of the ROC curves for 1-, 2-, 3-, and 5-year OS were 0.68, 0.67, 0.69 and 0.68, respectively, and a significant prognostic difference was detected between two risk groups (Figure 10B). For Wang’s model, the AUCs of the ROC curves for 1-, 2-, 3-, and 5-year OS were 0.57, 0.6, 0.65 and 0.65, respectively, and there was significant prognostic difference between two risk groups (Figure 10C). In general, our model showed a better performance than the three models.
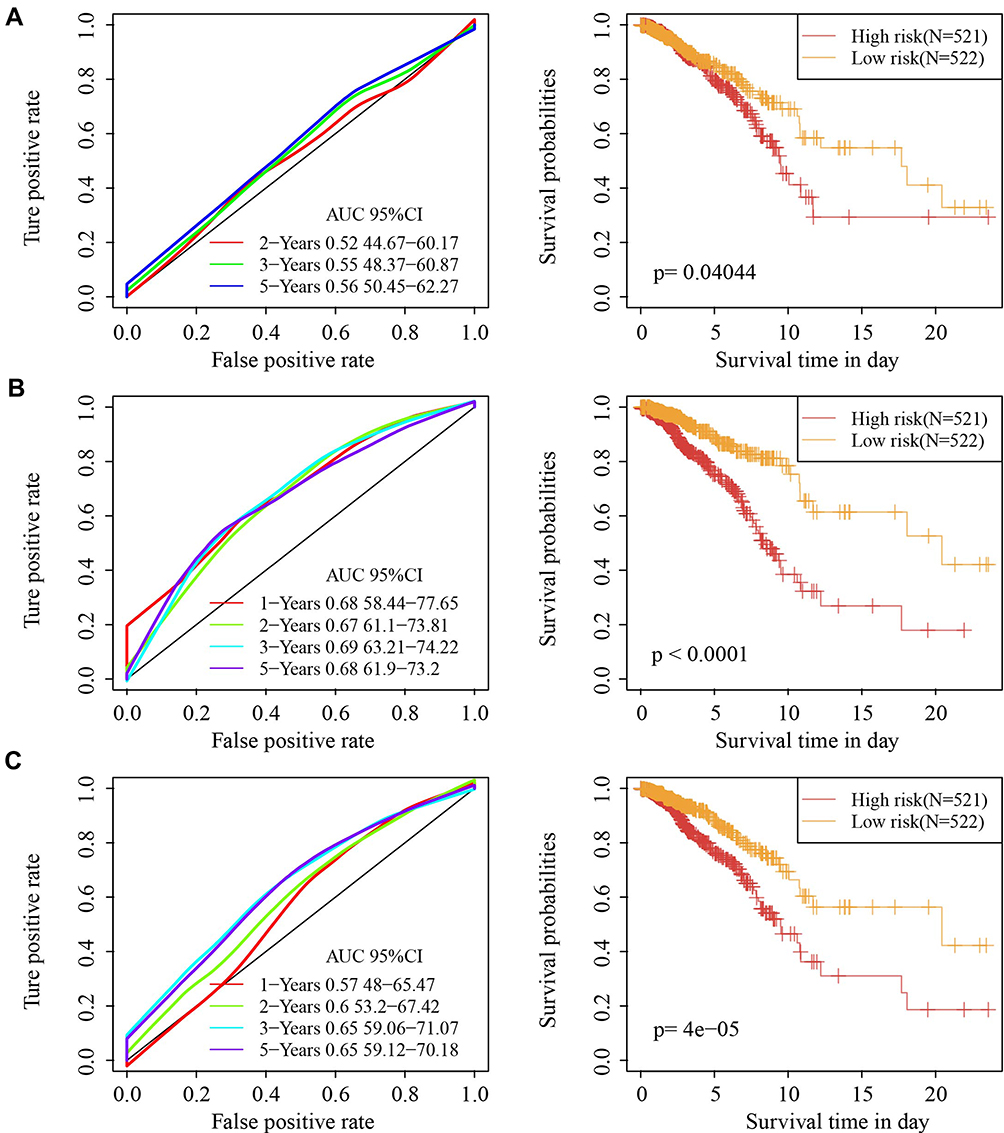 |
Figure 10 Superiority of the model. (A) Receiver operating characteristic curve and Kaplan-Meier survival curve of Qi’ model. (B) Receiver operating characteristic curve and Kaplan-Meier survival curve of Su’ model. (C) Receiver operating characteristic curve and Kaplan-Meier survival curve of Wang’ model. |
Discussion
The most important marker of EMT is the down-regulation of E-cadherin in tumors. Protein e-cadherin can span cell membrane and tightly bind to adjacent cells, and is an important molecule in maintaining epithelial cell properties. The absence or down-regulation of protein e-cadherin enhances the distant spread of cancer.27,28 Other related transcription factors, for instance, TWIST, snail, and zinc finger E-box binding (ZEB), play important roles in EMT, including in promoting cell migration, proliferation, invasion, and angiogenesis.29 Currently, EMT status is believed to be related to survival of cancer patients, and some EMT-related gene signatures have been established to predict survival of patients with cancer. For instance, study has found that 130-gene-EMT-core signature is associated with non-basal-type tumors, but not with the pattern of distant metastasis.30 Common cancer stem cells and EMT signatures based on ALDH1A1, SFRP1, miR-139, miR-21, and miR-200c were found to be useful as prognostic biomarkers for breast cancer.31 EMT-related features comprised of 51 gene pairs (51-GPS) have been applied to predict recurrence risk in patients with stage II CRC.32 Seven EMT-associated gene signatures were used to predict survival of glioma patients.33 In addition, Cai et al showed that EMT was associated with DFS, OS, and PFS in endometrial cancer patients and also performed EMT scores.34 Cheng et al developed a novel 51-gene signature from microdissected tumor epithelium related to late disease recurrence in breast cancer.35 However, research on the relationship between prognosis of breast cancer patients and EMT-related genes is limited. Although examining individual biomarker levels could improve diagnosis, they are mostly not able to accurately predict prognosis. Moreover, a single marker could not represent the effect of EMT, as it is a complex process in cancer. Therefore, it is necessary to conduct a comprehensive analysis of EMT‐related genes to define the cell state between EMT and breast cancer progression. Thus, we used a more reliable and accurate set of EMT-related gene markers to assess clinical outcomes in patients with breast cancer. In this work, EMT-related genetic characteristics were employed to predict breast cancer patients’ survival, and achieved a relatively accurate prediction.
First, based on 119 EMT genes related to breast cancer prognosis, 1043 breast cancer samples were divided into 5 subtypes, among which Cluster 2 samples had the most favorable prognosis. A total of 387 EMT-related differentially expressed genes were identified in 5 molecular subtypes, among which 113 breast cancer-related hub genes were screened by PPI network. After univariate and multivariate Cox regression analysis, 11 EMT-related differentially expressed genes associated with OS were determined to predict the prognosis of breast cancer patients (P < 0.05). Next, we established a prognostic risk score model, and significant OS differences were detected between the two risk groups with independent prognostic power (P < 0.0001). Additionally, a nomogram integrating clinical features was developed to offer a more convenient method for estimating the prognosis of patients with breast cancer.
Subtypes of breast cancer with clinical features and “intrinsic” subtypes (LumA, LumB, HER2, Basal, and Normal) have been extensively studied using microarray and hierarchical cluster analyses.36–38 To verify the reliability of the five molecular subtypes in this study, five clusters were assigned to these known subtypes. Analysis of clinical characteristics showed that these five clusters had more samples corresponding to early clinical characteristic breast cancer samples, which was probably caused by insufficient sample size. Analysis of “intrinsic” subtype matching showed that Cluster 4 had higher Basal samples, and Cluster 5 had the highest percentage of LumA samples.
The literature review also showed the influence of 11 signature genes on breast cancer. In a mouse model of breast cancer and cell lines, IRS2 has been found to regulate mammary tumor metastasis because lack of IRS2 reduces invasiveness of the cells.39–41 EZR with a high mRNA expression is associated with a poor overall survival (OS) of patients diagnosed with breast cancer.42 Atefeh Shirkavand et al reported that hypomethylation of VIM genes plays a significant role in breast cancer patients as compared with the normal.43 Currently, the significance of F11R/JAM-A in breast cancer remains controversial. F11R/JAM-A deficiency induces invasion of breast cancer cells,44,45 while overexpression of the protein is associated with poor prognosis.46 A study identified MMP7 expression as an independent predictive factor of complete pathological response in a large breast cancer patient cohort.47 The expression of LEF-1 is significantly related to the lymph node metastasis and breast cancer tumor size.48 Clinical studies showed that patients with ErbB2+ breast cancer could benefit from anti-erbB2 therapy.49 In breast cancer, SDC1 expression is higher than in normal tissues, and this is associated with age, high risk of HER2 in lymph nodes, and higher SBR grade status.50 Compared to paired normal samples, the CCND2 promoter hypermethylation rate is 40.9% and 44.4% in breast tumors and circulating cellular DNA of patients’ plasma, respectively.51 Overexpression of CXCL9 leads to a lower metastatic spread and reduces tumor growth in murine breast cancer models.52 TLN1 loss-of-function greatly enhances chemosensitivity in triple-negative breast cancer (TNBC) cell lines to docetaxel.53 These data indicated the importance of these 11 genes in breast cancer. Although the biological functions of these 11 genes in breast cancer have been reported, their roles in tumorigenesis and prognosis still need to be further investigated.
Conclusion
In conclusion, based on the results of EMT signaling pathway enrichment, we identified a novel EMT-related genetic signature associated with breast cancer prognosis and it was validated as an independent factor for breast cancer prognosis. In addition, by integrating EMT-related genetic characteristic with pTNM_stage, we developed a model that can be used to effectively predict the prognosis of breast cancer patients.
The Reason for Exemption
TCGA and GEO belong to public database. The patients involved in the database have obtained ethical approval. This work did not include any experiments on humans or animals. Users can download relevant data for free for research and publishing relevant articles. Our study is based on open-source data, so there are no ethical issues and other conflicts of interest. The waived ethics approval was approved by the Ethics Committee of Wuzhong People’s Hospital of Suzhou City, and the publication of this study is in accordance with the Declaration of Helsinki.
Guidelines of Research Ethics Committee
According to the guidelines of the Ethics Committee of Wuzhong People’s Hospital of Suzhou City, any research involving human body (Declaration of Helsinki) and animal experiments shall be subject to ethical review, and research can be carried out only after passing the review.
Acknowledgments
The results shown here are partly based upon data generated by the TCGA Research Network: https://www.cancer.gov/tcga.
Funding
There is no funding to report.
Disclosure
The authors report no conflicts of interest in this work.
References
1. Siegel RL, Miller KD, Jemal A. Cancer statistics, 2020. CA Cancer J Clin. 2020;70(1):7–30. doi:10.3322/caac.21590
2. Miller KD, Nogueira L, Mariotto AB, et al. Cancer treatment and survivorship statistics, 2019. CA Cancer J Clin. 2019;69(5):363–385. doi:10.3322/caac.21565
3. Siegel RL, Miller KD, Jemal A. Cancer statistics, 2019. CA Cancer J Clin. 2019;69(1):7–34. doi:10.3322/caac.21551
4. DeSantis CE, Ma J, Gaudet MM, et al. Breast cancer statistics, 2019. CA Cancer J Clin. 2019;69(6):438–451. doi:10.3322/caac.21583
5. Waks AG, Winer EP. Breast cancer treatment: a review. JAMA. 2019;321(3):288–300. doi:10.1001/jama.2018.19323
6. Harbeck N, Gnant M. Breast cancer. Lancet. 2017;389(10074):1134–1150. doi:10.1016/S0140-6736(16)31891-8
7. Chan CWH, Law BMH, So WKW, Chow KM, Waye MMY. Novel strategies on personalized medicine for breast cancer treatment: an update. Int J Mol Sci. 2017;18(11):2423. doi:10.3390/ijms18112423
8. Liu H, Zhang X, Li J, Sun B, Qian H, Yin Z. The biological and clinical importance of epithelial-mesenchymal transition in circulating tumor cells. J Cancer Res Clin Oncol. 2015;141(2):189–201. doi:10.1007/s00432-014-1752-x
9. Das V, Bhattacharya S, Chikkaputtaiah C, Hazra S, Pal M. The basics of epithelial-mesenchymal transition (EMT): a study from a structure, dynamics, and functional perspective. J Cell Physiol. 2019;234(9):14535–14555. doi:10.1002/jcp.28160
10. Kalluri R, Neilson EG. Epithelial-mesenchymal transition and its implications for fibrosis. J Clin Invest. 2003;112(12):1776–1784. doi:10.1172/JCI200320530
11. Beiki O, Hall P, Ekbom A, Moradi T. Breast cancer incidence and case fatality among 4.7 million women in relation to social and ethnic background: a population-based cohort study. Breast Cancer Res. 2012;14(1):R5. doi:10.1186/bcr3086
12. Sarrió D, Rodriguez-Pinilla SM, Hardisson D, Cano A, Moreno-Bueno G, Palacios J. Epithelial-mesenchymal transition in breast cancer relates to the basal-like phenotype. Cancer Res. 2008;68(4):989–997. doi:10.1158/0008-5472.CAN-07-2017
13. Arnold JM, Gu F, Ambati CR, et al. UDP-glucose 6-dehydrogenase regulates hyaluronic acid production and promotes breast cancer progression. Oncogene. 2020;39(15):3089–3101. doi:10.1038/s41388-019-0885-4
14. Gruenbacher G, Thurnher M. Mevalonate metabolism in cancer stemness and trained immunity. Front Oncol. 2018;8:394. doi:10.3389/fonc.2018.00394
15. Hiscox S, Jiang WG, Obermeier K, et al. Tamoxifen resistance in MCF7 cells promotes EMT-like behaviour and involves modulation of beta-catenin phosphorylation. Int J Cancer. 2006;118(2):290–301. doi:10.1002/ijc.21355
16. Porshneva K, Papiernik D, Psurski M, et al. Temporal inhibition of mouse mammary gland cancer metastasis by CORM-A1 and DETA/NO combination therapy. Theranostics. 2019;9(13):3918–3939. doi:10.7150/thno.31461
17. Hu B, Liu D, Liu Y, Li Z. DNA repair-based gene expression signature and distinct molecular subtypes for prediction of clinical outcomes in lung adenocarcinoma. Front Med. 2020;7:615981. doi:10.3389/fmed.2020.615981
18. Zhang H, Chen Y. Identification of glioblastoma immune subtypes and immune landscape based on a large cohort. Hereditas. 2021;158(1):30. doi:10.1186/s41065-021-00193-x
19. Yu H, Peng S, Han S, Chen X, Lyu Q, Lei T. Distinct molecular subtypes of diffuse large B cell lymphoma patients treated with rituximab-CHOP are associated with different clinical outcomes and molecular mechanisms. Biomed Res Int. 2021;2021:5514726. doi:10.1155/2021/5514726
20. Zhao M, Kong L, Liu Y, Qu H. dbEMT: an epithelial-mesenchymal transition associated gene resource. Sci Rep. 2015;5:11459. doi:10.1038/srep11459
21. Wilkerson MD, Hayes DN. ConsensusClusterPlus: a class discovery tool with confidence assessments and item tracking. Bioinformatics. 2010;26(12):1572–1573. doi:10.1093/bioinformatics/btq170
22. Franceschini A, Szklarczyk D, Frankild S, et al. STRING v9.1: protein-protein interaction networks, with increased coverage and integration. Nucleic Acids Res. 2013;41:D808–D815. doi:10.1093/nar/gks1094
23. Smoot ME, Ono K, Ruscheinski J, Wang PL, Ideker T. Cytoscape 2.8: new features for data integration and network visualization. Bioinformatics. 2011;27(3):431–432. doi:10.1093/bioinformatics/btq675
24. Qi L, Yao Y, Zhang T, et al. A four-mRNA model to improve the prediction of breast cancer prognosis. Gene. 2019;721:144100. doi:10.1016/j.gene.2019.144100
25. Su J, Miao LF, Ye XH, Cui MS, He XF. Development of prognostic signature and nomogram for patients with breast cancer. Medicine. 2019;98(11):e14617.
26. Wang F, Tang C, Gao X, Xu J. Identification of a six-gene signature associated with tumor mutation burden for predicting prognosis in patients with invasive breast carcinoma. Ann Transl Med. 2020;8(7):453. doi:10.21037/atm.2020.04.02
27. Thiery JP, Acloque H, Huang RY, Nieto MA. Epithelial-mesenchymal transitions in development and disease. Cell. 2009;139(5):871–890. doi:10.1016/j.cell.2009.11.007
28. Lamouille S, Xu J, Derynck R. Molecular mechanisms of epithelial-mesenchymal transition. Nat Rev Mol Cell Biol. 2014;15(3):178–196. doi:10.1038/nrm3758
29. Dongre A, Weinberg RA. New insights into the mechanisms of epithelial-mesenchymal transition and implications for cancer. Nat Rev Mol Cell Biol. 2019;20(2):69–84. doi:10.1038/s41580-018-0080-4
30. Savci-Heijink CD, Halfwerk H, Hooijer GKJ, et al. Epithelial-to-mesenchymal transition status of primary breast carcinomas and its correlation with metastatic behavior. Breast Cancer Res Treat. 2019;174(3):649–659. doi:10.1007/s10549-018-05089-5
31. Groza IM, Braicu C, Jurj A, et al. Cancer-associated stemness and epithelial-to-mesenchymal transition signatures related to breast invasive carcinoma prognostic. Cancers. 2020;12(10):3053. doi:10.3390/cancers12103053
32. Wang K, Song K, Ma Z, et al. Identification of EMT-related high-risk stage II colorectal cancer and characterisation of metastasis-related genes. Br J Cancer. 2020;123(3):410–417. doi:10.1038/s41416-020-0902-y
33. Tao C, Huang K, Shi J, Hu Q, Li K, Zhu X. Genomics and prognosis analysis of epithelial-mesenchymal transition in glioma. Front Oncol. 2020;10:183. doi:10.3389/fonc.2020.00183
34. Cai L, Hu C, Yu S, et al. Identification of EMT-related gene signatures to predict the prognosis of patients with endometrial cancer. Front Genet. 2020;11:582274. doi:10.3389/fgene.2020.582274
35. Cheng Q, Chang JT, Gwin WR, et al. A signature of epithelial-mesenchymal plasticity and stromal activation in primary tumor modulates late recurrence in breast cancer independent of disease subtype. Breast Cancer Res. 2014;16(4):407. doi:10.1186/s13058-014-0407-9
36. Sørlie T, Perou CM, Tibshirani R, et al. Gene expression patterns of breast carcinomas distinguish tumor subclasses with clinical implications. Proc Natl Acad Sci U S A. 2001;98(19):10869–10874. doi:10.1073/pnas.191367098
37. Fan C, Oh DS, Wessels L, et al. Concordance among gene-expression-based predictors for breast cancer. N Engl J Med. 2006;355(6):560–569. doi:10.1056/NEJMoa052933
38. Caan BJ, Sweeney C, Habel LA, et al. Intrinsic subtypes from the PAM50 gene expression assay in a population-based breast cancer survivor cohort: prognostication of short- and long-term outcomes. Cancer Epidemiol Biomarkers Prev. 2014;23(5):725–734. doi:10.1158/1055-9965.EPI-13-1017
39. Ma Z, Gibson SL, Byrne MA, Zhang J, White MF, Shaw LM. Suppression of insulin receptor substrate 1 (IRS-1) promotes mammary tumor metastasis. Mol Cell Biol. 2006;26(24):9338–9351. doi:10.1128/MCB.01032-06
40. Zhang X, Kamaraju S, Hakuno F, et al. Motility response to insulin-like growth factor-I (IGF-I) in MCF-7 cells is associated with IRS-2 activation and integrin expression. Breast Cancer Res Treat. 2004;83(2):161–170. doi:10.1023/B:BREA.0000010709.31256.c6
41. Porter HA, Perry A, Kingsley C, Tran NL, Keegan AD. IRS1 is highly expressed in localized breast tumors and regulates the sensitivity of breast cancer cells to chemotherapy, while IRS2 is highly expressed in invasive breast tumors. Cancer Lett. 2013;338(2):239–248. doi:10.1016/j.canlet.2013.03.030
42. Zhang R, Zhang S, Xing R, Zhang Q. High expression of EZR (ezrin) gene is correlated with the poor overall survival of breast cancer patients. Thorac Cancer. 2019;10(10):1953–1961. doi:10.1111/1759-7714.13174
43. Shirkavand A, Boroujeni ZN, Aleyasin SA. Examination of methylation changes of VIM, CXCR4, DOK7, and SPDEF genes in peripheral blood DNA in breast cancer patients. Indian J Cancer. 2018;55(4):366–371. doi:10.4103/ijc.IJC_100_18
44. Cao M, Nie W, Li J, et al. MicroRNA-495 induces breast cancer cell migration by targeting JAM-A. Protein Cell. 2014;5(11):862–872. doi:10.1007/s13238-014-0088-2
45. Naik MU, Naik TU, Suckow AT, Duncan MK, Naik UP. Attenuation of junctional adhesion molecule-A is a contributing factor for breast cancer cell invasion. Cancer Res. 2008;68(7):2194–2203. doi:10.1158/0008-5472.CAN-07-3057
46. Murakami M, Giampietro C, Giannotta M, et al. Abrogation of junctional adhesion molecule-A expression induces cell apoptosis and reduces breast cancer progression. PLoS One. 2011;6(6):e21242. doi:10.1371/journal.pone.0021242
47. Sizemore ST, Sizemore GM, Booth CN, et al. Hypomethylation of the MMP7 promoter and increased expression of MMP7 distinguishes the basal-like breast cancer subtype from other triple-negative tumors. Breast Cancer Res Treat. 2014;146(1):25–40. doi:10.1007/s10549-014-2989-4
48. Chen C, Lu X. The expression of KI-67 and LEF-1 in patients after breast cancer resection and its effects on patients’ prognosis. J BUON. 2020;25(2):627–633.
49. Ross JS, Slodkowska EA, Symmans WF, Pusztai L, Ravdin PM, Hortobagyi GN. The HER-2 receptor and breast cancer: ten years of targeted anti-HER-2 therapy and personalized medicine. Oncologist. 2009;14(4):320–368.
50. Cui X, Jing X, Yi Q, Long C, Tian J, Zhu J. Clinicopathological and prognostic significance of SDC1 overexpression in breast cancer. Oncotarget. 2017;8(67):111444–111455. doi:10.18632/oncotarget.22820
51. Hung CS, Wang SC, Yen YT, Lee TH, Wen WC, Lin RK. Hypermethylation of CCND2 in lung and breast cancer is a potential biomarker and drug target. Int J Mol Sci. 2018;19(10):3096. doi:10.3390/ijms19103096
52. Walser TC, Ma X, Kundu N, Dorsey R, Goloubeva O, Fulton AM. Immune-mediated modulation of breast cancer growth and metastasis by the chemokine Mig (CXCL9) in a murine model. J Immunother. 2007;30(5):490–498. doi:10.1097/CJI.0b013e318031b551
53. Singel SM, Cornelius C, Batten K, et al. A targeted RNAi screen of the breast cancer genome identifies KIF14 and TLN1 as genes that modulate docetaxel chemosensitivity in triple-negative breast cancer. Clin Cancer Res. 2013;19(8):2061–2070. doi:10.1158/1078-0432.CCR-13-0082
 © 2022 The Author(s). This work is published and licensed by Dove Medical Press Limited. The full terms of this license are available at https://www.dovepress.com/terms.php and incorporate the Creative Commons Attribution - Non Commercial (unported, v3.0) License.
By accessing the work you hereby accept the Terms. Non-commercial uses of the work are permitted without any further permission from Dove Medical Press Limited, provided the work is properly attributed. For permission for commercial use of this work, please see paragraphs 4.2 and 5 of our Terms.
© 2022 The Author(s). This work is published and licensed by Dove Medical Press Limited. The full terms of this license are available at https://www.dovepress.com/terms.php and incorporate the Creative Commons Attribution - Non Commercial (unported, v3.0) License.
By accessing the work you hereby accept the Terms. Non-commercial uses of the work are permitted without any further permission from Dove Medical Press Limited, provided the work is properly attributed. For permission for commercial use of this work, please see paragraphs 4.2 and 5 of our Terms.