")
Back to Journals » HIV/AIDS - Research and Palliative Care » Volume 13
Episodes of Undernutrition and its Predictors among Clients on Antiretroviral Treatment in Southwest Ethiopia: A Record Review
Authors Oumer Abdu A , Abebaw Mekonnen B
Received 16 October 2020
Accepted for publication 12 December 2020
Published 22 January 2021 Volume 2021:13 Pages 61—71
DOI https://doi.org/10.2147/HIV.S286609
Checked for plagiarism Yes
Review by Single anonymous peer review
Peer reviewer comments 3
Editor who approved publication: Professor Bassel Sawaya
Abdu Oumer Abdu,1 Berhanu Abebaw Mekonnen2
1Department of Public Health, College of Heath Sciences and Medicine, Wolkite University, Wolkite, Ethiopia; 2Department of Nutrition and Dietetics, School of Public Heath, Bahir Dar University, Bahir Dar, Ethiopia
Correspondence: Abdu Oumer Abdu Email [email protected]
Background: More than a quarter of people living with human immune virus had increased burden of malnutrition leading to poor disease progression and survival. However, evidence on predictors for episodes of malnutrition is limited despite its importance for targeted interventions. This paper assessed the episodes of undernutrition and its predictors among HIV-positive adults on treatment in southwest Ethiopia.
Methods: A facility-based cross-sectional study using secondary data was conducted among 519 randomly selected records of adult clients on antiretroviral treatment. Malnutrition was assessed using the records of weight and height at different points of follow-up (0, 6, 12, 18, and 24 months of ART follow-up). Analysis of variance, covariance, and spaghetti plot were done to compare the mean change in body mass index. To assess predictors of malnutrition episodes, a linear mixed model was used with parameter estimate with 95% confidence interval and P-values were estimated via maximum likelihood method. Akaike’s information criteria was used for model fitness.
Results: A total of 480 records were reviewed with a mean age of 36 years (± 9 years). A total of 354 (73.8%) and 34.6% of clients got dietary counseling and support, respectively. Statistically significant improvement in mean BMI after initiating treatment (P-value=0.0001) was observed. Being male (β=− 0.72; P=0.044), having problems of eating difficulty (β=− 1.61; P=0.0001), anemia (β=− 1.51; P=0.003), shorter follow-up intervals (β=0.04; P=0.129), not getting nutritional counseling (β=0.63; P=0.32), and diarrheal disease (β=− 0.04; P=0.129) were predictors of undernutrition.
Conclusion: Improvement in nutritional status after initiation of ART was seen. The presence of eating disorder, anemia, not getting nutritional counseling, and the short follow-up interval predict undernutrition.
Keywords: episodes of undernutrition, southwest Ethiopia, linear mixed model, antiretroviral treatment
Introduction
Acquired immune deficiency syndrome (AIDS) is a combination of different illnesses characterized by a decreased immune system caused by immune system damage by the human immune virus (HIV).1 It can be treated under comprehensive HIV care and treatment, which includes medical treatment of illnesses, adherence support, counseling services, and other concomitant care for a better quality-of-life. These are critical for survival among HIV-infected patients.2 The main aims of treatment are to reduce viral replication and better CD4 count for strong immunity. However, the role of nutritional care and maintaining optimal nutrition is critical for treatment success, yet undermined.3–5
Sub-Saharan Africa is one of the regions with the highest number of people living with HIV/AIDS, accounting for about 69% of the global AIDS epidemic.5,6 Furthermore, the region is seriously affected by undernutrition, high food insecurity, and other nutrition-related problems, which aggravate the severity of the problem.7 In Ethiopia, an estimated 1% are positive for HIV/AIDS, with a total of 69,000 total cases, 23,000 new cases, and 11,000 death as of 2018. Despite the 90% target for suppressed viral load, Ethiopia is far from the target, which food and nutrition insecurity are prevailing.8
The World Health Organization (WHO) recommends increased daily energy intake by 10–30% to maintain body weight in asymptomatic, symptomatic disease, and recovery period.3 In resource-limited settings, many People Living with HIV/AIDS (PLWHA) lack access to sufficient quantities of nutritious foods, which negatively affect overall program success. This emphasizes the need for integrated and focused nutritional care and counseling for adult clients throughout the follow-up periods.2,5
Malnutrition among adults with HIV infection is commonly seen as thinness or low body mass index (BMI<18.5 kg/m2). Among the various nutritional assessment indices, BMI is the common indicator of the nutritional status of adult populations. BMI is predictive of adverse treatment outcomes and overall viral load suppression.9 It is evident that programs like nutritional supplementation for adult HIV clients greatly improve their nutritional status, along with anti-retroviral treatment (ART). But the presence of opportunistic diseases such as oral candidiasis and diarrhea are related to increased susceptibility to malnutrition and poor recovery from malnutrition.10
Ethiopia is one of the countries which has scaled up antiretroviral treatment (ART) over the past decade. From 2005 to 2015, there were several improvements in treatment coverage and other parameters. But, still, significant challenges are in place, including concerns and equitable access to nutritional care for all.11 As of 2017, there were an estimated 738,976 peoples living with HIV. Based on the latest national recommendations, all HIV confirmed clients should start ART immediately (after adherence support); and due to the increasing incident (new) cases of HIV among different segments of the population, the need for nutritional care and helping them to be well nourished become more important. This in turn makes the need to give nutritional assessment and nutritional care top priority in the program.1
Maintaining good nutritional status is one of the most common proxy indicators for quality-of-life among HIV/AIDS patients. In addition, it is among one of the clinical targets to be achieved through the ART follow-up period. One study from eastern Ethiopia showed that 28.7% of HIV/AIDS patients had a low dietary diversity score (DDS).12
Improving the health and well-being, provision of antiretroviral therapy and comprehensive long-term care (including nutritional care) to all people living with HIV is one of the 2021 global focus areas.13 In one study, it has been shown that nutritional status of ART clients is associated with a better CD4 recovery rate, reduced opportunistic infection (OI) rate,14,15 and reduced risks of all-cause mortality.16 Similarly, those underweight clients (prior to HAART) were more likely to die of AIDS in a short period time (AHR=2.04, 95% CI=1.03– 4.04).17 In addition, higher CD4 cell count and higher pre-ART BMI are associated with higher immunity recovery at 12 months of ART initiation.16
In the particular study area, HIV treatment and care is implemented in the zone including food ration supplements, lipid based nutrient supplements are also given to improve nutritional care and address food security. According to the national HIV prevalence and incidence estimates, as of 2020, the prevalence of HIV is 1.12%. Also a total of 704,454 and 20,120 adult populations live with HIV and had new infection, respectively, with an annual death rate of 8,624 caused by HIV infection and its complications. While in the southern region of Ethiopia, these figures are about 70,053 (0.53%) and about 2,592 new infections each year.18 In the study area, about 90% of the clients had a positive disclosure status.19 Food insecurity significantly affects HIV clients on treatment in the study area (78.1%: 95% CI=73.7–82.8%), with 32% and 41.7% having moderate and severe food insecurity, respectively.20
Thus, maintaining normal BMI among HIV adults is of first priority for successful treatment.21 Besides, previous literature has been limited to one point determination of food security, nutritional status, and its predictors,22–26 rather than follow-up data to assess the episodes and its predictors. So far, the episodes of undernutrition during the course of treatment and its predictors is not well known yet. Therefore, this study considers BMI measurements taken at 0, 6, 12, 18, and 24 months after initiation of ART in order to get adequate and complete data. This paper assessed the episodes of undernutrition and its predictors among adult clients on HAART attending public hospitals in Southwest Ethiopia.
Methods and Materials
Study Settings
Gurage zone is one of the administrative zones in southern nations and nationalist regions. It has a total of 13 districts and two town administrations. Wolkite town is the capital of Gurage zone, which is 425 km and 158 km from Hawassa and Addis Ababa, respectively, on the way to Jimma. There are five hospitals with four governmental and one private (non-governmental) hospital. The majority of people in the area are reliant on cereals (teff and others), roots, tubers, vegetables, and fruits as major energy sources. People are involved in agriculture and marketing as a major income source. There were about 3,032 adult ART clients on HAART in the zone.27
Study Design and Population
A cross-sectional study design using a retrospective review of charts (of adult ART clients on HAART) with repeated measures was conducted. Data were collected on randomly selected records of adult HIV-positive clients on ART (age>18 years), from randomly selected Hospitals in Gurage zone, southwest Ethiopia.
Records of adult HIV-positive patients on ART (age>18 years at enrollment) from the selected Hospitals, who have at least two consecutive BMI records during the follow-up period, were included in the study. Records with incomplete data on outcome measurement or nutritional status indicators (weight and height) at different time periods of repeated measurements were excluded from the study. Cases which transferred to other facilities (transfer outs) in which the full follow-up information was not available were excluded. As BMI is not an appropriate indicator for pregnant women, those records of pregnant women were excluded.
Sample Size Determination
The sample size for the first specific objective was determined based on a single population proportion formula using the magnitude of undernutrition among adult ART clients (P) and margin of error, 5% at 95% confidence interval. Hence, by using the prevalence estimates of undernutrition 10.5% (BMI<18.5 Kg/m2),28 the sample size became 144.
Even if linear mixed models have become the most popular method for analyzing repeated measures and longitudinal data; validated power and sample size methods exist only for a limited class of mixed models.29 The appropriate sample size for the second specific objective was calculated by using a significance level of 5%, at a 95% confidence level, with a time interval of half a year, and power of 80%. Taking the sample size was estimated using an adjusted odds ratio (AOR=2.47), percent of unexposed with outcome (17.08%), and 5% significance,30 the sample size became 236. After adding a 5% loss of data and a design effect of 2, the final sample size became 519.
Sampling Procedures
Out of the four public hospitals in Gurage zone, two hospitals were randomly selected and included in the study. Out of the four hospitals, two hospitals were randomly selected with the fact that they were almost similar regarding ART care (similar protocol) and patient characteristics. Then using the average 5 years’ adult ART caseload of the two selected hospitals, the sample size was allocated proportionally. The records were selected using a simple random sampling technique, by a computer random number generator (using Open Epi software). The corresponding unique ART number (a medical record number) of randomly selected clients’ record was used to retrieve the clients’ medical card from the ART register.
Data Collection Methods
Structured and cross-checked data abstraction format was used to collect data from the client’s record at different periods of retrospective follow-up. The checklist included information on relevant socio-demographic characteristics, weight, height, and treatment-related issues. The data were collected by trained health professionals with basic skills and experience in ART documentation (intake form, follow-up form, and other medical records). Considering the total adult ART caseload, the six Bsc nurses and public health officers with their supervisors were assigned to each selected hospital and collected the data. The primary outcome of this study is the client’s repeated BMI score at different periods of follow-up.
Study Variables and Definition
The dependent variable of the study was episodes of malnutrition among adults (repeated measures), while, the independent variables were age, sex, employment status, functional status, nutritional therapy, ART adherence, baseline CD4, WHO stage, Cotrimoxazole prophylaxis, INH prophylaxis, co-morbidities, ART regimen, presence of caregiver, OIs, presence of eating problems, and gastro-intestinal symptoms.
According WHO, malnutrition in this study was defined as low body mass index below 18.5 kg/m2 (<18.5 kg/m2) which refers to undernutrition. While those with BMI above 18.5 kg/m2 was considered as normal, less than 16 kg/m2 as severe malnutrition, 16– 16.9 kg/m2 moderate malnutrition, and between 17 to 8.5 kg/m2 as mildly malnourished.9
For this study patients were considered as having eating problems if they developed at least one of either eating or swallowing difficulties due to oral hairy leukoplakia, oral candidiasis, esophageal candidiasis, or loss of appetite at the time of the most current study period.
Data Quality Control
Two days of training was given to the data collectors and supervisors before the actual data collection. The principal investigators and supervisors monitored and checked the daily progress. The information collected was cross-checked with different sources (intake forms, ART register, and ART chronic follow-up form). Supervisors cross-checked the sample of daily collected questionnaires on a daily basis for correctness against the medical record and/or the ART register. Then, reasonable feedback was given to the data collectors. The data were entered into EpiData software and were restricted by legal values and other parameters to minimize errors. The data were entered by two independent data entry clerks and checked for possible errors. Data from the medical records and the register were triangulated to keep its integrity.
Data Processing and Analysis
The raw data were entered into Epi-Data software version 3.1 and exported to SPSS version 20 for analysis. Data were presented in frequency, percentages, tables, and graphs. Nutritional status for adults was assessed using BMI, calculated using the compute command as weight divided by height in meters squared. Then, the nutritional status was categorized as undernutrition (below 18.5 kg/m2) and normal (above or equal to 18.5 kg/m2).9 To assess the predictors for episodes of undernutrition, a linear mixed model with random effect was done for the repeated measures. In the meantime, the correlation between measurements of BMI was assessed. Thus, BMI score was considered as a linear variable for the linear mixed model. A spaghetti plot (with times of follow-up on the X-axis and the BMI score on the Y-axis) was used to explore the linear or curved pattern of the BMI scores. Multivariate random-effect linear mixed models were fitted to estimate the differences in BMI score with respect to different factors (predictors). Maximum likelihood (ML) was used to estimate the parameter, as it considers both fixed and random factors. Parameter estimate with 95% confidence interval (CI) was calculated with t and P-value under the random-effect model. Akaike's information criteria (AIC) was used to assess model fitness; with smaller values considered as complex in estimating parameter estimates.31,32 P-value of less than 0.05 used as cut off point to declare statistical significance, the alpha level to reject the null hypothesis.
Ethical Considerations
Formal ethical clearance was obtained from the University’s Institutional Ethical Review Committee and a letter of cooperation was taken from the university to the zonal health office and hospitals. Before the data collection, informed consent was obtained (after full explanations of the study procedure) from the respective hospital managers. Then during the actual data collection, all hard copy and softcopy data were under full protection in the hands of the investigators. All relevant ethical principles and data protection policies under the Helsinki declaration were followed. The collected data were not used for other purposes than the study’s primary objectives. The client’s confidentiality was also kept.
Results
In this study, a total of 480 client records were retrieved with an overall retrieval rate of 92.4%. The mean age was 36 years (±9 years). About three-quarters (74.2%) were aged between 25–44 years’ and nearly two-thirds (62.7%) were females. More than one-third (35.2%) attended no formal education and nearly two-fifths (39.2%) were married. One-third (33.3%) of clients were engaged in private works. More than one-fifth (23.3%) of clients come for follow-up from outside the hospitals’ catchment area.
Client’s Treatment-Related Characteristics
In this study, 88.1% of clients disclosed their HIV status to their friends, parents, or others. About three-quarters (73.8%) of clients got dietary counseling; however, only 34.6% of the clients got nutritional supplementation during the course of ART treatment. About 230 (47.9%) clients had a history of any eating disorders, specifically loss of appetite (83.9%), swallowing difficulty (23.5%), nausea and vomiting (45.7%) were common. More than half of clients (275, 57.3%) had at least one OI. Out of these, pneumonia (32.7%), tuberculosis (19.6%), and diarrheal diseases (38.2%) were the most common ones. In addition, 73 (15.2%) and 17 (3.5%) of clients had reported having symptoms of oral candidiasis and esophageal candidiasis, respectively (Table 1).
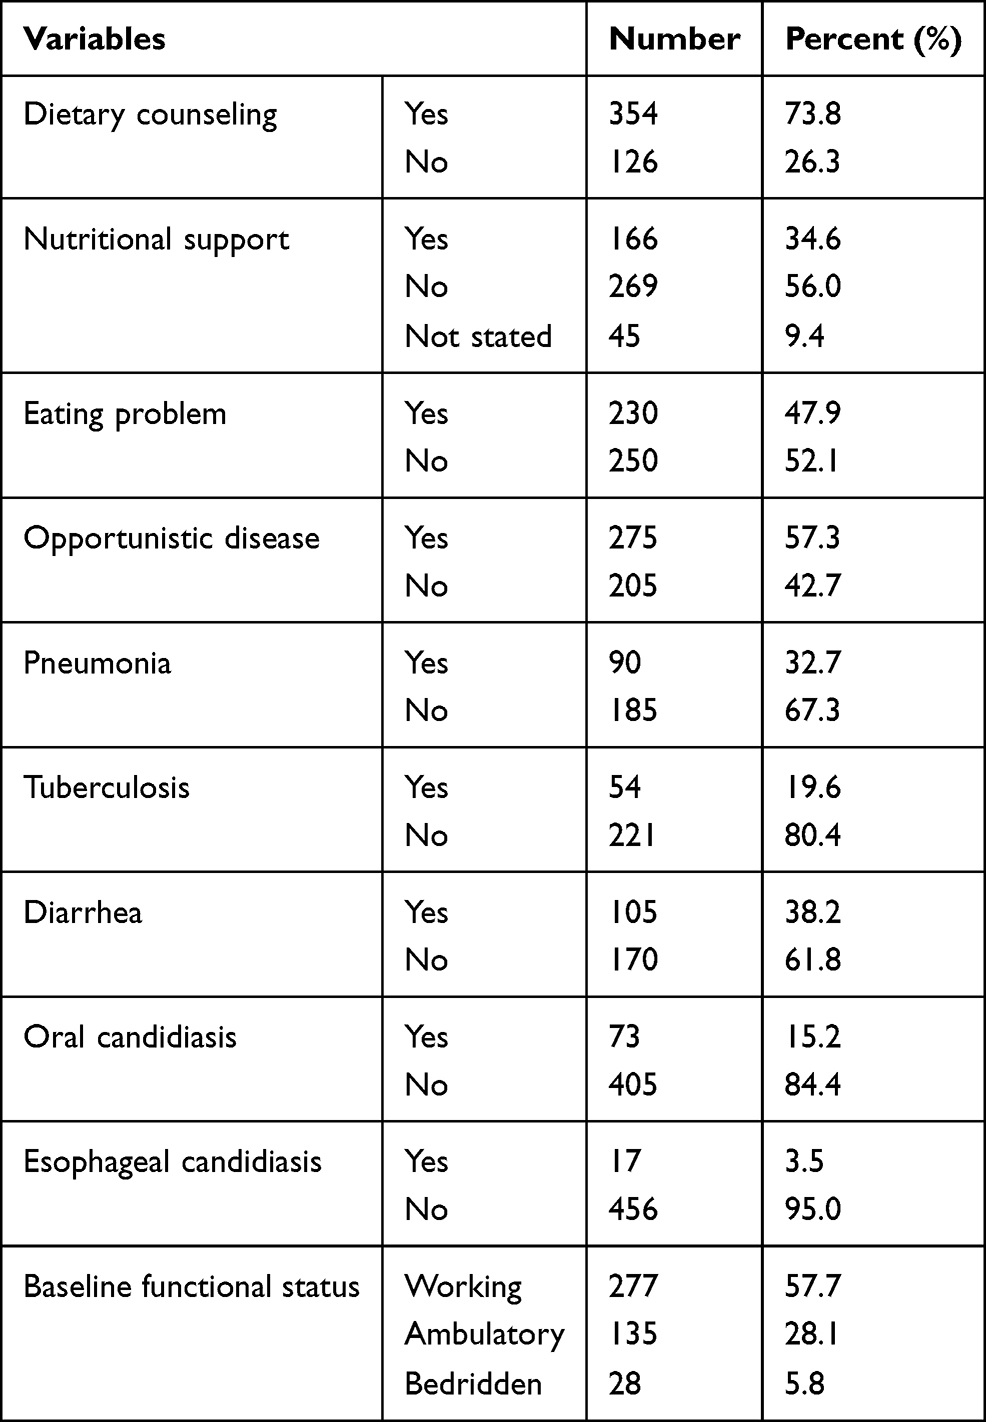 |
Table 1 Clinical Characteristics of Adult ART Clients in Gurage Zone, Southwest Ethiopia, 2019 |
Baseline Characteristics of ART Clients
The majority of clients were in WHO stage II and III during the start of the ART follow-up, and 10.4% reported having anemia. Nearly two-thirds (63%) of the clients were working actively, while 6.4% of clients were bedridden. The vast majority of clients took prophylactic treatments for tuberculosis and pneumonia; 90.2% and 91.3% took INH and CPT, respectively. Only 11% had received fluconazole therapy (Table 2).
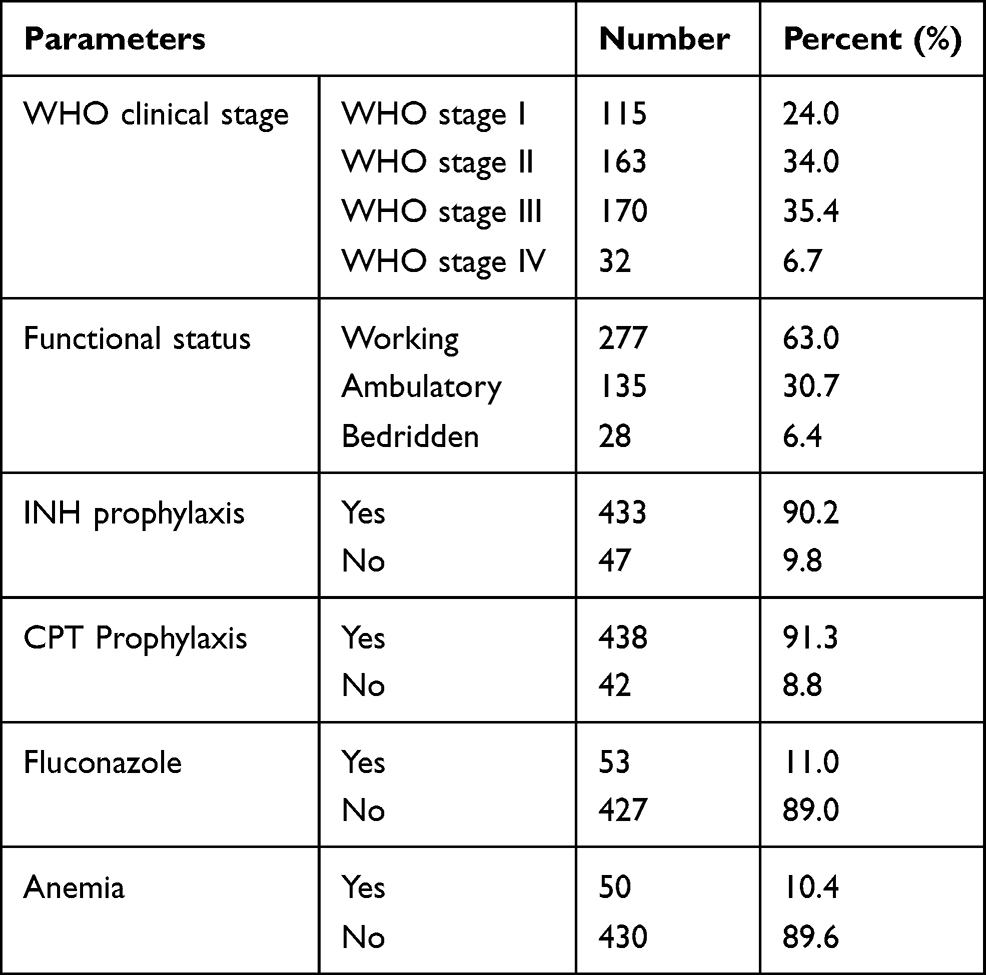 |
Table 2 Baseline Clinical Characteristics of Adult ART Clients, Southwest Ethiopia |
A total of 43 (10%) clients had virological failure. Also, 401 (83.5%) ART clients were on TDF-3TC-EFV HAART regimen. Regarding the outcomes of treatment, 74% of clients were on regular ART follow-ups, while 13% and 7% were transferred outs and dead, respectively. The median pre-ART follow-up was 3 months, with an average ART follow-up interval of 3 months. The total months on ART ranges from 2 to above 100 months of follow-up periods. At the start of follow-up, the mean hemoglobin level was 13.5 g/dL (±1.8 g/dL. About 455 (94.8%) clients had good adherence to ART.
Episodes of Malnutrition Among ART Clients
The homogeneity of variance for BMI of ART clients was fulfilled (Leaven statistics=0.474, P-value=0.755). In addition, a statistically significant increasing trend of mean BMI score was observed across the five follow-up intervals (F statistics=13.9, P-value=0.0001). The BMI of clients was recorded at the start of ART, 6 months, 12 months, 18 months, and 24 months during the course of follow-ups (Figure 1).
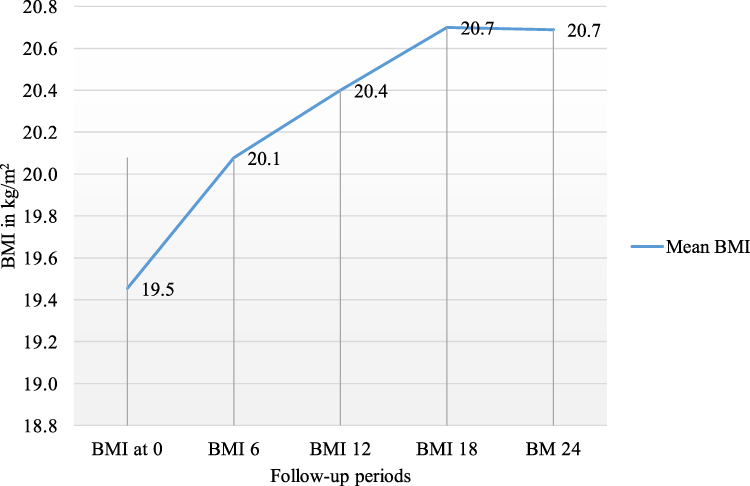 |
Figure 1 Mean body mass index (BMI) of adult clients at different intervals of ART follow-up periods, Southwest Ethiopia. |
Using a normal plot and Kolmogorov Sminirove test for normality of serial BMI measurements; the distribution of BMI approximately follows a normal distribution, with overall mean BMI of 20.24 kg/m2 and standard deviation of 2.94 kg/m2. Outlier data values were trimmed and not included in the analysis.
Predictors of Episodes of Undernutrition: Linear Mixed Effect
The data follows an approximate normal distribution, and involves repeated measurements of weight and height starting from ART initiation until 24 months, every 6 months. The BMI at each follow-up period were highly correlated with each other (correlation coefficient (r) of above 0.9). In addition, as the data were not independent, and involves multiple measurements, it violates the basic assumption of ordinal linear regression using ordinary least square approach. Thus, a linear mixed model with a random intercept model was fitted with information criteria (Alkaiks’s Information Criteria) as model fitness criteria. It considers the repeated and dependent nature of the data for reliable parameter estimates.31
Significant improvements in the BMI score of ART clients were observed after ART initiation (P<0.0001). Accordingly, the mean BMI score at 24 months is better than the previous follow-up periods. Those ART clients who were male (mean difference (MD)=−0.73) and from rural areas (MD=−0.19) had lower BMI scores than their counterparts. For each year a person lives, the mean BMI of ART clients showed a statistically non-significant decline by 0.025. ART clients who got nutritional support in the course of HIV treatment improvement in their BMI (β=0.28, P-value=0.32). Clients with a recent history of eating problems were reported to had lower BMI score as compared to clients without eating problems (β=−1.26; P-value≤0.0001).
Clients with recorded OI had lower BMI scores than those who have at one OIs (β=−1.06; P-value≤0.0001). In addition, the longer pre-ART follow-up periods were associated with improved BMI scores of ART clients (β=0.023; P-value=0.067). ART clients who were in the advanced WHO stage and currently working actively had higher BMI scores than their counterparts. Clients who had good adherence to ART follow-ups were shown to have better nutritional status than those who had poor adherence (β=0.68; P-value=0.51). The presence of anemia had shown to increase the risk of being undernourished (β=−1.31; P-value=0.001) (Table 3).
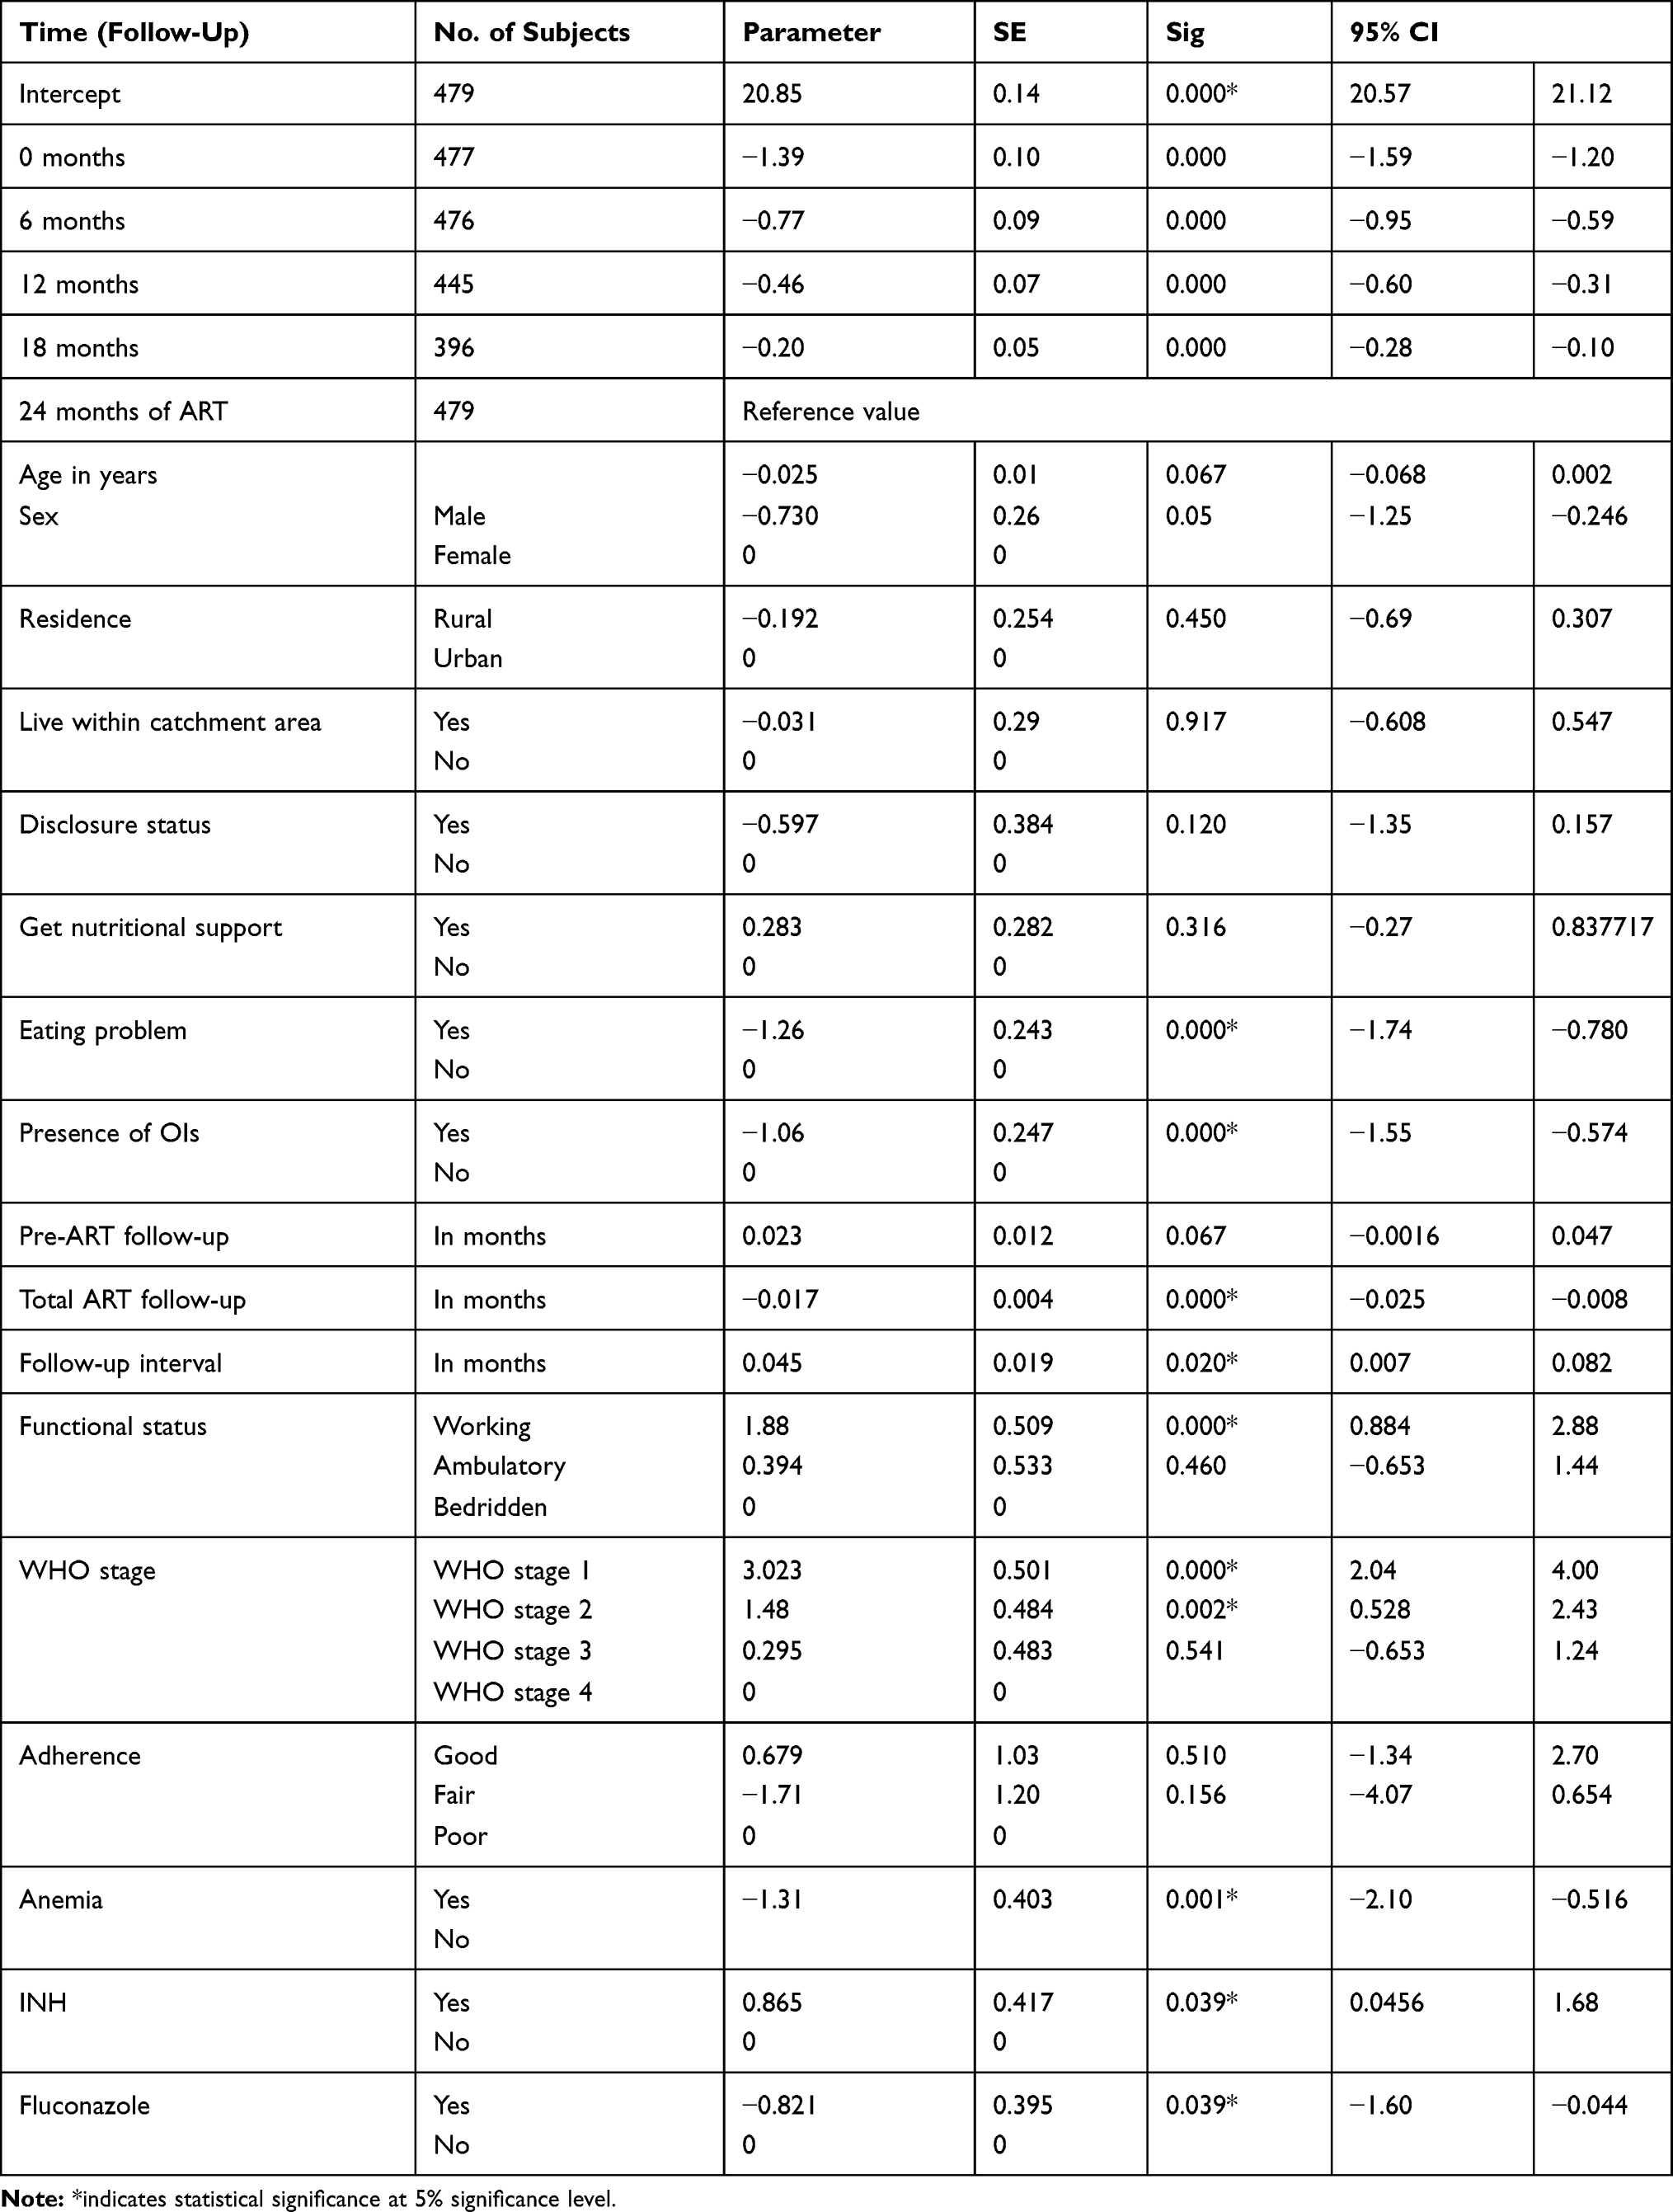 |
Table 3 Predictors of BMI of Adult ART Clients in Southwest Ethiopia |
A linear mixed-effect using a random intercept model was fitted using information criteria for model fitness. Sex, nutritional support, having an eating problem, diarrhea disease, anemia, and follow-up interval were important predictors for episodes of undernutrition. The addition of diarrheal disease to the model significantly improved the model fitness (P-value<0.05). For model fitness, the AIC value was used and compared for each model in the backward regression model. The model fitness has improved from an AIC value of 8,698 to a better model of 4,995.228. Male ART clients had significantly lower BMI as compared to females (β=−0.72; P-value=0.044). In addition, clients who got nutritional counseling during the course of ART (β=0.63) and those clients without any of the eating problems (β=−1.61) had higher BMI scores than their counterparts. The presence of diarrhea was shown to decrease the BMI score of clients, even if it is not statistically significant. Clients diagnosed with anemia had a significantly lower BMI as compared to non-anemic (β=−1.51; P-value=0.003). Furthermore each month of follow-up interval is associated with improvement in BMI of the clients (β=0.04; P-value=0.129) (Table 4).
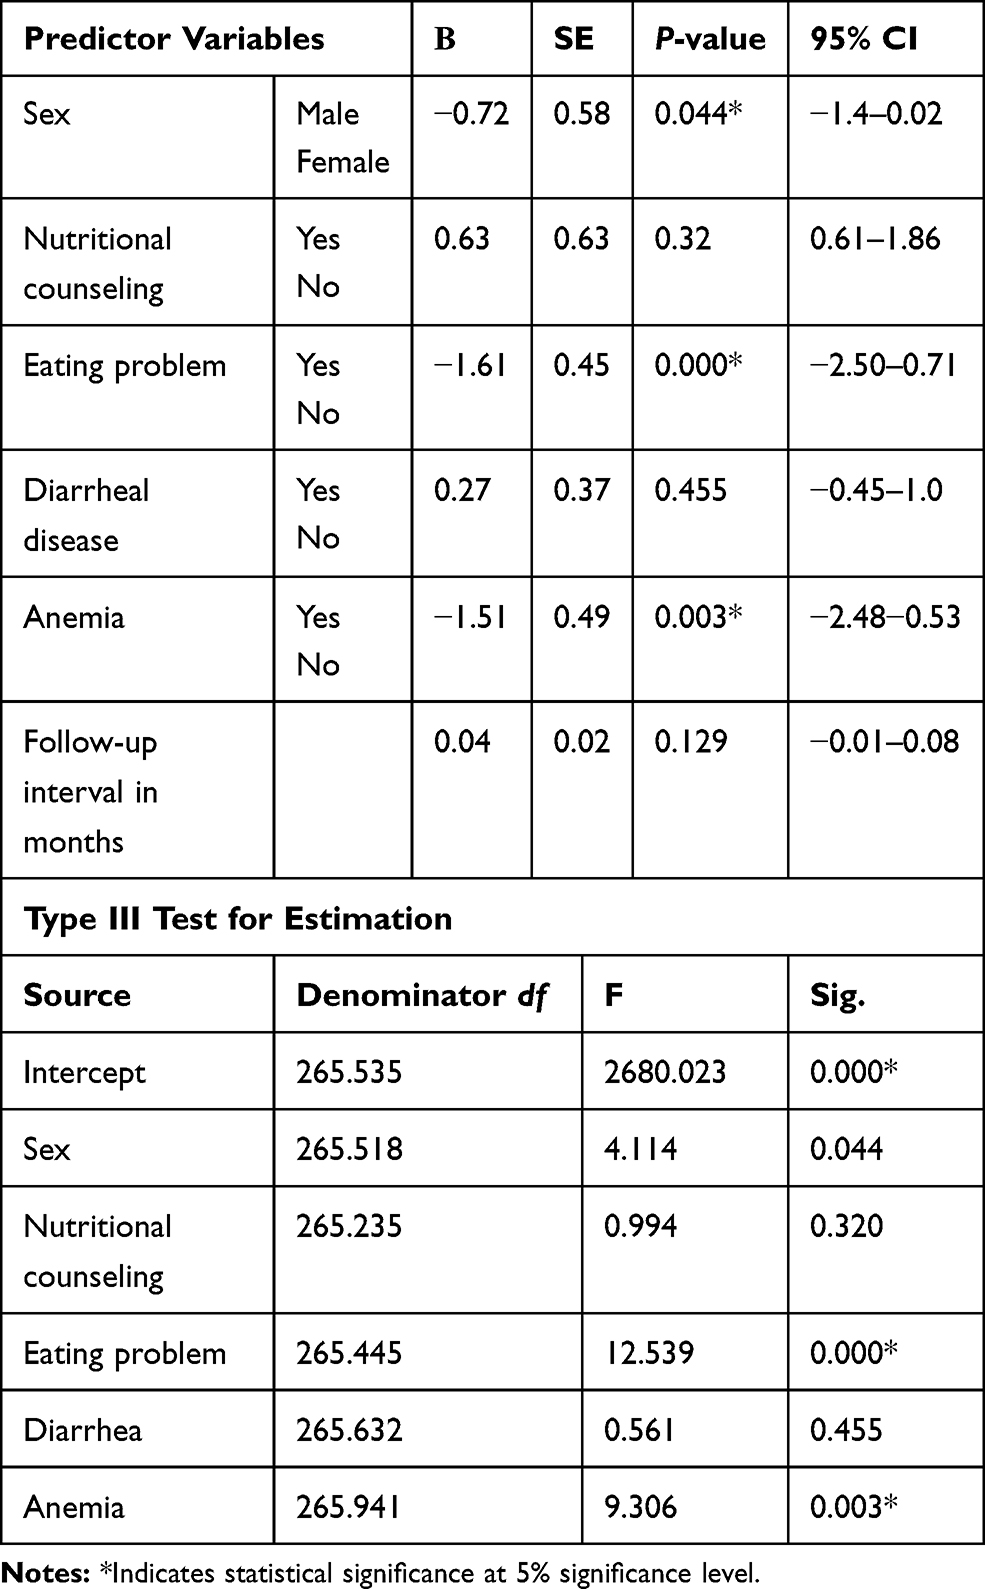 |
Table 4 Linear Mixed Model with Random Intercept for Predictors of BMI Among Adult ART Clients, Southwest Ethiopia |
Discussion
The findings of this study showed that there is a significant improvement in the nutritional status of ART clients after the start of ART treatment. Similarly, a cohort of HIV clients on ART showed significant improvements in BMI (by about 3%).33 Nutritional status is one core indicator for quality-of-life and effectiveness of care for HIV clients.3,4 Thus, early initiation of ART for HIV-positive clients is one important contributor for the improvement in the nutritional status. Additionally, this study found that nearly three-quarters of the clients have dietary counseling and about 94.8% of adults had good adherence. Thus, the quality of care and the adherence level of clients are found to be good; so the HAART therapy will be effective in controlling the viral replication and improving the CD4 counts of clients. Furthermore, a significantly lower number of clients with treatment/virological failure supports thsi scenario.15,34
On the contrary, another study showed that the BMI of HIV-infected women did not significantly change over the period of follow-up.35 BMI gains were slower among HIV-infected participants of 40 years or less (P<0.001).36 Data from an interagency HIV study on about 1,100 HIV positives following HAART initiation showed that the median BMI change (per 5 years) was 0.21 kg/m2 (90% CI=−1.33– 0.42) for those with normal pre-HAART BMI, 0.39 kg/m2 (90% CI=0.15–0.66) for overweight, 0.31 kg/m2 (90% CI=-0.18–0.67). The result showed that there is a persistent increase in the BMI score of the patients after treatment initiation.37
However, the mean BMI score was found to be marginal. A significant number of clients had undernutrition at enrollment. This might be due to the fact that about 47.9% had any eating problems and 57.5% had opportunistic diseases. In addition, the level of nutritional support for clients was also found to be low (34.6%). In one of the hospitals, about one quarter (25.2%) of adults reported to have BMI below 18.5 kg/m.2 Furthermore, greater than three fourth of clients (79%) were found to be food insecure, increasing the risk of malnutrition. Studies from the southern part of Ethiopia revealed that nearly one-third of adults (32.5%) were under-nourished38 and 12.3% (95% CI=9.5−15.0%) had malnutrition (BMI below 18.5 kg/m2).30 Similarly, a study from Botswana showed that 28.5% of adults had under-nutrition.39
Also, the mean DDS was 4, which is below the minimum.40 Another study showed that 28.7% of HIV/AIDS patients had low DDS.12 Thus, the aforementioned factor and study area context makes ART clients vulnerable to malnutrition; even if there is significant improvement after ART enrollment. This is greatly linked to an increased estimated energy need of 10% in asymptomatic HIV-infected adults, by 20–30% in adults during periods of symptomatic disease or opportunistic infection and by about 30% during the recovery period to maintain body weight.3
It is known that eating problems and gastrointestinal opportunistic diseases are common among HIV positives. Among these, oral ulcers, oral candidiasis, esophageal candidiasis, some lymphomas, and diarrheal diseases are common co-morbidities. It is evident that these co-morbidities significantly reduce the food intake of an individual, which is one of the immediate causes of malnutrition.1–3 Furthermore, diarrheal diseases are major contributors for an increased nutrient loss from the patient’s body. These factors may result in lower BMI scores of clients and worse nutritional status, which in turn reduce immunity, increase infection rate, decrease resistance, and ultimately increase the risk of malnutrition and subsequent death of clients.
Another study showed the mean BMI score of 26.67 kg/m2 and 30.16 kg/m2 among males and females, respectively (P<0.001). Those adults above the age of 60 had a lower BMI trend (estimate=−0.04 kg/m2 and estimate=−0.11 kg/m2 for males and females, respectively). Those with higher alcohol intake were associated with a lower BMI trend (estimates=−0.06 kg/m2 and estimates=−0.20 kg/m2 for males and females, respectively), as compared to those who did not drink alcohol at all (P>0.05).36 Patients currently smoking, with a higher viral load, and lower CD4 cell count were found to be significant predictors of low BMI among HIV positives.35
Similarly, ART clients having longer follow-up intervals was an important predictor of higher BMI scores (β=0.04; P-value=0.129). It is prudent that ART clients on early follow-up periods and with advanced WHO stage or immunological damage are more likely to be under a strict ART follow-up schedule.1,4 Those with good functional status and WHO stage will be under loose schedules. Thus, these clients who are in good health had a good appetite, smaller energy, and nutrient requirement in which they will have a good nutritional status.
The previous studies done on predictors of malnutrition among adult ART clients involves the usual logistic regression 40. However, the present study involves repeated measures of BMI at important milestone times after initiation of ART. Thus, it better addressed the important predictors as it considers fixed and random-effects through a linear mixed models than the usual logistic and linear regression which do not account for the dependent and correlated nature of the dependent variable.
The findings of this study should be interpreted in light of some inherent limitations. The use of retrospective data rather than prospective longitudinal study may affect the data quality and some missing data. Also due to the secondary nature of data, some important factors such as food security, dietary diversity, and other were not possible, missing some important factors.
Conclusions
A significant improvement in nutritional status after initiation of ART treatment was observed. The presence of eating disorders, anemia, do not get nutritional counseling, and short follow-up intervals were significant predictors of nutritional status. As the nutritional status of ART clients was marginal, health professionals working in ART clinics should emphasize the early detection, treatment of causes of eating disorders, diarrheal disease, and others. In each follow-up period, there should be effective nutritional counseling for the ART clients. Adherence support should be given due attention and strengthened to improve the treatment adherence, effectiveness, and nutritional status.
Abbreviations
AIC, Akaike's information criteria; AIDS, acquire immune deficiency disorder; AHR, adjusted hazard ratio; BMI, body mass index; CI, confidence Interval; DDS, dietary diversity score; HAART, highly active antiretroviral treatment; HIV, human immune virus; INH, isoniaziad; ML, maximum likelihood; WHO, World Health Organization.
Data Sharing Statement
All data generated or analyzed during this study are included in this published article.
Ethics Approval and Consent to Participate
The research was reviewed and ethically adopted by the University ethical review committee. Then written informed consent considering their free will to collect data was obtained from the hospital manager. All possible ethical cares were respected throughout the conduct of the research project. All relevant ethical principles under the Helsinki declaration were followed.
Acknowledgments
We are very grateful to the data collectors and Hospital managements for their valuable contributions in this study.
Author Contributions
All authors made substantial contributions to the conception, design, and acquisition of data, analysis, and interpretation: took part in drafting and editing of the paper; manuscript preparation, writing, result write-up, preparation of manuscript to submission and approving the final version for its intellectual contents. The authors have agreed on the journal to which the article will be submitted and authors take the responsibility for the contents of the article and be accountable for it.
Funding
There is no funding to report.
Disclosure
Authors declare that they have no competing interests.
References
1. Federal Ministry of Health (FMOH). National Guidelines for Comprehensive HIV Prevention, Care and Treatment. Addis Ababa: FMOH; 2018:43–56.
2. Musumari PM, et al. Chapter 12 - Undernutrition, Food Insecurity, and Antiretroviral Outcomes: An Overview of Evidence from Sub-Saharan Africa, in Health of HIV Infected People: Food, Nutrition and Lifestyle Without Antiretroviral Drugs. Academic Press; 2015:181–201.
3. World Health Organization (WHO). Nutrition Requirements for People Living with HIV/AIDS. Nutrition in the Context of HIV/AIDS; 2018. Available from: http://motherchildnutrition.org/nutrition-hiv-aids/nutrition-living-with-hiv-aids/nutrition-requirements-for-people-living-with-hiv-aids.html.
4. Federal Ministry of Health (FMOH). National Guidelines for Comprehensive HIV Prevention, Care and Treatment. Addis Ababa: FMOH; 2018:60–64.
5. Chen YN, Wall KM, Fofana K, et al. Nutrition indicators as potential predictors of AIDS-defining illnesses among ARV-naïve HIV-positive adults in Kapiri Mposhi, Zambia 2008-2009. PLoS One. 2019;14(7):e0219111. doi:10.1371/journal.pone.0219111
6. United Nations Aid for International Development (UNAIDS). UNAIDS Report on Global AIDS Epidemic, in Global Report on Global AIDS Epidemic. UNAIDS. 8–12. 2012.
7. Audain KA, Zotor FB, Amuna P, et al. Food supplementation among HIV-infected adults in Sub-Saharan Africa: impact on treatment adherence and weight gain. Proc Nutr Soc. 2015;74(4):517–525. doi:10.1017/S0029665115000063
8. United Nations Aid for International Developmen (UNAIDS). Overview: AIDS Ethiopia. Overview; 2020. Available from: https://www.unaids.org/en/regionscountries/countries/ethiopia.
9. World Health organization (WHO). Body mass index (BMI) classification. Global Data Base on Body mass index: 2018. http://www.assessmentpsychology.com/icbmi.htm.
10. Ahoua L, et al. Nutrition outcomes of HIV-infected malnourished adults treated with ready-to-use therapeutic food in sub-Saharan Africa: a longitudinal study. J Int AIDS Soc. 2011;14:2.
11. Assefa Y, Gilks CF, Lynen L, et al. Performance of the Antiretroviral Treatment Program in Ethiopia, 2005-2015: strengths and weaknesses toward ending AIDS. Int J Infect Dis. 2017;60:70–76. doi:10.1016/j.ijid.2017.05.012
12. Weldegebreal F, et al. Dietary diversity and associated factors among HIV positive adults attending antiretroviral therapy clinics at Hiwot Fana and Dilchora Hospitals, eastern Ethiopia. HIV AIDS. 2018;10::63–72.
13. World Health organization (WHO). Global Health Sector Strategy on HIV, 2016-2021, Nutrition. Geneva, Swizerland: WHO; 2016:5–17.
14. Amara E, Mupere E, Oloya J, et al. Age, sex, and nutritional status modify the CD4+ T-cell recovery rate in HIV–tuberculosis co-infected patients on combination antiretroviral therapy. Int J Infect Dis. 2015;35:73–79. doi:10.1016/j.ijid.2015.04.008
15. Somarriba G, et al. The effect of aging, nutrition, and exercise during HIV infection. HIV AIDS. 2010;2:191–201.
16. Harrington M, Gibson S, Cottrell RC. A review and meta-analysis of the effect of weight loss on all-cause mortality risk. Nutr Res Rev. 2009;22(1):93–108. doi:10.1017/S0954422409990035
17. Sharma A, Hoover DR, Shi Q, et al. Relationship between Body Mass Index and Mortality in HIV-Infected HAART Users in the Women’s Interagency HIV Study. PLoS One. 2015;10(12):e0143740. doi:10.1371/journal.pone.0143740
18. Human Immune Virus prevention and control office (HAPCO) and Ethiopian public health institute (EPHI). HAPCO/EPHI, HIV Epidemic Estimates 2017–2021, Ethiopia. Addis Ababa, Ethiopia: EPHI; 2017:1–12.
19. Berhe TM, Lemma L, Alemayehu A, et al. HIV-Positive Status Disclosure and Associated Factors among HIV-Positive Adult Patients Attending Art Clinics at Public Health Facilities of Butajira Town, Southern Ethiopia. AIDS Res Treat. 2020;2020(7165423):1–8. doi:10.1155/2020/7165423
20. Gedle D, et al. Food Insecurity and its Associated Factors among People Living with HIV/AIDS Receiving Anti-Retroviral Therapy at Butajira Hospital, Southern Ethiopia. J Nutr Food Sci. 2015;5(2):1–5. doi:10.4172/2155-9600.1000347
21. Koethe JR, Jenkins CA, Shepherd BE, et al. An Optimal Body Mass Index Range Associated With Improved Immune Reconstitution Among HIV-Infected Adults Initiating Antiretroviral Therapy. Clin Infect Dis. 2011;53(9):952–960. doi:10.1093/cid/cir606
22. Tiyou A, Belachew T, Alemseged F, et al. Food insecurity and associated factors among HIV-infected individuals receiving highly active antiretroviral therapy in Jimma zone Southwest Ethiopia. Nutr J. 2012;11(1):51. doi:10.1186/1475-2891-11-51
23. Mulu H, Hamza L, Alemseged F. Prevalence of malnutrition and associated factors among hospitalized patients with acquired immunodeficiency syndrome in jimma university specialized Hospital, Ethiopia. Ethiop J Health Sci. 2016;26(3):217–226. doi:10.4314/ejhs.v26i3.4
24. Daniel M, Fekadu M, Dereje B. Nutritional status and associated factors among adult HIV/AIDS clients in Felege Hiwot Referral Hospital, Bahir Dar, Ethiopia. Sci J Public Health. 2013;1(1):24–31. doi:10.11648/j.sjph.20130101.14
25. Hailemariam S, Bune G, Ayele H. Malnutrition: prevalence and its associated factors in People living with HIV/AIDS, in Dilla University Referral Hospital. Arch Public Health. 2013;71(13):1–7.
26. Gebremichael DY, Hadush KT, Kebede EM, et al. Food Insecurity, Nutritional Status, and Factors Associated with Malnutrition among People Living with HIV/AIDS Attending Antiretroviral Therapy at Public Health Facilities in West Shewa Zone, Central Ethiopia. Biomed Res Int. 2018;2018:1913534. doi:10.1155/2018/1913534
27. Guraghe zone health office report, SouthWest Ethiopia, 2018.
28. Pinto GS, et al. Nutritional status and food intake of HCV/HIV coinfected patients. Nutr Hosp. 2016;33(5):576.
29. Guo Y, Logan HL, Glueck DH, et al. Selecting a sample size for studies with repeated measures. BMC Med Res Methodol. 2013;13(1):100. doi:10.1186/1471-2288-13-100
30. Solomon H, Girma TB, Henok TA. Malnutrition: prevalence and its associated factors in People living with HIV/AIDS, in Dilla University Referral Hospital. Arch Public Health. 2013;71(1):13. doi:10.1186/0778-7367-71-13
31. Bell ML, Rabe BA. The mixed model for repeated measures for cluster randomized trials: a simulation study investigating bias and type I error with missing continuous data. Trials. 2020;21(1):148. doi:10.1186/s13063-020-4114-9
32. Li Y, Baron J. Linear Mixed-Effects Models in Analyzing Repeated-Measures Data, in Behavioral Research Data Analysis with R. Use R! Springer; New York, NY; 2012.
33. Yuh B, Tate J, Butt AA. Weight change after antiretroviral therapy and mortality. Clin Infect Dis. 2015;60(12):1852–1859. doi:10.1093/cid/civ192
34. Zambian Ministry of Health. Nutrition Guidelines for Care and Support of People with HIV, F.a. Nutrition. Lusaka: National Food and Nutrition Commission and Food and Nutrition Technical Assistance III Project (FANTA); 2017:4–20.
35. Justman JE, Hoover DR, Shi Q. Longitudinal anthropometric patterns among HIV-infected and HIV-uninfected women. J Acquir Immune Defic Syndr. 2008;47(3):312–319. doi:10.1097/QAI.0b013e318162f597
36. Erlandson KM, Zhang L, Lake JE, et al. Changes in weight and weight distribution across the lifespan among HIV-infected and -uninfected men and women. Medicine. 2016;95(46):e5399. doi:10.1097/MD.0000000000005399
37. Sharma A, Bynum SA, Schneider MF. Changes in body mass index following HAART initiation among HIV-infected women in the Women’s Interagency HIV Study.;. J AIDS Clin Res. 2014;5.
38. Wondmagegn GS, et al. Under nutrition status and its determinants among adult HIV and AIDS clients enrolled on antiretroviral therapy at Nigest Elleni Mohammed Memorial Hospital, Southern Ethiopia. J AIDS Clin Res. 2017;8(9):1–5.
39. Nnyepi MS. The risk of developing malnutrition in people living with HIV/AIDS: observations from six support groups in Botswana. S Afr J Clin Nutr. 2009;22(2):89–93. doi:10.1080/16070658.2009.11734224
40. Gedle D, Gelaw B, Muluye D, et al. Prevalence of malnutrition and its associated factors among adult people living with HIV/AIDS receiving anti-retroviral therapy at Butajira Hospital, southern Ethiopia. BMC Nutrition. 2015;1(5):1–5. doi:10.1186/2055-0928-1-5
 © 2021 The Author(s). This work is published and licensed by Dove Medical Press Limited. The full terms of this license are available at https://www.dovepress.com/terms.php and incorporate the Creative Commons Attribution - Non Commercial (unported, v3.0) License.
By accessing the work you hereby accept the Terms. Non-commercial uses of the work are permitted without any further permission from Dove Medical Press Limited, provided the work is properly attributed. For permission for commercial use of this work, please see paragraphs 4.2 and 5 of our Terms.
© 2021 The Author(s). This work is published and licensed by Dove Medical Press Limited. The full terms of this license are available at https://www.dovepress.com/terms.php and incorporate the Creative Commons Attribution - Non Commercial (unported, v3.0) License.
By accessing the work you hereby accept the Terms. Non-commercial uses of the work are permitted without any further permission from Dove Medical Press Limited, provided the work is properly attributed. For permission for commercial use of this work, please see paragraphs 4.2 and 5 of our Terms.