")
Back to Journals » Diabetes, Metabolic Syndrome and Obesity » Volume 14
Epidermal Growth Factor Protects Against High Glucose-Induced Podocyte Injury Possibly via Modulation of Autophagy and PI3K/AKT/mTOR Signaling Pathway Through DNA Methylation
Authors Sun Y, Deng M, Ke X, Lei X, Ju H, Liu Z, Bai X
Received 29 December 2020
Accepted for publication 23 April 2021
Published 19 May 2021 Volume 2021:14 Pages 2255—2268
DOI https://doi.org/10.2147/DMSO.S299562
Checked for plagiarism Yes
Review by Single anonymous peer review
Peer reviewer comments 2
Editor who approved publication: Prof. Dr. Juei-Tang Cheng
Yan Sun,1 Ming Deng,2 Xiao Ke,2 Xiangyang Lei,3 Hao Ju,3 Zhiming Liu,3 Xiaosu Bai3,4
1Department of Endocrinology, Southern University of Science and Technology Hospital, Shenzhen, People’s Republic of China; 2Department of Cardiology, Fuwai Hospital, Chinese Academy of Medical Sciences, Shenzhen Sun Yat-Sen Cardiovascular Hospital, Shenzhen, 518057, People’s Republic of China; 3Department of Endocrinology, Affiliated Longhua People’s Hospital, Southern Medical University, Longhua People’s Hospital, Shenzhen, People’s Republic of China; 4Department of General Practice; Affiliated Longhua People’s Hospital, Southern Medical University, Longhua People’s Hospital, Shenzhen, People’s Republic of China
Correspondence: Xiaosu Bai
Affiliated Longhua People’s Hospital, Southern Medical University, Longhua People’s Hospital, No. 2, Jianshe East Road, Bao’an District, Shenzhen, 518109, People’s Republic of China
Tel +86-755-27741585
Email [email protected]
Aim: Diabetic nephropathy (DN) is a serious health problem worldwide. Epidermal growth factor (EGF) has suggested as a potential biomarker for the progression of chronic kidney disease. In this study, we examined the effects of EGF on the high glucose (HG)-induced podocyte injury and explored the underlying molecular mechanisms.
Methods: The cell proliferation, toxicity, and cell apoptosis of podocytes were determined by CCK-8 assay, lactate dehydrogenase release assay, and flow cytometry, respectively, and protein levels in the podocytes were determined by Western blot assay. Mechanistically, DNA methylation analysis, bioinformatic analysis, methylation‑specific PCR and quantitative real-time PCR were used to analyze functional pathways in differentially methylated genes and the expression of the key methylated genes in the podocytes after different interventions.
Results: EGF treatment significantly increased the protein expression level of LC3 and decreased the protein level of P62 in HG-stimulated podocytes, which was attenuated by autophagy inhibitor, 3-methyladenine. EGF increased the cell proliferation and the protein expression levels of nephrin and synaptopodin, but reduced cell toxicity and cell apoptosis and protein expression level of cleaved caspase-3, which was partially antagonized by 3-methyladenine. DNA methylation expression profiles revealed the differential hypermethylation sites and hypomethylation sites among podocytes treated with normal glucose, HG and HG+EGF. GO enrichment analysis showed that DNA methylation was significantly enriched in negative regulation of phosphorylation, cell-cell junction and GTPase binding. KEGG pathway analysis showed that these genes were mainly enriched in PI3K-Akt, Hippo and autophagy pathways. Further validation studies revealed that six hub genes (ITGB1, GRB2, FN1, ITGB3, FZD10 and FGFR1) may be associated with the protective effects of EGF on the HG-induced podocyte injury.
Conclusion: In summary, our results demonstrated that EGF exerted protective effects on HG-induced podocytes injury via enhancing cell proliferation and inhibiting cell apoptosis. Further mechanistic studies implied that EGF-mediated protective effects in HG-stimulated podocytes may be associated with modulation of autophagy and PI3K/AKT/mTOR signaling pathway.
Keywords: diabetic nephropathy, epidermal growth factor, podocyte injury, autophagy, DNA methylation, PI3K/AKT/mTOR
Introduction
Diabetic nephropathy (DN) is one of the major causes of end-stage renal diseases and is becoming a serious health problem worldwide. The early stage of DN is characterized by the increased amount of urinary protein (albuminuria),1 which is largely due to the defects in the permeability of glomerular filtration barrier.2 The function of glomerular filtration barrier is maintained by podocytes, which encase the exterior basement membrane of glomerular capillary. The injury of podocytes can lead to albuminuria.3 The early pivotal characteristic in DN is the loss of podocytes, where the detachment and apoptosis are closely associated with abnormal autophagy function.4,5 It is reported that high glucose (HG) can repress the autophagy activity in podocytes, which leads to cellular injury and dysfunction.6 Therefore, impaired podocytes autophagy and subsequent loss of podocytes could result in massive proteinuria in diabetic nephropathy patients.7
Autophagy is a lysosomal degradation pathway and plays a vital role in maintaining cellular integrity and function by decomposing cytoplasmic components for clearance and reutilization.8 It is reported that basal autophagy is essential for the kidney homeostasis, structure and function.9 Lv et al found that activation of autophagy can protect podocytes against sublytic complement attack-induced injury by enhancing the survival and adhesion.10 Xin et al consistently found that the activation of autophagy could protect human podocytes against HG-induced cell injury.11 These results indicated that autophagy activation of podocytes may be a novel therapeutic strategy for DN.
Epidermal growth factor (EGF) is a polypeptide with 53 amino acids and involves multiple cellular responses including cell migration, proliferation, differentiation and regeneration. EGF, as a cytoprotective factor, can protect cells from injury included by hydrogen peroxide, acetaldehyde and oxidative stress.12,13 Previous studies found that urinary EGF is correlated with estimated glomerular filtration rate (eGFR) and the rate of eGFR loss, which may be a clinical parameter to predict the progression of chronic kidney disease (CKD).14 In addition, EGF can protect podocytes from HG-induced apoptosis. Li et al found mesenchymal stem cells reduce podocytes apoptosis and injury by secreting the EGF.15 However, the underlying molecular mechanism is still not fully understood.
DNA methylation is one of the epigenetic modifications in DN.16 Bell et al identified 19 prospective CpG sites that may be associated with risk of diabetic nephropathy.17 In this study, we examined the effects of EGF on the podocyte viability and autophagy under the HG condition. In addition, microarray assay was performed to gain insight into the molecular mechanisms underlying EGF-mediated protective effects against HG-induced injury in podocytes.
Materials and Methods
Cell Culture
Human podocytes were purchased from Shanghai Zeye Biotechnology Co., Ltd (Shanghai, China) and were cultured in McCoy’s 5a medium (Thermo Fisher Scientific, Waltham, USA) supplemented with 10% fetal bovine serum (FBS; Thermo Fisher Scientific) in the humidified incubator at 37°C 5% CO2. For the treatments, cells were cultured with McCoy’s 5a medium containing 5.5 glucose mM (negative control (NC) group), 30 mM glucose (HG group), 30 mM glucose + 3 ng/mL EGF (HG+EGF group) or 30 mM glucose + 3 ng/mL EGF + 10 nM 3MA (HG+EGF+3MA group), respectively, for 48 h.
Cell Counting Kit 8 (CCK-8) Assay
Cell viability was determined using CCK-8 assay (Glpbio, Montclair, USA). After different treatments, the cells were incubated CCK-8 solution at room temperature for 2 h, and then, the cell proliferation was determined by measuring optical density at 450 nm wavelength using a microplate reader.
Lactate Dehydrogenase (LDH) Release Assay
Cell toxicity was measured by LDH release assay kit (Beyotime, Shanghai, China) according to the manufacturer’s instruction. Briefly, after different treatments, the cells were mixed with LDH detection reagent (10% volume of the original medium), and then incubated at room temperature for 30 min in the dark. After incubation, the optical density was measured at 490 nm wavelength using a microplate reader.
Western Blot Assay
Total proteins were isolated using RIPA buffer containing the proteinase inhibitors (Sigma-Aldrich, St. Louis, USA). Total protein concentration was quantified by BCA Protein Assay Kit (Thermo Fisher Scientific). Total protein samples were boiled with sodium dodecyl sulfate (SDS)-loading buffer at 100°Cfor 8 min to denature the proteins. The denatured proteins were resolved on 10% SDS-PAGE gel (Biotechnology, Shanghai, China) and were then transferred to PVDF membranes (Millipore, Burlington, USA). The membranes were blocked with Tris buffered saline with Tween-20 (TBST) at 37°Cfor 2 h and incubated with corresponding primary antibodies against LC3 (Cell Signaling Technology, Danvers, USA), P62 (Cell Signaling Technology), nephrin (Cell Signaling Technology), synaptopodin (Cell Signaling Technology), p-Akt (Cell Signaling Technology), t-Akt (Cell Signaling Technology), p-PI3K (Cell Signaling Technology), t-PI3K (Cell Signaling Technology), p-mTOR (Cell Signaling Technology), t-mTOR (Cell Signaling Technology) and β-actin (Cell Signaling Technology) at 4°Cfor overnight. The membranes were then incubated with horse radish peroxidase-conjugated secondary antibodies (Cell Signaling Technology) for 1 h at room temperature. Proteins were detected by chemiluminescence for visualization using ECL kit (Tenon, Shanghai, China). The relative protein expression was analyzed by Image-Pro Plus 6.0 software. β-actin was used as the internal control.
Flow Cytometry Analysis of Cell Apoptosis Assay
After different treatments, cells were trypsinized and harvested followed by washing with ice-cold phosphate buffered saline and then cells were stained with FITC-Annexin V and propidium iodide (Beyotime, Beijing, China). Viable and dead cells, as well as early and late apoptotic cells were quantified and analyzed by FACS Calibur and Cell Quest Pro software (BD Biosciences, Franklin Lakes, USA).
DNA Methylation Analysis
The genomic DNA samples of NC, HG group and HG+EGF groups were treated with bisulfite. Illumina Infinium Methylation EPIC BeadChips (Illumina, San Diego, USA) was used to screen differential DNA methylation sites. The data were analyzed with Chip Analysis Methylation Pipeline (ChAMP) package. Principal component analysis (PCA) was used to analyze the DNA methylation profiling among three treatment groups.
Functional Enrichment Analysis
Gene Ontology (GO) (http://geneontology.org/) and Kyoto Encyclopedia of Genes and Genomes (KEGG) (https://www.genome.jp/kegg/) pathway enrichment analysis were performed using clusterProfiler package, implemented in R. The GO terms and KEGG pathways with P < 0.05 were considered statistically significant.
PPI Network Construction
Protein–protein interaction (PPI) was screened with Retrieval of Interacting Genes (STRING; http://stringdb.org/) database online tool. Combined with autophagy-related signaling pathway, key methylation genes regulated by EGF were determined. The screened networks were visualized by Cytoscape software.
Analysis of DNA Methylation Levels by Quantitative Methylation‑Specific PCR (qMSP)
Genomic DNA from NC group, HG group and HG+EGF group were extracted using EZ DNA Methylation lightning kit under the guidance of manufacturer’s instruction. The genomic DNA was underwent bisulfite conversion (pH 5.0, 50°C for 10 h). PCR was used to amplify the converted DNA. The PCR condition was set aas follows: 95°Cfor 3 min, 40 cycles of 95°Cfor 15 sec and 60°Cfor 30 sec, then 95°Cfor 30 sec. The methylation level was calculated by the 2−ΔΔCt method. The primer sequences for MSP analysis aresummarized in Table 1.
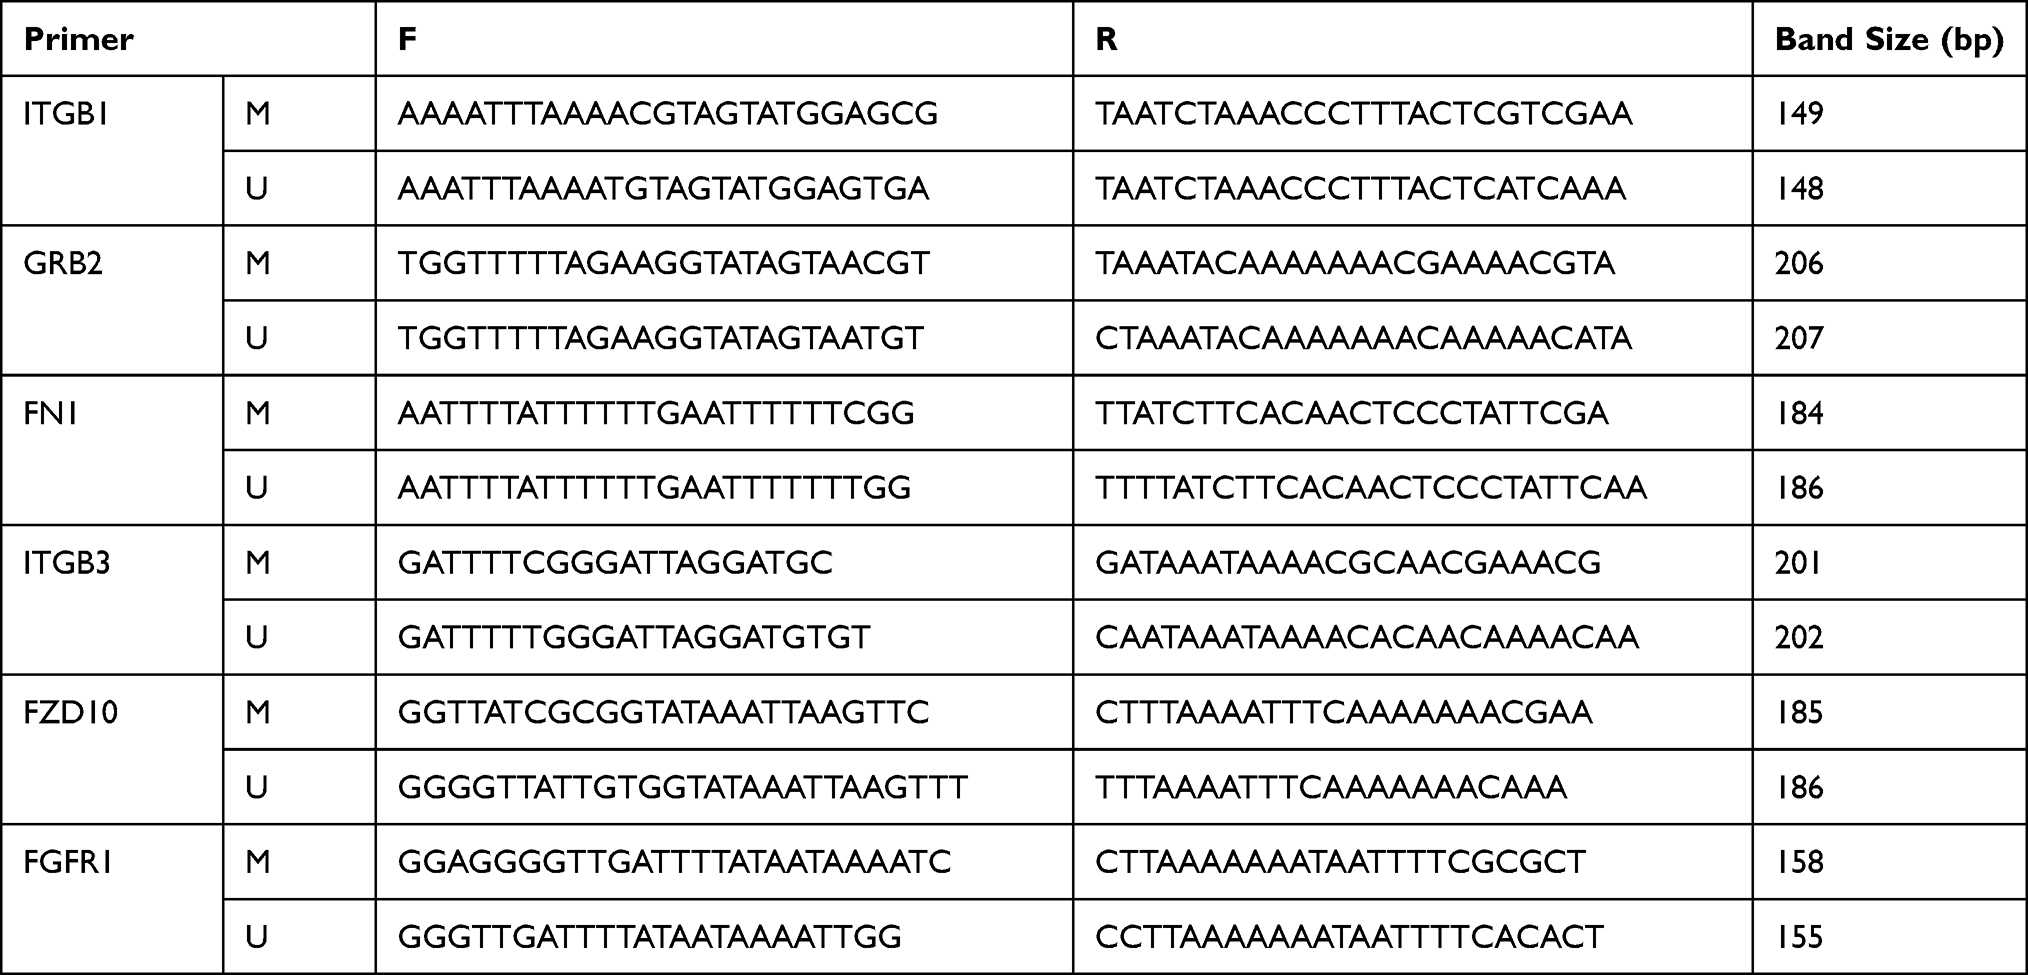 |
Table 1 Primer Sequences Used in MSP |
Quantitative Real-Time PCR (qRT‑PCR) Analysis
Total RNA was extracted using TRIzol reagent (Thermo scientific), and the mRNA was reversely transcribed into cDNA by using the PrimeScript RT Reagent Kit (Takara, Tokyo, Japan). Real-time PCR was performed with SYBR Premix Ex TaqTM Kit (Takara) according to the manufacturer’s protocol. The thermal cycling conditions were as follows: 95°C for 3 min, 40 cycles of 95°C for 15 sec and 60°C for 30 sec, then 95°C for 30 sec. The primer sequences for qRT-PCR analysis are shown in Table 2. The relative mRNA expression levels were measured with qPCR and calculated by 2‑ΔΔCt method. GAPDH snRNA was used as the internal control.
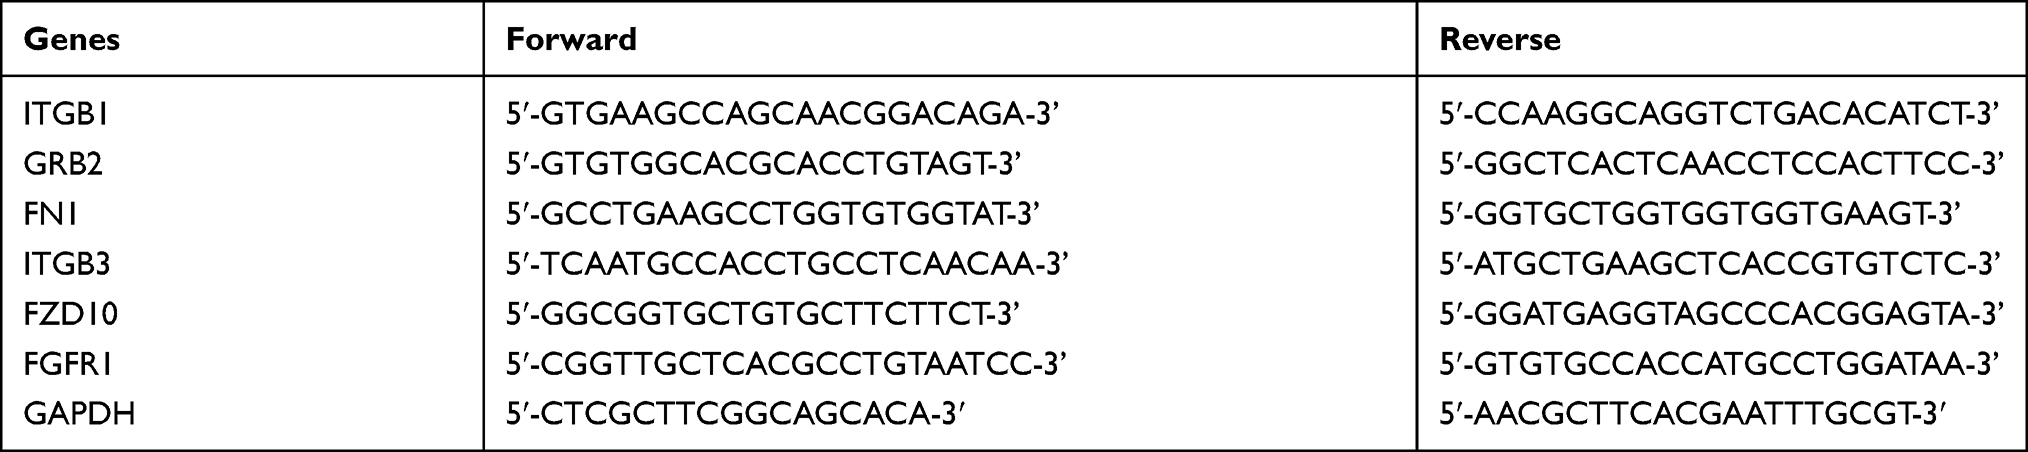 |
Table 2 Primer Sequences Used for qRT-PCR |
Statistical Analysis
All the data analysis was performed using the GraphPad Prism (Version 6.0, GraphPad Prism Software, La Jolla, USA). All the data were presented as mean ± standard deviation. Significant differences among different treatment groups were assessed by one-way ANOVA followed by Bonferroni’s multiple comparison tests. P < 0.05 was considered as statistically significant.
Results
EGF Ameliorated HG-Induced Podocytes Injury
First, we detected whether EGF inhibited HG-induced podocytes damage by activating autophagy. As shown in Figure 1A and B, HG treatment induced the up-regulation of p62 protein expression, but had no effect on the protein level of LC3-II/I in the podocytes, when compared to the NC group. EGF treatment significantly increased the protein level of LC3-II/I and decreased the protein level of P62 in the podocytes when compared the HG group, which was reversed by the pre-treatment with 3-MA (Figure 1A and B). The CCK-8 assay showed that HG treatment significantly reduced the cell viability of podocytes when compared to the NC group, and the inhibitory effect of EGF on the cell viability was reversed by the EGF treatment (Figure 1C). Moreover, 3MA pretreatment significantly reduced the cell viability of podocytes when compared to the HG+EGF group (Figure 1C). Meanwhile, the LDH release assay showed that EGF significantly decreased LDH release in HG-induced human podocytes, whereas 3-MA neutralized the inhibitory effects of EGF (Supplemental Figure S1). The protein levels of nephrin and synaptopodin in the treated podocytes were further evaluated by Western blot assays (Figure 1D). HG significantly reduced the protein expression level of nephrin and synaptopodin in the podocytes when compared to the NC group (Figure 1D–F). EGF treatment significantly increased the protein levels of nephrin and synaptopodin in the podocytes when compared to the HG group, which was significantly attenuated by the pretreated with 3-MA (Figure 1D–F). Collectively, these results indicated that EGF ameliorated HG-induced human podocytes injury by regulating autophagy.
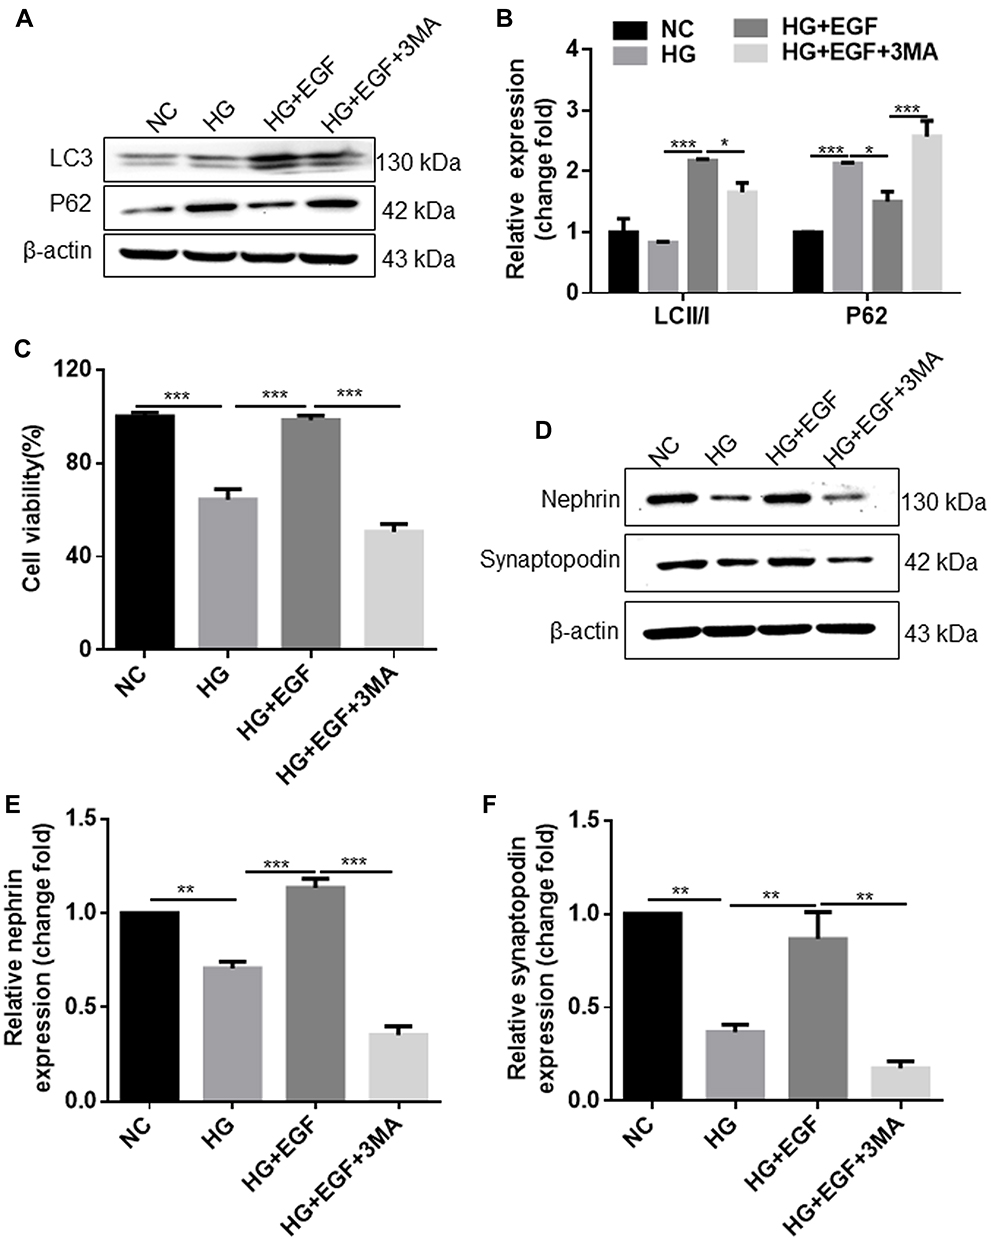 |
Figure 1 EGF alleviates HG-induced podocyte injury by regulating autophagy activity. Podocytes were treated with full medium containing 5.5 glucose mM (negative control (NC) group), 30 mM glucose (HG group), 30 mM glucose + 3 ng/mL EGF (HG+EGF group) or 30 mM glucose + 3 ng/mL EGF + 10 nM 3MA (HG+EGF+3MA group), (A) gel blots showed Western blot analysis of LC3 and P62 proteins in the treated cells; (B) semi-quantitative analysis of LC3II, LC3I and P62 protein levels was performed; (C) The cell viability of podocytes was measured by CCK-8 assay. (D) gel blot showed the Western blot analysis of nephrin and synaptopodin proteins in the treated cells, (E and F) semi-quantitative analysis of nephrin (E) and synaptopodin (F) protein levels was performed. N = 3; significant differences among treatment groups were shown as *P < 0.05, **P < 0.01 and ***P < 0.001. |
EGF Attenuates HG-Induced Apoptosis in the Podocytes
Next, we detected whether EGF participated in HG-induced podocytes apoptosis by activating autophagy. The apoptosis of podocytes was detected using flow cytometry. As shown in Figure 2A, HG treatment significantly increased the cell populations at the early and late apoptosis in the podocytes when compared to the NC group, and the HG-induced increase in the cell apoptosis of podocytes was markedly attenuated by EGF treatment (Figure 2A). Moreover, 3-MA pretreatment largely antagonized the effects of EGF on the cell apoptosis of HG-stimulated podocytes (Figure 2A). In addition, the protein level of cleaved caspase-3 was determined by Western blot assay (Figure 2B). As expected, HG significantly increased the protein level of cleaved caspase-3 in the podocytes when compared to the NC group. EGF treatment significantly decreased the protein level of cleaved caspase-3 in the HG-stimulated podocytes, which was significantly attenuated by the pre-treatment with 3MA (Figure 2B). Altogether, these results suggested that EGF attenuated apoptosis in HG-treated human podocytes by activating autophagy.
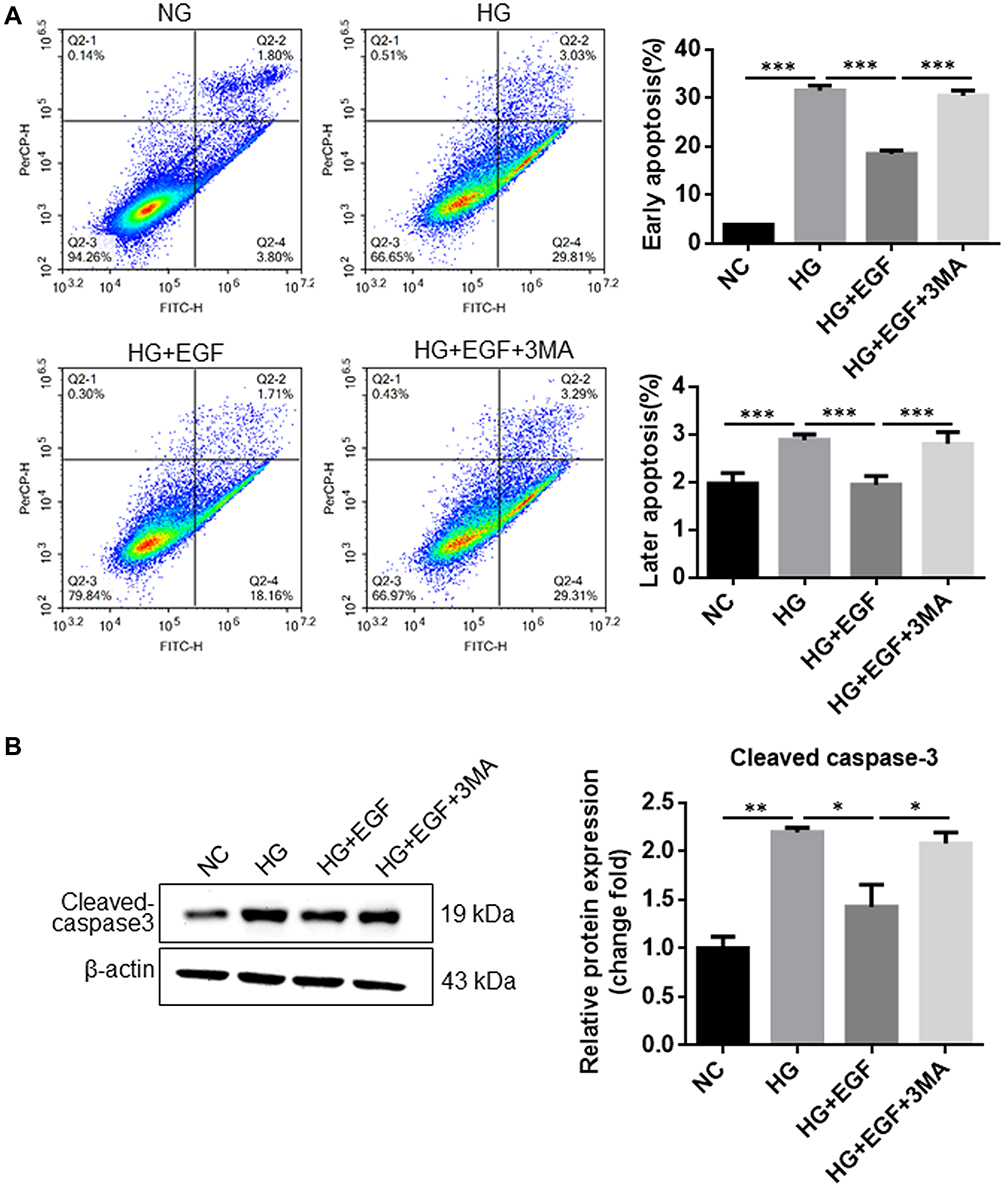 |
Figure 2 EGF attenuates HG-induced apoptosis in the podocytes. Podocytes were treated with full medium containing 5.5 glucose mM (negative control (NC) group), 30 mM glucose (HG group), 30 mM glucose + 3 ng/mL EGF (HG+EGF group) or 30 mM glucose + 3 ng/mL EGF + 10 nM 3MA (HG+EGF+3MA group), (A) cell apoptosis was analyzed using Annexin V-FITC and PI staining. (B) The protein expression of cleaved-caspase 3 in the treated cells was determined by Western blot assay. N = 3; significant differences among treatment groups were shown as *P < 0.05, **P < 0.01 and ***P < 0.001. |
The Difference of DNA Methylation Genes Profiles
The effect of EGF on genome-wide differentially DNA methylation genes profiles in HG-induced human podocytes injury was examined as well. As shown by the principal component results of Illumina 850K (EPIC) DNA methylation array analysis, there were significant differences in podocytes among NC, HG and HG+EGF group (Figure 3A). Principal component analysis (PCA) showed that the three groups were distinctly clustered according to the DNA methylation. There were 6259 hypermethylation sites and 3637 hypomethylation sites in HG group when compared to that in NC group (Figure 3B). Compared to HG group, 9309 hypermethylation CpG sites (5220 genes) and 3111 hypomethylation CpG sites (2511 genes) were found in HG+EGF group (Figure 3C). From the analyzed individual CpG sites between HG and NC group according to genomic location, 25.97% were found in the transcription start site (TSS200=5.12%, TSS1500=10.75%, 5ʹUTR=8.05%, and 1st exon=2.05%). 41.82% CpG sites were located in gene body. The rest were in 3ʹUTR and unconnected areas (Figure 3D). According to the location in CpG islands, there were 12.66% in CpG islands, 17.03% in CpG shores, 7.89% in CpG shelves, and 62.43% in open sea (Figure 3E). Moreover, The results from the analysis of genomic location between EGF+HG and HG group indicated that 27.22% were located in the transcription start site (TSS200=5.01%, TSS1500=12.05%, 5ʹUTR=8.05%, and 1st exon=2.11%), 38.62% were in gene body and the rest were in 3ʹUTR and unconnected areas (Figure 3D); 12.48% of differentially methylated sites were found in CpG islands, 18.62% in CpG shores, 7.34% in CpG shelves, and 61.56% in open sea (Figure 3E). There were 9896 differentially methylated CpG sites in podocytes from HG group comparing that in the NC group. There are 6259 hypermethylation and 3637 hypomethylation CpG sites, which were corresponding to 4587 and 3046 genes, respectively. Compared to HG group, 9309 hypermethylation CpG sites (5220 genes) and 3111 hypomethylation CpG sites (2511 genes) were found in HG+EGF group (Figure 4A), and there were 1106 methylation sites (983 genes) in intersection (Figure 4A).
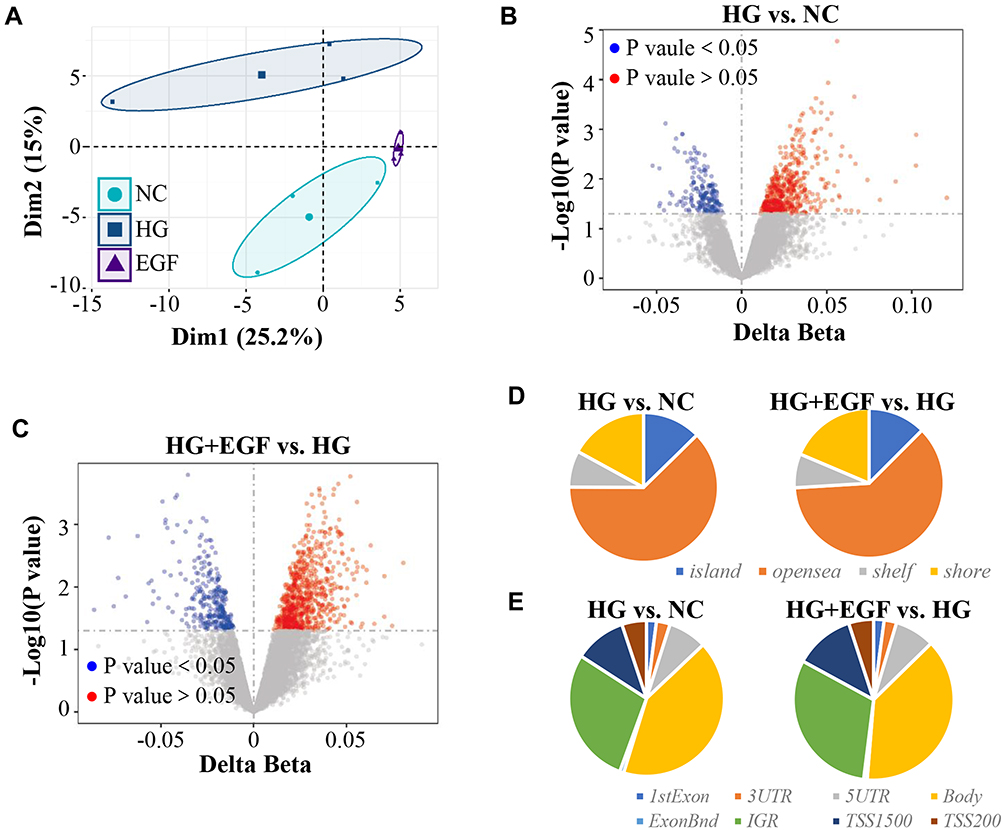 |
Figure 3 DNA methylation expression profile analysis of podocytes cells (A) Principal component analysis (PCA). (B) Volcano plot analysis of significantly differentially methylated CpG sites of podocytes cells between the high glucose (HG) and normal glucose (NC). (C) Volcano plot analysis of significantly differentially methylated CpG sites of podocytes cells among the Epidermal Growth Factor (EGF) and high glucose (HG) group. (D) CpG content and neighbourhood context of CpG island, shore, shelf and open sea distribution of different methylation CpG sites. (E) Different DNA methylation CpG sites gene structure: 5ʹUTR, 3ʹUTR, 1stExon, TSS200, TSS1500, IGR and gene body distribution. |
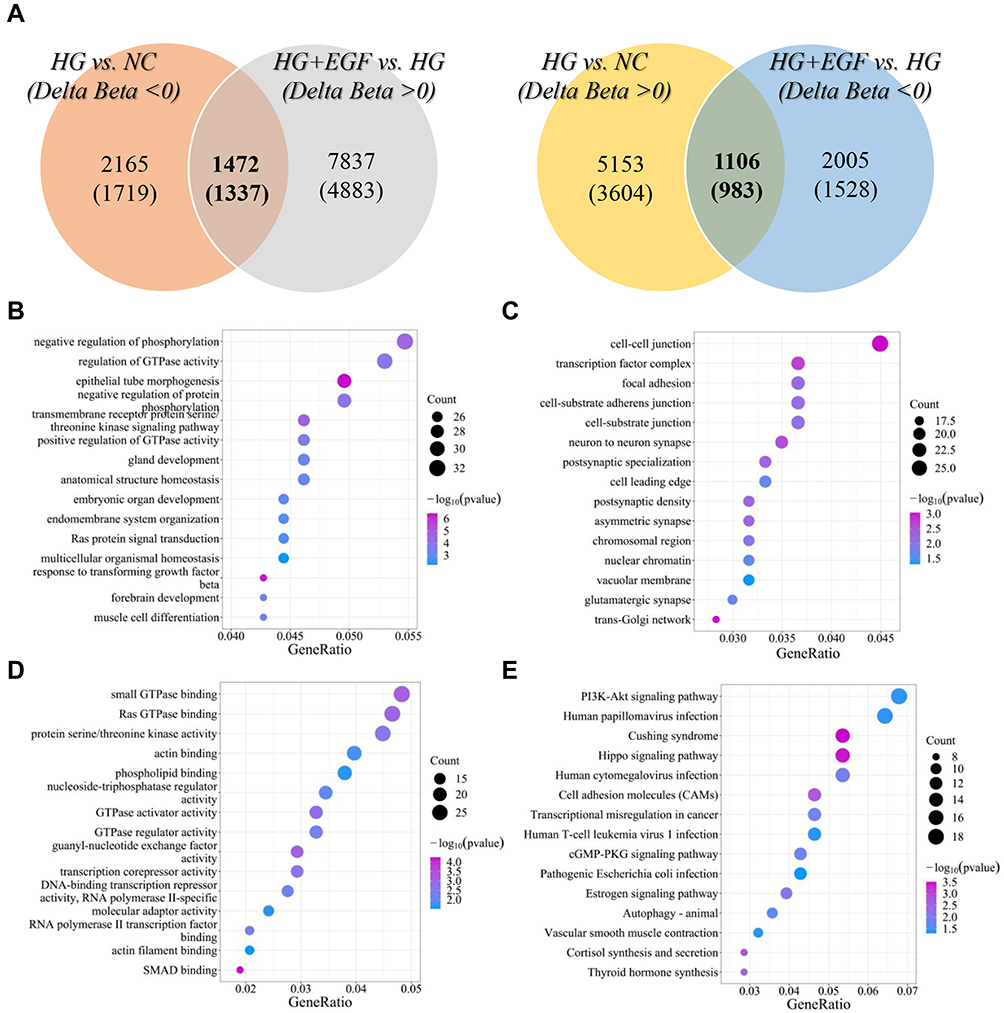 |
Figure 4 Functional enrichment analysis of 2320 differentially methylated genes. (A) The venn diagram shows the intersection between differentially methylated CpG sites or genes in the high glucose (HG) vs normal glucose (NG) and differentially methylated CpG sites or genes in the HG+EFG vs HG. (B) Enriched GO terms in the “biological process” category. (C) Enriched GO terms in the “molecular function” category. (D) Enriched GO terms in the “cellular component” category. The color represents the ranges of the enriched -log10 (P value). (E) Enriched KEGG biological pathways. The color represents the ranges of the enriched -log10 (P value). Count represents the enrich genes numbers. |
Enrichment Analysis of Methylated Genes Regulated by EGF
In order to explore the biological function of EGF in the treatment of HG-induced human podocytes injury, we further performed GO enrichment and KEGG pathway analysis of the differentially methylated genes (983 genes) regulated by EGF. The functional classification of genomic data was obtained from GO (http://www.geneontology.org) database, which include biological process (Figure 4B), molecular function (Figure 4C), and cellular component (Figure 4D). GO enrichment analysis suggest that DNA methylation was significantly enriched in negative regulation of phosphorylation, cell-cell junction and GTPase binding. In the KEGG pathway analysis, these genes were mainly enriched in PI3K-Akt, Hippo and autophagy pathways (Figure 4E). Moreover, we validated that EGF counteracted the inductive effect of HG on the protein level of p-PI3K, p-Akt and p-mTOR in the human podocytes, with the total protein levels of PI3K, Akt and mTOR unchanged (Supplemental Figure S2), indicating that EGF negatively regulated PI3K/Akt/mTOR signaling in HG-induced human podocytes.
Screening of Key Methylation Genes Regulated by EGF
To further to explore the key methylation genes regulated by EGF, we used STRING database to construct the PPI network of the differentially methylated genes regulated by EGF. The constructed PPI network is shown in Figure 5A. KEGG enrichment was used to analyze the genes screened by PPI network. The results showed that hub genes were mainly enriched in PI3K/AKT/mTOR signal pathway, which was related to autophagy (Figure 5B). Subsequently, six genes (ITGB1, GRB2, FN1, ITGB3, FZD10, FGFR1) enriched in PI3K/AKT/mTOR signal pathway and with high connectivity in the PPI network were selected for further validation studies.
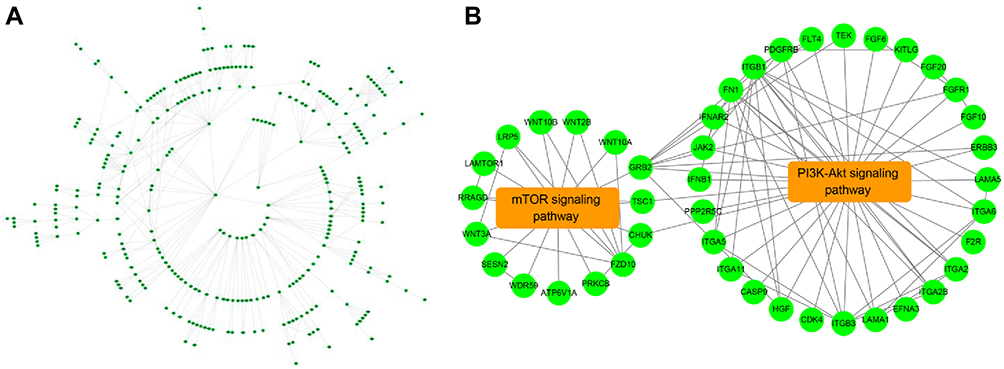 |
Figure 5 The PPI network of methylation regulated by EGF. (A). PPI interaction network analysis of 2320 methylated genes; (B). PPI interaction network of genes enriched in PI3K/Akt/mTOR pathways. |
The Methylation Level and mRNA Expression Level of Six Candidate Genes
To perform a targeted validation of the results obtained by the DNA methylation array analysis, we quantified DNA methylation of the above six genes (ITGB1, GRB2, FN1, ITGB3, FZD10, and FGFR1) by qMSP. As shown in Figure 6A, the methylation level of ITGB1, GRB2, FN1, ITGB3 and FZD10 in HG group were significantly higher than those in NC group. For the gene FGFR1, the methylation level of FGFR1 was significantly lower in the HG group than that in the NC group (Figure 6A). EGF treatment decreased the methylation levels of ITGB1, GRB2, FN1 and ITGB3, but increased the methylation levels of FZD10 and FGFR1 when compared to the HG group (Figure 6A).
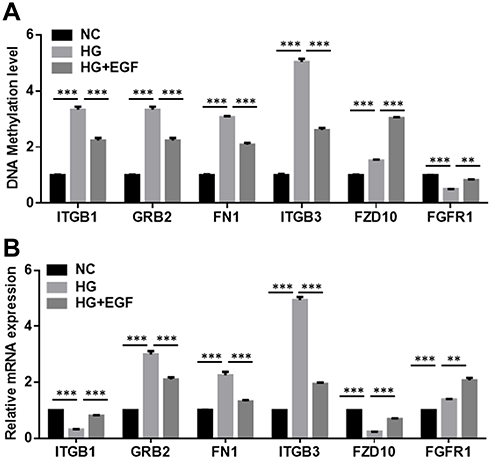 |
Figure 6 The methylation level and mRNA expression level of six candidate genes. (A) The methylation levels of ITGB1, GRB2, FN1, ITGB3, FZD10, FGFR1 in the podocytes from the NC, HG and HG+EGF group were determined by qMSP. (B) The relative mRNA expression levels of ITGB1, GRB2, FN1, ITGB3, FZD10, FGFR1 in the podocytes from the NC, HG and HG+EGF group were detected by qRT-PCR. N = 3; significant differences among treatment groups were shown as **P < 0.01, ***P < 0.001. |
DNA methylation, especially within the promoter regions, usually affected the biological function of cells by changing related genes expression. Therefore, we simultaneously detected whether EGF affected the expression of the above six genes (ITGB1, GRB2, FN1, ITGB3, FZD10, and FGFR1). The mRNA levels of these genes further analyzed by qRT-PCR. HG treatment significantly decreased the mRNA expression levels of ITGB1 and FZD10, but increased the mRNA expression levels of GRB2, FN1, ITGB3 and FGFR1 in the podocytes when compared to that in the NC group (Figure 6B). On the other hand, EGF treatment remarkably increased the mRNA expression levels of ITGB2, FZD10 and FGFR1, and decreased the mRNA expression levels of GRB2, FN1 and ITGB3 in the podocytes when compared to the HG group (Figure 6B).
Discussion
DN is a potentially fatal diabetic complication, affecting large number of people worldwide. EGF has many biological functions such as the regulation of cell growth, proliferation and tissue repair.18 Satirapoj et al suggested that urinary EGF could be served as biomarkers for kidney damage in DN, which could be used to predict the renal progression in the diabetic patients.19 Furthermore, low urinary EGF level was found in tubular atrophy and interstitial fibrosis.20 However, the therapeutic effect of EGF on the treatment of DN has not been described.
Podocytes are terminally differentiated epithelial cells attached to the glomerular basement membrane and play an important role in maintaining the structural and functional integrity of the glomerular filtration barrier. Emerging evidence has verified that podocytes injury and apoptosis is the earliest link of DN, and to find an effective and feasible intervention methods is the key to prevent and treatment of DN.6,21,22 EGF is the typical epidermal growth factor receptor (EGFR) ligand, which is mainly derived from the kidney. Studies indicated that EGF accelerate the renal repair after an injurious insult,23–25 and EGFR deletion delays recovery of renal injury.26 In addition, Li et al reported that EGF alone could inhibit podocytes apoptosis and injury in HG environment.15 Consistent with these studies, we also found that EGF can inhibit human podocytes injury and apoptosis, and further found that this protective effect was achieved through the autophagy activation. One study demonstrated that EGFR activation induced renal proximal tubular cells proliferation and migration.27 Lei et al reported that EGFR expression is reduced in renal tissue of DN rats and HG-induced podocytes, inhibition of EGFR ubiquitination ameliorated hyperglycemia induced podocyte damage and inhibited ERK signaling pathway.28 On the contrary, some studies illustrated that EGFR plays a deleterious action in renal pathology. Laura et al reported that EGFR pathway is activated in diabetic kidney diseases, and targeted intervention EGFR could improve renal outcomes in DN.29 Rayego et al reported that EGFR activation accelerates renal damage in chronic kidney disease by activation of a fibrotic -related process.30 Li et al reported that podocyte EGFR deletion protected podocyte injury and markedly reduced in albuminuria and glomerulosclerosis, renal proinflammatory cytokine/chemokine expression, and decreased profibrotic and fibrotic components in DN mice with type 2 diabetes.31 Different mechanisms may be involved in these studies. Hence, the mechanism through which EGF to prevent HG-induced podocytes apoptosis and injury needs further study.
During the past decade, the importance of podocyte injury in the formation and progression of DN has been emphasized in various studies. DNA methylation was related to podocytes injury, which provides novel perspectives.32,33 To explore the changes of DNA methylation in HG and/or EFG-treated podocytes, DNA methylation expression profile was analyzed using Illumina 850K (EPIC) DNA methylation array. Compared to HG group, 9309 hypermethylation CpG sites (5220 genes) and 3111 hypomethylation CpG sites (2511 genes) were found in HG+EGF group. These results EGF-mediated protective effects on the HG-induced podocyte injury may be associated with the changes in the DNA methylation. The enrichment analysis of this study showed that the differentially DNA methylation genes were significantly enriched in the PI3K/AKT/mTOR signaling pathway, suggesting that EGF-mediated protective effects may be associated with modulation of PI3K/AKT/mTOR in the HG-stimulated podocytes. PI3K/Akt/mTOR signaling pathway is related to many cellular processes, including the regulation of apoptosis, inflammation, autophagy.23,24 Previous studies illustrated that PI3K/Akt/mTOR signaling mediated high glucose induced podocytes injury via restraining podocytes autophagy,34–36 indicating targeting this signaling is a promising way to ameliorate DN progression. In addition, studies have reported that EGF can regulate PI3K/Akt/mTOR signaling pathways in various cancer.37,38 However, its effect on regulating PI3K/AKT/mTOR signaling suggested that EGF-mediated autophagy activation through PI3K/AKT/mTOR signaling and therefore to protect against podocyte damage. Herein, the Western blot analysis of this study uncovered that EGF negatively regulated PI3K/Akt/mTOR signaling in HG-induced human podocytes, indicating EGF could alleviate HG-induced human podocytes injury by inhibiting PI3K/Akt/mTOR signaling. Furthermore, previous studies have shown that EGF can involve in the MAPK and AMPK signaling to regulate cellular biological function.39–41 EGF stimulation regulates the VEGF expression in GBM cells through MAPK signaling.42 EGF-induced cell migration and EMT through regulating p38-/ERK-MAPK signaling pathway.40,43,44 EGF activated AMPK by Ca2+/Calmodulin-dependent kinase under various cellular stresses.41 The treatment of CRC cell with EGF induced a significant AMPK phosphorylation.45 Interestingly, MAPK and AMPK signaling pathway plays critical roles in proliferation, apoptosis and autophagy of podocytes.46–50 Diana et al, reported that EGF promotes HK-2 cells proliferation by MAPK (ERK1/2) signaling activation51. Our founding indicated that the differentially DNA methylation genes were enriched in the MAPK and AMPK signaling pathway, suggesting that EGF-mediated protective effect may be regulated via MAPK or AMPK signaling pathway in high glucose environment.
Based on the PPI network analysis, six hub genes including ITGB1, GRB2, FN1, ITGB3, FZD10 and FGFR1 in the podocytes were subjected to MSP and qRT-PCR analysis. ITGB1 (integrin β1) and ITGB3 (integrin β3) belong to the members of integrin family. Integrins can activate multiple signaling pathways, such as PI3K/Akt pathway, which can regulate cell survival.52,53 Wang et al, found that EGFR‐ITGB1 complex can be activated in cell adhesion sites by activating of EGFR.54 The results from this study showed that the methylation level of ITGB1 and ITGB3 was elevated after treatment with HG and decreased by EGF treatment, suggesting EGF could promote cell survival via the regulation of ITGB1 and ITGB3/PI3K/Akt pathway. GRB2 protein, with a SH2 domain flanked by N- and C-terminal SH3 domains, mediated cell proliferation by stimulating PI3K/AKT/mTOR pathway.55 Our results showed that the methylation level and mRNA expression level of GRB2 were up-regulated in HG group. In HG+EGF group, the methylation level and mRNA expression level of GRB2 were decreased. Our results implied EGF could promote PI3K/Akt/mTOR pathway activity by the proline-rich domain-mediated GRB2-binding.56 FN1 is one of the extracellular matrix glycoprotein that plays an important role in cellular adhesion, tissue remodeling and so on. Gao et al found the silence of FN1 could inactivate the AKT signaling pathway.57 In our study, the methylation level and mRNA expression level of FN1 were increased in the HG group. In HG+EGF group, the methylation level and mRNA expression level of FN1 were down-regulated. Our data suggested that EGF may exert protective effects on the HG-induced podocyte injury via repressing FN1 expression, which subsequently inactivated the AKT signaling pathway. FZD10 can positively modulate cell proliferation via the activation of Wnt/β-catenin signaling; while the repression of AKT activation partly accounted for WNT inhibition.58 Our results showed the mRNA expression level of FZD10 in podocytes could be decreased by HG; while EGF could enhance the mRNA expression of FZD10. These results suggested that the EGF promoted the cell proliferation of podocytes by increasing FZD10 expression. FGFR1 has been found to regulate the inflammatory cytokines release via PI3K signaling.59 Our results showed that the methylation level of FGFR1 was reduced by HG and increased by EGF, which suggested the effect of EGF was mediated via PI3K pathway with attenuated FGFR1 expression.
Conclusion
In summary, our results demonstrated that EGF exerted protective effects on HG-induced podocytes injury via enhancing cell proliferation and inhibiting cell apoptosis. Further mechanistic studies implied that EGF-mediated protective effects in HG-stimulated podocytes may be associated with modulation of autophagy and PI3K/AKT/mTOR signaling pathway.
Data Sharing Statement
All data generated or analyzed during this study are included in this published article.
Acknowledgments
We thank Dr. Xiaoqing Wang for the advice on the statistical analysis.
Author Contributions
All authors made substantial contributions to conception and design, acquisition of data, or analysis and interpretation of data; took part in drafting the article or revising it critically for important intellectual content; agreed to submit to the current journal; gave final approval of the version to be published; and agree to be accountable for all aspects of the work.
Funding
This study was supported by Shenzhen Fundamental Research Program (NO. JCYJ20180306170650122), and the Sanming Project of Medicine in Shenzhen of China (NO. SZSM201911017).
Disclosure
All authors declare that they have no conflicts of interest.
References
1. Checheriţă IA, Manda G, Hinescu ME, et al. New molecular insights in diabetic nephropathy. Int Urol Nephrol. 2016;48(3):373–387. doi:10.1007/s11255-015-1203-x
2. Gnudi L, Coward RJM, Long DA. Diabetic nephropathy: perspective on novel molecular mechanisms. Trends Endocrinol Metab. 2016;27(11):820–830. doi:10.1016/j.tem.2016.07.002
3. Liu N, Xu L, Shi Y, Zhuang S. Podocyte autophagy: a potential therapeutic target to prevent the progression of diabetic nephropathy. J Diabetes Res. 2017;2017:3560238. doi:10.1155/2017/3560238
4. Maezawa Y, Takemoto M, Yokote K. Cell biology of diabetic nephropathy: roles of endothelial cells, tubulointerstitial cells and podocytes. J Diabetes Investig. 2015;6(1):3–15. doi:10.1111/jdi.12255
5. Lin TA, Wu VC, Wang CY. Autophagy in chronic kidney diseases. Cells. 2019;8(1):61. doi:10.3390/cells8010061
6. Zhang L, Wen Z, Han L, et al. Research progress on the pathological mechanisms of podocytes in diabetic nephropathy. J Diabetes Res. 2020;2020:7504798. doi:10.1155/2020/7504798
7. Yasuda-Yamahara M, Kume S, Tagawa A, Maegawa H, Uzu T. Emerging role of podocyte autophagy in the progression of diabetic nephropathy. Autophagy. 2015;11(12):2385–2386. doi:10.1080/15548627.2015.1115173
8. Tang C, Livingston MJ, Liu Z, Dong Z. Autophagy in kidney homeostasis and disease. Nat Rev Nephrol. 2020;16(9):489–508. doi:10.1038/s41581-020-0309-2
9. Choi ME. Autophagy in kidney disease. Annu Rev Physiol. 2020;82(1):297–322. doi:10.1146/annurev-physiol-021119-034658
10. Lv Q, Yang F, Chen K, Zhang Y. Autophagy protects podocytes from sublytic complement induced injury. Exp Cell Res. 2016;341(2):132–138. doi:10.1016/j.yexcr.2016.02.009
11. Xin W, Li Z, Xu Y, et al. Autophagy protects human podocytes from high glucose-induced injury by preventing insulin resistance. Metabolism. 2016;65(9):1307–1315. doi:10.1016/j.metabol.2016.05.015
12. Parchen GP, Jacumazo J, Koop HS, et al. Modulation of epidermal growth factor release by biopolymer-coated liposomes. J Pharm Sci. 2020;109(7):2294–2301. doi:10.1016/j.xphs.2020.04.004
13. Tang X, Liu B, Wang X, Yu Q, Fang R. Epidermal growth factor, through alleviating oxidative stress, protect IPEC-J2 cells from lipopolysaccharides-induced apoptosis. Int J Mol Sci. 2018;19.
14. Ju W, Nair V, Smith S, et al. Tissue transcriptome-driven identification of epidermal growth factor as a chronic kidney disease biomarker. Sci Transl Med. 2015;7(316):316ra193. doi:10.1126/scitranslmed.aac7071
15. Li D, Wang N, Zhang L, et al. Mesenchymal stem cells protect podocytes from apoptosis induced by high glucose via secretion of epithelial growth factor. Stem Cell Res Ther. 2013;4(5):103. doi:10.1186/scrt314
16. Coskun ZM, Ersoz M, Adas M, et al. Kruppel-like transcription factor-4 gene expression and DNA methylation status in type 2 diabetes and diabetic nephropathy patients. Arch Med Res. 2019;50(3):91–97. doi:10.1016/j.arcmed.2019.05.012
17. Bell CG, Teschendorff AE, Rakyan VK, Maxwell AP, Beck S, Savage DA. Genome-wide DNA methylation analysis for diabetic nephropathy in type 1 diabetes mellitus. BMC Med Genomics. 2010;3(1):33. doi:10.1186/1755-8794-3-33
18. Choi SM, Lee KM, Kim HJ, et al. Effects of structurally stabilized EGF and bFGF on wound healing in type I and type II diabetic mice. Acta Biomater. 2018;66:325–334. doi:10.1016/j.actbio.2017.11.045
19. Satirapoj B, Dispan R, Radinahamed P, Kitiyakara C. Urinary epidermal growth factor, monocyte chemoattractant protein-1 or their ratio as predictors for rapid loss of renal function in type 2 diabetic patients with diabetic kidney disease. BMC Nephrol. 2018;19(1):246. doi:10.1186/s12882-018-1043-x
20. Worawichawong S, Worawichawong S, Radinahamed P, et al. Urine epidermal growth factor, monocyte chemoattractant protein-1 or their ratio as biomarkers for interstitial fibrosis and tubular atrophy in primary glomerulonephritis. Kidney Blood Press Res. 2016;41(6):997–1007. doi:10.1159/000452595
21. Podgórski P, Konieczny A, Ł L, Witkiewicz W, Hruby Z. Glomerular podocytes in diabetic renal disease. Adv Clin Exp Med. 2019;28(12):1711–1715. doi:10.17219/acem/104534
22. Kravets I, Mallipattu SK. The role of podocytes and podocyte-associated biomarkers in diagnosis and treatment of diabetic kidney disease. J EndocrineSoc. 2020;4(4):bvaa029. doi:10.1210/jendso/bvaa029
23. Humes HD, Cieslinski DA, Coimbra TM, Messana JM, Galvao C. Epidermal growth factor enhances renal tubule cell regeneration and repair and accelerates the recovery of renal function in postischemic acute renal failure. J Clin Invest. 1989;84(6):1757–1761. doi:10.1172/JCI114359
24. Coimbra TM, Cieslinski DA, Humes HD. Epidermal growth factor accelerates renal repair in mercuric chloride nephrotoxicity. Am J Physiol. 1990;259(3 Pt 2):F438–43. doi:10.1152/ajprenal.1990.259.3.F438
25. Morin NJ, Laurent G, Nonclercq D, et al. Epidermal growth factor accelerates renal tissue repair in a model of gentamicin nephrotoxicity in rats. Am J Physiol. 1992;263(5 Pt 2):F806–11. doi:10.1152/ajprenal.1992.263.5.F806
26. Chen J, Chen JK, Harris RC. Deletion of the epidermal growth factor receptor in renal proximal tubule epithelial cells delays recovery from acute kidney injury. Kidney Int. 2012;82(1):45–52. doi:10.1038/ki.2012.43
27. Zhuang S, Dang Y, Schnellmann RG. Requirement of the epidermal growth factor receptor in renal epithelial cell proliferation and migration. Am J Physiol Renal Physiol. 2004;287(3):F365–72. doi:10.1152/ajprenal.00035.2004
28. Lei CT, Wei YH, Tang H, et al. PKC-α triggers EGFR ubiquitination, endocytosis and ERK activation in podocytes stimulated with high glucose. Cell Physiol Biochem. 2017;42(1):281–294. doi:10.1159/000477329
29. Laura HR, Gansevoort RT, van Goor H, Meijer E. The epidermal growth factor receptor pathway in chronic kidney diseases. Nat Rev Nephrol. 2016;12(8):496–506. doi:10.1038/nrneph.2016.91
30. Rayego MS, Rodrigues-Diez R, Morgado-Pascual JL, et al. Role of epidermal growth factor receptor (EGFR) and its ligands in kidney inflammation and damage. Mediators Inflamm. 2018;2018:8739473. doi:10.1155/2018/8739473
31. Li Y, Pan Y, Cao S, et al. Podocyte EGFR inhibits autophagy through upregulation of rubicon in type 2 diabetic nephropathy. Diabetes. 2021;70(2):562–576. doi:10.2337/db20-0660
32. Hishikawa A, Hayashi K, Abe T, et al. Decreased KAT5 expression impairs DNA repair and induces altered DNA methylation in kidney podocytes. Cell Rep. 2019;26(5):1318–1332.e4. doi:10.1016/j.celrep.2019.01.005
33. Singh S, Sonkar SK, Sonkar GK, Mahdi AA. Diabetic kidney disease: a systematic review on the role of epigenetics as diagnostic and prognostic marker. Diabetes Metab Res Rev. 2019;35(5):e3155. doi:10.1002/dmrr.3155
34. Zheng D, Tao M, Liang X, Li Y, Jin J, He Q. p66Shc regulates podocyte autophagy in high glucose environment through the Notch-PTEN-PI3K/Akt/mTOR pathway. Histol Histopathol. 2020;35(4):405–415. doi:10.14670/HH-18-178
35. Yang F, Qu Q, Zhao C, et al. Paecilomyces cicadae-fermented radix astragali activates podocyte autophagy by attenuating PI3K/AKT/mTOR pathways to protect against diabetic nephropathy in mice. Biomed Pharmacother. 2020;129:110479. doi:10.1016/j.biopha.2020.110479
36. Di Tu Q, Jin J, Hu X, Ren Y, Zhao L, He Q. Curcumin improves the renal autophagy in rat experimental membranous nephropathy via regulating the PI3K/AKT/mTOR and Nrf2/HO-1 signaling pathways. Biomed Res Int. 2020;2020:7069052. doi:10.1155/2020/7069052
37. Lian G, Chen S, Ouyang M, Li F, Chen L, Yang J. Colon cancer cell secretes EGF to promote M2 polarization of TAM through EGFR/PI3K/AKT/mTOR pathway. Technol Cancer Res Treat. 2019;18:1533033819849068. doi:10.1177/1533033819849068
38. Li Y, Liu J, Yang X, Dong Y, Liu Y, Chen M. Ginkgol C17:1 inhibits tumor growth by blunting the EGF- PI3K/Akt signaling pathway. J Biomed Res. 2017;31(3):232–239. doi:10.7555/JBR.31.20160039
39. Sheng W, Chen C, Dong M, et al. Calreticulin promotes EGF-induced EMT in pancreatic cancer cells via integrin/EGFR-ERK/MAPK signaling pathway. Cell Death Dis. 2017;8(10):e3147. doi:10.1038/cddis.2017.547
40. Sheng W, Shi X, Lin Y, et al. Musashi2 promotes EGF-induced EMT in pancreatic cancer via ZEB1-ERK/MAPK signaling. J Exp Clin Cancer Res. 2020;39(1):16. doi:10.1186/s13046-020-1521-4
41. Han F, Li CF, Cai Z, et al. The critical role of AMPK in driving Akt activation under stress, tumorigenesis and drug resistance. Nat Commun. 2018;9(1):4728. doi:10.1038/s41467-018-07188-9
42. Nicolas S, Abdellatef S, Haddad MA, Fakhoury I, El-Sibai M. Hypoxia and EGF stimulation regulate VEGF expression in human glioblastoma multiforme (GBM) cells by differential regulation of the PI3K/Rho-GTPase and MAPK pathways. Cells. 2019;8(11):1397. doi:10.3390/cells8111397
43. Kawabata T, Otsuka T, Fujita K, et al. (-)-Epigallocatechin gallate but not chlorogenic acid suppresses EGF-stimulated migration of osteoblasts via attenuation of p38 MAPK activity. Int J Mol Med. 2018;42(6):3149–3156. doi:10.3892/ijmm.2018.3884
44. Lin C, Qin Y, Zhang H, Gao MY, Wang YF. EGF upregulates RFPL3 and hTERT via the MEK signaling pathway in non‑small cell lung cancer cells. Oncol Rep. 2018;40(1):29–38. doi:10.3892/or.2018.6417
45. Shukla K, Sonowal H, Saxena A, Ramana KV, Srivastava SK. Aldose reductase inhibitor, fidarestat regulates mitochondrial biogenesis via Nrf2/HO-1/AMPK pathway in colon cancer cells. Cancer Lett. 2017;411:57–63. doi:10.1016/j.canlet.2017.09.031
46. Li X, Ma A, Liu K. Geniposide alleviates lipopolysaccharide-caused apoptosis of murine kidney podocytes by activating Ras/Raf/MEK/ERK-mediated cell autophagy. Artif Cells, Nanomed Biotechnol. 2019;47(1):1524–1532. doi:10.1080/21691401.2019.1601630
47. Chen CA, Chang JM, Yang YL, Chang EE, Chen HC. Macrophage migration inhibitory factor regulates integrin-β1 and cyclin D1 expression via ERK pathway in podocytes. Biomed Pharmacother. 2020;124:109892. doi:10.1016/j.biopha.2020.109892
48. Shao X, Zhang X, Hu J, et al. Dopamine 1 receptor activation protects mouse diabetic podocytes injury via regulating the PKA/NOX-5/p38 MAPK axis. Exp Cell Res. 2020;388(2):111849. doi:10.1016/j.yexcr.2020.111849
49. Ye Y, Zhong X, Li N, Pan T. Protective effects of liraglutide on glomerular podocytes in obese mice by inhibiting the inflammatory factor TNF-α-mediated NF-κB and MAPK pathway. Obes Res Clin Pract. 2019;13(4):385–390. doi:10.1016/j.orcp.2019.03.003
50. Fan Y, Yang Q, Yang Y, et al. Sirt6 suppresses high glucose-induced mitochondrial dysfunction and apoptosis in podocytes through AMPK activation. Int J Biol Sci. 2019;15(3):701–713. doi:10.7150/ijbs.29323
51. Diana ZO, Wen HM, Hamilton BA, Raikwar NS, Thomas CP. EGF regulation of proximal tubule cell proliferation and VEGF-A secretion. Physiol Rep. 2017;5(18):5. doi:10.14814/phy2.13453
52. Shao N, Lu Z, Zhang Y, et al. Interleukin-8 upregulates integrin β3 expression and promotes estrogen receptor-negative breast cancer cell invasion by activating the PI3K/Akt/NF-κB pathway. Cancer Lett. 2015;364(2):165–172. doi:10.1016/j.canlet.2015.05.009
53. Sun F, Wang J, Sun Q, et al. Interleukin-8 promotes integrin β3 upregulation and cell invasion through PI3K/Akt pathway in hepatocellular carcinoma. J Exp Clin Cancer Res. 2019;38(1):449. doi:10.1186/s13046-019-1455-x
54. Wang K, Zhu X, Mei D, Ding Z. Caveolin-1 contributes to anoikis resistance in human gastric cancer SGC-7901 cells via regulating Src-dependent EGFR-ITGB1 signaling. J Biochem Mol Toxicol. 2018;32(10):e22202. doi:10.1002/jbt.22202
55. Yang M, Lewinska M, Fan X, Zhu J, Yuan ZM. PRR14 is a novel activator of the PI3K pathway promoting lung carcinogenesis. Oncogene. 2016;35(42):5527–5538. doi:10.1038/onc.2016.93
56. Dülk M, Szeder B, Glatz G, et al. EGF regulates the interaction of Tks4 with Src through its SH2 and SH3 domains. Biochemistry. 2018;57(28):4186–4196. doi:10.1021/acs.biochem.8b00084
57. Gao R, Feng Q, Tan G. microRNA-613 exerts anti-angiogenic effect on nasopharyngeal carcinoma cells through inactivating the AKT signaling pathway by down-regulating FN1. Biosci Rep. 2019;39(7). doi:10.1042/BSR20182196
58. Chen Y, Huang Q, Zhou H, Wang Y, Hu X, Li T. Inhibition of canonical WNT/β-catenin signaling is involved in leflunomide (LEF)-mediated cytotoxic effects on renal carcinoma cells. Oncotarget. 2016;7(31):50401–50416. doi:10.18632/oncotarget.10409
59. Zhang R, Dong Y, Sun M, et al. Tumor-associated inflammatory microenvironment in non-small cell lung cancer: correlation with FGFR1 and TLR4 expression via PI3K/Akt pathway. J Cancer. 2019;10(4):1004–1012. doi:10.7150/jca.26277
 © 2021 The Author(s). This work is published and licensed by Dove Medical Press Limited. The full terms of this license are available at https://www.dovepress.com/terms.php and incorporate the Creative Commons Attribution - Non Commercial (unported, v3.0) License.
By accessing the work you hereby accept the Terms. Non-commercial uses of the work are permitted without any further permission from Dove Medical Press Limited, provided the work is properly attributed. For permission for commercial use of this work, please see paragraphs 4.2 and 5 of our Terms.
© 2021 The Author(s). This work is published and licensed by Dove Medical Press Limited. The full terms of this license are available at https://www.dovepress.com/terms.php and incorporate the Creative Commons Attribution - Non Commercial (unported, v3.0) License.
By accessing the work you hereby accept the Terms. Non-commercial uses of the work are permitted without any further permission from Dove Medical Press Limited, provided the work is properly attributed. For permission for commercial use of this work, please see paragraphs 4.2 and 5 of our Terms.