")
Back to Journals » Vascular Health and Risk Management » Volume 10
Epidemiology of stroke in a rural community in Southeastern Nigeria
Authors Enwereji K, Nwosu M, Ogunniyi A , Nwani P, Asomugha AL, Enwereji E
Received 15 November 2013
Accepted for publication 17 February 2014
Published 24 June 2014 Volume 2014:10 Pages 375—388
DOI https://doi.org/10.2147/VHRM.S57623
Checked for plagiarism Yes
Review by Single anonymous peer review
Peer reviewer comments 3
Kelechi O Enwereji,1 Maduaburochukwu C Nwosu,1 Adesola Ogunniyi,2 Paul O Nwani,1 Azuoma L Asomugha,1 Ezinna E Enwereji3
1Neurology Unit, Department of Medicine, Nnamdi Azikiwe University Teaching Hospital, Nnewi, Anambra State, Nigeria; 2Neurology Unit, Department of Medicine, University College Hospital Ibadan, Oyo State, Nigeria; 3Department of Community Medicine/Nursing Sciences, College of Medicine, Abia State University, Uturu, Abia State, Nigeria
Background: The prevalence and incidence of stroke vary from community to community worldwide. Nonetheless, not much is known about the current epidemiology of stroke in rural Nigeria and indeed Africa.
Methods: We carried out a two-phase door-to-door survey in a rural, predominantly low-income, community in Anambra, Southeastern Nigeria. We used a modified World Health Organization (WHO) protocol for detecting neurological diseases in the first phase, and a stroke-specific questionnaire and neurological examination in the second phase. An equal number of sex- and age-matched stroke-negative subjects were examined.
Results: We identified ten stroke subjects in the study. The crude prevalence of stroke in rural Nigeria was 1.63 (95% confidence interval [CI] 0.78–3.00) per 1,000 population. The crude prevalence of stroke in males was 1.99 (95% CI 0.73–4.33) per 1,000, while that for females was 1.28 (95% CI 0.35–3.28) per 1,000 population. The peak age-specific prevalence of stroke was 12.08 (95% CI 3.92–28.19) per 1,000, while after adjustment to WHO world population, the peak was 1.0 (95% CI 0.33–2.33) per 1,000.
Conclusion: The prevalence of stroke was found to be higher than previously documented in rural Nigeria, with a slightly higher prevalence in males than females. This is, however, comparable to data from rural Africa.
Keywords: Africa, developing country, prevalence
Introduction
Stroke has existed since medieval times and considerable progress has been made in the knowledge of its nature and epidemiology.1,2 It is the second leading cause of death worldwide.3 The prevalence and incidence of stroke vary from community to community and from time to time worldwide. However, not much is known about the burden of stroke in sub-Saharan Africa.
The crude prevalence of stroke reported in a rural study in Southwestern Nigeria was 0.58 per 1,000 population,4 while the incidence of stroke was found to be 26 per 100,000 in a Southwestern urban register-based study in Nigeria.5 These studies were conducted more than two decades ago. Another relatively recent prevalence study in a Southwestern Nigerian urban community was found to be 1.14 per 1,000 population.6 The current epidemiology of stroke in rural Nigeria is yet unknown.
Therefore, the purpose of this study was to determine the current epidemiology of stroke in a rural community in Southeastern Nigeria while maintaining a continuous register for the incidence of stroke.
Methodology
This study was conducted in Ukpo, a predominantly low-income rural community with a population of 17,840 and 3,820 households (based on data from The National Population Commission of Nigeria on the 2006 national population census). Ukpo is the headquarters of Dunukofia Local Government Area in Anambra State, Southeastern region of Nigeria. It is a community with undulating terrain caused by erosion, which makes it not easily accessible by some vehicles. The community’s source of clean water is a privately owned bore-hole. Electricity is sporadic, resulting in a few inhabitants using electricity-generating sets, while most use kerosene lanterns. The residents of the community are essentially monogamists, with few practicing polygamy. The majority are Christians, indigenous, and of the Igbo tribe. The community is stable and does not tolerate intertribal or interreligious marriages. The predominant occupation is peasant farming, and their diet is tuber-based. They are served by one fully functional primary health care center located at the center of the community. There is some labor migration out of the community. They usually return during festive periods and maintain households in the community. They do, however, return home when they become retired or are unable to work due to ill health.
Ethical clearance was obtained from the ethical committee of the Nnamdi Azikiwe University Teaching Hospital (NAUTH), Nnewi prior to commencement of the study. The study was a descriptive community-based door-to-door survey. It was conducted in two phases, preceded by a sensitization meeting with the community leaders (the Igwe-in-council) and a 2-day workshop with the research assistants. The village town criers, church leaders, and schools were engaged to make regular announcements weeks before the commencement of the survey. The research assistants were educated on the research procedures and the use of research instruments. This comprised a detailed review of the questionnaire, demonstration of interview technique, and back-demonstration by the research assistants. The 2-day workshop was fully attended by clinical medical students and other research assistants recruited for the first phase of the study. The medical students further participated in pre-testing the questionnaires on patients attending the medical outpatient clinic at the Nnamdi Azikiwe University Teaching Hospital, Nnewi on three consecutive clinic days and familiarized themselves with the research instrument.
Consent procedure
Informed oral consent was first obtained from the Honourable Commissioner for Health in the state, subsequently the traditional ruler of the community and his council of chiefs, then the heads of households and individual subjects. Furthermore, informed consent was obtained from spouses or close relatives of those subjects who were incapable of giving their informed oral consent. However, an informed written consent was obtained from those who participated in the second phase of the study.
Phase 1: census and door-to-door survey using modified World Health Organization (WHO) questionnaire
A census of the community was conducted in computer-generated random samples of 33% of the total enumeration areas 3 weeks prior to the survey to determine the average number of persons per enumeration area. The persons in each enumeration area were listed according to households using the name of the most prominent member. There was an average of 252 persons per enumeration area, estimating to a total Ukpo population of 18,648 using the 74 enumeration areas as obtained from the National Population Commission. Therefore 33% of the population, which was approximately 6,150 persons (25 enumeration areas), was selected for interview from the estimated Ukpo population using a table of computer-generated randomization. All the persons resident in the 25 randomly selected enumeration areas at the time of the study were included in both the census and the survey.
The first phase was conducted January 14–28, 2011. It was a door-to-door survey carried out by eight teams of trained research assistants, each comprising a health attendant, two medical students with at least 2 years of clinical experience, and a literate Ukpo resident as their liaison officer. The teams of research assistants administered the screening instrument on a total of 6,150 Ukpo residents. The screening instrument was the modified WHO questionnaire for detecting neurological diseases, and it was interviewer-administered to detect persons with probable stroke. It was adapted from the WHO protocol for detecting neurological diseases for the purpose of this study. The modifications included rearranging the order of the questions by bringing forth less probing questions before the more probing ones to improve participant cooperation, and exclusion of the physical examination components of the protocol to reduce administration time as the second phase of the study also had a physical examination component. Also, the questions for detecting tremors and Parkinsonism were removed for the above reasons. The questionnaire was translated to the local dialect and back-translated to English by two bilingual Igbo West African Examination Council examiners. The translated version was crosschecked by the neurologists who are versed in the Igbo language before back-translation and adjustments were made to remove or improve ambiguous questions. These were fully explained to the research assistants. The research instrument (stroke-specific questionnaire) was validated in the Medical Out-Patient Department of NAUTH Nnewi using 20 patients and 20 students as controls. This yielded 20 as true negative, 8 as false positive, 12 as true positive, and 0 as false negative. Therefore, the sensitivity was 100% while the specificity was 71%.
The cases identified in this phase of the study as having probable stroke were enlisted for the second phase of the study. A positive response to any of questions 4, 7, and 8 in the screening instrument was considered as probable stroke and a formal invitation extended to the person to come to the Neuroepidemiology outpatient clinic in NAUTH Health Centre Ukpo for the second phase of the study.
Phase 2: screening with stroke-specific questionnaire and examination of participants
The second phase of the study was conducted in the outpatient clinic of the NAUTH Health Centre Ukpo by means of a semi-structured stroke-specific questionnaire and focused clinical examination (Supplementary material; Figures S1–S4). The radial pulse and all other peripheral pulses were checked, blood pressure measured, carotid bruits listened for, and the heart checked for evidence of likely embolic sources and hypertensive end-organ damage. A neurologic examination was done independently on each subject to detect residual paralysis, hemisensory loss, exaggerated deep tendon jerks, and an extensor plantar response by two consultant neurologists blinded to each other’s results. Where there was disagreement, both neurologists reexamined the subject together and agreed on a common finding. An equal number of stroke-negative controls were randomly selected from those who screened negative for stroke to match subjects by age (±2 years) and sex. These controls were screened and examined for risk factors, as was done for the stroke subjects. The diagnosis of stroke was clinical, based on the WHO definition.
Data analysis
Data were confidentially collected with study codes, recorded, cleaned, and analyzed using Epi Info™ (Centers for Disease Control and Prevention, Atlanta, GA, USA) 3.5.1 2008 statistical software. Continuous variables were presented as means with standard deviations, while categorical variables were presented as proportions. Crude, age-specific, and age-adjusted prevalences (WHO World Standard Population)7 were calculated alongside their confidence intervals (CIs). Student’s t-test was used to compare means, while Fisher’s exact test was used to compare categorical variables. P-value <0.05 was considered statistically significant.
Results
Demography of study population
A total of 6,150 persons were screened in the first phase of the study. Table 1 shows age and sex distribution of the 6,150 persons, comprising 3,017 (49.06%) males and 3,133 (50.94%) females, with a male to female ratio of approximately 1:1. The ages of the respondents ranged from 1 month to 103 years (mean 29.4±20.8 years). Those aged less than 45 years were 75.27% of the screened population, while those aged above 45 years comprised 24.73% of the population.
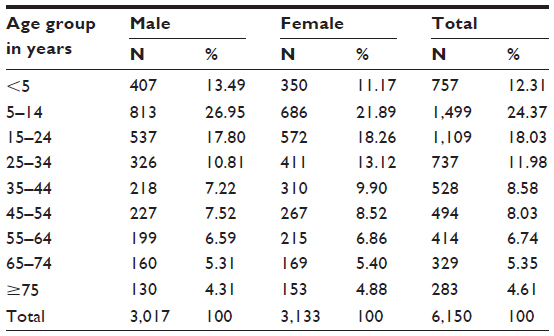 | Table 1 Age and sex distribution of the 6,150 persons screened |
A total of 20 persons were recruited for the second phase (post-stroke-specific questionnaire) of the study. They were made up of ten subjects and ten controls that were matched for age and sex. The mean age of subjects was 60.7±11.4 years (range 47–86 years), while the mean age of controls was 60.4±11.9 years (range 45–84 years). There was no statistical significance between the age of the subjects and that of controls (P=0.853).
Prevalence of stroke
Table 2 shows that the crude prevalence at the time of the survey on January 14, 2011 (point prevalence) of stroke was 1.63 (95% CI 0.78–3.00) per 1,000 population. The peak age-specific prevalence of stroke was found to be 1.0 (95% CI 0.33–2.33) when age-adjusted per 1,000 WHO world population. It also showed a higher crude prevalence of stroke in males of 1.99 (95% CI 0.73–4.33) per 1,000 than in females, which was 1.28 (95% CI 0.35–3.28) per 1,000 population (relative risk =1.55; P=0.44).
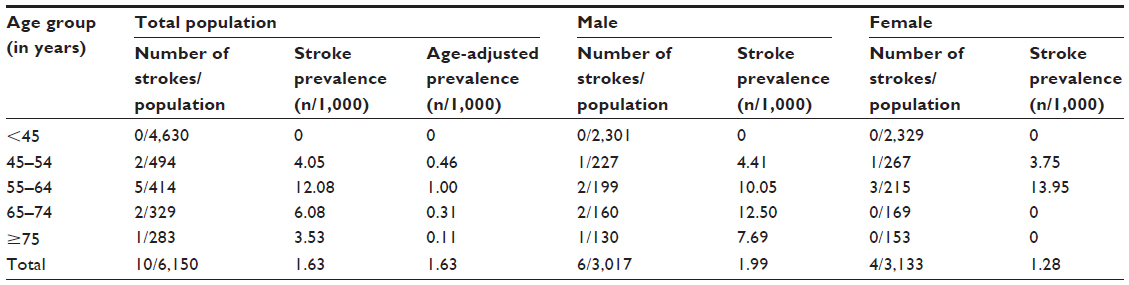 | Table 2 Sex-specific, age-specific, and age-adjusted (WHO World Population) prevalence of stroke |
Discussion
Previous studies in both developed and developing countries have reported crude prevalence of stroke ranging from 0 to 10.2 per 1,000 population, and the burden of stroke has also been projected to be on the rise.3,6 The crude prevalence of stroke in this study was comparatively higher than reported in previous community-based studies in Nigeria (1.63 versus 1.14, 0.58, and 0.68 per 1,000)4,6,8 but lower than reported in Aiyete, Southwestern Nigeria (4.43 per 1,000).9 Furthermore, we standardized our results to the WHO World Standard Population to compare better with data from other studies. In those aged above 7 years, our study’s age-adjusted prevalence remained higher than those of Danesi et al6 and Osuntokun et al4 (1.70 versus 1.10 and 0.53 per 1,000 population, respectively). Apart from the Danesi et al study, which was conducted less than one decade ago, all the other Nigerian studies were done more than two decades ago. However, unlike ours and the earlier Nigerian studies which were conducted in predominantly low-income rural communities, Danesi et al’s study was conducted in a mixed-income, urban community. Also, the proportion of the population at particular risk for stroke (45 years and above) was higher in our study than that of Danesi et al (24.73% versus 15.24%).6 This may be partly explained by the common practice in Nigeria of urban to rural migration after retirement of about 67% of retirees.10
Furthermore, our results were compared with other populations as detailed in Table 3. In a rural South African survey, the age-adjusted prevalence among populations aged above 15 years was higher than ours (3.3 versus 1.90 per 1,000).11 Also, an Asian study in urban Singapore reported a higher age-adjusted prevalence than ours in the population aged 65 years and above (6.31 versus 0.40 per 1,000).12 Nonetheless, the study in urban Nigeria when compared with ours showed a lower age-adjusted prevalence in the population 15 years and above of 1.10 per 1,000 but a higher age-adjusted prevalence of 1.99 per 1,000 in the population 65 years and above.6 The small population size of our study, as is common in many Sub-Saharan African studies, makes it difficult to give statistical interpretation to these differences with certainty.
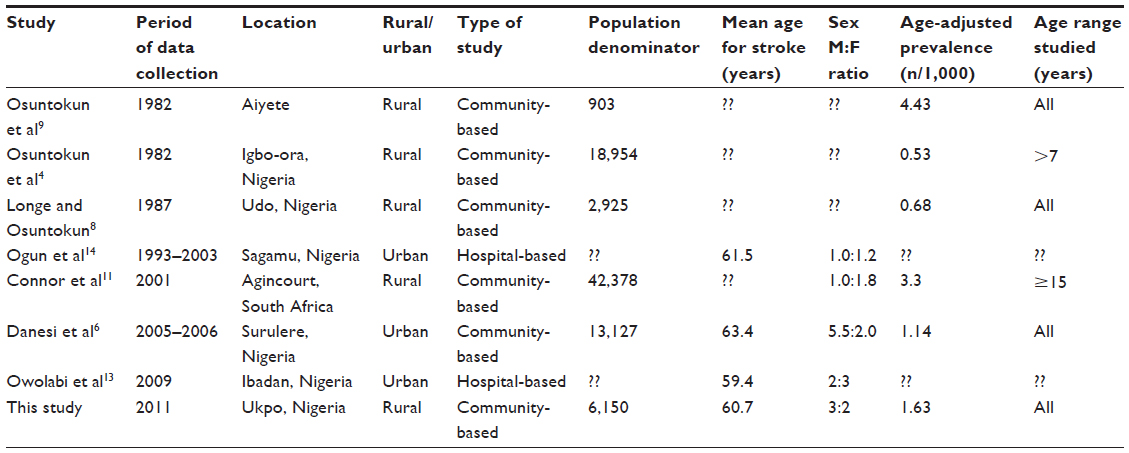 | Table 3 Characteristics of stroke prevalence studies compared with this study |
The mean age for stroke obtained in this study is comparable to hospital-based data reported by Owolabi et al13 and Ogun et al14 in Southwestern Nigeria (60.7 versus 59.4 and 61.5 years, respectively). However, our result was lower than the mean age for stroke reported by Danesi et al6 of 63.4 years, although their peak age-adjusted prevalence for stroke was also higher than ours at 1.11 (75–84 years age group) versus 1.00 (55–64 years age group) per 1,000 population, respectively. The low mean age for stroke has been variously attributed to the lower life expectancy and high prevalence of fatal stroke in developing countries.14,15 The mean ages and peak prevalence for stroke in developed countries have been reported to be higher than those of developing countries.13 Also, the male preponderance of stroke noted in our study is comparable to data obtained in Sub-Saharan African studies.3,6,11,16
Conclusion
The interpretative challenges experienced with variations in prevalence data from different communities notwithstanding, the prevalence of stroke is higher than previously reported in rural Nigeria. However, the study site is rural, with inhabitants predominantly of low socioeconomic status and a relatively higher proportion of the population being at risk of stroke. These are factors that may potentially affect the prevalence of stroke in the community.
We acknowledge the limitations of our study, as a larger population size would have been more representative; however, this is a modest attempt in our predominantly low income setting to assess the current prevalence of stroke in Nigeria. A longitudinal register is being kept to ascertain the current incidence of stroke in our study population. More studies to define the risk factors for stroke are recommended.
Disclosure
The authors report no conflicts of interest in this work.
References
Ashrafian H. Familial stroke 2700 years ago. Stroke 2010;41(4)e187. | |
National Institute of Neurological Diseases and Stroke; Stroke: Hope Through Research. 2004 NIH Publication No 99-2222. Available at http://www.ninds.nih.gov/disorders/stroke/detail_stroke.htm. Accessed May 8, 2014. | |
Feigin VL, Lawes CM, Bennett DA, Anderson CS. Stroke epidemiology: a review of population-based studies of incidence, prevalence and case-fatality in the late 20th century. Lancet Neurol. 2003;2:43–53. | |
Osuntokun BO, Adeuja AO, Schoenberg BS, et al. Neurological disorders in Nigerian Africans: a community based study. Acta Neurol Scand. 1987;75:13–21. | |
Osuntokun BO, Bademosi O, Akinkugbe OO, Oyediran AB, Carlisle R. Incidence of stroke in an African city: results from the stroke registry at Ibadan, Nigeria,1973–1975. Stroke. 1979;10:205–207. | |
Danesi M, Okubadejo N, Ojini F. Prevalence of stroke in an urban, mixed-income community in Lagos, Nigeria. Neuroepidemiology. 2007;28:216–223. | |
Ahmad OE, Boschi-Pinto C, Lopez AD, Murray CJL, Lozano R, Innoue M. Age Standardization of Rates: a New WHO Standard. GPE Discussion Paper Series No 31. Geneva: World Health Organization; 2001. Available from: http://www.who.int/healthinfo/paper31.pdf. Accessed April 7, 2014. | |
Longe AC, Osuntokun BO. Prevalence of neurological disorders in Udo, a rural community in Southern Nigeria. Trop Geogr Med. 1989;41:36–40. | |
Osuntokun BO, Schoenberg BS, Nottidge VA, et al. Research protocol for measuring the prevalence of neurologic disorders in developing countries. Neuroepidemiology. 1982;1(3):143–153. | |
Adebo GM, Sekumade AB. Socio-economic influence of retiree’s migration on rural development in Ekiti State, Nigeria. Int J Humanit Soc Sci. 2012;2(12):164–172. | |
Connor MD, Thorogood M, Casserly B, Dobson C, Warlow CP; SASPI Project Team. Prevalence of stroke survivors in rural South Africa: results from the Southern Africa Stroke Prevention Initiative (SASPI) Agincourt field site. Stroke. 2004;35:627–632. | |
Venketasubramanian N, Tan LC, Sahadevan S, Chin JJ, et al. Prevalence of stroke among Chinese, Malay and Indian Singaporeans: a community-based tri-racial cross-sectional survey. Stroke. 2005;36:551–556. | |
Owolabi MO, Ugoya S, Platz T. Racial disparity in stroke risk factors: the Berlin-Ibadan experience: a retrospective study. Acta Neurol Scand. 2009;119:81–87. | |
Ogun SA, Ojini FI, Ogungbo B, Kolapo KO, Danesi M. stroke in South West Nigeria: a 10-year review. Stroke. 2005;36(6):112–122. | |
Onwuekwe IO, Ezeala-Adikaibe BA, Ohaegbulam SC, Chikani MC, Amuta J, Uloh HN. Stroke mimics – a study of CT images in Nigerian African stroke patients. J Neurol Sci Turk. 2008;25(3):148–154. | |
Amu E, Ogunrin O, Danesi M. Reappraisal of risk factors for stroke in Nigerian Africans – a prospective case-control study. Afr J Neurol Sci. 2005;2:20–27. |
Supplementary material
 | Figure S1 Modified World Health Organization questionnaire for detecting neurological diseases. |
 | Figure S2 Stroke-specific questionnaire used in Stage II of the study. |
 | Figure S3 Risk factors for stroke questionnaire used in Stage II of the study. |
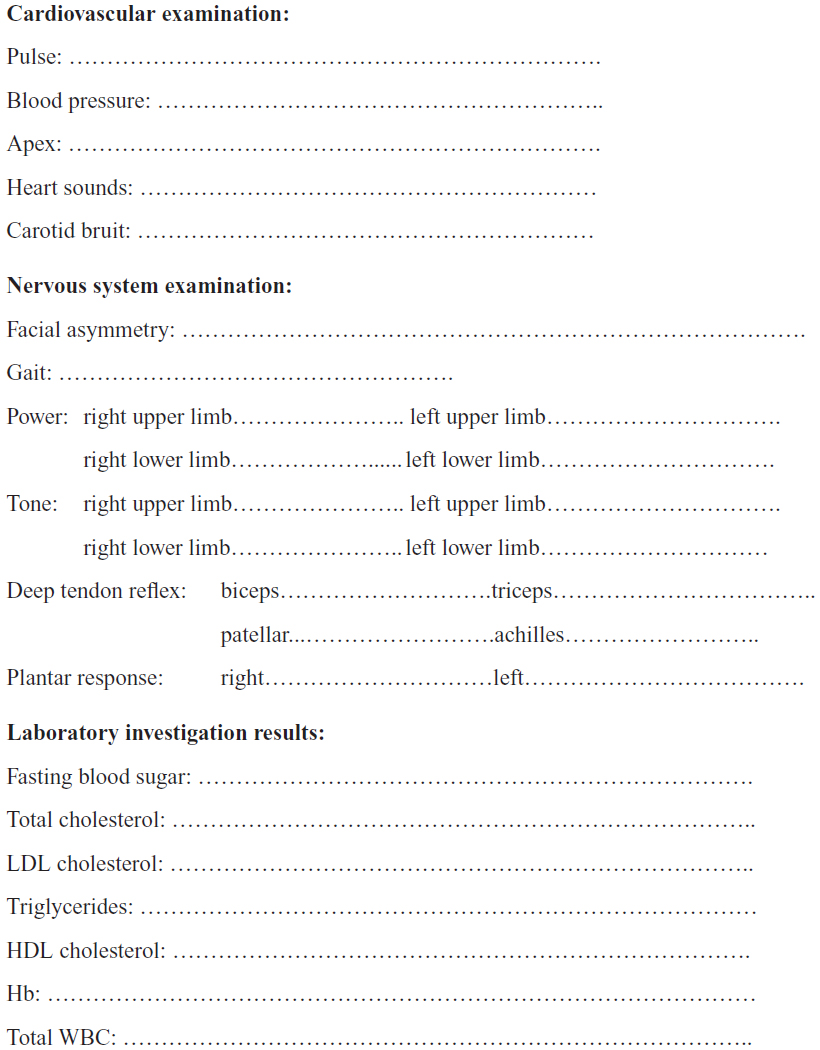 | Figure S4 Clinical examination findings (Proforma). |
 © 2014 The Author(s). This work is published and licensed by Dove Medical Press Limited. The full terms of this license are available at https://www.dovepress.com/terms.php and incorporate the Creative Commons Attribution - Non Commercial (unported, v3.0) License.
By accessing the work you hereby accept the Terms. Non-commercial uses of the work are permitted without any further permission from Dove Medical Press Limited, provided the work is properly attributed. For permission for commercial use of this work, please see paragraphs 4.2 and 5 of our Terms.
© 2014 The Author(s). This work is published and licensed by Dove Medical Press Limited. The full terms of this license are available at https://www.dovepress.com/terms.php and incorporate the Creative Commons Attribution - Non Commercial (unported, v3.0) License.
By accessing the work you hereby accept the Terms. Non-commercial uses of the work are permitted without any further permission from Dove Medical Press Limited, provided the work is properly attributed. For permission for commercial use of this work, please see paragraphs 4.2 and 5 of our Terms.