")
Back to Journals » Infection and Drug Resistance » Volume 13
Epidemic Trends of Tuberculosis in China from 1990 to 2017: Evidence from the Global Burden of Disease Study
Authors Ding C, Wang S, Shangguan Y, Feng X, Guo W, Shi P, Ji Z, Xu K
Received 13 February 2020
Accepted for publication 15 May 2020
Published 9 June 2020 Volume 2020:13 Pages 1663—1672
DOI https://doi.org/10.2147/IDR.S249698
Checked for plagiarism Yes
Review by Single anonymous peer review
Peer reviewer comments 2
Editor who approved publication: Dr Joachim Wink
Cheng Ding, Shuting Wang, Yanwan Shangguan, Xuewen Feng, Wanru Guo, Pei Shi, Zhongkang Ji, Kaijin Xu
State Key Laboratory for Diagnosis and Treatment of Infectious Diseases, National Clinical Research Center for Infectious Diseases, Collaborative Innovation Center for Diagnosis and Treatment of Infectious Diseases, The First Affiliated Hospital, College of Medicine, Zhejiang University, Hangzhou 310003, Zhejiang, People’s Republic of China
Correspondence: Kaijin Xu Email [email protected]
Purpose: Tuberculosis remains a major public health problem globally, especially in undeveloped countries. This study aimed to evaluate and review the long-term epidemic trends of tuberculosis in China.
Methods: Data were extracted from the Global Health Data Exchange. Metrics (prevalence, incidence and mortality) and Joinpoint regression were used to identify the epidemic trends.
Results: From 1990 to 2017, decreasing trends in prevalence (average annual percent change, AAPC: − 0.5%, 95% CI: − 0.6% to − 0.5%), incidence (− 3.2%, 95% CI: − 3.5% to − 2.9%), and mortality (− 5.7%, 95% CI: − 6.2% to − 5.3%) of tuberculosis were observed. The incidence and mortality of multidrug-resistant tuberculosis (MDR-TB) decreased with AAPC of − 2.3% (− 3.1% to − 1.4%) and − 4.9% (− 5.4% to − 4.5%), respectively, while the prevalence increased with an AAPC of 1.2% (0.3% to 2.0%). The burden of extensively drug-resistant tuberculosis (XDR-TB) increased with an AAPC of 12.5% (11.9% to 13.2%) in prevalence, 7.6% (6.5% to 8.7%) in incidence, and 4.5% (3.6% to 5.4%) in mortality. The disease burden of tuberculosis increased with age and peaked among those aged over 70.
Conclusion: The epidemic of tuberculosis decreased in China, while the disease burden was still challenging to control. MDR-TB and XDR-TB should be emphasized along with the epidemic. It will certainly be a difficult task to achieve the post-2015 global targets by 2025 and 2035.
Keywords: tuberculosis, drug-resistant, epidemic, China
Introduction
Tuberculosis (TB) is mainly caused by acid-fast bacillus bacteria (Mycobacterium tuberculosis, MTB), and human beings are the only reservoir. TB is spread from person to person through the air and occurs all around the world.1 As of 2018, the WHO estimated that 10.0 (range: 9.0–11.1) million people fell ill with TB, and the reported number has been relatively stable in recent years.2 Worldwide, TB caused 1.5 (range: 1.4–1.6) million deaths in 2018,1,2 and 1.6 (range: 1.5–1.7) million deaths in 2017.3 Although TB is curable, it is still listed as one of the top ten causes of death, and the “end” of TB remains a distant reality.2
The severity of TB epidemics varies widely. China was one of 30 high-TB-burden countries, accounting for 9% of the cases and ranked behind India (27%) in 2018. Furthermore, India (27%), China (14%), and the Russian Federation (9%) accounted for almost half of the world’s cases of multidrug-resistant TB (MDR-TB) or rifampicin-resistant TB (RR-TB). Approximately 6.2–10% of MDR-TB cases were estimated to have been extensively drug-resistant TB (XDR-TB) or beyond XDR-TB (completely drug resistant).2–4 The phenomenon of MDR-TB emerged as a clinical entity in the early 1990s after a couple of decades of widespread use of rifampin. XDR-TB is more expensive to treat and outcomes are poor, particularly among patients who are human immunodeficiency virus (HIV) positive.5
In China, the prevalence of smear-positive TB and TB-related mortality fell by 63% and 80% between 1990 and 2010, respectively – one of the most rapid declines in TB morbidity and mortality.6 These improvements were largely attributed to the nationwide scale-up of a TB control program using short courses of directly observed treatments (DOTs) that were implemented by the Chinese Center for Disease Control and Prevention. Despite the progress achieved in TB control, China is still facing a serious epidemic of TB and drug-resistant TB (including MDR-TB and XDR-TB). A national survey indicated that there were approximately 110,000 new MDR-TB cases (5.7% of the total TB diagnoses), while the prevalence of MDR-TB among those people who had previously been treated were 25.6% in 2007.7 The estimated median proportion of MDR among new and previously treated cases was 5.4% and 28.5%, respectively, which led to an estimated 121,600 MDR-TB cases in 2012.8 The WHO estimated that there were 866,000 new TB cases (incidence: 61 per 100,000) in 2018 in China.2,9 Additionally, 7.1% (95% CI: 5.6% to 8.7%) of the new TB cases were MDR-TB/RR-TB cases, which accounted for 21% of the previously treated cases in China.2
A world free of TB is the vision of the post-2015 global tuberculosis strategy. The key targets are a 75% reduction in deaths (compared with 2015) and a 50% reduction in incidence rate (less than 55 per 100,000 population) in 2025 and a 95% reduction in deaths and a 90% reduction in incidence rate (less than 10 per 100,000 population) in 2035.10 It is unclear whether the high-burden countries with high TB epidemics and numerous MDR-TB cases, such as China, can achieve these targets. China released the 13th five-year plan for TB control in 2017 and set the phase goal for 2020 (a continued decline in the number of new TB cases and deaths, a continued decrease in the incidence to less than 58 per 100,000, and a 20% decrease in the incidence in high-burden areas compared with the 2015 level).11 Although the WHO has published reports annually since 1997 and TB is a notifiable infectious disease in China, the trend analysis with other resources of evidence is important and required for epidemic control. This study aimed to systematically summarize the epidemic trends of TB in China, including MDR-TB and XDR-TB, over a long period from 1990 to 2017. Additionally, this study aimed to provide clues and related interventions to assist policy-makers in reducing the disease burden of TB in China.
Materials and Methods
Study Design
The Global Burden of Diseases, Injuries, and Risk Factors Study 2017 (GBD 2017) included a comprehensive assessment of the prevalence, incidence, risk factors and years lived with disability for 354 causes from 1990 to 2017 worldwide.12 Multiple and updated sources were integrated by the GBD 2017, including body of literature studies, survey data, surveillance data, inpatient admission records, outpatient visit records, and health insurance claims. The Bayesian meta-regression tool DisMod-MR 2.1 was used as the main method for estimation. Detailed information about data resources, definitions, statistical modeling, and efforts to improve the quality of data has been addressed.12–14
Data were extracted using the Global Health Data Exchange (GHDx).14 The variables of year, age, sex, and cause were included. Prevalence, incidence, and mortality were used as the primary metrics to assess the impacts of TB among the population. TB was divided into three different phenotypes, namely, drug-susceptible TB (DS-TB), MDR-TB (TB that does not respond to at least the two most powerful anti-TB drugs, isoniazid and rifampicin, except for extensive drug resistance), and XDR-TB (a serious form of MDR-TB with additional resistance to the most effective second-line anti-TB drugs).1 The population ages were divided into four groups (0–14 years, 15–49 years, 50–69 years, and 70+ years).
Rates of prevalence, incidence and mortality for the different types of TB were calculated based on the estimated values (cases and population) by the GBD 2017. The age-standardized rates (ARs) for each metric were also adjusted by the world standardized population.15 The mortality incidence (MI) ratio was calculated and used to indicate the severity of disease and the efficacies of clinical treatment and management. Ethical approval was not obtained since the data included in this study were de-identified and publicly available.
Statistical Analysis
The average annual percent change (AAPC), annual percent change (APC) and their 95% confidence intervals (95% CIs) were used to evaluate the trends of disease burden, which were calculated by the Joinpoint Regression Program (Version 4.7.0.0. February 2019). Origin 2017 software (Microcal Software Inc., Northampton, MA, USA) was used to draw the figures. The significance level of the hypothesis tests was set at 0.05.
Results
The number of TB cases in China were 2,236,793 (prevalence: 186.87/100,000, AR: 213.26/100,000) in 1990 and 2,271,695 (prevalence: 160.83/100,000, AR: 136.93/100,000) in 2017. From 1990 to 2017, the number of new cases decreased from 1,697,658 (incidence: 141.83/100,000, AR: 147.62/100,000) to 830,969 (incidence: 58.83/100,000, AR: 54.14/100,000). The number of TB deaths decreased from 165,385 (13.82/100,000, AR: 17.15/100,000) to 39,279 (2.78/100,000, AR: 2.17/100,000) (Figure 1). There were reverse time points between crude and ARs in all metrics among the four types of TB, and these points occurred in approximately 2002 for prevalence, 2001 for incidence, and 2004 for mortality. Before these points, the crude rates were higher than the ARs, and the situations were all reversed after these reserve time points (Figure 1).
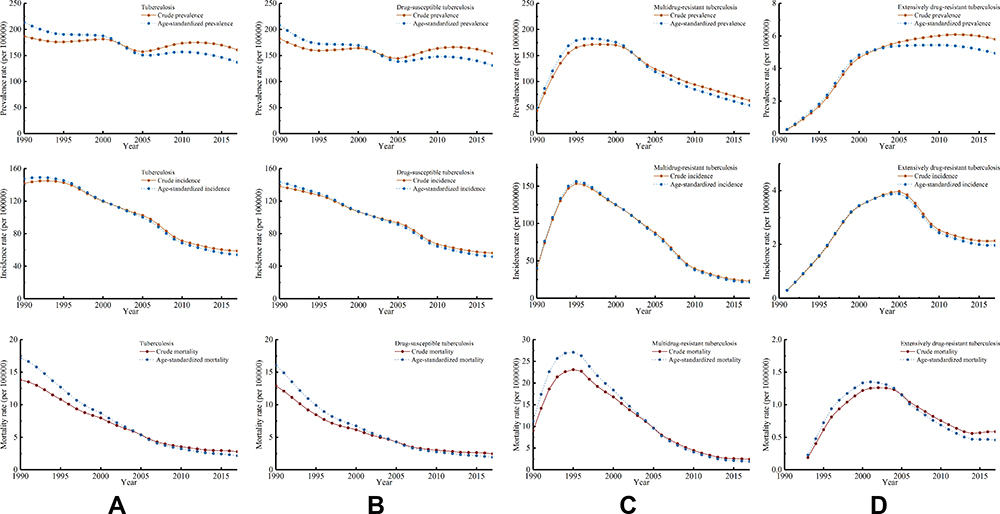 |
Figure 1 Trends of prevalence, incidence, and mortality by different types of tuberculosis in China, 1990–2017. (A) Tuberculosis; (B) drug-susceptible tuberculosis; (C) extensively drug-resistant; (D) multidrug-resistant tuberculosis. |
Decreasing trends in prevalence (AAPC: −0.5%, 95% CI: −0.6% to −0.5%), incidence (AAPC: −3.2%, 95% CI: −3.5% to −2.9%), and mortality (AAPC: −5.7%, 95% CI: −6.2% to −5.3%) of TB were observed. The largest decline in the prevalence rate was between 2000 and 2005 (APC: −3.1%, 95% CI: −3.3% to −2.9%), the largest decline in the incidence rate was between 2006 and 2010 (APC: −7.9%, 95% CI: −8.8% to −6.9%), and the largest decline in the mortality rate was between 2004 and 2007 (APC: −11.1%, 95% CI: −14.1% to −7.9%) (Table 1).
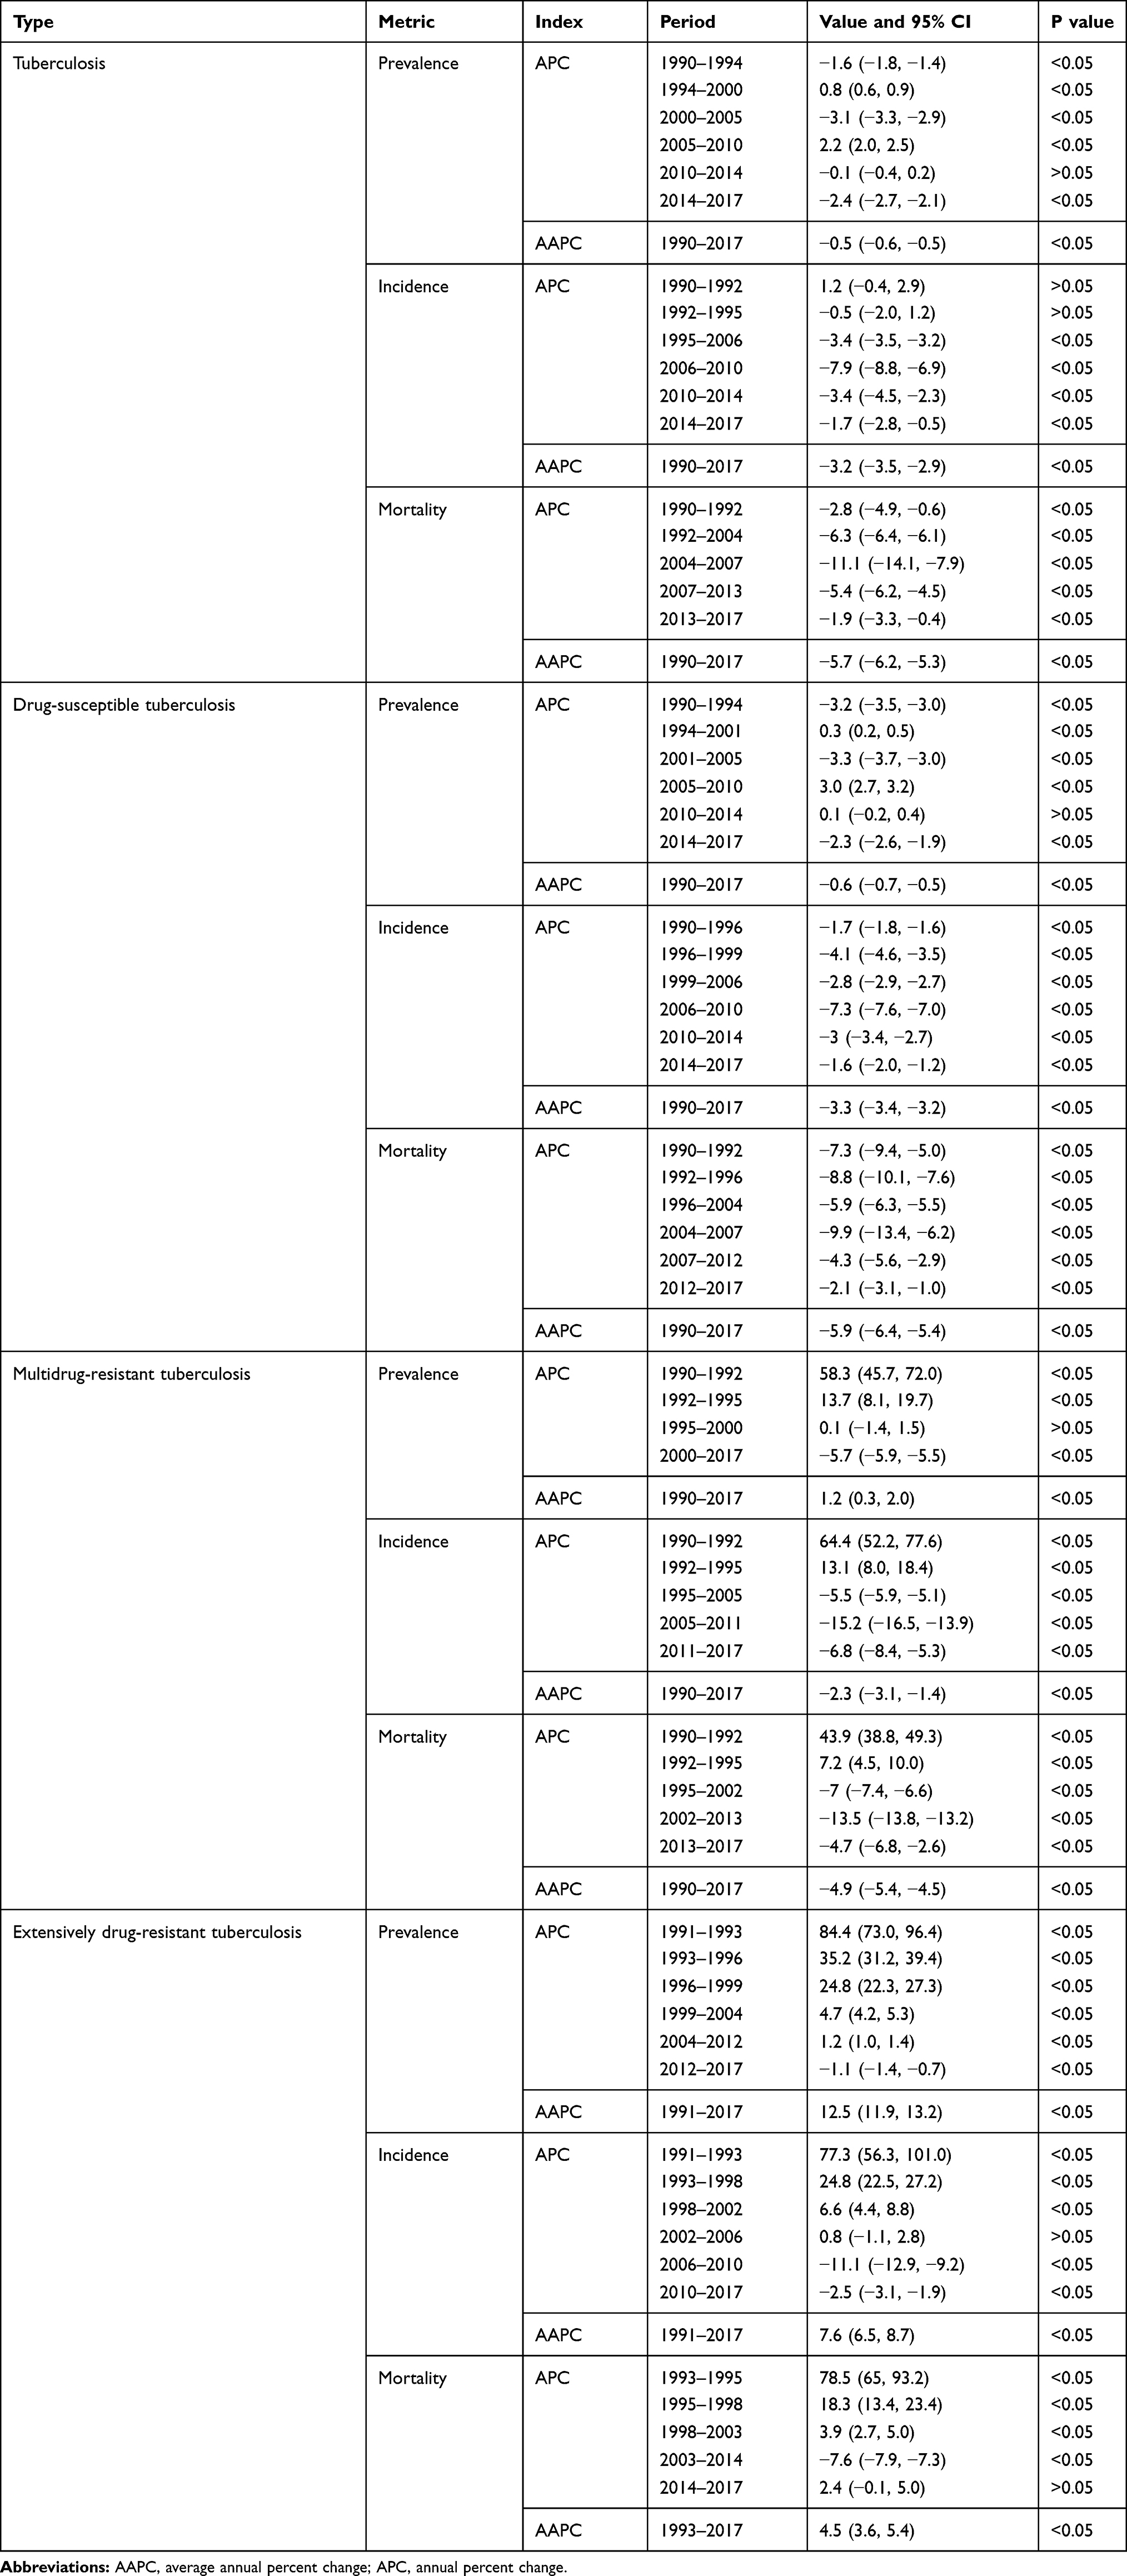 |
Table 1 The Epidemic Trends of Tuberculosis in China, 1990–2017 |
For DS-TB, the prevalence (AAPC: −0.6%, 95% CI: −0.7% to −0.5%), incidence (AAPC: −3.3%, 95% CI: −3.4% to −3.2%), and mortality (AAPC: −5.9%, 95% CI: −6.4% to −5.4%) decreased. The largest decline in the rates of these metrics occurred in the first decade of the 21st century.
For MDR-TB, the incidence and mortality decreased, with AAPCs of −2.3% (95% CI: −3.1% to −1.4%) and −4.9% (95% CI: −5.4% to −4.5%), respectively. The rates of incidence and mortality were increased before 1995 and were reduced from then on. Despite the significant reduction in the prevalence of MDR-TB from 2000 to 2017, the prevalence of MDR-TB increased with an AAPC of 1.2% (95% CI: 0.3% to 2.0%).
The metrics of XDR-TB decreased recently, with APCs of −1.1% (95% CI: −1.4% to −0.7%, 2012–2017) in prevalence, −11.1% (95% CI: −12.9% to −9.2%, 2006–2010) and −2.5% (95% CI: −3.1% to −9.2%, 2010–2017) in incidence, and −7.6% (95% CI: −7.9% to-7.3%, 2003–2014) in mortality (Table 1). The burden of XDR-TB increased from 1990 to 2017, with AAPCs of 12.5% (95% CI: 11.9% to 13.2%) in prevalence, 7.6% (95% CI: 6.5% to 8.7%) in incidence, and 4.5% (95% CI: 3.6% to 5.4%) in mortality [Table 1 and Figure 1D].
The highest disease burden of TB occurred among the population aged over 70 years, with the highest rates of all metrics among all TB groups. The highest prevalence (850.15 per 100,000), incidence (272.26 per 100,000), and mortality (115.74 per 100,000) of TB occurred in 1990. For MDR-TB, the highest prevalence rate (709.58 per 1,000,000) occurred in 1999, the highest incidence rate (251.51 per 1,000,000) occurred in 1995, and the highest mortality rate (175.89 per 1,000,000) occurred in 1995. For XDR-TB, the highest prevalence rate (24.23 per 1,000,000) occurred in 2008, the highest incidence rate (8.33 per 1,000,000) occurred in 2005, and the highest mortality rate (10.11 per 1,000,000) occurred in 2003. The heat maps also showed that the values of these metrics in all types of TB increased by age (Figure 2). The prevalence and incidence of TB and DS-TB decreased among all age groups with negative AAPCs. Increasing trends occurred in the prevalence of MDR-TB, except in the population aged 50–69 years. Metrics of XDR-TB increased in almost all age groups except mortality in the population aged 0–14 years, and the increasing trends were most obvious in the metric of prevalence [Figure 3D].
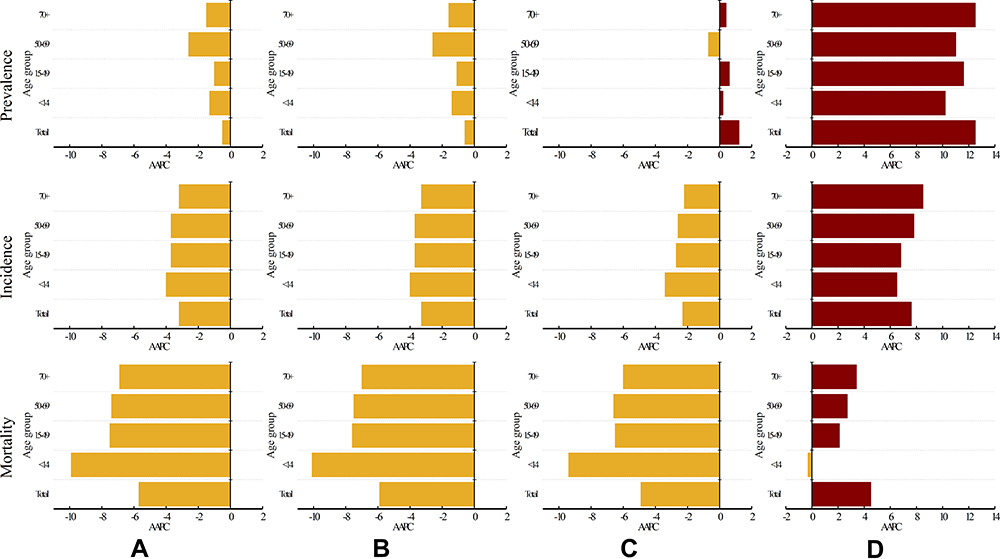 |
Figure 2 Average annual percent changes of prevalence, incidence, and mortality among different age groups by different types of tuberculosis in China. (A) Tuberculosis; (B) drug-susceptible tuberculosis; (C) extensively drug-resistant; (D) multidrug-resistant tuberculosis. |
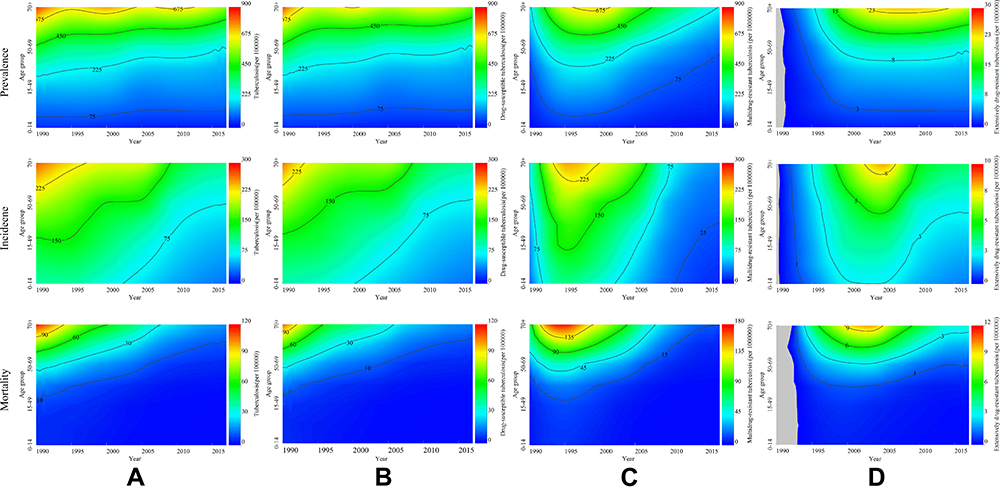 |
Figure 3 Heat maps of prevalence, incidence, and mortality among different age groups by different types of tuberculosis in China, 1990–2017. (A) Tuberculosis; (B) drug-susceptible tuberculosis; (C) extensively drug-resistant; (D) multidrug-resistant tuberculosis. |
The rates of all metrics were higher among males than among females in all types of TB between 1990 and 2017 in China, which indicated that the males suffered higher disease burden than females. The male to female ratio of TB ranged from 1.34 (1994 and 1995) to 1.80 (2002) for prevalence, from 1.15 (1992) to 1.61 (2017) for incidence, and from 1.49 (1992) to 2.38 (2010 and 2011) for mortality. The trends in the male to female ratio among the different metrics were nearly the same, while the male to female ratios in incidence and mortality increased over time (Supplementary Figure 1 and Supplementary Table 1).
The MI ratios decreased in all types of TB. The average MI ratios were 0.31 for XDR-TB, 0.14 for MDR-TB, and 0.06 for DS-TB between 1990 and 2017. The XDR-TB population had the highest MI ratios among the four types of TB, followed by the MDR-TB population; the DS-TB population had the lowest ratios. The trends in the MI ratios decreased from 1990 to 2017 with negative β values (P<0.05) (Figure 4 and Supplementary Table 2).
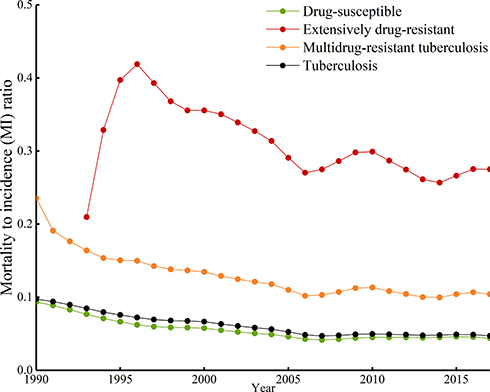 |
Figure 4 Trends of mortality to incidence ratios by different types of tuberculosis in China, 1990–2017. |
Discussion
TB is the leading cause of death from a single infectious agent, and China has been one of the major contributors to the TB disease burden in the world, with 866,000 new TB cases and 39,400 deaths in 2018.2 Coupled with these statistics, the incidence was as high as 58.83 per 100,000 and the mortality was 2.78 per 100,000 in 2017 in this study. From 1990 to 2017, the disease burden of TB decreased substantially, with AAPCs of −0.5% for prevalence, −3.2% for incidence, and −5.7% for mortality; however, the Chinese population still faces a great threat of TB. These findings are consistent with the results from several national epidemiological sampling surveys.16 According to existing evidence of trends and current situations of TB control, this study found that there will be only a 24.92% reduction (45.35 per 100,000 in 2025 vs 60.41 per 100,000 in 2015) and a 45.77% reduction (32.76 per 100,000 in 2025 vs 60.41 per 100,000 in 2015) in the incidence rates in China (Supplementary Table 3). The deaths caused by TB will decrease from 41,435 in 2015 to 24,561 (40.72% reduction) in 2025 and to 13,657 (67.04% reduction) in 2035. It seems there is an obvious gap between the predictions and the global goals of ending TB adopted by the World Health Assembly in 2014 (75% reduction in deaths, 50% reduction in incidence by 2025; 95% reduction in deaths, 90% reduction in incidence by 2035).10 Different simulation models also showed that, without other enhanced measures, it would be difficult to meet the goal of reducing incidence in 2035 or ending TB.17,18 The WHO also estimated that there needs to be a 4–5% acceleration in the annual decline to reach the 2020 milestones.1,2
Males suffered a higher disease burden than females. Among all incident TB cases in 2018, there were 5.7 million males and 3.2 million females.2 This study showed that, in China, the male to female ratio of incidence was as high as 1.61 in 2017. More noteworthy, the new TB cases and prevalence cases were concentrated among the population aged more than 15 years old, comprising the main labor resources of the countries. This study illustrated that the population aged more than 50 years old suffered the highest disease burden, with higher rates of prevalence, incidence and mortality. A meta-analysis revealed that the people aged 35–69 suffered a greater disease burden, and the burden increased with age.19 The differences between the crude rates and the ARs in the evaluated metrics increased since the start of the 21st century, indicating that aging intensified in recent years in China. The percentage of individuals over age 50 increased from 16.1% in 1990 to 31.3% in 2017 in this study compared to the 21.9% of the world standardized population. Considering the situation of aging and the large number of latent TB infections (LTBIs) existing (13–20% among the whole population in China20), compounded with the fact that this situation is not easy to change immediately, TB control in China may suffer challenges in the near decades.
Drug-resistant TB continues to be a public health crisis worldwide. The prevalence of MDR-TB has increased in the past decade and will continue to increase in areas within resource-poor settings such as India and China.5 Worldwide in 2018, the number of new MDR-TB/RR-TB was 484,000, with 66,000 cases in China.2 In this study, the prevalence of MDR-TB increased from 1990 to 2017, with an AAPC of 1.2%. All the rates of prevalence, incidence, and mortality for XDR-TB increased with positive values of AAPC. Considering the 75% proportion of MDR-TB cases among the MDR-TB/RR-TB cases in China,3 the estimated numbers were different, but both indicated a heavy disease burden of MDR-TB. A meta-analysis including 258 records suggested that the mean rate of MDR-TB in the total TB cases was 11% (95% CI: 10% to12%) in China during 1996–2014.21
The cure rate of MDR-TB and XDR-TB is usually lower (40–80%) than that (>90%) of DS-TB under the current effective treatment regimens. Furthermore, the treatment course for MDR-TB and XDR-TB is substantially more costly and laborious than that for DS-TB, with higher rates of treatment failure, mortality and potentially serious adverse effects, and a longer course of treatment.4,22,23 A previous study found that MDR-TB and XDR-TB accounted for less than 3% of the total TB caseload but consumed approximately 35% of the TB budget in South Africa, among which a substantial proportion was attributable to XDR-TB.24
The main causes of drug-resistant TB are weak health systems and policies, the amplification of resistance patterns through incorrect treatment and management, and transmission in communities or facilities.22,23,25 Although challenging, TB cure is often possible with early identification of resistance and the use of a properly designed regimen; some countries have reversed rising epidemics of MDR-TB.22 Decreasing trends in the MI ratios also indicated the declining severity of disease. Facing the increase in drug-resistant TB, China needs to provide sputum smear and culture tests at the county level, screen for positive-TB patients among high-risk groups, transfer the suspected MDR-TB cases to designated medical institutions, and promote multidrug rapid detection technology.11 Preventive strategies must also be updated (such as prophylaxis in drug-resistant TB contacts) to address the spread of primary infection with drug-resistant MTB strains, acquired resistance and adverse side effects to develop new effective drugs and repurposed regimens.21 For example, the 9–11 month injection-based “Bangladesh” regimen was recently shown to be noninferior to longer regimens and promising interim results of a novel 6 month 3-drug regimen (bedaquiline, pretomanid, and linezolid) have been reported.26
Globally, fifty-eight million lives were saved through TB control, and deaths decreased by 38% between 2000 and 2018, despite large and persistent gaps in detection and treatment that amounted to 3 million TB cases that were still not well treated.2 To fight the threat of disease, much greater control efforts are needed. The WHO had set a 2035 target (95% reduction in deaths and a 90% decline in incidence).1 China also provided actions to eliminate TB, such as improving the service and prevention system, developing a screening strategy, strictly executing the course of diagnosis, treatment and management, supplying the medical insurance and care even in the outpatient clinics, ensuring the supply of antituberculosis drugs, and emphasizing the high-risk populations.
This study has several limitations. First, classification of TB is common (MDR-TB and XDR-B), and there are many types in practice, such as new and relapsed TB, single-drug-resistant TB, and incurable TB. Second, LTBIs were not included or reviewed, which would be one of the major influencing factors of TB control since approximately one-quarter of the world’s population was latently infected and the rate of LTBIs was also high in China. Third, factors such as geographic residence (urban and rural, west and east), economic levels, and comorbidities such as HIV and diabetes were also not included. These factors would influence the epidemic state and control of TB and should be addressed in future studies.
Conclusion
This study included a long period of TB data from the GBD study and founded that the epidemic state of TB decreased substantially from 1990 to 2017 in China. However, the burden of MDR-TB and XDR-TB increased and became a major challenge. Given the current situation, substantial progress is still needed to accomplish the goal of ending TB by 2035. In addition, given the aging population and the large number of LTBIs, China may suffer a great threat of TB for decades. More efforts to improve the service system, screening strategy, surveillance, diagnosis, treatment and management should be addressed, especially for MDR-TB and XDR-TB.
Acknowledgments
This work was supported by the Mega-Project of National Science and Technology of China (2017ZX10105001, 2018ZX10715014, 2014ZX10004008, 2013ZX10004904, 2013ZX10004901), the key joint project for data center of the National Natural Science Foundation of China and Guangdong Provincial Government (U1611264), and the National Natural Science Foundation of China (81672005, 81001271). The funders had no role in study design, data collection, data analysis, or writing of the paper.
Disclosure
The authors report no conflicts of interest in this work.
References
1. WHO. Tuberculosis. WHO Press; 2019 [updated October 17, 2019]. Available from: https://www.who.int/en/news-room/fact-sheets/detail/tuberculosis.
2. WHO. Global tuberculosis report 2019. WHO Press; 2019 [updated October 17, 2019]. Available from: https://www.who.int/tb/publications/global_report/en/.
3. WHO. Global tuberculosis report 2018. WHO Press; 2018 [updated September 18, 2018]. Available from: https://www.who.int/tb/publications/global_report/en/.
4. Dheda K, Gumbo T, Maartens G, et al. The epidemiology, pathogenesis, transmission, diagnosis, and management of multidrug-resistant, extensively drug-resistant, and incurable tuberculosis. Lancet Respir Med. 2017;5(4):291–360. doi:10.1016/S2213-2600(17)30079-6
5. Dheda K, Warren RM, Zumla A, Grobusch MP. Extensively drug-resistant tuberculosis: epidemiology and management challenges. Infect Dis Clin North Am. 2010;24(3):705–725. doi:10.1016/j.idc.2010.05.001
6. Wang L, Zhang H, Ruan Y, et al. Tuberculosis prevalence in China, 1990–2010; a longitudinal analysis of national survey data. Lancet (London, England). 2014;383(9934):2057–2064. doi:10.1016/S0140-6736(13)62639-2
7. Zhao Y, Xu S, Wang L, et al. National survey of drug-resistant tuberculosis in China. N Engl J Med. 2012;366(23):2161–2170. doi:10.1056/NEJMoa1108789
8. Ding P, Li X, Jia Z, Lu Z. Multidrug-resistant tuberculosis (MDR-TB) disease burden in China: a systematic review and spatio-temporal analysis. BMC Infect Dis. 2017;17(1):57. doi:10.1186/s12879-016-2151-5
9. WHO. Global health observatory data repository; 2019 [updated September 2, 2019]. Available from: http://apps.who.int/gho/data/view.main.57040ALL?lang=en.
10. WHO. The End TB Strategy-Global strategy and targets for tuberculosis prevention, care and control after 2015. WHO Press; 2018 [updated September 18, 2018]. Available from: https://www.who.int/tb/strategy/End_TB_Strategy.pdf.
11. General Office of the People’s Republic of China. 13th Five-Year National Tuberculosis Control Plan; 2017. Available from: http://www.gov.cn/zhengce/content/2017-02/16/content_5168491.htm#.
12. GBD 2017 Disease and Injury Incidence and Prevalence Collaborators. Global, regional, and national incidence, prevalence, and years lived with disability for 354 diseases and injuries for 195 countries and territories, 1990–2017: a systematic analysis for the Global Burden of Disease Study 2017. Lancet (London, England). 2018;392(10159):1789–1858. doi:10.1016/S0140-6736(18)32279-7
13. Murray CJ, Ezzati M, Flaxman AD, et al. GBD 2010: design, definitions, and metrics. Lancet (London, England). 2012;380(9859):2063–2066. doi:10.1016/S0140-6736(12)61899-6
14. Global Burden of Disease Collaborative Network. Global Burden of Disease Study 2017 (GBD 2017) Results. Institute for Health Metrics and Evaluation (IHME); 2018. Available from: http://ghdx.healthdata.org/gbd-results-tool.
15. Surveillance Epidemiology and End Results (SEER) Program. World (WHO 2000–2025) Standard; 2013. Available from: https://seer.cancer.gov/stdpopulations/world.who.html.
16. Wang Y.. Technical Guidance Group of the Fifth National TB Epidemiological Survey, The Office of the Fifth National TB Epidemiological Survey. The fifth national tuberculosis epidemiological survey in 2010. Chin J Antituber. 2012;34(8):485–508.
17. Zhao F, Du X, Li T, et al. Epidemic trend and prediction analysis of tuberculosis based on WHO public database in China. Clin Med J. 2018;16(4):1–3.
18. Lin HH, Wang L, Zhang H, Ruan Y, Chin DP, Dye C. Tuberculosis control in China: use of modelling to develop targets and policies. Bull World Health Organ. 2015;93(11):790–798. doi:10.2471/BLT.15.154492
19. Zeng Y, Yang X, Zhou H, Pu L. Disease Burden of tuberculosis in the Chinese population: a systematic review. Chinese J Evid Based Med. 2018;6:570–579.
20. Gao L, Lu W, Bai L, et al. Latent tuberculosis infection in rural China: baseline results of a population-based, multicentre, prospective cohort study. Lancet Infect Dis. 2015;15(3):310–319. doi:10.1016/S1473-3099(14)71085-0
21. Zhang J, Gou H, Hu X, et al. Status of drug-resistant tuberculosis in China: a systematic review and meta-analysis. Am J Infect Control. 2016;44(6):671–676. doi:10.1016/j.ajic.2015.12.042
22. Gandhi NR, Nunn P, Dheda K, et al. Multidrug-resistant and extensively drug-resistant tuberculosis: a threat to global control of tuberculosis. Lancet (London, England). 2010;375(9728):1830–1843. doi:10.1016/S0140-6736(10)60410-2
23. Dheda K, Gumbo T, Gandhi NR, et al. Global control of tuberculosis: from extensively drug-resistant to untreatable tuberculosis. Lancet Respir Med. 2014;2(4):321–338. doi:10.1016/S2213-2600(14)70031-1
24. Pooran A, Pieterson E, Davids M, Theron G, Dheda K. What is the cost of diagnosis and management of drug resistant tuberculosis in South Africa? PLoS One. 2013;8(1):e54587. doi:10.1371/journal.pone.0054587
25. Seung KJ, Keshavjee S, Rich ML. Multidrug-resistant tuberculosis and extensively drug-resistant tuberculosis. Cold Spring Harb Perspect Med. 2015;5(9):a017863. doi:10.1101/cshperspect.a017863
26. Dheda K, Gumbo T, Maartens G, et al. The Lancet Respiratory Medicine Commission: 2019 update: epidemiology, pathogenesis, transmission, diagnosis, and management of multidrug-resistant and incurable tuberculosis. Lancet Respir Med. 2019;7(9):820–826. doi:10.1016/S2213-2600(19)30263-2
 © 2020 The Author(s). This work is published and licensed by Dove Medical Press Limited. The full terms of this license are available at https://www.dovepress.com/terms.php and incorporate the Creative Commons Attribution - Non Commercial (unported, v3.0) License.
By accessing the work you hereby accept the Terms. Non-commercial uses of the work are permitted without any further permission from Dove Medical Press Limited, provided the work is properly attributed. For permission for commercial use of this work, please see paragraphs 4.2 and 5 of our Terms.
© 2020 The Author(s). This work is published and licensed by Dove Medical Press Limited. The full terms of this license are available at https://www.dovepress.com/terms.php and incorporate the Creative Commons Attribution - Non Commercial (unported, v3.0) License.
By accessing the work you hereby accept the Terms. Non-commercial uses of the work are permitted without any further permission from Dove Medical Press Limited, provided the work is properly attributed. For permission for commercial use of this work, please see paragraphs 4.2 and 5 of our Terms.