")
Back to Journals » Nature and Science of Sleep » Volume 13
Enlarged Perivascular Space and Its Correlation with Polysomnography Indicators of Obstructive Sleep Apnea
Authors Jia Y , Liu C, Li H, Li X, Wu J, Zhao Y, Xu M, Yu H, Guan Z, Sun S, Zhang C, Duan Z
Received 7 February 2021
Accepted for publication 27 May 2021
Published 25 June 2021 Volume 2021:13 Pages 863—872
DOI https://doi.org/10.2147/NSS.S305465
Checked for plagiarism Yes
Review by Single anonymous peer review
Peer reviewer comments 4
Editor who approved publication: Prof. Dr. Christopher L Drake
Yanlu Jia, Chunling Liu, Hui Li, Xiaonan Li, Jun Wu, Yimin Zhao, Mengya Xu, Haitao Yu, Zhitong Guan, Shuning Sun, Chao Zhang, Zhiyi Duan
Department of Neurology, The Second Affiliated Hospital of Zhengzhou University, Zhengzhou City, Henan Province, 450000, People’s Republic of China
Correspondence: Chunling Liu
Department of Neurology, The Second Affiliated Hospital of Zhengzhou University, Zhengzhou City, Henan Province, 450000, People’s Republic of China
Email [email protected]
Purpose: There is increasing evidence of a causal interaction between obstructive sleep apnea (OSA) and white matter hyperintensity (WMH). WMH and enlarged perivascular space (EPVS) are the neuroimaging markers for cerebral small vessel disease (CSVD). Thus, this study aimed to determine whether a contextual relationship existed between OSA and EPVS.
Participants and Methods: In this study, 107 participants underwent 1-night polysomnography, brain magnetic resonance imaging (MRI) and health screening examinations and were classified as 63 OSA patients (mild, moderate, and severe groups), and 44 healthy controls. We assessed the sleep characteristics in OSA group, quantified the total EPVS from MRI and related them to the measures of polysomnography-obtained sleep parameters.
Results: Polysomnography revealed that 63 OSA patients had sleep architecture alteration. A higher proportion of N2 phase sleep (N2%), lower percentage of N3 sleep (N3%) and REM sleep (REM%), as well as increased arousal index (AI), oxygen desaturation index (ODI) and decreased lowest arterial oxygen saturation (LSaO2) were detected. The results also indicated a higher prevalence and a larger number of EPVS, and a lower Mini Mental State Scale (MMSE) scale score in OSA group. LSaO2, N3% and REM% were negatively correlated with the total EPVS, whereas ODI, AI and N2% were positively correlated with the total EPVS.
Conclusion: The findings suggested that OSA patients had sleep disturbances with a higher incidence and more severe EPVS. Furthermore, the EPVS in OSA might be secondary to sleep disturbances, intermittent hypoxemia and the respiratory event-related hemodynamic changes. Thus, our findings highlighted that increased risk for EPVS in OSA is a potential contributor to increased stroke risk in OSA.
Keywords: obstructive sleep apnea, polysomnography, sleep, mini mental state scale, perivascular space
Introduction
Perivascular space (PVS) is an interstitial fluid-filled channel surrounding smaller arteries and veins in the brain, which plays a role in the proto-lymphatic system, exerts a certain effect on interstitial elimination, and is called the Glymphatic system.1 The glymphatic system that participates in cerebrospinal fluid (CSF) will re-circulate via the brain, interchange with interstitial fluid (ISF) and remove the protein waste from the brain, including Amyloid-β, tau, and α-synuclein.2 Glymphatic clearance is temporally and cyclically regulated; in this regard, the fluid transport is enabled by sleep and suppressed during wakefulness, thereby modulating the balance between protein clearance and aggregation.3 A study indicates that the sleep efficiency is negatively correlated with enlarged PVS (EPVS).4 However, the precise mechanism and frequency of EPVS is still a source of controversy. EPVS has been previously suggested to be associated with normal aging and pathological conditions, such as hypertension and dementia.5 It has been previously suggested that EPVS is related to dementia and stroke.6,7 The EPVS burden is related to cognitive impairment,4,8 which is essential to identify the treatable or preventable causes.
Obstructive sleep apnoea (OSA), a sleep disorder characterized by repeated airway obstruction, leads to hypoxaemia and sleep disturbance.9 As suggested by Song and colleagues, OSA also promoted the occurrence of hypertension and endothelial dysfunction to increase the risk of cerebral small vessel disease (CSVD).10 Previous studies have highlighted that patients affected by OSA suffer from stroke and dementia.11–15 OSA has also been indicated to precede the development of cognitive dysfunction, dementia and stroke within the community-based elderly.16,17
OSA is related to abnormalities in structures, functions and metabolic brain imaging, and its characteristics are compatible with damage in neurons.18–21 Besides, white matter hyperintensity (WMH) and EPVS have become one of the recognized imaging markers for CSVD. However, the majority of prior studies have focused on OSA and WMH or silent cerebrovascular lesion cases.19,22 Some articles have investigated EPVS in OSA, but there are no consistent results regarding how OSA affects EPVS.10,23 Del et al documented that nocturnal desaturation and moderate-severe OSA were related to WMH or PVS,11,22 but some literature proposes inconsistent opinions.23 These studies report individuals who are older, so these samples cannot represent the general population. Thus, whether OSA serves as a risk factor for EPVS among the young and middle-aged populations remains unclear.
This work was carried out aiming to observe the changes in PVS in patients with OSA by brain magnetic resonance imaging (MRI), explore the possible mechanism of PVS expansion in patients with OSA, and examine the associations between these two conditions and the clinical value of early detection and treatment of OSA in evaluating the risk of stroke caused by OSA.
Participants and Methods
Study Sample
From January 2018 to December 2019, 200 physical examinees (including 108 men and 92 women) aged 18–60 years admitted for MRI and overnight polysomnography (PSG) at the sleep unit of the Second Affiliated Hospital of Zhengzhou University were enrolled for the present analysis. During the night of PSG, participants were under the supervision of a qualified technician and underwent PSG monitoring for at least 7 h. All subjects provided informed consent for retrospective analyses of their data. The study protocol was approved by the Second Affiliated Hospital of Zhengzhou University (NO. 2021132). This work was carried out according to the Declaration of Helsinki.
The inclusion criteria included the OSA group that received PSG monitoring at our hospital and conformed to the related standards:24 the apnea hypopnea index (AHI) ≥5/h; and one or more sleep-related symptoms (snoring, witnessed apneas, daytime sleepiness, and non-restorative sleep). Controls were included according to the criteria of AHI<5/h and no medical or psychiatric disease.
The exclusion criteria were as follows: those received less than 9 years of education; the diagnosis of dementia; anxious and depressive disorder; unable to cooperate with the investigation due to hearing, visual and limb activity disorders; neurological disease; psychosis; previous head injury or stroke; sleep disorders in addition to OSA; vascular risk factors (hypertension, diabetes mellitus, dyslipidemia); cardiovascular disease; use of psychoactive medications; structural brain abnormalities; and history of drinking and smoking. The flowchart of subject recruitment is shown in Figure 1.
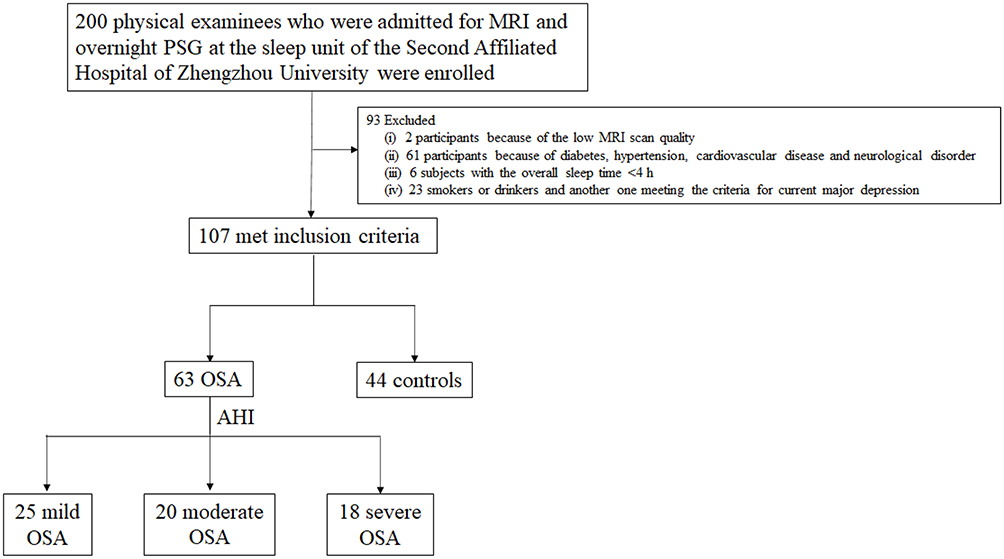 |
Figure 1 Flow chart of the study. From January 2018 to December 2019, 200 physical examinees (including 108 men and 92 women) aged 18–60 years admitted for MRI and overnight polysomnography (PSG) at the sleep unit of the Second Affiliated Hospital of Zhengzhou University were enrolled for the present analysis. During the night of PS-G, participants were under supervision of a qualified technician and underwent PSG monitoring for at least 7 h. Among the 200 subjects enrolled into the present work, two were excluded because of the low MRI scan quality, whereas 61 were ruled out from this work due to diabetes, hypertension, cardiovascular disease or neurological disorder. In the diagnosis process of PSG, six subjects with the overall sleep time <4 h were eliminated from this work. In addition, 23 smokers or drinkers and another one meeting the criteria of current major depression were also eliminated. Therefore, finally 107 subjects (including 44 (41.12%) females) were enrolled, with the age of (31.72±11.86) years. 44 (41.12%) subjects showing the AHI<5/h were enrolled as the control group; 25 (23.36%) had AHI of 5–15/h (mild); 20 (18.69%) had AHI of 15–30/h (moderate); and 18 (16.82%) had AHI >30/h (severe). |
Polysomnography (PSG)
PSG was conducted using an electrooculogram, a chin and bilateral anterior tibial surface electromyogram, an electrocardiogram, six electroencephalography channels (F3-A1, F4-A2, C3-A1, C4-A2, O1-A1, and O2-A2), nasal and oral airflow sensors, thoracic and abdominal movements sensors, and a Nonin finger probe (Nonin Medical Inc., Plymouth, MN, USA) was utilized for blood oxygen saturation.25 Monitoring was conducted with the Grael-v2 PSG amplifier (Compumedics, Abbotsford, Australia), and the montage electrodes were used for basic sleep diagnosis. Sleep and related events were analyzed according to the American Academy of Sleep Medicine (AASM) Scoring Manual rules (version 2.4).26 All sleep data were analyzed by the same physician trained in PSG technology, and related parameters were generated with the Pro Fusion PSG 4 software (Compumedics).
MRI Protocol and Assessment
The Signa HD MRI 3.0 T superconducting magnetic resonance imaging device (GE, USA) was employed for head MRI examinations in all the enrolled subjects. Typically, the specific head coil was utilized for routine axial, sagittal and coronal scans, including the T1WI, T2WI and FLAIR sequences. Of them, T1WI sequence adopted the spin echo sequence (repetition time (TR)= 400ms; echo time (TE)=8.1ms), T2WI sequence (TR=4080ms; TE=109ms), FLAIR sequence (TR=8600ms; TE=123ms). In addition, the layer thickness was 5 mm and the layer distance was 1.5 mm. During the MRI examination, the subjects were in a supine position on the examining table, kept quiet and awake, closed their eyes, and kept a quiet breathing state, with their hands being placed on both sides of the body.
EPVS Standards
The PVS standards determined by Cumurciuc et al were adopted:27 (i) based on the different image sections, PVS was round, oval or linear, with clear and smooth boundary, and the diameter was generally < 3mm; (ii) it had consistent direction with the penetrating blood vessel; (iii) PVS had the same signal as cerebrospinal fluid (CSF) on T1WI, T2WI and FLAIR sequences; (iv) there was no enhancement effect or space-occupying effect.
In this study, MRI-visible PVS was defined as EPVS, and the maximum diameter was≤3 mm. The EPVS was selected at the locations shown below: (i) frontoparietal subcortical white matter; (ii) centrum semiovale; and (iii) basal ganglia (Figure 2). In each region, we analyzed the left and the right sides, and adopted the greatest score on each side in subsequent statistical analyses. Afterwards, we determined the global score by adding all results acquired from three regions. The examined that plane and EPVS numbers were determined and recorded under the guidance of two experienced MRI neurologists who were blinded to OSA/control status. Any disagreement was discussed by the two neurologists, and the examined plane was eliminated when no consensus was reached between them.
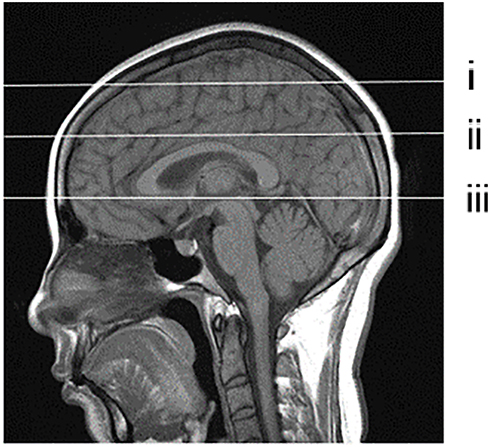 |
Figure 2 Selection of PVS observation layer shown in the sagittal view. (i) frontoparietal subcortical white matter layer; (ii) centrum semiovale layer; (iii) basal ganglia layer. |
Questionnaire Evaluation
Mini-Mental State Examination (MMSE) was carried out to assess cognitive function, and the Epworth Sleepiness Scale (ESS) was adopted to estimate the excessive daytime sleepiness.28 The scale scores were independently completed by the subjects in a quiet environment, and the subjects were asked to sit upright and lean forward slightly between 2:30 pm and 5:30 pm every day, so as to keep the brain alert.
The scale of MMSE ranged from 0 to 30 points, MMSE scores ≥27 revealed a normal cognition, those of 21–26 indicated mild cognitive impairment, those of 11–20 reported moderate cognitive impairment, and those <10 were classified as severe cognitive impairment. The ESS was an eight-item assessment of somnolence, with possible scores ranging from 0 to 24 points. A score of over 10 suggested excessive daytime sleepiness.
Statistical Methods
All data were analyzed using the SPSS 20.0 statistical software. For counting data, group comparisons were performed using Chi-square tests. Normality of the measurement data was tested with Shapiro–Wilk test. Normal distributions were described by means ± standard deviations (SD), while abnormally distributed measurement data were expressed as median (quartile) (M [Q25, Q75]). The Kruskal–Wallis test was conducted in group comparisons, and Fisher’s least significant difference (LSD) method was used to adjust for multiple comparisons. Due to the abnormal distribution of data, a nonparametric partial Spearman’s rank-order correlation was utilized to compare the correlations of objective sleep parameters with EPVS. Age, body mass index (BMI) and ESS were incorporated as covariates in the analysis because of their potential influences on both sleep and PVS. Statistical significance was set at p < 0.05.
Results
Sample Characteristics
Among the 200 subjects enrolled in the present work, two were excluded because of the low MRI scan quality, whereas 61 were ruled out from this work due to diabetes, hypertension, cardiovascular disease or neurological disorder. In the diagnosis process of PSG, six subjects with the overall sleep time <4 h were eliminated from this work. In addition, 23 smokers or drinkers and another one meeting the criteria of current major depression were also eliminated. Therefore, finally, 107 subjects (including 44 (41.12%) females) were enrolled, with the age of (31.72±11.86) years.
Table 1 shows the features of participants with mild, moderate or severe OSA and the control subjects. According to the American Academy of Sleep Medicine guidelines,26 44 (41.12%) subjects showing the AHI<5/h were enrolled as the control group; 25 (23.36%) had AHI of 5–15/h (mild); 20 (18.69%) had AHI of 15–30/h (moderate); and 18 (16.82%) had AHI >30/h (severe). Differences in clinical or demographic features were not significant among the different groups, except for BMI and ESS. Nonetheless, relative to control, the MMSE score of OSA group was lower, and that of severe OSA group was significantly lower.
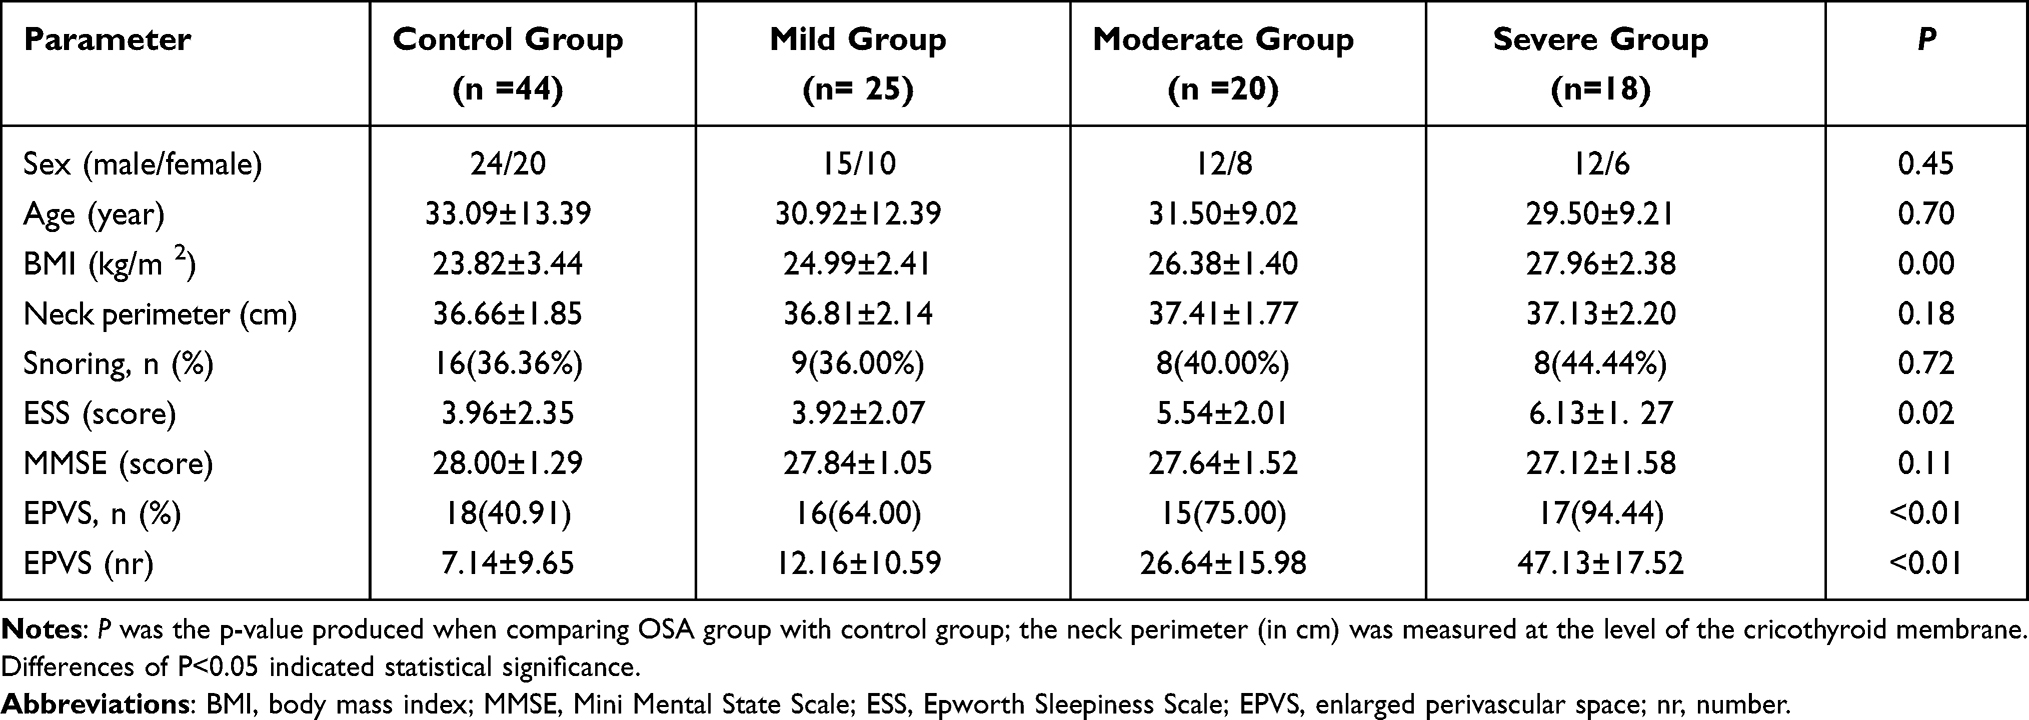 |
Table 1 Demographic Features and EPVS in Control and OSA Groups |
PSG Parameters Findings
The inter-group and intra-group PSG results were statistically analyzed (Table 2). Compared with control group, the lowest arterial oxygen saturation (LSaO2), sleep efficiency (SE), sleep latency (SL) and N3%, REM% in OSA group decreased, and the differences were of statistical significance (Z=8.73, p <0.01; Z=3.01, p <0.01; Z=4.25, p <0.01; Z=8.51, p <0.01; Z=7.87, p <0.01). The AHI, ODI, wake after sleep onset (WASO), arousal index (AI), N1% and N2% in OSA group increased compared with those in control group, and the differences were statistically significant (Z=8.63, p <0.01; Z=8.52, p<0.01; Z=14.71, p<0.01; Z=3.21, p<0.01; Z=6.57, p<0.01; Z=7.41, p<0.01). Besides, when compared among the three OSA groups, the N1%, N2% and AI in severe group apparently increased relative to those in mild group (all p-values <0.05); in severe group, the LSaO2, N3% and REM% were notably lower than those in mild group (all p-values <0.01).
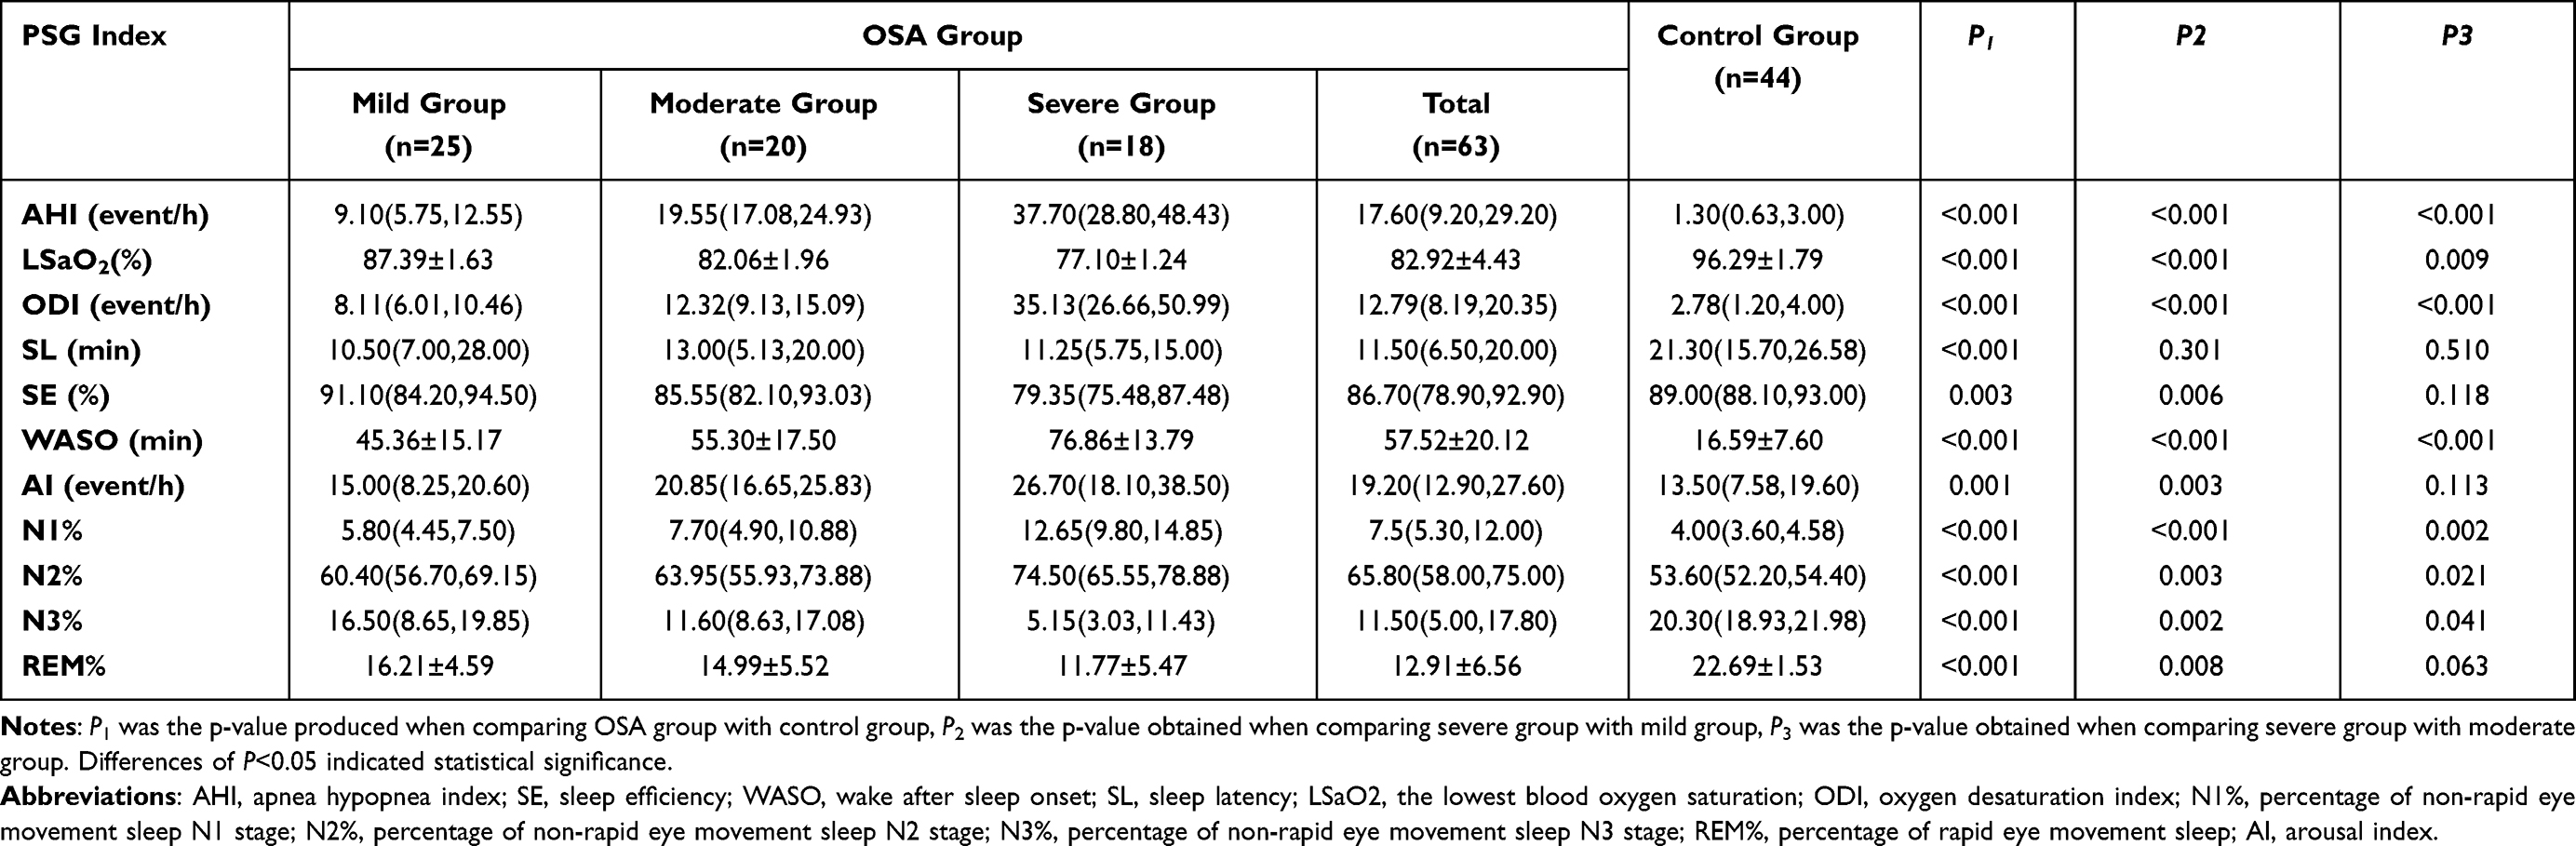 |
Table 2 Analysis of PSG Results Among All Groups |
The Prevalence and Number of EPVS
EPVS was found in 18 (40.91%) control subjects, 16 (64.00%) mild, 15 (75.00%) moderate and 17 (94.44%) severe OSA patients, respectively. Compared with control group, the incidence rate of EPVS in OSA patients was higher (χ2=13.64, P<0.01), and that in severe OSA patients was higher than those in mild and moderate OSA patients (χ2=5.44, P=0.02; χ2=2.69, P=0.10). There were 7.14±9.65, 12.16±10.59, 26.64±15.98 and 47.13±17.52 EPVS in control subjects, mild, moderate and severe OSA groups, separately. The number of EPVS in OSA group was higher than that in control subjects (Z=5.07, P<0.01) (Figure 3), and that in severe group was the highest (Z=3.04, P<0.01; Z=4.96, P<0.01) (Table 1).
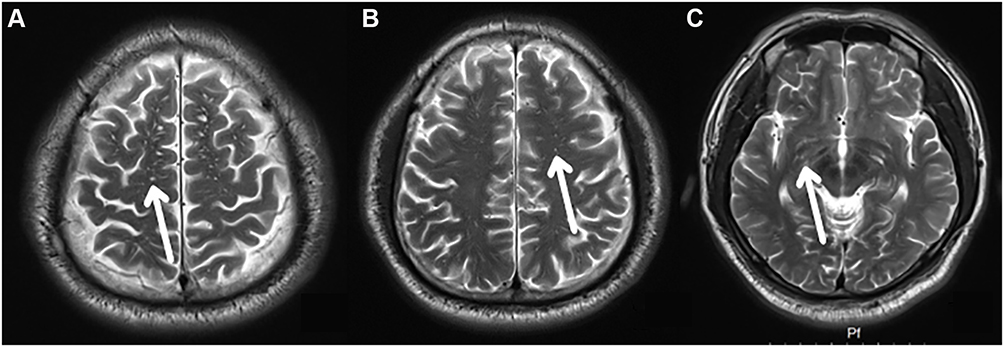 |
Figure 3 EPVS in OSA group observed at different layers. (A–C) display the frontoparietal subcortical white matter layer, centrum semiovale layer and basal ganglia layer; EPVS (white arrows). |
Correlations of MMSE, Respiratory Parameters and Sleep Structure with EPVS
The correlations of EPVS with diverse indexes are shown in Tables 3 and 4. After adjusting for age, BMI and ESS, correlations of EPVS numbers with N1% and MMSE were not significant. AHI, ODI, TS90%, AI and N2% were positively correlated with EPVS, whereas LSaO2, SE, N3% and REM% were negatively correlated with EPVS.
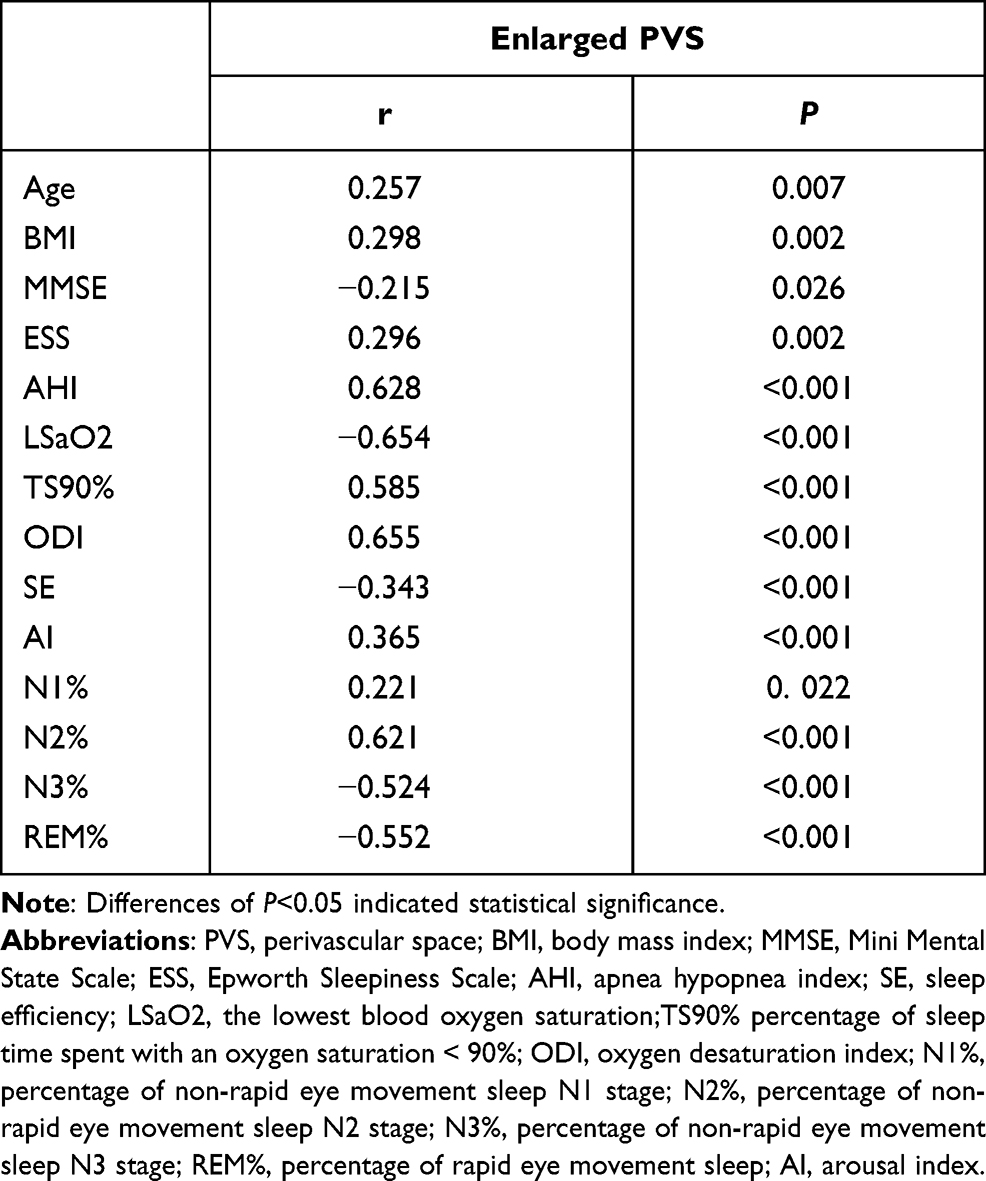 |
Table 3 Partial Spearman’s Rank Order Correlation Results Unadjusted for Covariates |
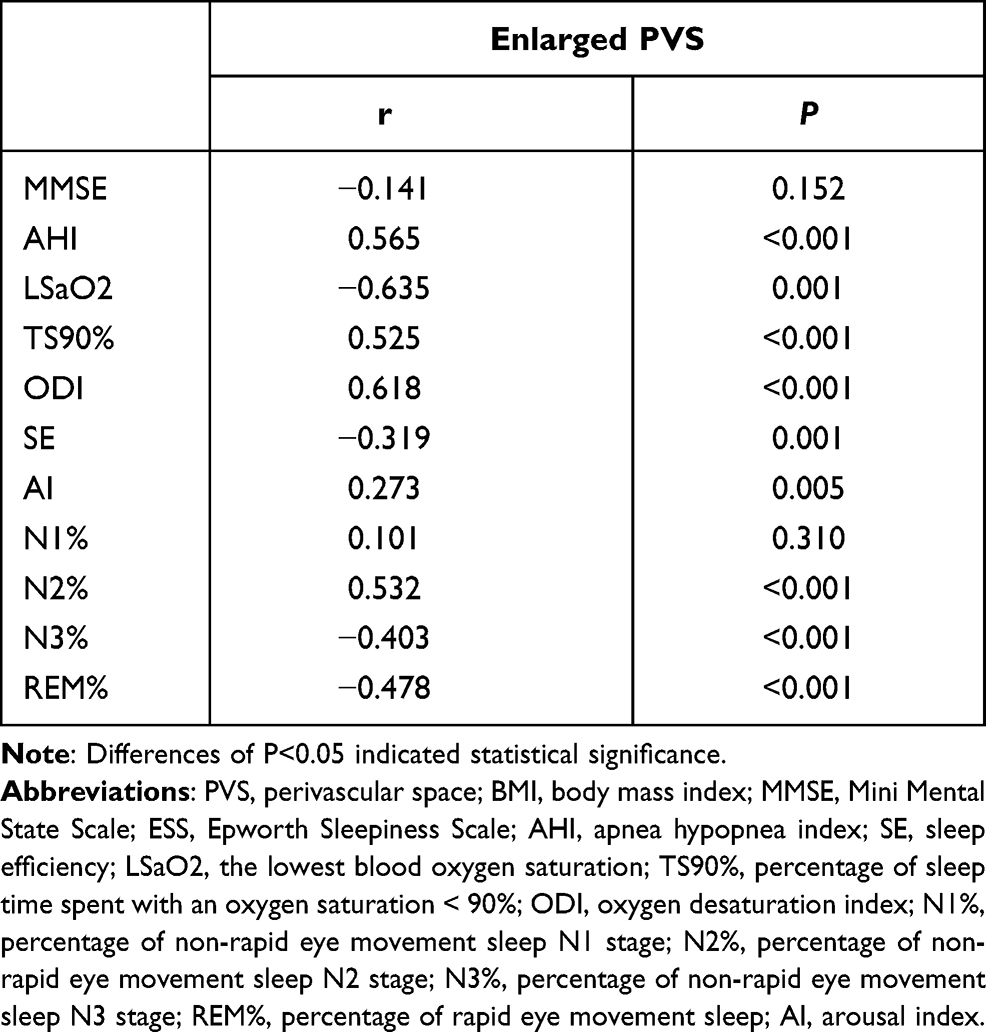 |
Table 4 Partial Spearman’s Rank Order Correlation Results Controlling for Age, BMI, ESS |
Discussion
This study suggested that OSA mainly resulted in sleep structure disturbance, sleep fragmentation and intermittent hypoxemia. The main findings of our study provided evidence for the relationship between OSA and PVS. The prevalence and number of EPVS increased in OSA groups, and such variations were related to OSA severity via the pathophysiologic mechanisms, resulting in cerebrovascular diseases and cognitive decline.
PSG serves as the gold standard to diagnose OSA, and it reflects the objective sleep quality of OSA cases. OSA cases have poor nighttime sleep quality, which has been well recognized among scholars which supports the results in our study.29,30 The most fundamental incentive for the brain to sleep lies in its own self-preservation: only the sleeping brain is capable of efficiently clearing the waste products generated during active wakefulness through the perivascular drainage system. The decreased sleep quality will destroy neurotoxin elimination, and disturb brain interstitial fluid drainage and local inflammation. This process may be expected to progressively suppress glymphatic flow in the most affected regions that may result in PVS expansion.1 Different observations are reported in prior works regarding cerebral PVS in OSA.10,23 In this study, we analyzed 63 OSA cases and discovered that the OSA group showed markedly increased EPVS compared with control group (χ2=13.64, P<0.01), and the severe OSA group had markedly more EPVS than the other groups. The number of EPVS was higher in OSA group (26.09±20.03) compared with the control subjects (7.14±9.65). Therefore, OSA might serve as a risk factor for EPVS, which was supported by another literature.31
In the present article, our findings suggested that the respiratory parameters AHI, ODI and TS90% were positively correlated with EPVS, while a significant negative correlation was observed between EPVS and LSaO2. Such result suggests that, with the increase in OSA severity, the hypoxia degree in the body during sleep is aggravating, which together with the sleep fragmentation, supports the use of PVS as a vascular clearance impairment marker in sleep disorder.31 The PVS seen on MRI may not be pathological, but it has been suggested to be related to age-related diseases and the vascular risk factors.5 On this basis, we speculate that a higher risk for EPVS possibly takes place via the pathophysiologic mechanisms non-specific to the cerebral blood flow, as shown below: (1) the sympathetic activation induced by intermittent hypoxia aggravates systemic inflammatory response, decreases hypocretin secreted by the brain at the time of sleep fragmentation, leads to blood leukocytosis and induces inflammatory response and oxidative damage.32 The activation of inflammatory response may cause microvascular endothelial cell injury, microvascular wall structural changes and astrocyte swelling, which then leads to interstitial fluid leakage, restricted drainage space and the subsequent PVS development. (2) It is related to the respiratory event-related hemodynamic changes. When the automatic adjustment mechanism of the cerebrovascular system is insufficient to protect the brain against the apnea-related rapid intracranial pressure fluctuations, the hemodynamic changes will result in higher resistance of PVS to CSF clearance, which hinders the elimination of metabolites through the lymphatic system.33,34
Associations between sleep architecture and PVS changes on MRI have also been found in this study, which suggested that SE was significantly negatively correlated with EPVS, and AI was positively correlated with EPVS. The decreased SE may be related to the ineffective PVS drainage,4 and the lower percentage of time spent asleep is probably related to the ineffective perivascular drainage, which may result in PVS enlargement. Additionally, the noradrenaline produced by the locus coeruleus in the brain is of great significance to promote arousal, which is a key neurotransmitter that regulates the glymphatic system function.35 The elevation of norepinephrine level may lead to increased cell volume, which can further reduce the PVS volume fraction and indirectly increase the CSF flow resistance, finally affecting the clearance efficiency of the glymphatic system.36 On the other hand, the clearance of intracerebral metabolites depends on the polar distribution of astrocyte terminal aquaporin 4 (AQP4).3 The long-term sleep deprivation or fragmentation affects the distribution of AQP4, renders its loss of polarity and even arrangement on the astrocyte surface, which thereby affects the metabolite elimination efficiency by the glymphatic system, resulting in PVS expansion.37,38
Some important physiological alterations may take place during sleep, as defined by the various sleep stages.39 However, the sleep-stage distributions may not be measured by SE and AI. Therefore, we further examined the relationships of different sleep-stage proportions with EPVS. As revealed by our findings, EPVS was negatively correlated with N3% and REM%, but positively correlated with N2%. Fultz et al pointed out that33 the lymphatic system was mainly active during sleep to eliminate the tissue waste from the perivascular system and to realize sleep homeostasis, which mainly took place during the phase of slow wave sleep and was triggered or led by the slow brain waves with low activity. Laura Lewis also suggested that CSF flow velocity exceeded the imaging critical velocity (11.4 mm/s for slice 2), which identified a large-amplitude pulsatile flow of CSF at 0.05 Hz that appeared during NREM sleep.33 Although the glymphatic system was somewhat active during the day, Nedergaard discovered that it was during deep NREM sleep that this sanitization system kicked into high gear. With the pulsing rhythm of deep NREM sleep, the brain expels 10 or 20 times more effluents.40 At the same time, the volume of brain glial cells shrunk by 60% in deep sleep stage, which created a greater space for the CSF to eliminate the metabolic wastes. However, our results suggested that N2% was positively correlated with EPVS, which might further support the speculation that ISF elimination mainly took place in slow wave sleep process, conforming to research by Xie et al.36 Moreover, our data suggested that the reduced REM% was associated with EPVS. The REM sleep deprivation is accompanied by the reduced CSF lymphatic circulation, thus resulting in hydrocephalus.41 Consequently, it is speculated that the EPVS may be related to the mechanical association of the pathological brain status produced by the REM sleep deprivation. In our data, 18 (40.91%) of the control subjects presented EPVS (Table 1), and it was inferred from the data that MRI-visible PVS was considered as the enlarged PVS in our study. Besides, PVS on MRI of normal controls showed normal results, and even their dilation was related to aging.
Notably, in our cohort, MMSE scale was used for evaluating the changes in cognitive function among OSA cases. The results showed that most of the patients with OSA did not have cognitive decline, the score of MMSE was lower in OSA group (27.58±1.39) compared with the control group (28.00±1.29), and the MMSE score of the severe OSA group was significantly lower (27.12±1.58). However, there was no significant difference in the MMSE score between groups, or correlation with EPVS, in contrary to several other reports23,42–44 suggesting that OSA caused different degrees of cognitive dysfunction. This difference might be due to the fact that the MMSE scale was less sensitive than Montreal Cognitive Assessment scale and participants were all young and middle-aged in our study.
Certain limitations should be noted in this study. For instance, this study retrospectively analyzed a small portion of patients diagnosed with OSA at our hospital, which might lead to sampling bias and have limited general applicability. Secondly, PSG serves as the gold standard for sleep staging, but it is only a snapshot of the whole night sleep of an individual subject, which may not represent the long-term sleep mode of a family. Therefore, long-term follow-up studies are warranted to further investigate and explore the role of OSA in the EPVS pathophysiology and whether OSA treatment prevents PVS progression.
As far as we know, no epidemiological studies have reported that OSA is related to EPVS among the young and middle-aged populations. Our study had the main strength that our data represent the general population with a low risk of dementia and cerebrovascular diseases. This study revealed the important insights that the EPVS severity worsened with the increase in sleep disturbances in OSA, suggesting that the severity of OSA might be regulated by the number of pathophysiological mechanisms and affected the outcome of brain structural modification, thus leading to cerebrovascular diseases. Therefore, the increased risk of EPVS in OSA is a potential contributor to the increased risk of stroke in OSA; however, further studies are needed.
Data Sharing Statement
The data that support the findings of this study are available from the corresponding authors upon reasonable request.
Acknowledgments
We thank the subject volunteers; the research technicians and all those authors who have contributed to the study's conception and design.
Funding
This study was funded by the Key Scientific and Technological Research Projects in Henan Province (grant number 182102310586) and the Funding Scheme for Key Scientific Research Projects of Henan Higher Education Institutions under the award number 19A320039.
Disclosure
Prof. Dr. Marcel Tanner reports personal fees from the University Hospital Basel Board, Fondation Botnar Board, Gebert-Rüf Foundation Board and R. Geigy Foundation, Board, outside the submitted work. The authors declare that they have no other competing interests.
References
1. Iliff JJ, Wang M, Liao Y, et al. A paravascular pathway facilitates CSF flow through the brain parenchyma and the clearance of interstitial solutes, including amyloid beta. Sci Transl Med. 2012;4:111r–147r. doi:10.1126/scitranslmed.3003748
2. Hauglund NL, Pavan C, Nedergaard M. Cleaning the sleeping brain – the potential restorative function of the glymphatic system. Current Opinion Physiol. 2020;15:1–6. doi:10.1016/j.cophys.2019.10.020
3. Nedergaard M, Goldman SA. Glymphatic failure as a final common pathway to dementia. Science. 2020;370:50–56. doi:10.1126/science.abb8739
4. Ramirez J, Berezuk C, McNeely AA, Scott CJ, Gao F, Black SE. Visible Virchow-Robin spaces on magnetic resonance imaging of Alzheimer’s disease patients and normal elderly from the Sunnybrook Dementia Study. J Alzheimers Dis. 2015;43:415–424. doi:10.3233/JAD-132528
5. Jimenez-Balado J, Riba-Llena I, Garde E, et al. Prevalence of hippocampal enlarged perivascular spaces in a sample of patients with hypertension and their relation with vascular risk factors and cognitive function. J Neurol Neurosurg Psychiatry. 2018;89:651–656. doi:10.1136/jnnp-2017-316724
6. Banerjee G, Kim HJ, Fox Z, et al. MRI-visible perivascular space location is associated with Alzheimer’s disease independently of amyloid burden. Brain. 2017;140:1107–1116. doi:10.1093/brain/awx003
7. Riba-Llena I, Jimenez-Balado J, Castane X, et al. Arterial stiffness is associated with basal ganglia enlarged perivascular spaces and cerebral small vessel disease load. Stroke. 2018;49:1279–1281. doi:10.1161/STROKEAHA.118.020163
8. Charidimou A, Meegahage R, Fox Z, et al. Enlarged perivascular spaces as a marker of underlying arteriopathy in intracerebral haemorrhage: a multicentre MRI cohort study. J Neurol Neurosurg Psychiatry. 2013;84:624–629. doi:10.1136/jnnp-2012-304434
9. Wang G, Goebel JR, Li C, Hallman HG, Gilford TM, Li W. Therapeutic effects of CPAP on cognitive impairments associated with OSA. J Neurol. 2020;267:2823–2828. doi:10.1007/s00415-019-09381-2
10. Song TJ, Park JH, Choi KH, et al. Moderate-to-severe obstructive sleep apnea is associated with cerebral small vessel disease. Sleep Med. 2017;30:36–42. doi:10.1016/j.sleep.2016.03.006
11. Del BO, Mera RM, Zambrano M, Castillo PR. Relationship between obstructive sleep apnea and neuroimaging signatures of cerebral small vessel disease in community-dwelling older adults. The Atahualpa Project. Sleep Med. 2017;37:10–12. doi:10.1016/j.sleep.2017.06.009
12. Peppard PE, Young T, Palta M, Skatrud J. Prospective study of the association between sleep-disordered breathing and hypertension. N Engl J Med. 2000;342:1378–1384. doi:10.1056/NEJM200005113421901
13. Yaggi HK, Concato J, Kernan WN, Lichtman JH, Brass LM, Mohsenin V. Obstructive sleep apnea as a risk factor for stroke and death. N Engl J Med. 2005;353:2034–2041. doi:10.1056/NEJMoa043104
14. Kim J, Yi H, Shin KR, Kim JH, Jung KH, Shin C. Snoring as an independent risk factor for hypertension in the nonobese population: the Korean Health and Genome Study. Am J Hypertens. 2007;20:819–824. doi:10.1016/j.amjhyper.2007.03.007
15. Kokkarinen J. Obstructive sleep apnea-hypopnea and incident stroke: the sleep heart health study. Am J Respir Crit Care Med. 2011;183:950. doi:10.1164/ajrccm.183.7.950
16. Yaffe K, Laffan AM, Harrison SL, et al. Sleep-disordered breathing, hypoxia, and risk of mild cognitive impairment and dementia in older women. JAMA. 2011;306:613–619. doi:10.1001/jama.2011.1115
17. Stone KL, Blackwell TL, Ancoli-Israel S, et al. Sleep disordered breathing and risk of stroke in older community-dwelling men. Sleep. 2016;39:531–540. doi:10.5665/sleep.5520
18. Ho BL, Tseng PT, Lai CL, et al. Obstructive sleep apnea and cerebral white matter change: a systematic review and meta-analysis. J Neurol. 2018;265:1643–1653. doi:10.1007/s00415-018-8895-7
19. Kim H, Yun CH, Thomas RJ, et al. Obstructive sleep apnea as a risk factor for cerebral white matter change in a middle-aged and older general population. Sleep. 2013;36:709–715. doi:10.5665/sleep.2632
20. Morrell MJ, Jackson ML, Twigg GL, et al. Changes in brain morphology in patients with obstructive sleep apnoea. Thorax. 2010;65:908–914. doi:10.1136/thx.2009.126730
21. Torelli F, Moscufo N, Garreffa G, et al. Cognitive profile and brain morphological changes in obstructive sleep apnea. Neuroimage. 2011;54:787–793. doi:10.1016/j.neuroimage.2010.09.065
22. Nishibayashi M, Miyamoto M, Miyamoto T, Suzuki K, Hirata K. Correlation between severity of obstructive sleep apnea and prevalence of silent cerebrovascular lesions. J Clin Sleep Med. 2008;4:242–247.
23. Huang Y, Yang C, Yuan R, Liu M, Hao Z. Association of obstructive sleep apnea and cerebral small vessel disease: a systematic review and meta-analysis. Sleep. 2020;43. doi:10.1093/sleep/zsz264.
24. Epstein LJ, Kristo D, Strollo PJ, et al. Clinical guideline for the evaluation, management and long-term care of obstructive sleep apnea in adults. J Clin Sleep Med. 2009;5:263–276.e4d.
25. Bjurstrom MF, Irwin MR. Polysomnographic characteristics in nonmalignant chronic pain populations: a review of controlled studies. Sleep Med Rev. 2016;26:74–86. doi:10.1016/j.smrv.2015.03.004
26. Berry RB, Brooks R, Gamaldo C, et al. AASM Scoring Manual Updates for 2017 (Version 2.4). J Clin Sleep Med. 2017;13:665–666. doi:10.5664/jcsm.6576
27. Cumurciuc R, Guichard JP, Reizine D, Gray F, Bousser MG, Chabriat H. Dilation of Virchow-Robin spaces in CADASIL. Eur J Neurol. 2006;13:187–190. doi:10.1111/j.1468-1331.2006.01113.x
28. Gander PH, Marshall NS, Harris R, Reid P. The Epworth Sleepiness Scale: influence of age, ethnicity, and socioeconomic deprivation. Epworth Sleepiness scores of adults in New Zealand. Sleep. 2005;28:249–253. doi:10.1093/sleep/28.2.249
29. Gottlieb DJ, Yenokyan G, Newman AB, et al. Prospective study of obstructive sleep apnea and incident coronary heart disease and heart failure: the sleep heart health study. Circulation. 2010;122:352–360. doi:10.1161/CIRCULATIONAHA.109.901801
30. Huang T, Lin BM, Stampfer MJ, Tworoger SS, Hu FB, Redline S. A population-based study of the bidirectional association between obstructive sleep apnea and Type 2 diabetes in three prospective U.S. cohorts. Diabetes Care. 2018;41:2111–2119. doi:10.2337/dc18-0675
31. Huang S, Wang D, Zhou H, et al. Neuroimaging consequences of cerebral small vessel disease in patients with obstructive sleep apnea-hypopnea syndrome. Brain Behav. 2019;9:e1364. doi:10.1002/brb3.1364
32. McAlpine CS, Kiss MG, Rattik S, et al. Sleep modulates haematopoiesis and protects against atherosclerosis. Nature. 2019;566:383–387. doi:10.1038/s41586-019-0948-2
33. Fultz NE, Bonmassar G, Setsompop K, et al. Coupled electrophysiological, hemodynamic, and cerebrospinal fluid oscillations in human sleep. Science. 2019;366:628–631. doi:10.1126/science.aax5440
34. Ju YE, Finn MB, Sutphen CL, et al. Obstructive sleep apnea decreases central nervous system-derived proteins in the cerebrospinal fluid. Ann Neurol. 2016;80:154–159. doi:10.1002/ana.24672
35. O’Donnell J, Zeppenfeld D, McConnell E, Pena S, Nedergaard M. Norepinephrine: a neuromodulator that boosts the function of multiple cell types to optimize CNS performance. Neurochem Res. 2012;37:2496–2512. doi:10.1007/s11064-012-0818-x
36. Xie L, Kang H, Xu Q, et al. Sleep drives metabolite clearance from the adult brain. Science. 2013;342:373–377. doi:10.1126/science.1241224
37. Liu D, He X, Wu D, et al. Continuous theta burst stimulation facilitates the clearance efficiency of the glymphatic pathway in a mouse model of sleep deprivation. Neurosci Lett. 2017;653:189–194. doi:10.1016/j.neulet.2017.05.064
38. Demiral SB, Tomasi D, Sarlls J, et al. Apparent diffusion coefficient changes in human brain during sleep - Does it inform on the existence of a glymphatic system? Neuroimage. 2019;185:263–273. doi:10.1016/j.neuroimage.2018.10.043
39. Vgontzas A, Pavlovic JM. Sleep disorders and migraine: review of literature and potential pathophysiology mechanisms. Headache. 2018;58:1030–1039. doi:10.1111/head.13358
40. Aalling NN, Nedergaard M, DiNuzzo M. Cerebral metabolic changes during sleep. Curr Neurol Neurosci Rep. 2018;18:57. doi:10.1007/s11910-018-0868-9
41. Roman GC, Jackson RE, Fung SH, Zhang YJ, Verma AK. Sleep-disordered breathing and idiopathic normal-pressure hydrocephalus: recent pathophysiological advances. Curr Neurol Neurosci Rep. 2019;19:39. doi:10.1007/s11910-019-0952-9
42. Edwards KM, Kamat R, Tomfohr LM, Ancoli-Israel S, Dimsdale JE. Obstructive sleep apnea and neurocognitive performance: the role of cortisol. Sleep Med. 2014;15:27–32. doi:10.1016/j.sleep.2013.08.789
43. Gao H, Han Z, Huang S, et al. Intermittent hypoxia caused cognitive dysfunction relate to miRNAs dysregulation in hippocampus. Behav Brain Res. 2017;335:80–87. doi:10.1016/j.bbr.2017.06.025
44. Charidimou A, Boulouis G, Pasi M, et al. MRI-visible perivascular spaces in cerebral amyloid angiopathy and hypertensive arteriopathy. Neurology. 2017;88:1157–1164. doi:10.1212/WNL.0000000000003746
 © 2021 The Author(s). This work is published and licensed by Dove Medical Press Limited. The full terms of this license are available at https://www.dovepress.com/terms.php and incorporate the Creative Commons Attribution - Non Commercial (unported, v3.0) License.
By accessing the work you hereby accept the Terms. Non-commercial uses of the work are permitted without any further permission from Dove Medical Press Limited, provided the work is properly attributed. For permission for commercial use of this work, please see paragraphs 4.2 and 5 of our Terms.
© 2021 The Author(s). This work is published and licensed by Dove Medical Press Limited. The full terms of this license are available at https://www.dovepress.com/terms.php and incorporate the Creative Commons Attribution - Non Commercial (unported, v3.0) License.
By accessing the work you hereby accept the Terms. Non-commercial uses of the work are permitted without any further permission from Dove Medical Press Limited, provided the work is properly attributed. For permission for commercial use of this work, please see paragraphs 4.2 and 5 of our Terms.