")
Back to Journals » International Journal of Nanomedicine » Volume 11
Enhancing the specificity of polymerase chain reaction by graphene oxide through surface modification: zwitterionic polymer is superior to other polymers with different charges
Authors Zhong Y, Huang LH, Zhang ZS, Xiong YJ, Sun LP, Weng J
Received 25 August 2016
Accepted for publication 8 October 2016
Published 11 November 2016 Volume 2016:11 Pages 5989—6002
DOI https://doi.org/10.2147/IJN.S120659
Checked for plagiarism Yes
Review by Single anonymous peer review
Peer reviewer comments 2
Editor who approved publication: Dr Linlin Sun
Yong Zhong,1,* Lihong Huang,2,* Zhisen Zhang,3 Yunjing Xiong,1 Liping Sun,1 Jian Weng1
1Department of Biomaterials, College of Materials, 2State Key Laboratory of Cellular Stress Biology, School of Life Sciences, 3Department of Physics, Research Institute for Biomimetics and Soft Matter, Xiamen University, Xiamen, People’s Republic of China
*These authors contributed equally to this work
Abstract: Graphene oxides (GOs) with different surface characteristics, such as size, reduction degree and charge, are prepared, and their effects on the specificity of polymerase chain reaction (PCR) are investigated. In this study, we demonstrate that GO with a large size and high reduction degree is superior to small and nonreduced GO in enhancing the specificity of PCR. Negatively charged polyacrylic acid (PAA), positively charged polyacrylamide (PAM), neutral polyethylene glycol (PEG) and zwitterionic polymer poly(sulfobetaine) (pSB) are used to modify GO. The PCR specificity-enhancing ability increases in the following order: GO-PAA < GO-PAM < GO-PEG < GO-pSB. Thus, zwitterionic polymer-modified GO is superior to other GO derivatives with different charges in enhancing the specificity of PCR. GO derivatives are also successfully used to enhance the specificity of PCR for the amplification of human mitochondrial DNA using blood genomic DNA as template. Molecular dynamics simulations and molecular docking are performed to elucidate the interaction between the polymers and Pfu DNA polymerase. Our data demonstrate that the size, reduction degree and surface charge of GO affect the specificity of PCR. Based on our results, zwitterionic polymer-modified GO may be used as an efficient additive for enhancing the specificity of PCR.
Keywords: PCR additive, charge, pSB, Pfu DNA polymerase
Introduction
Polymerase chain reaction (PCR) is one of the most ubiquitous and well-developed tools in molecular biology.1,2 Due to its ability to produce billions of DNA copies by rapid and selective amplification of a specific region in the DNA chain, it has a wide range of applications in gene amplification, molecular cloning and disease diagnosis.3 A basic PCR usually requires the following five components: 1) DNA template containing the target DNA region, 2) two primers to initiate DNA synthesis, 3) a thermostable DNA polymerase to catalyze DNA synthesis, 4) deoxynucleoside triphosphates (dNTPs, the building blocks of new DNA strand) and 5) buffer including bivalent cations (usually Mg2+).4 Often a time-consuming optimization process may be required in order to obtain a successful PCR, primarily when amplification from genomic DNA is required.
Many factors will affect the specificity of PCR, such as the primer purity and sequence, purity of the template DNA, Mg2+ concentration, annealing temperature and other additives such as dimethyl sulfoxide (DMSO), which are frequently included in the PCR mixture.5,6 Usually, when the concentration of template DNA is very low, or the structure of DNA template is very complicated, such as GC-rich gene or mammalian genomic DNA, the specificity of PCR might be very low. Different strategies have been developed to improve the specificity of PCR, such as nested PCR using two separate sets of primers, touchdown PCR with gradually decreased annealing temperatures and hot start PCR withholding the DNA polymerase or the primers until the reaction mixture has reached a temperature above the threshold for nonspecific binding of primer to template.4 However, optimizing the primer design, PCR cycling conditions and the annealing temperatures and adjusting the concentrations of PCR components are lengthy and frustrating processes. To enhance the specificity of PCR, several small molecules have been used as additives, such as DMSO, glycerin, betaine, formamide and bovine serum albumin (BSA).7,8 Using them either singly or in combination does not guarantee enhancing the specificity of PCR. Thus, the effect of these additives is unpredictable. Therefore, it remains a challenge to find new additives to enhance the specificity of PCR.
In recent years, nanomaterials have been used in PCR system, including metal nanoparticles, semiconductor quantum dots, carbon nanomaterials and polymer nanoparticles.9–19 Nanomaterials often possess unique physical and chemical properties, eg, surface effect arising from their large surface-to-volume ratio, which differ greatly from macroscopic materials. The effect of nanomaterials on PCR mainly depends on the strong interaction between PCR components and nanomaterials.20 However, conflicting results were obtained from different research groups.21–25 Therefore, the effect of nanomaterials with different surface characteristics on PCR is still unclear and much more systemic and deep investigations are necessary to understand the corresponding mechanism.
Our previous study has demonstrated that reduced graphene oxide (RGO) can improve the specificity of PCR significantly.19 However, RGO has poor solubility in water due to its shortage of functional groups on its surface, which inhibits the further application of RGO. In comparison with RGO, there are many hydroxyl, epoxy and carboxyl groups on graphene oxide (GO) sheet, which result in high polarity and hydrophilicity of GO. Thus, GO is hydrophilic and can be well dispersed in water. Further surface modification of GO can provide GO with some new surface properties.26–31 In this study, GO was modified with negatively charged carboxyl-terminated polyacrylic acid (PAA), positively charged amino-terminated polyacrylamide (PAM), neutral polyethylene glycol (PEG) or zwitterionic polymer poly(sulfobetaine) (pSB). In addition, we investigated the effect of GO with different surface properties, such as size, reduction degree and surface modification, on the specificity of PCR. We found that large and RGO was superior to small and non-RGO in enhancing the specificity of PCR. The surface charge of GO also affected the specificity of PCR in the following order: GO-PAA < GO-PAM < GO-PEG < GO-pSB. For polymer-modified GO, the zwitterionic pSB was found to be superior in enhancing the specificity of PCR compared to neutral and negatively and positively charged polymers. These GO derivatives with different surface charges have been used successfully as additives in amplification of the mitochondrial DNA using blood genomic DNA as template. Based on our results, we suggest that GO derivatives can also enhance the specificity of PCR of low abundance DNA obtained from clinical samples. Molecular dynamics simulations and molecular docking are further used to investigate the interaction between the polymers and Pfu DNA polymerase for understanding the mechanism of specificity enhancing. Our research results may ultimately progress the application of GO in biomedical fields.
Materials and methods
Materials
Natural graphite powder (320 mesh, Alfa, 99%) was purchased from Tianjin Guangfu Chemical Agent Co., Ltd. (Tianjin, People’s Republic of China). NaNO3, KMnO4, K3PO4 (99%), L-lysine (98%), ninhydrin (97%) and H2O2 were purchased from Guoyao Co., Ltd. (Shanghai, People’s Republic of China). Acrylic acid (AA), acrylamide (AM), H2SO4, HCl, hydrazine hydrate (80%), ethanol, NaHCO3, NaOH, Mg2SO4 (99%), methyl-red and sodium borate were purchased from Xilong Chemical (Guangzhou, People’s Republic of China). Potassium peroxosulfate was purchased from Dahao Nanhong Industrial Co., Ltd. (Shantou, People’s Republic of China). mPEG-NH2 was purchased from Kaizheng Biotech Development Co., Ltd. (Beijing, People’s Republic of China). 1-Ethyl-3-[3-dimethylaminopropyl] carbodiimide hydrochloride (EDC, 98%) was purchased from Aladdin Industrial Corporation (Shanghai, People’s Republic of China). BSA (98%) and [2-(methacryloyloxy)ethyl] dimethyl-(3-sulfopropyl) ammonium hydroxide (SB, 98%) were purchased from Sigma-Aldrich. All reagents used were of analytical-reagent grade except specially stated. The dialysis tubing (8,000–14,000 MWCO) was purchased from Solarbio Life Sciences (Beijing, People’s Republic of China). The pET-32a plasmid DNA was purchased from Novegan, Shanghai, People’s Republic of China. The Pfu polymerase, dNTP, 10× buffer, 0.22 μm filter, agarose, glycerol, Luria-Bertani broth, ethidium bromide (EB), DNA marker, DNA-loading buffer, anhydrous CaCl2, PCR tubes, 50× TAE buffer and ampicillin were purchased from Sangon Biotech Co., Ltd. (Shanghai, People’s Republic of China). The primers were synthesized by Sangon Biotech Co., Ltd. (Table S1). The PCR products were sequenced by Sangon Biotech Co., Ltd. Mini Plasmid Kit was purchased from TIANGEN Biotech Co., Ltd. (Beijing, People’s Republic of China). High Pure PCR Template Preparation Kit was purchased from Roche Ltd. (Germany). Deionized water was used in all experiments.
Synthesis of GO and its derivatives
GO was synthesized according to our previous method.32,33 First, 2.0 g of graphite powder and 1.0 g of NaNO3 were added to 46 mL of 98% H2SO4 in an ice bath, and then 6.0 g of KMnO4 was added slowly into the mixture with vigorous agitation. The mixture was stirred continually for 2 hours in the ice bath and placed in a water bath at 35°C for 30 minutes. Then 92 mL of water was gradually added, and the temperature was raised to 95°C. The solution was stirred for 3 hours. Finally, 400 mL of water was added, and 6 mL of 30% H2O2 was dropped into the reaction. After cooling to room temperature, the mixture was filtered and washed with 1:10 HCl (volume ratio), followed by repeated washing with water to remove the acid. The filter cake was then dispersed in water to obtain graphite oxide. Exfoliation of graphite oxide to GO was achieved by ultrasonication for 3 hours at 500 W. The aggregate was removed by centrifugation at 4,000 rpm for 10 minutes. The supernatant was collected and dialyzed in water for 1 week to remove residual salts.
Small GO (S-GO) and large GO (L-GO) were prepared according to the literature.34 The dialyzed GO solution was sonicated for 10 hours, followed by centrifugation at 12,000 rpm for 20 minutes. The supernatant was collected as S-GO. The aggregate was dispersed in water again and centrifuged at 2,000 rpm for 10 minutes. The supernatant was collected as L-GO. RGO was prepared from GO, which was reduced by hydrazine hydrate in ammonia. A total of 50 mL of 1 mg mL−1 GO was loaded into a four-necked flask, and then 6 μL of 80% hydrazine hydrate and 100 μL of 28% ammonium hydroxide were added. After thorough mixing, the solution was heated in an oil bath at 95°C for 1 hour. The supernatant was collected and dialyzed for a week in water. Another sample of RGO with a higher reduction degree was prepared by adding 42 μL of 80% hydrazine hydrate and 700 μL of 28% ammonium hydroxide.
GO-PAA and GO-PAM were prepared according to our previous protocol.35 First, 1 mL of 1 g mL−1 AA monomer was added to 50 mL of 1 mg mL−1 GO solution under vigorous stirring at room temperature. Under nitrogen purge for 30 minutes, 80 mg of (NH4)2S2O8 was added and heated at 70°C for 3 hours in an oil bath. After cooling to room temperature, 200 mL of water was added and sonicated for 1 hour, followed by dialysis for a week to remove free PAA. After centrifugation at 4,000 rpm for 30 minutes, the supernatant was collected as GO-PAA. GO-PAM and GO-pSB were prepared in the similar way except that AA monomer was replaced by AM or SB monomer. For GO-pSB preparation, potassium peroxosulfate was used as initiator and the reaction mixture was heated at 70°C for 15 hours.
GO-PEG was prepared according to the literature.36 First, 10 mL of 3 M NaOH was mixed with 20 mL of 2 mg mL−1 GO solution and sonicated for 3 hours. Then 10% HCl was added to neutralize the solution to pH 7. The mixture was filtered and rinsed with water. The filter cake was then dispersed in 40 mL of water. A total of 80 mg mPEG-NH2 was added in the solution and sonicated for 5 minutes. Then 20 mg of EDC was added and sonicated for another 30 minutes, followed by the addition of 60 mg of EDC and overnight stirring. The supernatant was collected and dialyzed for a week in water to remove excess mPEG-NH2. After 30 minutes of centrifugation at 4,000 rpm, the supernatant was collected as GO-PEG.
Characterization of GO and its derivatives
Atomic force microscopy (AFM) images were obtained in the tapping mode in air using Nanoscope Multimode 8 (Veeco Instruments Inc., USA). The UV–vis absorption spectra were obtained using a TU-1901 UV–Vis spectrometer (Beijing Purkinje General Instrument, People’s Republic of China). The Fourier transform infrared (FTIR) spectra were recorded on a Nicolet iS10 spectrometer (Thermo Scientific, USA). Powder X-ray diffraction (XRD) system (Ultima IV; Rigaku, Japan) equipped with Cu Kα radiation (λ =1.542 Å) was used to characterize the crystallographic structures of the materials. X-ray photoelectron spectroscopy (XPS) spectra were recorded on a Phi Quantum 2000 X-ray photoelectron spectrometer (PHI, USA). Thermal gravimetric analysis (TGA) was performed on a SDT-Q600 (TA Instruments, USA) under nitrogen atmosphere at a heating rate of 10°C min−1. Zeta potentials were measured by a Malvern Nano-ZS (Malvern Instruments, Co., UK). Boehm titrations37 were conducted to determine the content of carboxyl and hydroxyl groups on RGO surface. The binding affinity of Pfu polymerase with GO and RGO was studied by isothermal titration calorimeters (NANO ITC; TA Instruments) at 25°C. Pfu polymerase was titrated with GO and RGO of different carboxyl contents (8.39%, 7.28% and 5.43%, respectively). The sample cell was filled with 0.12 μg mL−1 Pfu polymerase, and the reference cell was filled with water. In each experiment, 50 μL of 100 μg mL−1 RGO was taken by syringe and added to the sample cell in equal intervals of 200 seconds. The heat changes were measured after each addition. Calorimetric data for graphene–Pfu polymerase binding were analyzed using the NanoAnalyze software for NANO ITC.
PCR and agarose gel electrophoresis
pET-32a plasmid was used as the template of PCR. The following components were mixed in the first round of PCR: 1× PCR buffer containing 2 mM Mg2+, dNTP (each 0.2 mM), primer F1 (0.4 μM), primer R1 (0.4 μM) (Table S1), plasmid DNA (0.5 ng μL−1) and Pfu polymerase (0.1 U μL−1). GO or its derivatives with different concentrations were added in the PCR system. Each sample was made up to the final volume of 25 μL with water. In the second-round PCR, the same reaction condition was set, except that 0.5 μL of PCR product was used to substitute the plasmid DNA as the template. The PCR conditions are described in Table S2.
The study was approved by the Ethical Committee of the Medical College, Xiamen University. Blood samples were collected from healthy volunteers who provided written informed consent. Human genomic DNA was isolated using High Pure PCR Template Preparation Kit. A total of 20 ng μL−1 DNA was added instead of plasmid DNA. Primers F2 and R2 (Table S1) were used to amplify a fragment of human mitochondrial DNA. The PCR components were the same as above, except that plasmid DNA was replaced with 2.5 μL of genomic DNA. In the second- or third-round PCR, 2.5 μL of last-round PCR product was used as the template instead of genomic DNA. The PCR conditions are listed in Table S2. PCRs were performed in a T3 thermo cycler (Biometra, Germany). The PCR products were electrophoresed in 1.5% agarose gel for 30 minutes, stained with 0.5 μg mL−1 EB and analyzed using a Gel Doc XR system (Bio-Rad, USA). The fluorescence intensity of the band of PCR product was analyzed with the optical density analysis module of Image Lab software.
In silico simulation of Pfu polymerase–polymer interaction
Molecular dynamics simulations and molecular docking were used to study the possible interaction between the polymers and Pfu polymerase. Ionized forms of PAA, PAM and pSB were used in all docking and simulations (Figure S1). The molecular dynamics simulations were performed using the Groningen Machine for Chemical Simulation (GROMACS 5.0.4).38 The CHARMM36 force field39 was used for DNA polymerase and simple point charge water for solvent. Each polymer–protein complex was placed in a simulation box (14×14×14 nm) and filled with solvent. PAA and PAM have net charges of −70e and 70e, respectively. PEG and pSB are neutral. Pfu polymerase has a net charge of −4e. Na+ and Cl− ions were added to neutralize the net charges of the system. In each independent simulation, the polymer was placed at random location around the protein. Before dynamics, the structure was relaxed through energy minimization using the steepest descent algorithm. To equilibrate the system, a 100 ps NVT simulation, followed by a 100 ps NPT simulation, was carried out. The system temperature was maintained at 345 K (72°C), which is the elongation temperature for Pfu polymerase. Electrostatic interactions were handled using the smooth Particle Mesh Ewald method. All bonds in the simulated molecules were constrained to their reference values with Linear Constraint Solver. The Coul Short Range energies were calculated after reaching equilibration.
In order to calculate possible active sites in DNA polymerase, the Site Finder was performed by Molecular Operating Environment (2012.10).40 The purpose of docking simulation is to calculate and score the interactions between ligands and Pfu polymerase using the AutoDockVina 1.1.2 software with its default force field parameters.41 Five independent docking simulations, each with 10 sites of Pfu polymerase for trial, were carried out for each polymer–protein system.
Results and discussion
Preparation and characterization of GO and its derivatives
Figure 1 demonstrates the preparation of S-GO, L-GO, GO-PAA, GO-PEG, GO-PAM and GO-pSB. GO was synthesized from the natural graphite using modified Hummers method.32,33 S-GO and L-GO were prepared with high-speed centrifugation technology. The AFM images showed that the average size of S-GO (50 nm) was much smaller than that of L-GO (500 nm), while the thickness was ~0.9 nm for both samples (Figure S2). The result shows that both S-GO and L-GO are monolayer sheets with same thickness.42 Thus, we can exclude the effect of GO thickness on the specificity of PCR in the latter experiments. Grafting polymer onto the surface of GO resulted in the thickness increasing to 1–3 nm (Figure S2C–F). Boehm titrations showed that the amount of carboxyl groups of S-GO and L-GO were 9.01% and 8.17%, respectively. S-GO had more carboxyl groups due to bigger surface-to-volume ratio. The zeta potential of S-GO (−45.1±0.6 mV) was lower than that of L-GO (−35.6±0.8 mV), which means that the content of carboxyl groups in S-GO is higher than that of L-GO, and the result is consistent with the results from Boehm titrations.
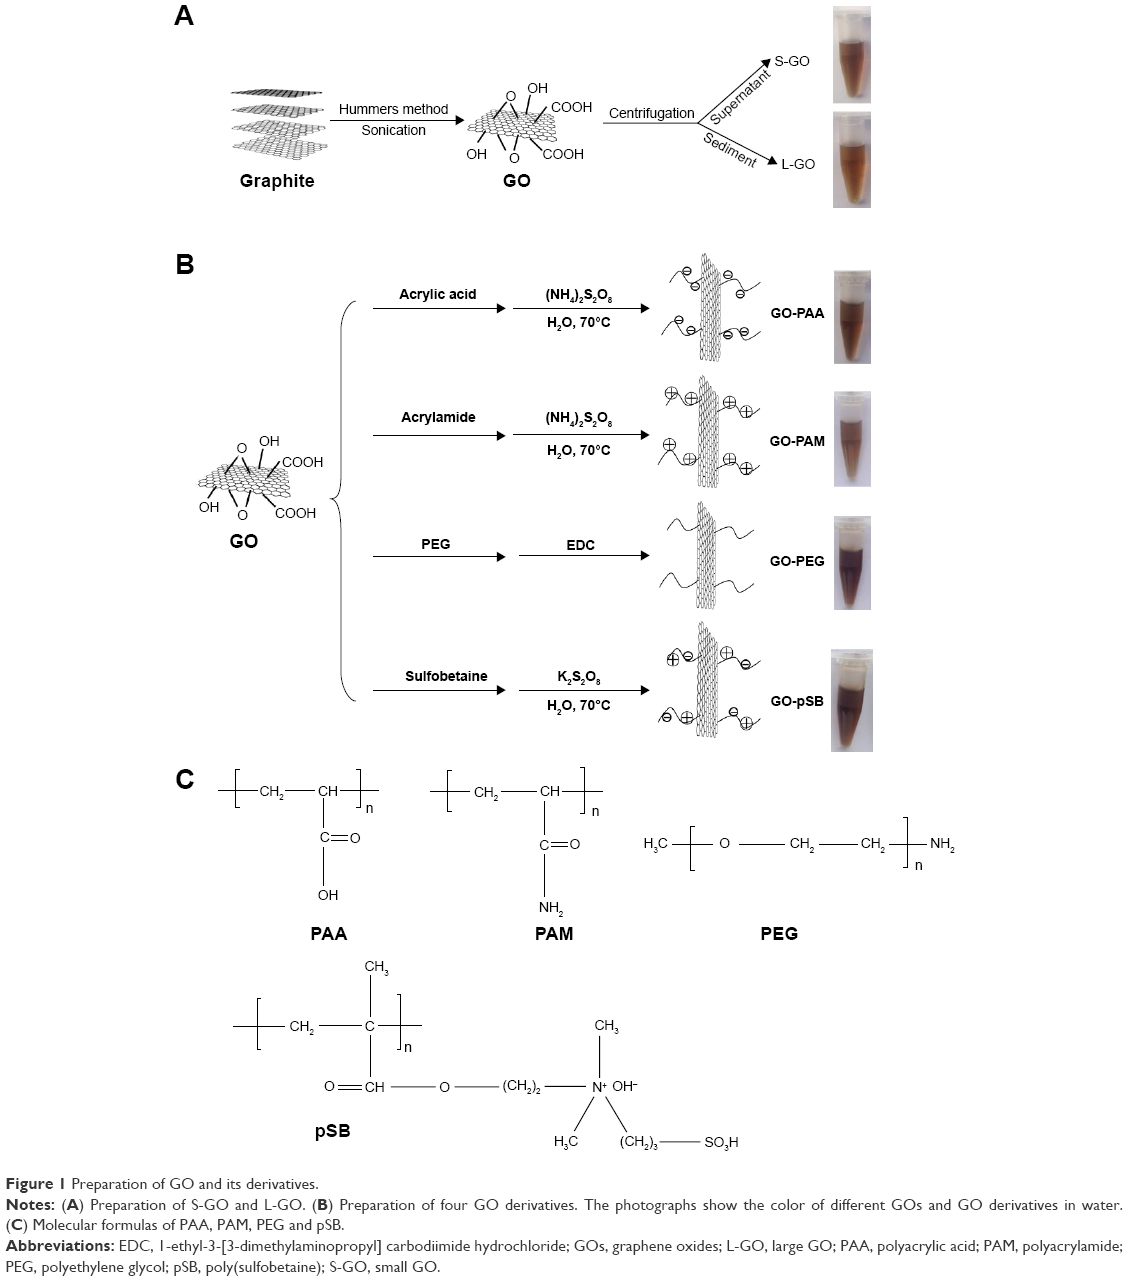 | Figure 1 Preparation of GO and its derivatives. |
GO-PAA, GO-PAM and GO-pSB were prepared by free-radical polymerization of AA, AM and SB monomers on GO surface, respectively. On the other hand, mPEG-NH2 was conjugated to the carboxyl groups on GO via carbodiimide-catalyzed amide formation. Ultraviolet–visible (UV–vis) spectra (Figure S3), FTIR spectra (Figure S4), XRD spectra (Figure S5) and XPS spectra (Figure S6) were used to characterize all samples and listed in the Supplementary materials. All these characterizations indicated that PAA, PAM, PEG and pSB were successfully grafted on GO. TGA of GO, GO-PAA, GO-PAM, GO-PEG and GO-pSB is shown in Figure S7. TGA of GO with 8.39% carboxyl content exhibits two regions of mass loss. The first weight loss at temperature <100°C is attributed to the loss of adsorbed water. The second weight loss between 180°C and 230°C is attributed to the decomposition of the oxygen-containing functional groups, such as carboxyl, epoxide and hydroxyl groups, in GO. The weight loss of graphene decreases with decreasing the content of carboxyl (Figure S7A). Compared to GO, the second weight loss of GO derivatives happens in a higher temperature, which mainly results from the decomposition of polymeric chain. By calculating the weight loss percentage, the calculated contents of PAA, PAM, PEG and pSB were 43.48%, 40.96%, 42.53% and 38.70%, respectively (Table S3). These polymer-modified GOs have similar content of polymer. Thus, we can exclude the effects of polymer content on the specificity of PCR in the latter experiments.
The zeta potentials of GO and RGO were −39.1±0.5 mV and −15.6±0.3 mV, respectively, indicating that GO was more stable than RGO. After grafting polymers onto the surface of GO, the zeta potential of GO-PAA (−46.9±0.9 mV) became more negative due to the negative charge of COO− in PAA. The zeta potential of GO-PAM increased to −24.1±1.2 mV due to positively charged NH3+ in PAM. The negative potential of GO-PEG (−35.7±0.8 mV) and GO-pSB (−20.4±0.9 mV) resulted from the COO− groups on GO surface, even though PEG was a neutral polymer and pSB was a zwitterionic polymer (Tables S4 and S5).
The effect of GO size on PCR
A common process of PCR includes 25–30 cycles of repeated temperature change. A typical PCR cycle consists of the following three steps: 1) denaturation of the template DNA, 2) annealing of two synthetic primers to the template DNA and 3) extension of the bound primers catalyzed by a thermostable DNA polymerase.5 Although PCR can multiply the target gene exponentially, nonspecific amplification remains a problem. Especially in the multiple-round PCR, the unreacted initial DNA template and primers disturb the reaction and cause unspecific products accumulation.43 In the initial studies, we used pET-32a plasmid as the template of PCR amplification. The optimal template concentration was determined by serial dilution experiments (Figure S8). A total of 0.5 ng μL−1 plasmid was considered as the optimal template concentration in the first-round PCR, and 0.5 μL of the first-round PCR product was the optimal template concentration in the second-round PCR. The effect of GO with different sizes (S-GO and L-GO) on the two rounds of PCR was investigated. In the first-round PCR, the intensity of the 689 bp target band decreases with increasing the GO concentration, indicating that the reaction is inhibited by both S-GO and L-GO at high concentration (4.8 μg mL−1 for S-GO and 6.4 μg mL−1 for L-GO; Figure 2A–C). In the second-round PCR, the first-round PCR product was used as the template. Since the PCR product contains not only the target product but also the unreacted initial DNA template, primers and unspecific products, these substances would disturb the second-round PCR and cause the accumulation of nonspecific products, leading to obvious smear bands without GO (Figure 2D and E). However, after adding S-GO or L-GO, the smear bands disappeared. The nonspecific products were decreased with increasing the concentration of S-GO and L-GO. L-GO had a better effect than S-GO, because it had a wider efficient concentration range to enhance the specificity of PCR (1.6–3.2 μg mL−1 for S-GO versus 0.8–4.8 μg mL−1 for L-GO; Table S6).
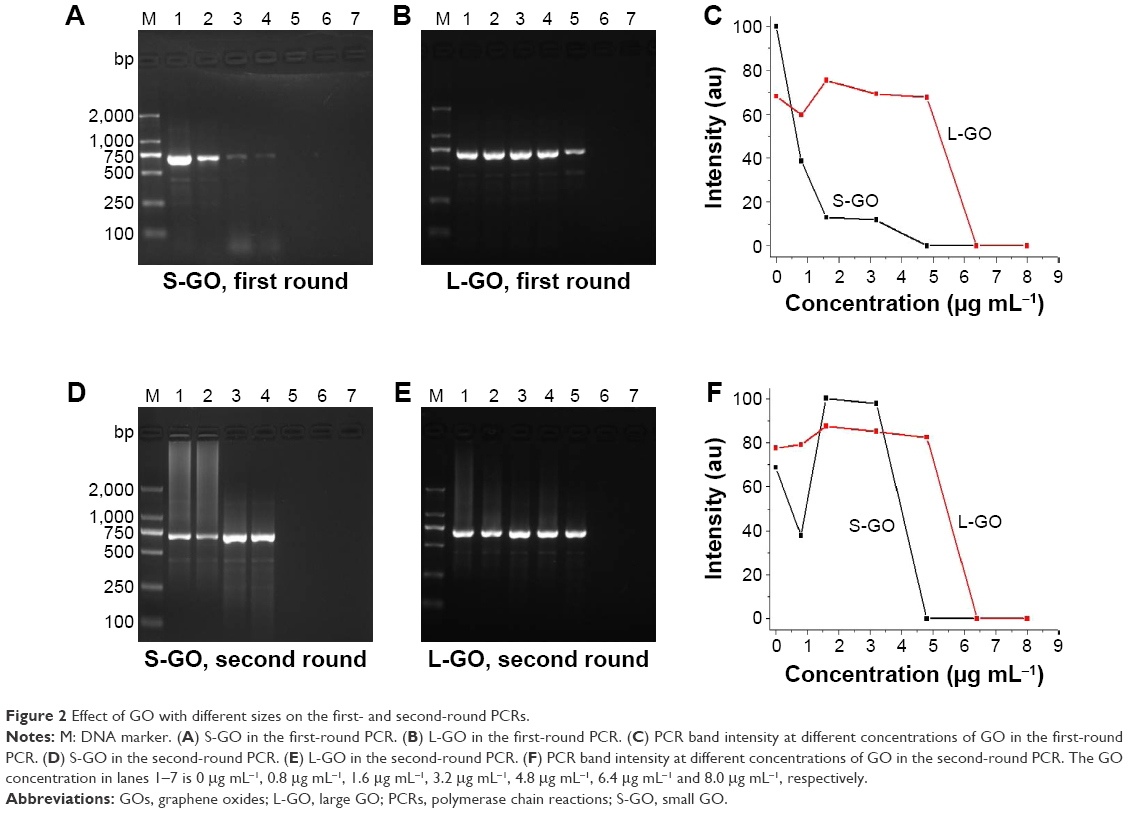 | Figure 2 Effect of GO with different sizes on the first- and second-round PCRs. |
Our working hypothesis for the observed GO concentration effect is as follows. When the concentration of GO is low, the adsorbed amount of positively charged Pfu polymerase and Mg2+ on negatively charged GO surface was relatively high. Then negatively charged molecules, such as DNA template, primers and dNTPs, are attracted by positively charged Pfu polymerase on GO surface. Thus, the probability of mismatch is decreased and the specificity of PCR is improved. However, when further increasing the GO concentration, the amount of negatively charged GO increases in the PCR system, so the adsorbed amount of positively charged Pfu polymerase and Mg2+ on single GO surface decreases. Moreover, the excess negative charges of GO will repel the negatively charged primers and dNTPs, leading to suppression of PCR. We measured the zeta potentials of GO and its mixture with Pfu polymerase in water (Table S4). The zeta potential of S-GO increased from −45.1±0.6 mV to −33.2±0.9 mV, while the zeta potential of L-GO increased from −35.6±0.8 mV to −29.8±1.1 mV, confirming a stronger electrostatic interaction between S-GO and Pfu polymerase than that of L-GO and Pfu polymerase. The similar trend is obtained in PCR buffer (Table S5). The result is attributed to higher content of negatively charged carboxyl groups in S-GO (9.01%) than that of L-GO (8.17%). Therefore, S-GO inhibits PCR at a lower concentration (1.6 μg mL−1) than L-GO (6.4 μg mL−1) and L-GO has a wider concentration range to enhance the specificity of PCR.
The effect of GO reduction degree on PCR
We prepared RGO using hydrazine as the reductant in ammonia. Boehm titrations and TGA (Figure S7A) showed that the carboxyl content was reduced from 8.39% to 5.43% following reduction. The zeta potentials were increased from −39.1±0.5 mV to −15.6±0.3 mV after reduction. In the first-round PCR, the bands intensity decreased with increasing the concentrations of GO and RGO (Figure 3A–D). At the same time, the inhibition effect was decreased with reducing the content of carboxyl groups on GO. In the second-round PCR, obvious smear bands appeared and decreased with increasing the concentrations of GO and RGO. The efficient concentration range for optimal specificity of PCR of GO (8.39%), RGO (7.28%) and RGO (5.43%) is 0.8–3.2 μg mL−1, 3.2–4.8 μg mL−1 and 0.8–6.4 μg mL−1, respectively. The specificity of PCR increases and the inhibition effect on PCR decreases with decreasing carboxyl contents in GO, demonstrating that the carboxyl groups on GO have significant effect on PCR. RGO has fewer negative charges than GO, resulting in less electrostatic repulsion with the negatively charged PCR components. In addition, a stronger π-stacking interaction between the ring structures of the nucleobases and the polyaromatic hydrocarbon structure of RGO leads to greater affinity of RGO with DNA strands than that of GO with DNA. RGO has more perfect hexagonal lattice than GO; thus, it has stronger hydrophobic and π-stacking interactions with Pfu polymerase than GO with Pfu polymerase. The Pfu polymerase is composed of 775 amino acids, including 26 phenylalanines, 47 tyrosines and 11 tryptophans, that all these molecules contain benzene rings. The rich nonpolar benzenes of these aromatic amino acids can bind on the graphene sheet strongly via π–π interaction.44 Therefore, RGO is superior to GO in enhancing the specificity of PCR due to less electrostatic repulsion with the negatively charged PCR components and higher affinity with DNA template and Pfu polymerase. The electrostatic absorption between positively charged Pfu polymerase and RGO is smaller than that between Pfu polymerase and GO with more negative charges, and hydrophobic interaction is the driving force for enzyme adsorption onto RGO.45 Thus, RGO has stronger affinity with Pfu polymerase than GO. This conclusion was further supported by the isothermal titration calorimetry (ITC) analysis (Table S7 and Figure S9). The dissociation constants (Kd) for graphene–Pfu polymerase interaction were 12.3 mol−5, 10.5 mol−5 and 3.96 mol−5 for GO (8.39% carboxyl), RGO (7.28% carboxyl) and RGO (5.43% carboxyl), respectively. Negative values of Gibbs free energy change (ΔG) confirmed the spontaneous binding of graphene with Pfu polymerase.46,47 The more RGO (5.43%) had the lowest Kd and more negative ΔG values, indicating higher affinity between RGO and Pfu polymerase than between GO and Pfu polymerase.
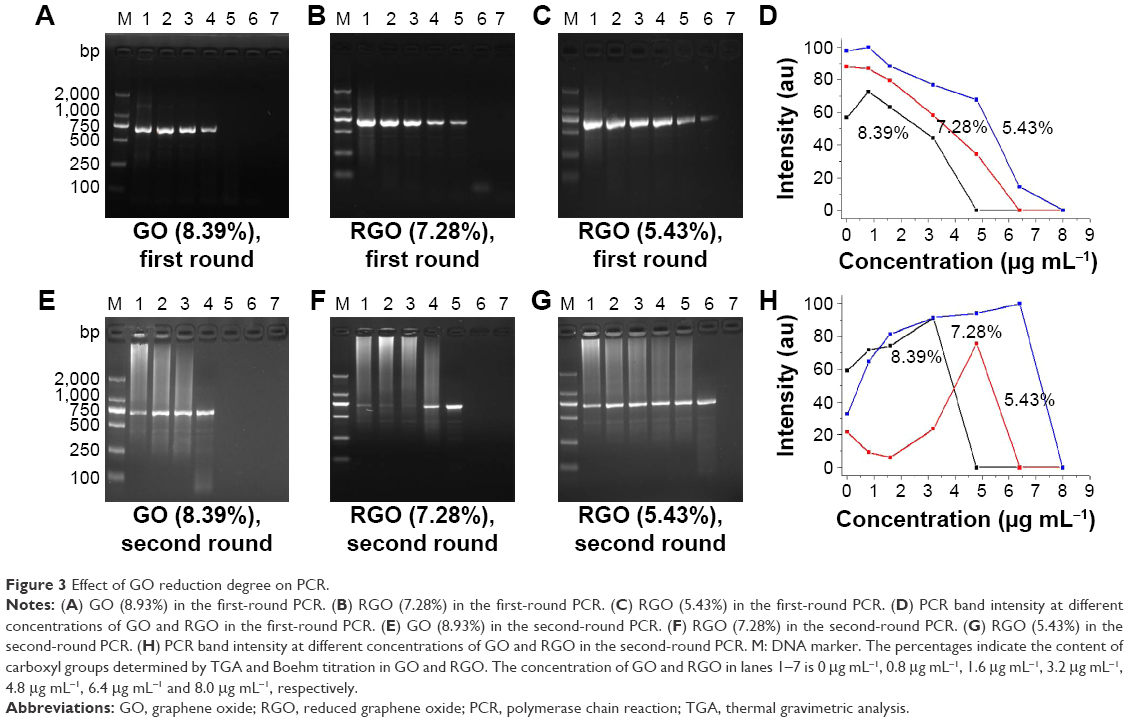 | Figure 3 Effect of GO reduction degree on PCR. |
The effect of GO surface modification on PCR
To further investigate the effect of GO surface modification on the specificity of PCR, we modified GO with negatively charged PAA, positively charged PAM, neutral PEG and zwitterionic pSB. In the first-round PCR, no smear bands were found for all samples, indicating good specificity of PCR (Figure 4A–E). In the second-round PCR, nonspecific smear appeared in the control experiments without additives, but the smears decreased with increasing the concentrations of GO derivatives, indicating that the specificity of PCR is enhanced in all GO derivative-assisted PCR systems. Compared to GO-PAA, GO-PAM and GO-PEG, GO-pSB has lesser smear bands (Figure 4F–J) and wider efficient concentration range (9.6–24.0 μg mL−1; Table S6), indicating that GO-pSB has a better performance to improve the specificity of PCR than other polymer-modified GOs. The ability to enhance the specificity of PCR increases in the following order: GO-PAA < GO-PAM < GO-PEG < GO-pSB. The results indicate that GO-pSB is superior to other polymer-modified GOs in enhancing the specificity of PCR. Table S6 compares the efficient concentration range for optimal specificity of PCR of GO, RGO, polymer-modified GOs and four polymers according to the results of the second-round PCR. Compared to RGO, GO-pSB has much better solubility. Meanwhile, it also has much wider efficient concentration range than GO and RGO.
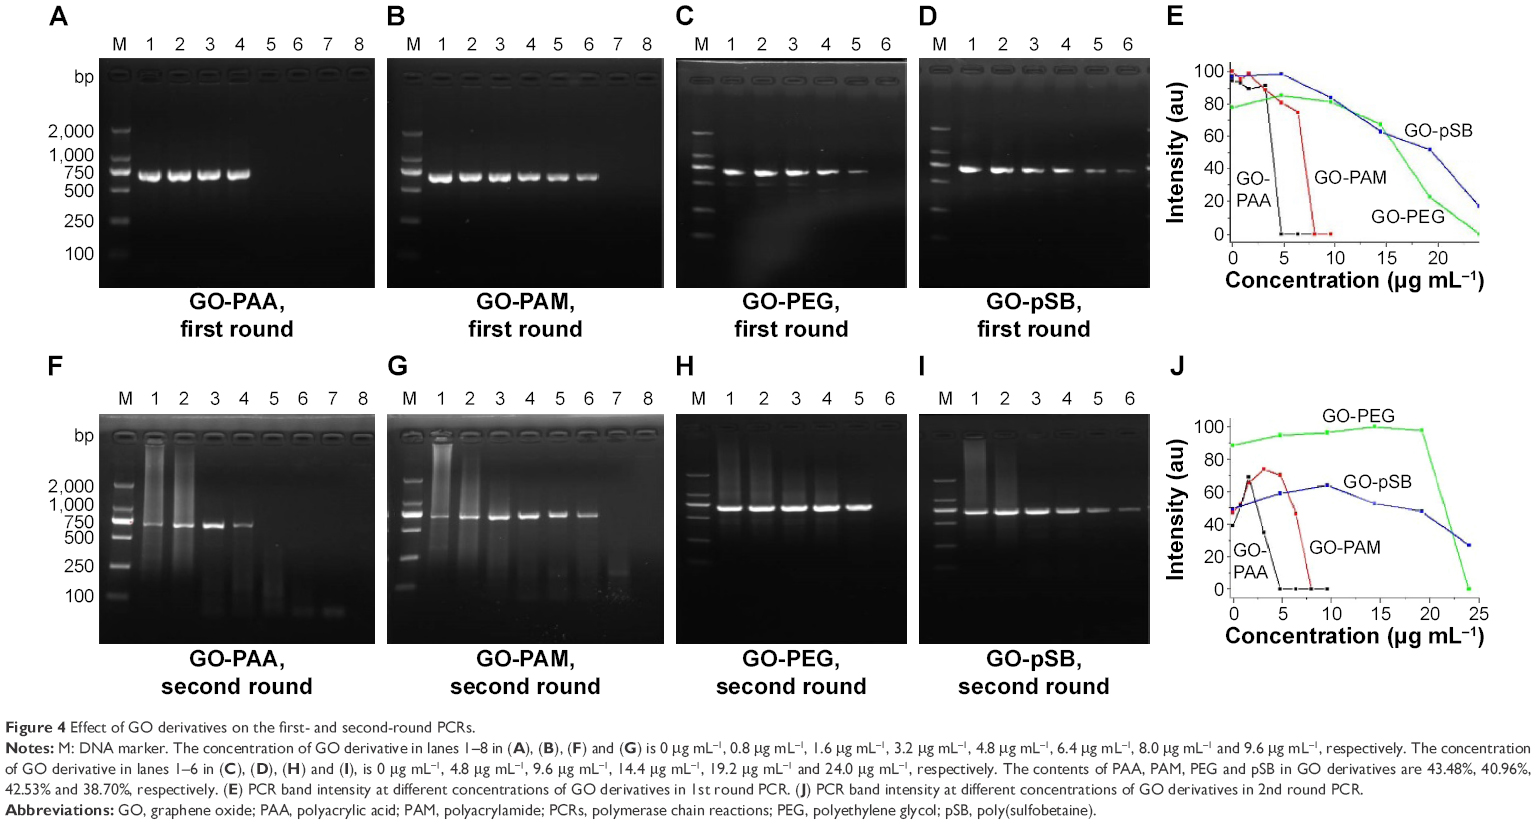 | Figure 4 Effect of GO derivatives on the first- and second-round PCRs. |
In order to confirm that enhancing the specificity of PCR results from the polymer-modified GOs and not from the polymers, we investigated the effect of bare polymers on the specificity of PCR without GO. The calculated amounts of polymers according to the TGA data of GO derivatives were added into PCR system. The results show that there is no change in the band (Figure S10). Only when the concentration of polymer was increased >1,000-fold from microgram per milliliter to milligram per milliliter, the specificity of PCR could be improved (Figure S11). These results indicate that enhancing the specificity of PCR results from the polymer-modified GO and not from the bare polymers. Based on previous results, GO is not a good enhancer in the specificity of PCR. Thus, enhancing the specificity of PCR by GO derivative is attributed to the combination or synergistic effect of GO and polymers.
Figure 5 shows that at high concentrations of GO or GO derivatives, the control bands (lane 1) are inhibited. In order to test if Pfu polymerase is being adsorbed onto the surfaces of GO and its derivatives, BSA was added into the PCR system inhibited by excess GO and GO derivatives. After the addition of BSA, all PCRs are recovered and the intensities of band increase with increasing concentration of BSA. The result is attributed to the competitive adsorption of BSA on the surface of GO and its derivatives. Thus, the adsorbed Pfu polymerase was released into the solution, resulting in the recovery of PCR. The results indicate that there is strong interaction between GO or GO derivatives and Pfu polymerase. We also incubated GO and its derivatives with Pfu polymerase for 1 hour in ice to allow sufficient absorbance of Pfu polymerase with GO or its derivatives. Then we added other PCR components and performed PCRs. Figure S12 confirms efficient PCR following adsorption of Pfu polymerase on GO or its derivatives.
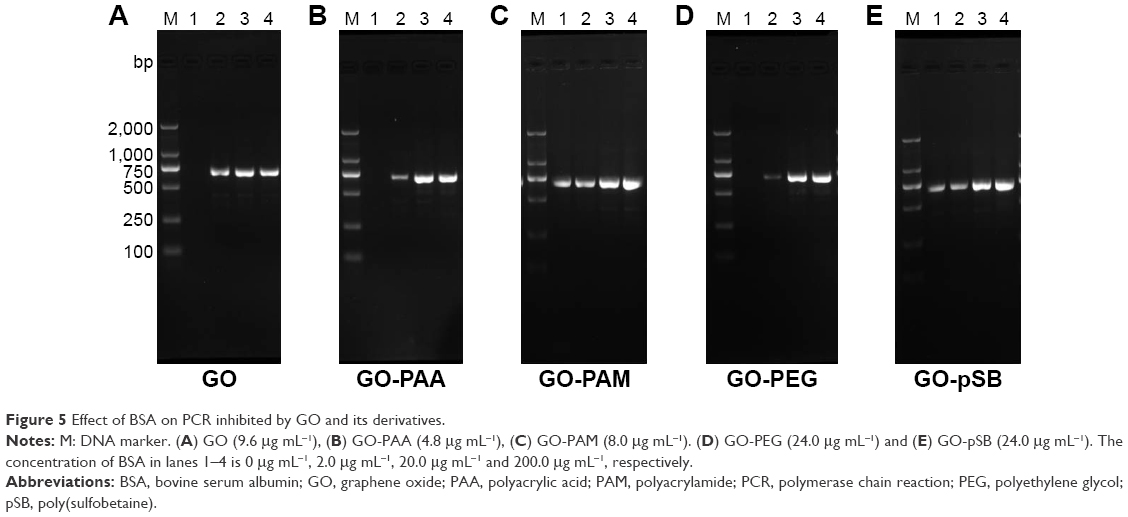 | Figure 5 Effect of BSA on PCR inhibited by GO and its derivatives. |
PCR was inhibited when the concentration of GO derivative was further increased (Figure 4). Each GO sheet can adsorb positively charged Pfu polymerase or Mg2+ due to its large surface area and many negatively charged carboxyl groups. Increasing the concentration of GO derivative will decrease the adsorption amount of Pfu polymerase and Mg2+ on single GO sheet, resulting in less PCR efficiency. When excess Mg2+ is added into the PCR system, more Mg2+ will be further adsorbed on negatively charged GO derivatives with Pfu polymerase to recover PCR. Figure 6 shows that the inhibited bands are recovered after the addition of 1–2 mM Mg2+. Therefore, the results further indicate that PCR will be inhibited if the Pfu polymerase and Mg2+ adsorbed on single GO derivative decrease.
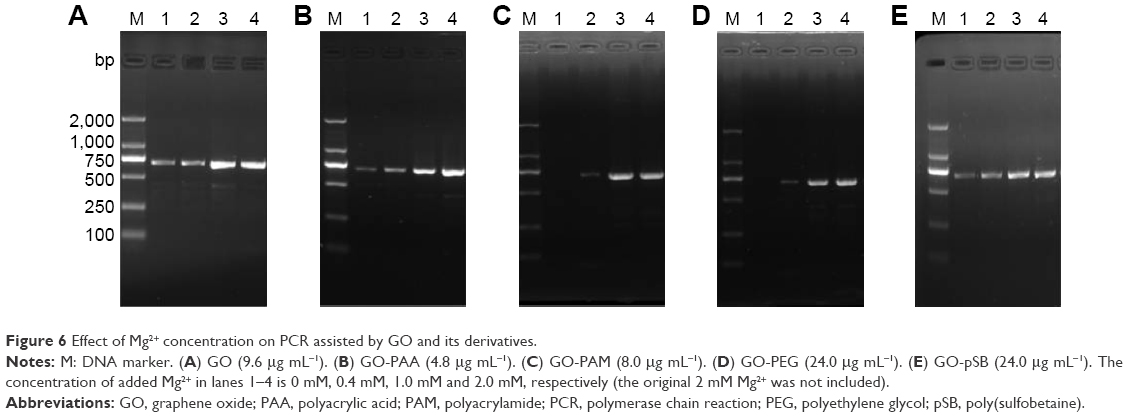 | Figure 6 Effect of Mg2+ concentration on PCR assisted by GO and its derivatives. |
Pfu polymerase possesses a proofreading activity and can be used instead of Taq polymerase to perform higher fidelity of DNA synthesis. To confirm whether GO or its derivatives would affect the fidelity of PCR, all PCR products in the absence or presence of GO and its derivatives were sequenced. The data confirm that GO and its derivatives have no effect on the fidelity of Pfu polymerase (Figure S13). The results further indicate that the specificity of PCR is enhanced and fidelity of Pfu polymerase is guaranteed in the presence of GO derivatives.
The application in clinical samples
Finally, GO derivatives were also used to enhance the specificity of PCR for amplifying the complicated clinic samples. Human blood genomic DNA was used as the template. A 324 bp fragment of the mitochondrial DNA was amplified. In the first- and second-round PCRs, no smear bands are observed for all samples, but the target band is weaker for the second-round PCR without GO derivative than that of the sample with GO derivatives (Figure 7). In the third-round PCR, there is a strong smear band for PCR without GO derivative and the target band becomes negligible. However, the target bands are still remarkable with low unspecific products in the presence of GO derivatives. Therefore, GO derivatives enhance the specificity of PCR for amplifying the complicated clinic samples. The results indicate that GO derivatives may have potential applications in clinical molecular diagnosis.
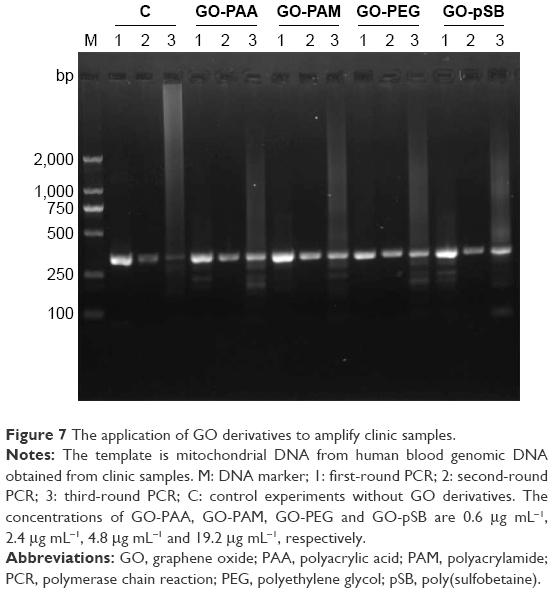 | Figure 7 The application of GO derivatives to amplify clinic samples. |
Simulation of the interaction between polymerase and polymer
It is very difficult to directly simulate the interaction between polymerase and polymer-modified GO. Thus, molecular dynamics simulation and molecular docking were used to study the possible interaction between the polymer and Pfu polymerase when GO was neglected for simplification. Pfu polymerase contains the following five domains: the N-terminal (residues 1–130 and 327–368), exonuclease (131–326), palm (369–450 and 501–588), fingers (451–500) and thumb domains (589–775) (Figure S14). The proofreading and polymerization mechanism are coordinated from the interactions between the loop (144–158) of the exonuclease domain and the positively charged edge of the thumb domain.48 Molecular docking showed that the binding sites of polymers were located at the exonuclease, thumb, palm and fingers domain by docking calculations (Figure S14). The binding affinities decreased in the following order: PAA > PAM > PEG > pSB (Table S8). The Coul Short Range energies fluctuated widely over the course of the 10 ns equilibration, reaching steady after ~4 ns (Figure S15A and B). Coul Short Range energy analysis indicates that there is a strong electrostatic interaction between PAA and Pfu (−2,248±203 kJ mol−1). The Coul Short Range energy of Pfu-PAM is −959±107 kJ mol−1, whereas PEG and pSB have nearly no electrostatic interaction with Pfu (Table S9). This order is consistent with the PCR results (Figure S11). The solvent-accessible surface area (SASA) is the surface area of a biomolecule that is accessible to a solvent. SASAs of Pfu-PEG and Pfu-pSB are almost equivalent in 10 ns (Figure S15C), indicating that PEG and pSB have similar influence on the enzyme–substrate binding. The minimum distance of PEG and Pfu fluctuates in a wide range, indicating higher flexibility of PEG than pSB (Figure S15D). Cumulative solvent distribution shows that the dipole area of the solvent molecule around PEG is much larger than that of pSB (Figure S15E and F), indicating that PEG and pSB affect solvent and protein in different levels. Molecular dynamics simulations showed that the Pfu–PAA complex (PAA: the brown strip below Pfu) had the strongest interaction followed by Pfu–PAM complex (PAM: the blue strip below Pfu) (Figure 8A and B). The interaction would be electrostatic and hydrophobic interactions and van der Waals’ force. Obviously, there is no direct interaction between Pfu polymerase and PEG, and Pfu polymerase and pSB (Figure 8C and D). These results are consistent with the Coul Short Range energy analysis. The results of molecular dynamics simulation and molecular docking are reasonable because PEG can reduce protein adsorption,49 and zwitterionic polymer has better ability to reduce protein adsorption than PEG.50 Binding affinities of polymers with Pfu polymerase (Table S8) also support the result.
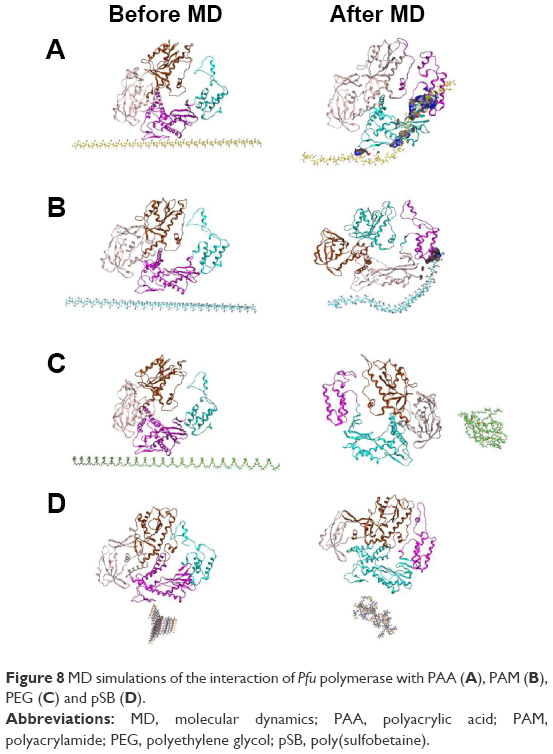 | Figure 8 MD simulations of the interaction of Pfu polymerase with PAA (A), PAM (B), PEG (C) and pSB (D). |
Besides the interaction between Pfu polymerase and polymer, negatively charged GO and positively charged Pfu polymerase also have strong electrostatic, hydrophobic and π–π stacking interactions. PEG and pSB will decrease these interactions due to reducing the adsorption of Pfu polymerase. Thus, GO-PEG and GO-pSB do not inhibit PCR in a wider range of concentration than GO-PAA and GO-PAM, which is consistent with experimental results (Figure 4). A little amount of positively charged Pfu polymerase still is adsorbed by negatively charged GO in GO-PEG and GO-pSB, even though PEG and pSB will reduce its adsorption. Thus, the specificity of PCR is also enhanced by GO derivative-assisted PCR. Therefore, these results further confirm that these GO derivatives can enhance the specificity of PCR.
Conclusion
We investigated the effect of GO with different sizes, reduction degrees and surface modifications on the specificity of PCR. The results indicate that L-GO and RGO is superior to S-GO and non-RGO in enhancing the specificity of PCR. For GO derivatives, the ability to enhance the specificity of PCR increases in the following order: GO-PAA < GO-PAM < GO-PEG < GO-pSB. Our study demonstrates that both GO and its surface properties affect the specificity of PCR. The GO derivatives may be used as efficient additives to enhance the specificity of PCR in clinical molecular diagnosis.
Acknowledgments
This study is supported by National Basic Research 973 Project (2014CB932004) and the National Natural Science Foundation of People’s Republic of China (31371005, 81571764 and 81171453). We thank Professor Zhiliang Ji from the State Key Laboratory of Cellular Stress Biology, School of Life Sciences, Xiamen University, for his suggestion in the simulation. We thank Doctor Yoav Peleg of the Weizmann Institute of Science, Israel, for his kind advice and revision of the language. We also thank Professor Chuanliu Wu and his PhD student Yaqi Chen for their kind help with all ITC measurements.
Author contributions
All authors contributed toward data analysis, drafting and critically revising the paper and agree to be accountable for all aspects of the work.
Disclosure
The authors report no conflicts of interest in this work.
References
Saiki RK, Scharf S, Faloona F, et al. Enzymatic amplification of b-globin genomic sequences and restriction site analysis for diagnosis of sickle cell anemia. Science. 1985;230(4732):1350–1354. | ||
Markus R, Robert Q, Hans-Jörg W, Hans L, Marie-Laure Y, Sylvia K. An efficient and economic enhancer mix for PCR. Biochem Biophys Res Commun. 2006;347(3):747–751. | ||
Zhang L, Cui XF, Schmitt K, Hubert R, Navidi W, Arnheim N. Whole genome amplification from a single cell: implications for genetic analysis. Proc Natl Acad Sci U S A. 1992;89(13):5847–5851. | ||
Michael RG, Joseph S. Chapter 7: polymerase chain reaction. Molecular Cloning: A Laboratory Manual. Fourth ed. Michael RG, Joseph S, editors New York, NY: Cold Spring Harbor; 2012:455–469. | ||
Saiki RK, Gelfand DH, Stoffel S, et al. Primer-directed enzymatic amplification of DNA. Science. 1988;239(4839):487–491. | ||
Chakrabarti R, Schutt CE. The enhancement of PCR amplification by low molecular-weight sulfones. Gene. 2001;274(1–2):293–298. | ||
Ely J, Reeves-Daniel A, Campbell M, Campbell ML, Kohler S, Stone WH. Influence of magnesium ion concentration and PCR amplification conditions on cross-species PCR. Biotechniques. 1998;25(1):38–42. | ||
Henke W, Herdel K, Jung K, Schnorret D, Loening SA. Betaine improves the PCR amplification of GC-rich DNA sequences. Nucleic Acids Res. 1997;25(19):3957–3958. | ||
Li H, Huang J, Lv J, et al. Nanoparticle PCR: nanogold-assisted PCR with enhanced specificity. Angew Chem Int Ed Engl. 2005;44(32):5100–5103. | ||
Khaliq A, Sonawane PJ, Sasi BK, et al. Enhancement in the efficiency of polymerase chain reaction by TiO2 nanoparticles: crucial role of enhanced thermal conductivity. Nanotechnology. 2010;21(25):255704. | ||
Nie L, Gao L, Yan X, Wang T. Functionalized tetrapod-like ZnO nanostructures for plasmid DNA purification, polymerase chain reaction and delivery. Nanotechnology. 2006;18(1):015101. | ||
Zhang ZZ, Wang MC, An HJ. An aqueous suspension of carbon nanopowder enhances the efficiency of a polymerase chain reaction. Nanotechnology. 2007;18(35):355706. | ||
Abdul KR, Kafafy R, Hamzah MS, Waleed FF. Enhancing the efficiency of polymerase chain reaction using graphene nanoflakes. Nanotechnology. 2012;23(45):455106. | ||
Wang L, Zhu Y, Jiang Y, et al. Effects of quantum dots in polymerase chain reaction. J Phys Chem B. 2009;113(21):7637–7641. | ||
Chen J, Cao X, Guo R, et al. A highly effective polymerase chain reaction enhancer based on dendrimer-entrapped gold nanoparticles. Analyst. 2012;137(1):223–228. | ||
Wang H, Wang L, Yuan L, Yang W, Brash JL, Chen H. Inhibitory effect of silicon nanowires on the polymerase chain reaction. Nanotechnology. 2012;23(36):365101. | ||
Yang W, Shen C, Ji Q, et al. Food storage material silver nanoparticles interfere with DNA replication fidelity and bind with DNA. Nanotechnology. 2009;20(8):085102. | ||
Ding K, Wang N, Yan Q, Guan W. Nanomaterials’s effect on polymerase chain reaction. Curr Nanosci. 2013;9(3):415–421. | ||
Jia J, Sun LP, Hu N, Huang GM, Weng J. Graphene enhances the specificity of the polymerase chain reaction. Small. 2012;8(13):2011–2015. | ||
Pan D, Mi L, Huang Q, Hu J, Fan C. Genetic analysis with nano PCR. Integr Biol. 2012;4(10):1155–1163. | ||
Ma L, He S, Huang J, Cao L, Yang F, Li L. Maximizing specificity and yield of PCR by the quantum dot itself rather than property of the quantum dot surface. Biochimie. 2009;91(8):969–973. | ||
Bai Y, Cui Y, Paoli GC, Shi C, Wang D, Shi X. Nanoparticles affect PCR primarily via surface interactions with PCR components: using amino-modified silica-coated magnetic nanoparticles as a main model. ACS Appl Mater Interfaces. 2015;7(24):13142–13153. | ||
Cao X, Shen M, Zhang X, Hu J, Wang J, Shi X. Effect of the surface functional groups of dendrimer-entrapped gold nanoparticles on the improvement of polymerase chain reaction. Electrophoresis. 2012;33(16):2598–2603. | ||
Cao X, Chen J, Wen S, Peng C, Shen M, Shi X. Effect of surface charge of polyethyleneimine-modified multiwalled carbon nanotubes on the improvement of polymerase chain reaction. Nanoscale. 2011;3:1741–1747. | ||
Tong W, Cao X, Wen S, et al. Enhancing the specificity and efficiency of polymerase chain reaction using polyethyleneimine-based derivatives and hybrid nanocomposites. Int J Nanomedicine. 2012;7:1069–1078. | ||
Kuila T, Bose S, Mishra AK, Khanraa P, Kimc NH, Lee JH. Chemical functionalization of graphene and its applications. Prog Mater Sci. 2012;57(7):1061–1065. | ||
Li C, Yang Y, Wu D, Li T, Yin Y, Li G. Improvement of enzyme-linked immunosorbent assay for the multicolor detection of biomarkers. Chem Sci. 2016;7:3011–3016. | ||
Huang Y, Li H, Fan Q, Wang L, Wang Y, Li G. Multifunctional nanocatalyst-based ultrasensitive detection of human tissue transglutaminase 2. Biosens Bioelectron. 2016;83(15):85–90. | ||
Gao T, Yang D, Ning L, Lei L, Ye Z, Li G. Ultrafine and well dispersed silver nanocrystals on 2D nanosheets: synthesis and application as a multifunctional material for electrochemical catalysis and biosensing. Nanoscale. 2014;6(24):14828–14835. | ||
Gao T, Liu F, Yang D, Yu Y, Wang Z, Li G. Assembly of selective biomimetic surface on an electrode surface: a design of nano–bio interface for biosensing. Anal Chem. 2015;87(11):5683–5689. | ||
Chen H, Ruckenstein E. Nanomembrane containing a nanopore in an electrolyte solution: a molecular dynamics approach. J Phys Chem Lett. 2014;5(17):2979–2982. | ||
Yang Q, Wang Z, Weng J. Self-assembly of natural tripeptide glutathione triggered by graphene oxide. Soft Matter. 2012;8:9855–9863. | ||
Dong J, Weng J, Dai L, Dong J, Weng J, Dai L. The effect of graphene on the lower critical solution temperature of poly(N-isopropylacrylamide). Carbon N Y. 2013;52:326–336. | ||
Khan U, O’Neill A, Porwal H, Peter M, Nawaz K, Coleman JN. Size selection of dispersed, exfoliated graphene flakes by controlled centrifugation. Carbon N Y. 2012;50(2):470–475. | ||
Dong J, Ding J, Weng J, Dai L. Graphene enhances the shape memory of poly (acrylamide-co-acrylic acid) grafted on graphene. Macromol Rapid Commun. 2013;34(8):659–664. | ||
Liu Z, Robinson JT, Sun X, Dai H. PEGylated nanographene oxide for delivery of water-insoluble cancer drugs. J Am Chem Soc. 2008;130(33):10876–10877. | ||
Boehm HP, Diehl E, Heck W, Sappok R. Surface oxides of carbon. Angew Chem Int Ed Engl. 1964;3(10):669–677. | ||
Van Der Spoel D, Lindahl E, Hess B, Groenhof G, Mark AE, Berendsen HJC. GROMACS: fast, flexible, and free. J Comput Chem. 2005;26(16):1701–1718. | ||
Huang J, MacKerell AD. CHARMM36 all-atom additive protein force field: validation based on comparison to NMR data. J Comput Chem. 2013;34(25):2135–2145. | ||
Vilar S, Cozza G, Moro S. Medicinal chemistry and the molecular operating environment (MOE): application of QSAR and molecular docking to drug discovery. Curr Top Med Chem. 2008;8(18):1555–1572. | ||
Trott O, Olson AJ. AutoDock Vina: improving the speed and accuracy of docking with a new scoring function, efficient optimization, and multithreading. J Comput Chem. 2010;31(2):455–461. | ||
Lu C, Yang H, Zhu C, Chen X, Chen G. A graphene platform for sensing biomolecules. Angew Chem. 2009;121(26):4879–4881. | ||
Pan J, Li H, Cao X, et al. Nanogold-assisted multi-round polymerase chain reaction (PCR). J Nanosci Nanotechnol. 2007;7(12):4428–4433. | ||
Guan G, Zhang S, Liu S, et al. Protein induces layer-by-layer exfoliation of transition metal dichalcogenides. J Am Chem Soc. 2015;137(19):6152–6155. | ||
Zhang Y, Zhang J, Huang X, Zhou X, Wu H, Guo S. Assembly of graphene oxide–enzyme conjugates through hydrophobic interaction. Small. 2012;8(1):154–159. | ||
Chervenak MC, Toone EJ. Calorimetric analysis of the binding of lectins with overlapping carbohydrate-binding ligand specificities. Biochemistry. 1995;34(16):5685–5695. | ||
Cooper A. Heat capacity effects in protein folding and ligand binding: a re-evaluation of the role of water in biomolecular thermodynamics. Biophys Chem. 2005;115(2–3):89–97. | ||
Kim S, Kim D, Kim J, Kangd L, Cho H. Crystal structure of Pfu, the high fidelity DNA polymerase from Pyrococcus furiosus. Int J Biol Macromol. 2008;42(4):356–361. | ||
Gooth NW, Hlady V. Two surface gradients of polyethylene glycol for a reduction in protein adsorption. Surf Innov. 2015;3(3):172–180. | ||
Keefe AJ, Jiang SY. Poly(zwitterionic)protein conjugates offer increased stability without sacrificing binding affinity or bioactivity. Nat Chem. 2012;4(1):59–63. |
 © 2016 The Author(s). This work is published and licensed by Dove Medical Press Limited. The full terms of this license are available at https://www.dovepress.com/terms.php and incorporate the Creative Commons Attribution - Non Commercial (unported, v3.0) License.
By accessing the work you hereby accept the Terms. Non-commercial uses of the work are permitted without any further permission from Dove Medical Press Limited, provided the work is properly attributed. For permission for commercial use of this work, please see paragraphs 4.2 and 5 of our Terms.
© 2016 The Author(s). This work is published and licensed by Dove Medical Press Limited. The full terms of this license are available at https://www.dovepress.com/terms.php and incorporate the Creative Commons Attribution - Non Commercial (unported, v3.0) License.
By accessing the work you hereby accept the Terms. Non-commercial uses of the work are permitted without any further permission from Dove Medical Press Limited, provided the work is properly attributed. For permission for commercial use of this work, please see paragraphs 4.2 and 5 of our Terms.