")
Back to Journals » International Journal of Nanomedicine » Volume 11
Enhancing the in vivo transdermal delivery of gold nanoparticles using poly(ethylene glycol) and its oleylamine conjugate
Authors Hsiao PF, Peng S, Tang T, Lin S, Tsai H
Received 16 December 2015
Accepted for publication 29 February 2016
Published 2 May 2016 Volume 2016:11 Pages 1867—1878
DOI https://doi.org/10.2147/IJN.S102599
Checked for plagiarism Yes
Review by Single anonymous peer review
Peer reviewer comments 2
Editor who approved publication: Professor Lei Yang
Pa Fan Hsiao,1–3 Sydney Peng,4 Ting-Cheng Tang,4 Shuian-Yin Lin,5 Hsieh-Chih Tsai4
1Department of Dermatology, Mackay Memorial Hospital, 2Mackay Medicine, Nursing and Management College, 3Mackay Medical College, New Taipei City, 4Graduate Institute of Applied Science and Technology, National Taiwan University of Science and Technology, Taipei, 5National Applied Research Laboratories, Instrument Technology Research Center, Hsinchu, Taiwan
Abstract: In this study, we investigated the effect of (ethylene glycol) (PEG) and PEG–oleylamine (OAm) functionalization on the skin permeation property of gold nanoparticles (GNS) in vivo. Chemisorption of polymers onto GNS was verified by a red shift in the ultraviolet–visible spectrum as well as by a change in the nanoparticle surface charge. The physicochemical properties of pristine and functionalized nanoparticles were analyzed by ultraviolet–visible spectroscopy, zeta potential analyzer, and transmission electron microscopy. Transmission electron microscopy revealed that the interparticle distance between nanoparticles increased after GNS functionalization. Comparing the skin permeation profile of pristine and functionalized GNS, the follicular deposition of GNS increased twofold after PEG–OAm functionalization. Moreover, PEG- and PEG–OAm-functionalized nanoparticles were able to overcome the skin barrier and deposit in the deeper subcutaneous adipose tissue. These findings demonstrate the potential of PEG- and PEG–OAm-functionalized GNS in serving a multitude of applications in transdermal pharmaceuticals.
Keywords: skin penetration, amphiphilic copolymer, gold nanoparticle, oleylamine, poly(ethylene glycol)
Introduction
The use of nanotechnology in the form of nanomedicine for prevention, diagnosis, and treatment of diseases, including cancer, is one branch of this fast developing field.1 Breakthroughs in particle size control and nanoparticle modification have created the possibility of designing nanoparticles that hold enormous potentials in drug delivery. Increased therapeutic efficacy is often achieved by improving selectivity toward target cells and preventing toxic effects on normal cells.2 However, coupled with advancements in nanomedicine are critiques on the safety thereto. With direct systemic introduction, systemic and local toxicities are of tremendous concern as nanoparticles may aggregate and cause subsequent tissue inflammation.3 Gold nanoparticles (GNS) in the size range of 18–37 nm caused major damage to the liver, spleen, and lungs,4 while PEG-functionalized GNS accumulated in the liver after injection and inflicted both acute inflammation and cellular damage.5 On the contrary, transdermal delivery exhibits relatively lower risks of systemic toxicity due to its controlled depot effect, which permits the use of relatively potent drugs.6,7 Furthermore, transdermal delivery is particularly attractive because of its large surface area, ease of administration, noninvasiveness, and ability to bypass the first-pass effect.8
In transdermal delivery, drug permeability is challenged by the many layers of the skin. The stratum corneum (SC), a 10–20 nm skin layer composed of tightly packed sheets of metabolically inactive cells surrounded by a lipid extracellular matrix, acts as the foremost barrier against transdermal delivery.9,10 Physicochemical properties, such as size, surface charge, and material composition, are factors that dictate the permeation ability of nanoparticles.11,12 Because cells are so densely packed inside the hydrophobic SC, passage of charged, hydrophilic, and large drug molecules is extremely limited.13 Nevertheless, hydrophilic pharmaceutical compounds can enter the skin through hair follicles and tight junctions, which are skin barrier regulators in the viable epidermis. The follicular delivery route has been an attractive target for particulate drug delivery systems as they increase drug permeation and act as depot for sustained therapeutics.14,15 On the other hand, multiple physical and chemical skin enhancers have been explored, ranging from microneedle technology, which deliberately creates microsized holes in the SC,16–18 to the addition of amines and fatty acids to modify SC properties so they become more prone to permeation.19,20 More specifically, enhancing SC permeability by targeting specific SC lipids has long been the strategy used in the design of transdermal systems.21,22
Silver- and gold-based metal nanoparticles have been shown in the literature to permeate the skin. However, due to different experimental parameters and the limited number of studies, a definite conclusion regarding their permeation ability cannot be drawn with simplicity. By using a Franz cell setup, one group reported that polyvinylpirrolidone-coated silver nanoparticles entered intact skin while permeating damaged skin in vitro.23 GNS, on the other hand, have gained considerable attention because of their simple preparation, controllable size and distribution, biocompatibility, and functionalizing potential.24 Furthermore, GNS demonstrate distinct electrical and chemical properties, such as high electron density, which make them suitable for advanced applications, such as biosensing, diagnostic imaging, and photodynamic therapy.25–27 A recent study fully evaluated the in vitro skin permeation of pegylated and cell-penetrating peptide-modified GNS through different skin layers using transmission electron microscopy (TEM).28
Despite numerous discussions on the in vitro skin permeation of GNS, those focusing on their in vivo permeation are relatively limited.28–31 Studies of GNS as contrasting agents after topical application are available for several animal models.32,33 However, the emphasis of these studies is on increasing the optical intensity rather than drawing conclusions on their unassisted permeation properties. This study sets out to investigate the in vivo permeation of GNS functionalized with an amphiphilic permeation enhancer. Here, we used 10 nm GNS as the starting material and amphiphilic poly(ethylene glycol) (PEG)–oleylamine (OAm) as the chemical enhancer. The amphiphilic PEG–OAm was prepared by reaction between the carboxyl group of PEG and the terminal amine group of OAm, as shown in Figure 1. The physical, chemical, and permeation properties of pristine, PEG-functionalized, and PEG–OAm-functionalized derivatives were investigated. Localization of nanoparticles was observed by fluorescent microscopy and TEM. This study points to provide insights into understanding the effects of PEG and OAm on skin permeation in vivo and presents the system as a potential transdermal carrier.
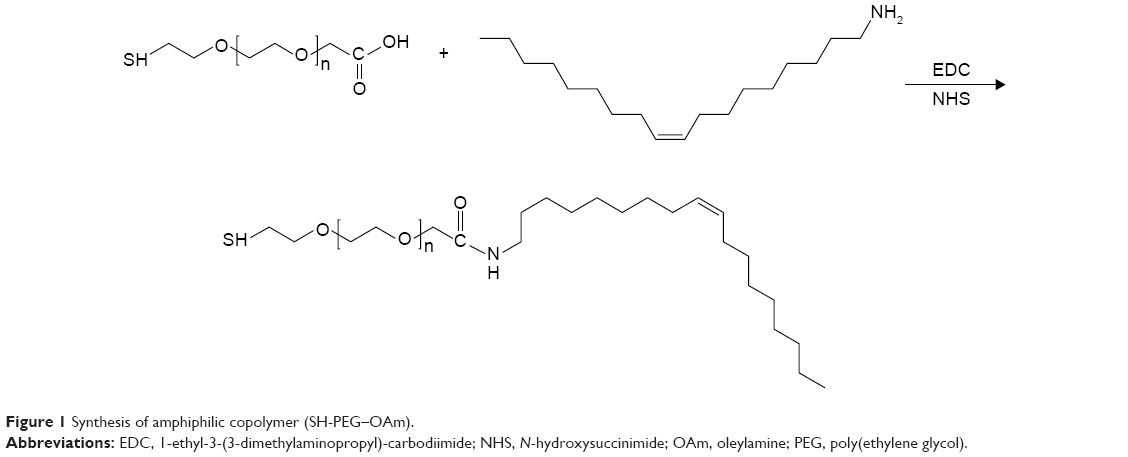 | Figure 1 Synthesis of amphiphilic copolymer (SH-PEG–OAm). |
Materials and methods
Materials
Citric ion-stabilized GNS (10 nm), PEG 2-mercaptoethyl ether acetic acid (HS-PEG-COOH) (MW ~2,100), OAm, N-hydroxysuccinimide (NHS), 1-ethyl-3-(3-dimethylaminopropyl)-carbodiimide (EDC), glutaraldehyde solution, fluorescein isothiocyanate (FITC), osmonium tetraoxide solution, uranyl acetate, and lead citrate were obtained from Sigma-Aldrich Co. (St Louis, MO, USA). Paraformaldehyde and epoxy resin embedding medium were purchased from Acros (Geel, Belgium) and Electron Microscopy Sciences (Hatfield, PA, USA), respectively. All other chemicals were used as received unless otherwise specified. Ethical approval was not required or sought from the IRB of Mackay Memorial Hospital, Taiwan because the experiments are not performed on humans.
Coupling of HS-PEG-COOH with OAm
PEG–OAm was prepared by EDC/NHS coupling chemistry where the PEG carboxylic acid was activated with EDC and subsequently reacted with the primary amine on OAm to afford an amide bond. Briefly, HS-PEG-COOH, OAm, EDC, and NHS were reacted overnight in phosphate-buffered solution at a molar ratio of 1:1:1:1. Upon completion of reaction, excess EDC/NHS and residual OAm were removed by dialysis (molecular cutoff [MWCO]: 1,000 Da).
PEG–OAm coupling was verified by 1H nuclear magnetic spectroscopy (NMR) and Fourier transformed infrared spectroscopy (FT-IR). Unreacted OAm, PEG, and PEG–OAm were dissolved in dimethyl sulfoxide-d6 and analyzed by 1H NMR using an AVANCE III HD 600 MHz spectrometer (Bruker Corporation, Billerica, MA, USA). FT-IR samples were pared on CaF2 disks using the drop casting method and analyzed on a Nicolet 6700 spectrometer (Thermo Fisher Scientific, Waltham, MA, USA).
Surface modification of GNS
PEG functionalization of GNS was performed by direct mixing of GNS dispersion with PEG aqueous solution. In brief, a pristine GNS dispersion at 1 mM (4 mL) was added to a 1 mM HS-PEG-COOH aqueous solution (1 mL) under constant stirring and reacted overnight at 25°C. Excess PEG was removed by dialysis against deionized water (MWCO: 3,500 Da) for 24 hours to afford GNS–PEG. A similar procedure was used to synthesize PEG–OAm-functionalized GNS. In short, a pristine GNS dispersion (1 mM) was added to a 4 mM of PEG–OAm aqueous solution and stirred overnight at 25°C to provide PEG–OAm-functionalized GNS (GNS–PEG–OAm) in aqueous solution. Unreacted PEG–OAm was removed by dialysis (MWCO: 3,500 Da).
Verification of PEG and PEG–OAm functionalization of GNS
Transparent dispersions of pristine GNS, GNS–PEG, and GNS–PEG–OAm were deposited on CaF2 disks by the drop casting method and air-dried for 12 hours prior to FT-IR analysis.
Particle size, particle morphology, and zeta potential
The morphology and dispersion of pristine and functionalized GNS were visualized using TEM (Hitachi H-7000; Hitachi Ltd., Tokyo, Japan). For sample preparation, 200 mM nanoparticle dispersions (5 mL) were drop casted onto copper grids (300 mesh) and air-dried. The hydrodynamic particle size, polydispersity index, and surface charge of nanoparticles were recorded using a Horiba SZ-100 system (HORIBA Ltd., Kyoto, Japan). Each zeta potential value (mV) represents an average of three runs of ten measurements each.
Optical property analysis
Optical property of the nanoparticles was studied by ultraviolet–visible (UV–Vis) spectroscopy. After centrifugation of GNS suspensions, collected nanoparticles were redispersed in deionized water and transferred to quartz cuvettes. Absorbance spectra were recorded between 200 nm and 1,000 nm using a V-670 spectrophotometer (Jasco, Tokyo, Japan).
Preparation and detection of FITC-labeled GNS
In order to visualize the location of GNS after topical application, GNS were labeled with FITC. Briefly, FITC solution at pH 9 was reacted with the various GNS dispersions for 12 hours at 4°C. The products were dialyzed against deionized water (MWCO: 3,500 Da) for 24 hours to remove unreacted FITC. Fluorescent intensity was confirmed using an F-7000 spectrometer (Hitachi Ltd.).
In vivo permeation of GNS
Animal studies were conducted at Mackay Memorial Hospital (Taipei, Taiwan) using three Sprague Dawley rats weighing 5,000–6,000 g. For animal experiments, Institutional Animal Care and Use Committee (IACUC) guidelines were followed. Anesthesia was induced by intraperitoneal injection of Zoletil (40 mg/kg). Dorsal hair was clipped, and dressings presoaked with 20 μL FITC-labeled GNS (30 nM) were topically applied onto test areas (2×2 cm) for 24 hours. Three different formulations, pristine GNS, GNS–PEG, and GNS–PEG–OAm, were applied to each animal. Test animals were sacrificed by CO2 asphyxiation, and the test areas were washed with phosphate-buffered saline (PBS) prior to incision. The collected skin tissues were washed with PBS again and fixed with 4% paraformaldehyde (0.1 M PBS, pH 7.4) for 24 hours at 4°C.
Tissue samples were removed from paraformaldehyde and dehydrated in 30% sucrose until they sank to the bottom of the vial. Next, the samples were washed three times with PBS and stored in embedding cassettes overnight at −20°C before they were embedded in O.C.T (Tissue-Tek) and frozen at −18°C for 20 minutes. Frozen samples were sectioned perpendicular to the knife from the hypodermis up through the epidermal layers to prevent contamination from surface to deeper regions. The thickness of confocal laser scanning microscopy (CLSM) samples was ~30–60 μm. Sections were mounted onto glass slides, and the relative permeation profile was observed by CLSM (TCS SP2; Leica Microsystems, Wetzlar, Germany). A series of five random CSLM images were taken, analyzed, and averaged. Leica Application Suite X provided by Leica Microsystems was used to extract the z-axis fluorescence intensity profile from the selected region of interest.
Samples for TEM analysis were stained with OsO4 and dehydrated prior to infiltration using epoxy resin. Samples were cured, and 100 nm thick sections were cut using an ultramicrotom (EM UC7; Leica Microsystems), mounted on copper TEM grids, and stained with uranyl acetate and lead citrate for 20 minutes and 5 minutes, respectively. The deposition of nanoparticles in the subcutaneous adipose tissue was visualized.
Results and discussion
Coupling of SH-PEG-COOH with OAm
Figure 2 shows the 1H NMR spectrum of PEG–OAm with ten characteristic signals observed. In particular, a triplet was detected between 0.83 ppm and 0.86 ppm (peak a), corresponding to the methyl group of OAm. Signals at 1.23–1.33 ppm (t, peaks b), 1.93–1.99 ppm (m, peak c), and 2.71 ppm (t, peak e) are attributed to OAm methylenic protons. One multiplet was recorded at 5.31–5.36 ppm, which is consistent with the methinic protons of OAm (m, peak E). In addition, signals at 2.28–2.29 ppm (m, peak 1), 2.61–2.64 ppm (m, peak 2), 3.5 ppm (m, peak 3), 3.89–3.91 ppm (t, peak 4), and 3.9 ppm (s, peak 5) may be assigned to PEG methylenic protons.
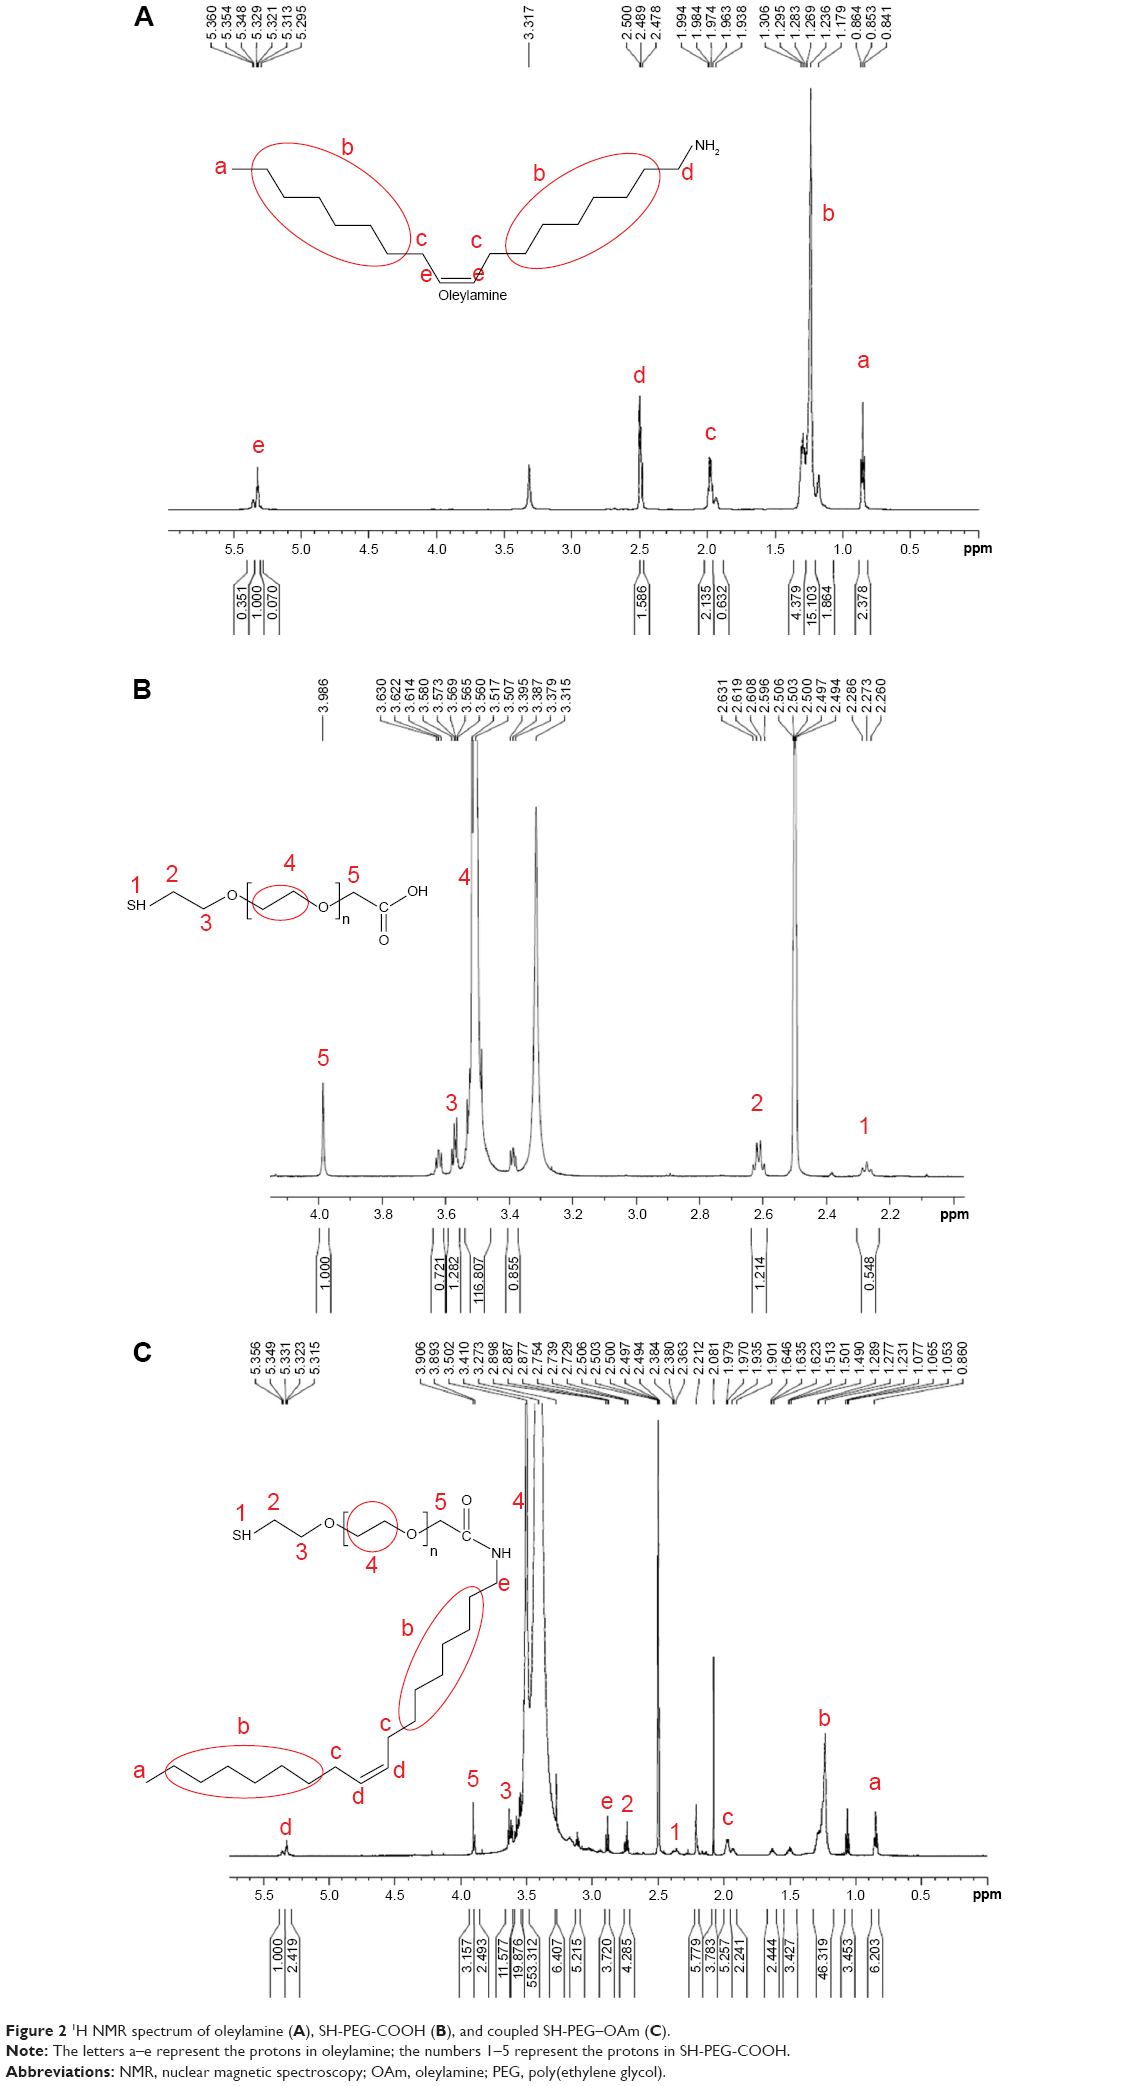 | Figure 2 1H NMR spectrum of oleylamine (A), SH-PEG-COOH (B), and coupled SH-PEG–OAm (C). |
Figure 3 represents the FT-IR spectra of the starting materials and PEG–OAm. Distinct absorption peaks corresponding to terminal functional groups are visible at 3,300–3,500 cm−1 (–OH) for PEG as well as at 3,400 cm−1 and 3,250 cm−1 (–NH2) for OAm prior to reaction. Carbonyl absorption at 1,700 cm−1 confirms the successful coupling of PEG and OAm through amide bond formation. Emergence of the NH bending vibration at 1,590 cm−1 and disappearance of –OH and –NH2 vibrations further validate PEG–OAm coupling. These observations indicate that PEG–OAm composed of both PEG and OAm domains.
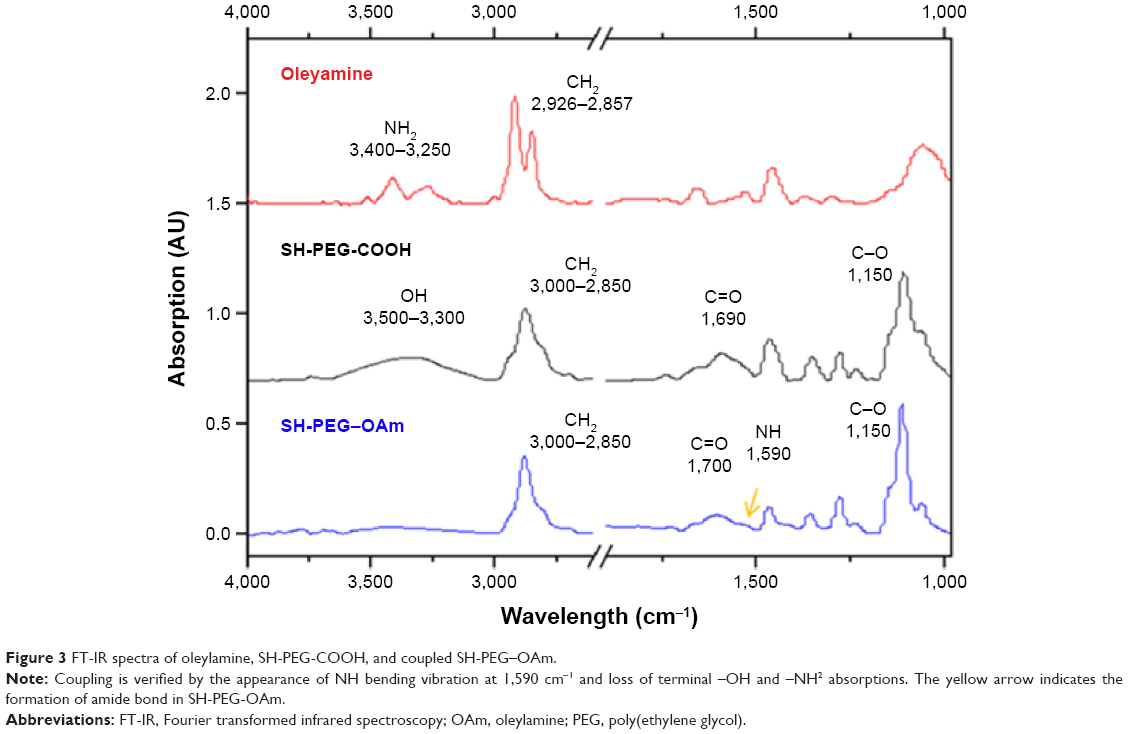 | Figure 3 FT-IR spectra of oleylamine, SH-PEG-COOH, and coupled SH-PEG–OAm. |
Characterization of pristine and functionalized GNS
FT-IR spectra of pristine GNS, GNS–PEG, and GNS–PEG–OAm are shown in Figure 4. For pristine GNS, characteristic absorption bands at 1,700–1,750 cm−1 and 3,450 cm−1 correspond to –COO−, C=O, and –OH groups, respectively, in the surface-stabilizing citric acids. Reaction with SH-PEG-COOH resulted in the appearance of C=O and C–O stretching bands at 1,690 cm−1 and 1,150 cm−1, respectively. The strong absorption peak at 2,850 cm−1 represents CH2 stretching frequency of PEG and verifies the successful functionalization of PEG onto GNS surface. Furthermore, the disappearance of the –OH stretching band at 3,300–3,500 cm−1 of carboxyl group of PEG suggests the formation of PEG-functionalized GNS. This functionalization process was driven by the high affinity of thiol groups toward gold surfaces, forming Au–sulfur bonds. Similarly, PEG–OAm-functionalized GNS exhibited characteristic absorption bands of PEG–OAm at 1,690 cm−1 (C=O) and 1,150 cm−1 (C–O). The –NH bending vibration at 1,590 cm−1 confirms PEG–OAm conjugation onto GNS.
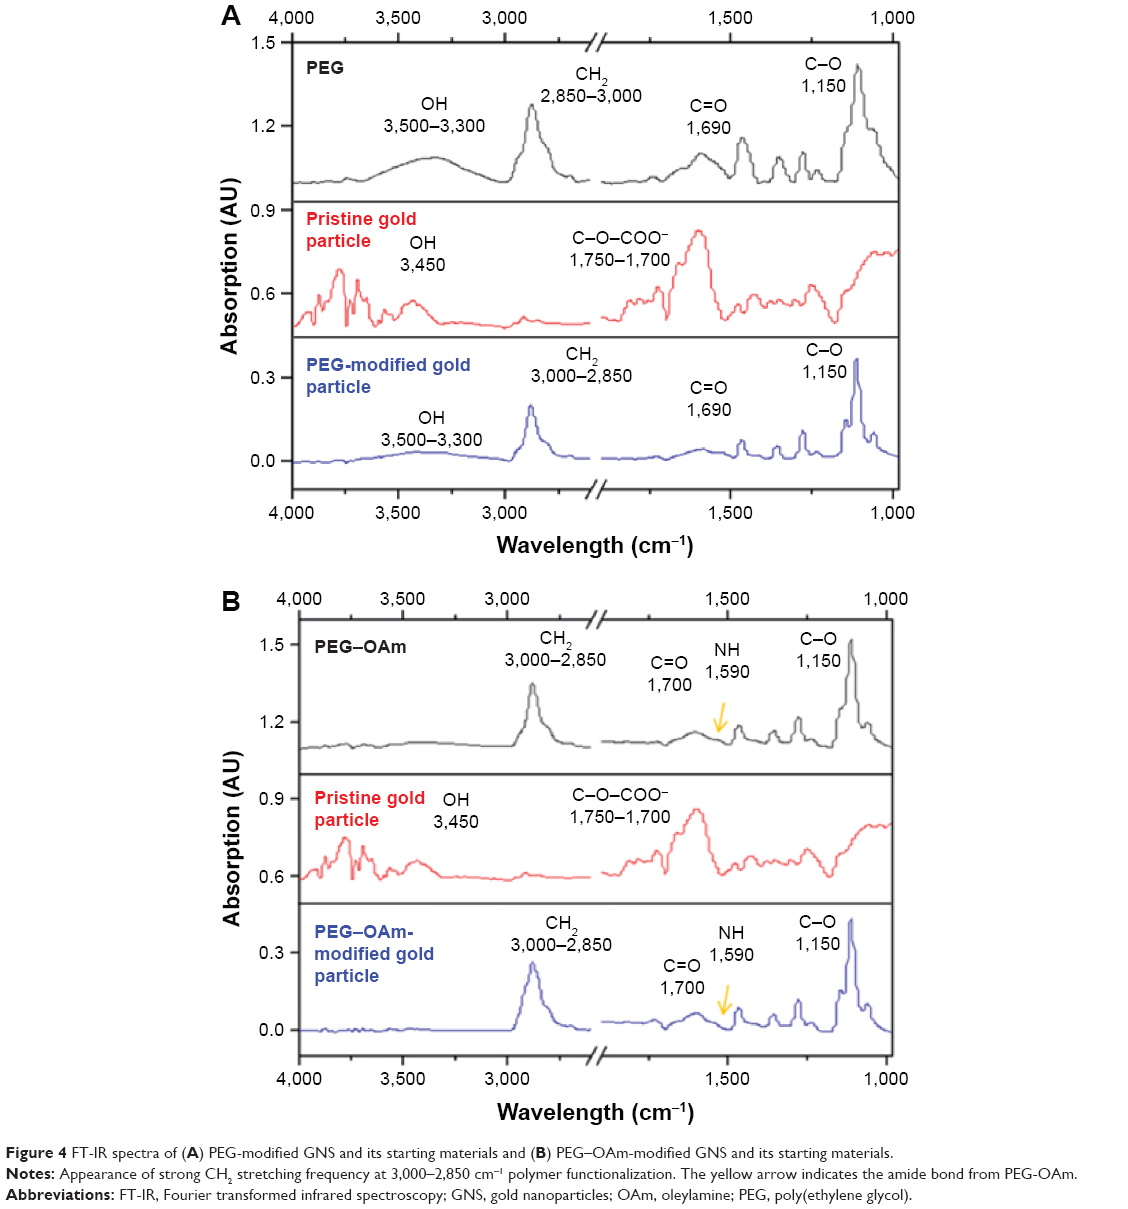 | Figure 4 FT-IR spectra of (A) PEG-modified GNS and its starting materials and (B) PEG–OAm-modified GNS and its starting materials. |
Particle morphology, zeta potential, hydrodynamic size, and UV–Vis absorption
As GNS have relatively high electron density, they are excellent probes for electron microscopy, and their morphology can be assessed directly by TEM, as shown in Figure 5. All nanoparticles were spherical in shape with diameters of ~10 nm. The size of GNS, as observed under TEM, did not increase after functionalization since only the gold core is visible at the acceleration voltage used.34 As shown in Figure 5A and B, interparticle distance increased with PEG functionalization, which provided a protective layer around the nanoparticle to allow free dispersion in water (Figure 5B).35 Incorporation of hydrophobic OAm did not compromise dispersity and provided highly monodispersed nanoparticles, thereby increasing the number of free nanoparticles available for interacting with biological membranes (Figure 5C).36 Since the PEG–OAm is an amphiphilic copolymer, it still can disperse well in water. The OAm self-assembled and attached to the hydrophobic surface of GNS and then simultaneously possessed PEG segment located at the exterior part. A similar system was also reported in our previous study.37 The dispersion morphology of PEG–OAm functionalization of GNS is shown in Figure 5D.
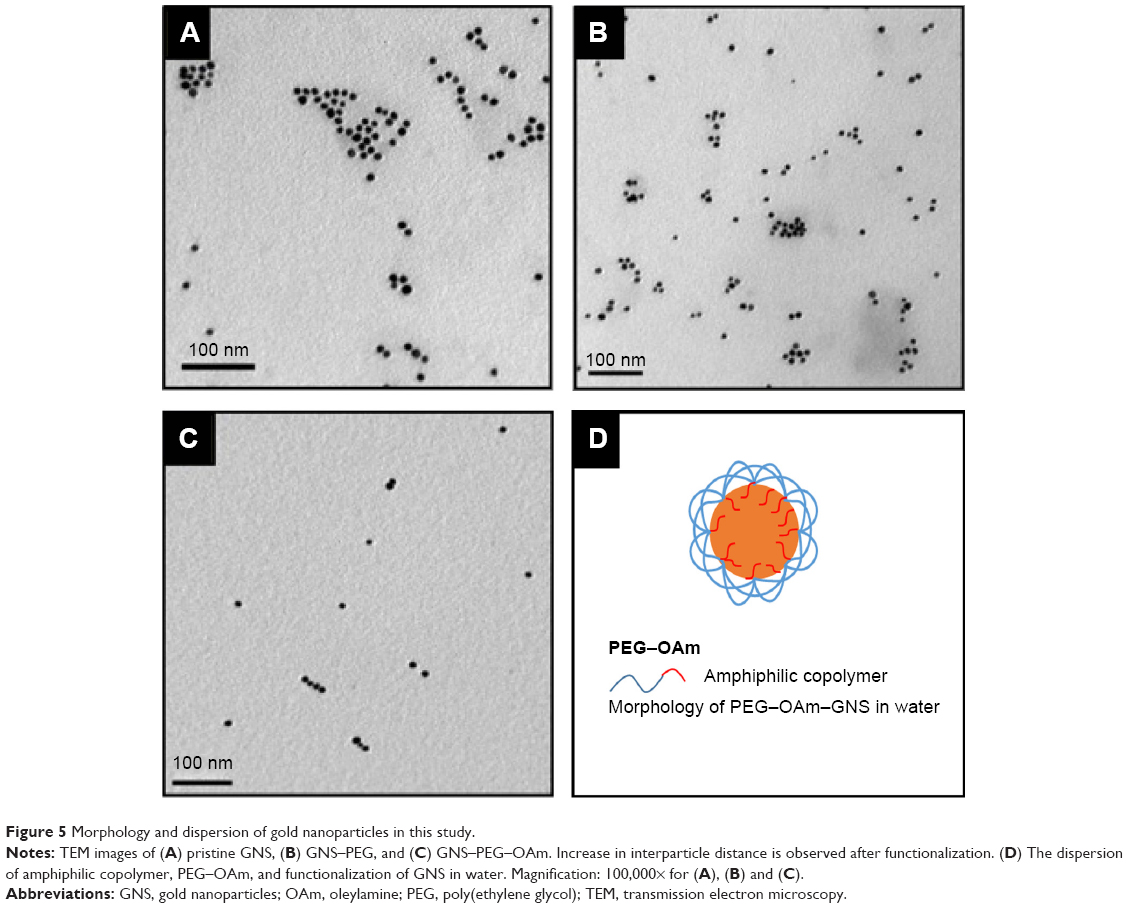 | Figure 5 Morphology and dispersion of gold nanoparticles in this study. |
As shown in Figure 6A, pristine GNS are negatively charged due to surface citrates as stabilizers. After PEG functionalization, GNS zeta potential increased from −70.21±2.0 mV to −28.53±1.4 mV, a result of PEG shielding the negatively charged citrate ions. Functionalization with PEG–OAm further increased the surface charge to +10.1±1.7 mV. These results confirm the stable incorporation of PEG and PEG–OAm by formation of thiol–Au bonds.
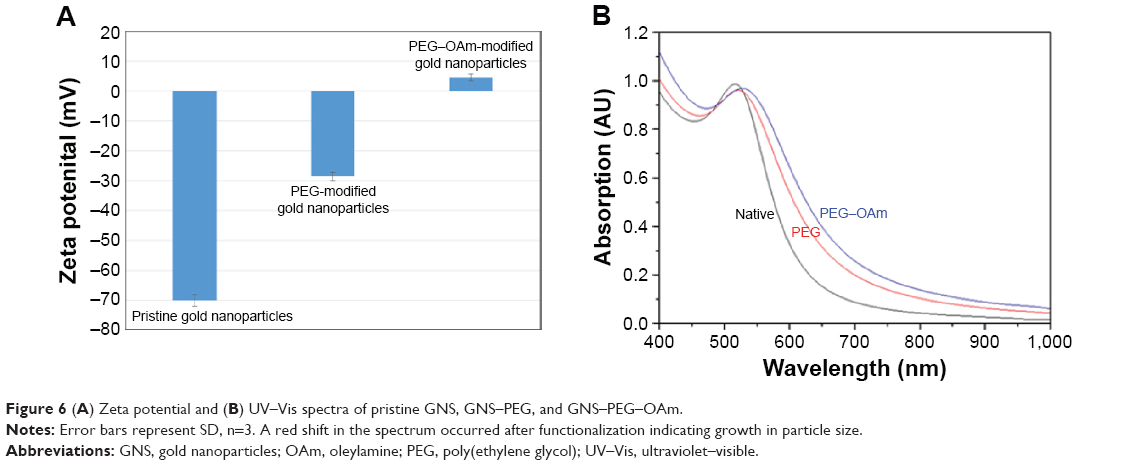 | Figure 6 (A) Zeta potential and (B) UV–Vis spectra of pristine GNS, GNS–PEG, and GNS–PEG–OAm. |
The dynamic light scattering size and polydispersity index were also confirmed by dynamic light scattering (Table 1). The results indicated that PEG-modified GNS exhibited a large hydrodynamic diameter. For PEG–OAm GNS, the hydrodynamic size slightly reduced when compared with PEG-modified GNS. It is because that the hydrophobic interaction between the gold surface and OAm segment results in the decrease in hydrodynamic particle size. This result is also consistent with the expected morphology of PEG–OAm GNS in water. In addition, pristine GNS, PEG–GNS, and PEG–OAm GNS exhibited good polydispersity index. Since absorption bands are directly related to the aspect ratio of metal nanoparticles, UV–Vis is most often used for GNS characterization. As shown in Figure 6B, a red shift of surface plasmon resonance (SPR) occurred after PEG and PEG–OAm functionalization, which indicates particle size increase due to formation of a protective layer on the surface of GNS. This is concurrent with findings in TEM. Size-related SPR shift due to changes in electromagnetic interactions between GNS and incident of light is described by the Mie theory.38 The bulky PEG layer on GNS elicited a 2 nm red shift in the main localized SPR. Furthermore, the narrow plasmon band at 532 nm and the lack of absorbance peak >600 nm also indicate uniform size distribution and stable dispersion without particle aggregation, respectively.
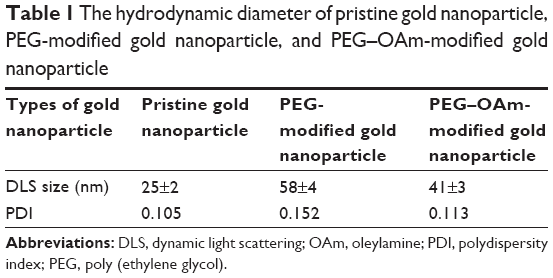 | Table 1 The hydrodynamic diameter of pristine gold nanoparticle, PEG-modified gold nanoparticle, and PEG–OAm-modified gold nanoparticle |
In vivo skin permeation assessment
Confocal microscopy was used to visualize fluorescein distribution in the skin layers after pristine GNS, GNS–PEG, and GNS–PEG–OAm applications. CLSM is a classic yet valuable technique that collects morphological information within cells and tissues. A thorough discussion of the application of this technique on evaluating nanoparticle skin permeation has been previously discussed.39 The FITC-labeled nanoparticles exhibited excitation and emission wavelengths of 492 nm and 510 nm, respectively, as determined by fluorescent spectroscopy.
Cross-section images perpendicular to the skin facilitate the evaluation of GNS permeability into rat skin by observing the distribution pattern of labeled GNS in deep regions of excised skin, including the epidermis, dermis, and subcutaneous adipose tissue. As shown in Figure 7A, which depicts the CLSM and TEM micrographs of untreated skin, respective layers of the skin can be clearly visualized by both imaging methods. Diffusion profiles into rat skin, as shown in Figure 7B, represent results 24 hours after topical application of the different nanoparticles. FITC-labeled pristine GNS predominantly accumulated on the skin surface near follicle openings, and relatively low fluorescent intensity was observed at the deeper epidermis and dermis layer. Furthermore, strong intensity near the surface of the epidermis suggests that most of the pristine GNS were unable to permeate deeper into the dermis. On the other hand, green fluorescence in the subcutaneous adipose tissues of skins treated with GNS–PEG and GNS–PEG–OAm nanoparticles suggests deeper permeation of functionalized GNS. Localization of GNS–PEG and GNS–PEG–OAm in subcutaneous adipose tissues was further supported by TEM, which has been previously used to access the extent of nanoparticle deposition in skin layers.40,41 TEM also revealed that the permeated nanoparticles were well dispersed inside the subcutaneous adipose tissue and eliminated the concerns of fluorescence quenching.
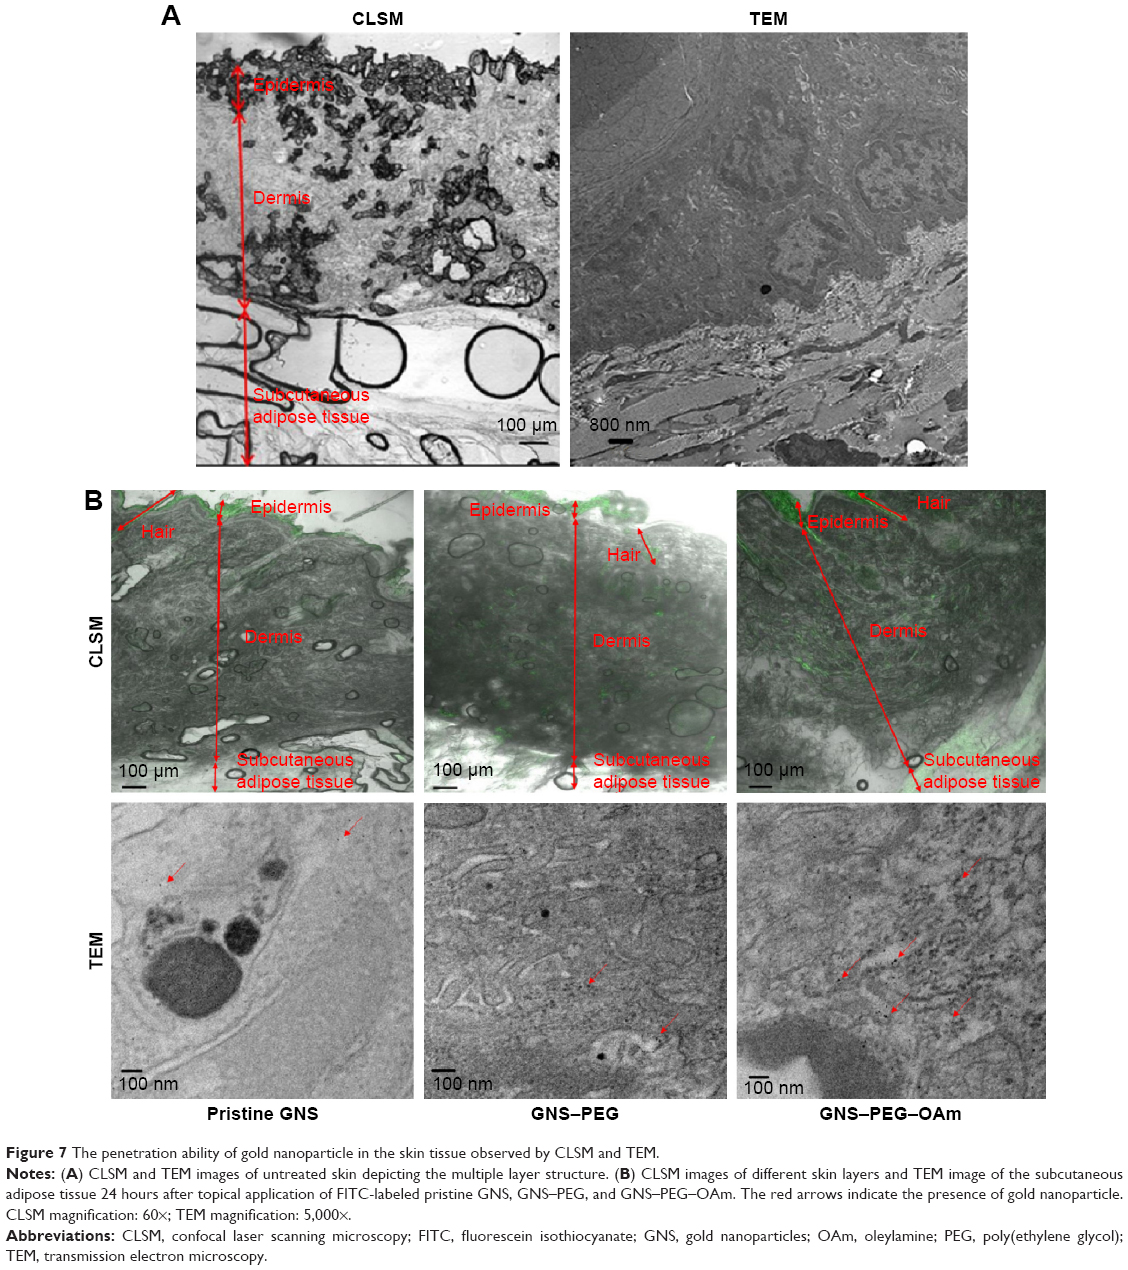 | Figure 7 The penetration ability of gold nanoparticle in the skin tissue observed by CLSM and TEM. |
Fluorescence intensity inside different skin layers was quantified and averaged as shown in Figure 8. Both PEG and PEG–OAm functionalization promoted nanoparticle deposition in all skin layers assessed. The highest accumulation of GNS was observed in the epidermis in all groups, indicating that most nanoparticles were limited to the surface layer of the skin due to barrier function of the SC. However, when comparing the fluorescent intensity in the epidermis, one- and twofold increases in deposition were observed upon PEG and PEG–OAm functionalization. This reveals that more functionalized GNS were able to cross the SC and become deposited in the deeper epidermis. Skin penetration ability of molecules is based on their chemical structure and interaction with the skin.42 PEG has been shown to solvate keratin and extract lipid, thereby disrupting the structural organization and allowing the molecules to pass through.43 Furthermore, PEG may act as a spacer arm to increase the solubility and allow the terminal OAm to move flexibly in solution, enhancing interaction with the skin.44,45 On the other hand, OAm is a cationic lipid and known penetration enhancer that readily interacts with negatively charged skin surface and cell membrane as well as induces conformation changes in surface protein conformation.46 In this example, the hydrophilic chain interacts with the polar lipid region, and the hydrophobic chain themselves are inserted into the SC to disrupt the lipid bilayer structure.47,48 The functionalized nanoparticles also accumulated in hair follicles in greater amounts, which provided an additional route for transdermal passage. Permeation through the skin compartments in follicles has been shown to be highly in favor of lipophilic vehicles since these compartments are similarly lipid rich.49,50 In combination, PEG–OAm functionalization resulted in threefold increase in GNS deposition in the subcutaneous adipose tissue, providing direct proof that PEG–OAm increases permeation of GNS.
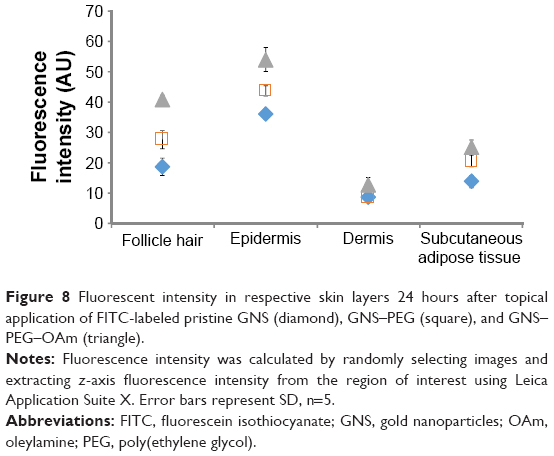 | Figure 8 Fluorescent intensity in respective skin layers 24 hours after topical application of FITC-labeled pristine GNS (diamond), GNS–PEG (square), and GNS–PEG–OAm (triangle). |
Conclusion
This study demonstrates the positive effects of PEG and PEG–OAm functionalization on GNS skin permeation in an in vivo rat model. Taking advantage of the strong affinity between thiol and gold, PEG and PEG–OAm can be coated onto GNS nanoparticles. Permeation study revealed that PEG- and PEG–OAm-functionalized GNS significantly increased nanoparticle deposition in the deeper layer subcutaneous adipose tissue, which suggests the role of PEG–OAm as a permeation enhancer. On the other hand, pristine GNS was generally incapable of permeating the most superficial layers of the skin. Although the use of human subjects would most accurately reflect true clinical practice, due to regulations, in vivo permeation studies are not always applicable at the initial stages of drug development. An in vivo rat model, in contrast to in vitro models, takes into consideration the structural changes of the skin, blood flow, and metabolism. Thus, this study is meant to provide a preliminary understanding of the effects of selected permeation enhancers on the skin permeation of GNS in vivo. Taken together, this study suggests that PEG and PEG–OAm functionalization is an effective strategy for enhancing the in vivo permeation of GNS for topical administration.
Acknowledgments
The authors would like to thank the Ministry of Science and Technology of the Republic of China (Taiwan) and National Taiwan University of Science and Technology–Mackay Medical College Joint Research Program for financially supporting this study (grant numbers MOST 103-2221-E-011-035-, 104-2218-E-492-003-, and MMH-NTUST-102-12).
Diclosure
The authors report no conflicts of interest in this work.
References
Patel SP, Patel PB, Parekh BB. Application of nanotechnology in cancers prevention, early detection and treatment. J Cancer Res Ther. 2014;10(3):479–486. | ||
Yu MK, Park J, Jon S. Targeting strategies for multifunctional nanoparticles in cancer imaging and therapy. Theranostics. 2012;2(1):3–44. | ||
Yildirimer L, Thanh NTK, Loizidou M, Seifalian AM. Toxicology and clinical potential of nanoparticles. Nanotoday. 2011;6(6):585–607. | ||
Chen YS, Hung YC, Liau I, Huang GS. Assessment of the in vivo toxicity of gold nanoparticles. Nanoscale Res Lett. 2009;4(8):858–864. | ||
Zhang XD, Wu D, Shen X, et al. Size-dependent in vivo toxicity of PEG-coated gold nanoparticles. Int J Nanomedicine. 2011;6:2071–2081. | ||
Mundargi RC, Patil SA, Agnihotri SA, Aminabhavi TM. Evaluation and controlled release characteristics of modified xanthan films for transdermal delivery of atenolol. Drug Dev Ind Pharm. 2007;33(1):79–90. | ||
Mutalik S, Udupa N. Glibenclamide transdermal patches: physicochemical, pharmacodynamic, and pharmacokinetic evaluations. J Pharm Sci. 2004;93(6):1577–1594. | ||
Paudel KS, Milewski M, Swadley CL, Brogden NK, Ghosh P, Stinchcomb AL. Challenges and opportunities in dermal/transdermal delivery. Ther Deliv. 2010;1(1):109–131. | ||
Bouwstra JA, Honeywell-Nguyen PL, Gooris GS, Ponec M. Structure of the skin barrier and its modulation by vesicular formulations. Prog Lipid Res. 2003;42(1):1–36. | ||
Harding CR. The stratum corneum: structure and function in health and disease. Dermatol Ther. 2004;17(Suppl 1):6–15. | ||
Kohli AK, Alpar HO. Potential use of nanoparticles for transcutaneous vaccine delivery: effect of particle size and charge. Int J Pharm. 2004;275(1–2):13–17. | ||
Gupta S, Bansal R, Gupta S, Jindal N, Jindal A. Nanocarriers and nanoparticles for skin care and dermatological treatments. Indian Dermatol Online J. 2013;4(4):267–272. | ||
Wang Y, Thakur R, Fan Q, Michniak B. Transdermal iontophoresis: combination strategies to improve transdermal iontophoretic drug delivery. Eur J Pharm Biopharm. 2005;60(2):179–191. | ||
Papakostas D, Rancan F, Sterry W, Blume-Peytavi U, Vogt A. Nanoparticles in dermatology. Arch Dermatol Res. 2011;303(8):533–550. | ||
Tran T-NT. Cutaneous drug delivery: an update. J Investig Dermatol Symp Proc. 2013;16(1):S67–S69. | ||
Naguib YW, Kumar A, Cui Z. The effect of microneedles on the skin permeability and antitumor activity of topical 5-fluorouracil. Acta Pharm Sin B. 2014;4(1):94–99. | ||
Pettis RJ, Harvey AJ. Microneedle delivery: clinical studies and emerging medical applications. Ther Deliv. 2012;3(3):357–371. | ||
Stahl J, Wohlert M, Kietzmann M. Microneedle pretreatment enhances the percutaneous permeation of hydrophilic compounds with high melting points. BMC Pharmacol Toxicol. 2012;13(1):5. | ||
El Maghraby GM, Campbell M, Finnin BC. Mechanisms of action of novel skin penetration enhancers: phospholipid versus skin lipid liposomes. Int J Pharm. 2005;305(1–2):90–104. | ||
Gwak HS, Chun IK. Effect of vehicles and penetration enhancers on the in vitro percutaneous absorption of tenoxicam through hairless mouse skin. Int J Pharm. 2002;236(1–2):57–64. | ||
Warner KS, Li SK, He N, et al. Structure-activity relationship for chemical skin permeation enhancers: probing the chemical microenvironment of the site of action. J Pharm Sci. 2003;92(6):1305–1322. | ||
Warner KS, Li SK, Higuchi WI. Influences of alkyl group chain length and polar head group on chemical skin permeation enhancement. J Pharm Sci. 2001;90(8):1143–1153. | ||
Larese FF, D’Agostin F, Crosera M, et al. Human skin penetration of silver nanoparticles through intact and damaged skin. Toxicology. 2009;255(1–2):33–37. | ||
Sau TK, Pal A, Jana NR, Wang ZL, Pal T. Size controlled synthesis of gold nanoparticles using photochemically prepared seed particles. J Nanopart Res. 2001;3:257–261. | ||
Arvizo R, Bhattacharya R, Mukherjee P. Gold nanoparticles: opportunities and challenges in nanomedicine. Expert Opin Drug Deliv. 2010;7(6):753–763. | ||
Cheng Y, C Samia A, Meyers JD, Panagopoulos I, Fei B, Burda C. Highly efficient drug delivery with gold nanoparticle vectors for in vivo photodynamic therapy of cancer. J Am Chem Soc. 2008;130(32):10643–10647. | ||
Alanazi FK, Radwan AA, Alsarra IA. Biopharmaceutical applications of nanogold. Saudi Pharm J. 2010;18(4):179–193. | ||
Fernandes R, Smyth NR, Muskens OL, et al. Interactions of skin with gold nanoparticles of different surface charge, shape, and functionality. Small. 2015;11(6):713–721. | ||
Sonavane G, Tomoda K, Sano A, Ohshima H, Terada H, Makino K. In vitro permeation of gold nanoparticles through rat skin and rat intestine: effect of particle size. Colloids Surf B Biointerfaces. 2008;65(1):1–10. | ||
Schneider M, Stracke F, Hansen S, Schaefer UF. Nanoparticles and their interactions with the dermal barrier. Dermatoendocrinol. 2009;1(4):197–206. | ||
Liu DC, Raphael AP, Sundh D, et al. The human stratum corneum prevents small gold nanoparticle penetration and their potential toxic metabolic consequences, the human stratum corneum prevents small gold nanoparticle penetration and their potential toxic metabolic consequences. J Nanomater. 2012;2012(2012):e721706. | ||
Zagaynova EV, Shirmanova MV, Kirillin MY, et al. Contrasting properties of gold nanoparticles for optical coherence tomography: phantom, in vivo studies and Monte Carlo simulation. Phys Med Biol. 2008;53(18):4995–5009. | ||
Kim CS, Ahn YC, Wilder-Smith P, Oh S, Chen Z, Kwon YJ. Efficient and facile delivery of gold nanoparticles in vivo using dissolvable microneedles for contrast-enhanced optical coherence tomography. Biomed Opt Express. 2010;1(1):106–113. | ||
Manson J, Kumar D, Meenan BJ, Dixon D. Polyethylene glycol functionalized gold nanoparticles: the influence of capping density on stability in various media. Gold Bull. 2011;44(2):99–105. | ||
Li D, He Q, Zhu H, Tao C, Li J. Enhanced dispersity of gold nanoparticles modified by omega-carboxyl alkanethiols under the impact of poly(ethylene glycol)s. J Nanosci Nanotechnol. 2007;7(9):3089–3094. | ||
Prausnitz MR, Langer R. Transdermal drug delivery. Nat Biotechnol. 2008;26(11):1261–1268. | ||
Tsai HC, Lin JY, Maryani F, Huang CC, Imae T. Drug loading capacity and nuclear targeting of multi-walled carbon nanotubes grafted with anionic amphiphilic copolymers. Int J Nanomedicine. 2013;8:4427–4480. | ||
Huang X, El-Sayed MA. Gold nanoparticles: optical properties and implementations in cancer diagnosis and photothermal therapy. J Adv Res. 2010;1(1):13–28. | ||
Zhang LW, Monteiro-Riviere NA. Use of confocal microscopy for nanoparticle drug delivery through skin. J Biomed Opt. 2012;18(6):061214. | ||
Baroli B, Ennas MG, Loffredo F, Isola M, Pinna R, López-Quintela MA. Penetration of metallic nanoparticles in human full-thickness skin. J Invest Dermatol. 2007;127(7):1701–1712. | ||
Labouta HI, Liu DC, Lin LL, et al. Gold nanoparticle penetration and reduced metabolism in human skin by toluene. Pharm Res. 2011;28(11):2931–2944. | ||
Karande P, Mitragotri S. Enhancement of transdermal drug delivery via synergistic action of chemicals. Biochim Biophys Acta. 2009;1788(11):2362–2373. | ||
Shah SNH, Tahir MA, Safdar A, et al. Effect of permeation enhancers on the release behavior and permeation kinetics of novel tramadol lotions. Trop J Pharm Res. 2013;12(1):27–32. | ||
Zhu J. Bioactive modification of poly(ethylene glycol) hydrogels for tissue engineering. Biomaterials. 2010;31(17):4639–4656. | ||
Sperling RA, Parak WJ. Surface modification, functionalization and bioconjugation of colloidal inorganic nanoparticles. Philos Transact A Math Phys Eng Sci. 2010;368(1915):1333–1383. | ||
Takeuchi Y, Yasukawa H, Yamaoka Y, et al. Effects of fatty acids, fatty amines and propylene glycol on rat stratum corneum lipids and proteins in vitro measured by Fourier transform infrared/attenuated total reflection (FT-IR/ATR) spectroscopy. Chem Pharm Bull (Tokyo). 1992;40(7):1887–1892. | ||
Vávrová K, Zbytovská J, Hrabálek A. Amphiphilic transdermal permeation enhancers: structure-activity relationships. Curr Med Chem. 2005;12(19):2273–2291. | ||
Godwin DA, Player MR, Sowell JW, Michniak BB. Synthesis and investigation of urea compounds as transdermal penetration enhancers. Int J Pharm. 1998;167(1–2):165–175. | ||
Wu H, Ramachandran C, Weiner ND, Roessler BJ. Topical transport of hydrophilic compounds using water-in-oil nanoemulsions. Int J Pharm. 2001;220(1–2):63–75. | ||
Meidan VM, Bonner MC, Michniak BB. Transfollicular drug delivery – is it a reality? Int J Pharm. 2005;306(1–2):1–14. |
 © 2016 The Author(s). This work is published and licensed by Dove Medical Press Limited. The full terms of this license are available at https://www.dovepress.com/terms.php and incorporate the Creative Commons Attribution - Non Commercial (unported, v3.0) License.
By accessing the work you hereby accept the Terms. Non-commercial uses of the work are permitted without any further permission from Dove Medical Press Limited, provided the work is properly attributed. For permission for commercial use of this work, please see paragraphs 4.2 and 5 of our Terms.
© 2016 The Author(s). This work is published and licensed by Dove Medical Press Limited. The full terms of this license are available at https://www.dovepress.com/terms.php and incorporate the Creative Commons Attribution - Non Commercial (unported, v3.0) License.
By accessing the work you hereby accept the Terms. Non-commercial uses of the work are permitted without any further permission from Dove Medical Press Limited, provided the work is properly attributed. For permission for commercial use of this work, please see paragraphs 4.2 and 5 of our Terms.