")
Back to Journals » Nature and Science of Sleep » Volume 8
Enhancements to the multiple sleep latency test
Authors Meza S, Giannouli E, Younes M
Received 4 January 2016
Accepted for publication 8 February 2016
Published 11 May 2016 Volume 2016:8 Pages 145—158
DOI https://doi.org/10.2147/NSS.S103596
Checked for plagiarism Yes
Review by Single anonymous peer review
Peer reviewer comments 3
Editor who approved publication: Dr Steven A Shea
Sonia Meza-Vargas, Eleni Giannouli, Magdy Younes
Sleep Disorders Centre, University of Manitoba, Winnipeg, MB, Canada
Introduction: The utility of multiple sleep latency tests (MSLTs) is limited to determining sleep onset latency (SOL) and rapid eye movement sleep latency. The odds ratio product (ORP) is a continuous index of sleep depth with values of 0, 1.0, and 2.5 reflecting very deep sleep, light sleep, and full wakefulness, respectively. We determined the time course of sleep depth during MSLT naps expecting that this would enhance the test's clinical utility.
Methods: Thirty MSLTs (150 naps) were performed for excessive somnolence. Patients indicated whether they slept (yes/no) after each nap. SOL was scored by two experienced technologists. Time course of ORP was determined with a commercial system. We determined ORP at SOL (ORPSOL), times ORP decreased <2.0, <1.5, <1.0 and <0.5 during the entire nap duration, and the integral of decrease in ORP over nap duration (ΔORPINT).
Results: SOL occurred almost invariably when ORP was between 1.0 and 2.0. Of 47 naps (21 patients) with SOL ,5 minutes, ORP decreased <1.0 (light sleep) in <5 minutes in only 13 naps (nine patients) and <0.5 (deep sleep) in only two naps in one patient. The relation between ORPINT and frequency of sleep perception was well defined, allowing determination of a threshold for sleep perception. This threshold ranged widely (5–50 ΔORP*epoch).
Conclusion: As currently identified, SOL reflects transition into a highly unstable state between wakefulness and sleep. Reporting the times of attaining different sleep depths may help better identify patients at high risk of vigilance loss. Furthermore, an ORPSOL outside the range 1.0–2.0 can help identify scoring errors.
Keywords: odds ratio product, sleep perception, idiopathic hypersomnia
Introduction
The multiple sleep latency test (MSLT) is one of the most commonly used tools in sleep medicine. Following a night of standard polysomnography (PSG), the patient is asked to try and sleep during five 20-minute nap attempts (naps) separated by 2 hours. Sleep onset latency (SOL) is determined in each nap and is assigned a value of 20 minutes if no sleep was scored.1
Despite the fact that MSLT is labor intensive, expensive, and quite inconvenient for the patient, its clinical utility is quite limited. The only outputs of the test are SOL and whether the patient developed rapid eye movement (REM) sleep during the naps. While this information is very useful for the diagnosis of narcolepsy,1,2 in most cases where narcolepsy is not confirmed, the information provided is of little value, particularly since SOL varies greatly among healthy control subjects (1.2–20 minutes).1,3,4
The odds ratio product (ORP) is a recently proposed continuous index of sleep depth that ranges from 0 (deepest sleep) to 2.5 (full wakefulness).5 When ORP is >1.5, most epochs are scored as awake. Between 0 and 1.5, there is a very strong correlation (r2=0.98) between current ORP and likelihood of arousal or awakening occurring within 30 seconds, with the likelihood being ≈10% at an ORP of 0.25 and ≈45% at an ORP of 1.5.5 Sleep onset (SO) typically occurs in the ORP range 1.5–2.0.5 Beyond SO, in the absence of arousals, ORP decreases gradually from the SO level (>1.0) seen in non-REM stage 1 (N1) and early stage 2 (N2) to near zero in deep N2 and non-REM stage 3 (N3). Thus, while the patient is technically in N2, ORP can range between 0.1 (highly resistant to arousal) and 1.5 (highly arousable).5 The evolution of sleep beyond SO is typically not documented in MSLTs. Even if it were, for example, by scoring the epochs using the conventional N1–N3 sleep criteria,6 the information would still not be very helpful with respect to the sleep depth reached during naps since, as indicated above, stage N2 encompasses a wide range of sleep depths.
We felt that adding ORP measurement could enhance the clinical utility of the test in three potentially important ways: First, it would provide information on the maximum depth of sleep reached during the nap and how soon it was reached. It may seem reasonable to assume that, notwithstanding a similar SOL, a patient who progresses to deep sleep (eg, ORP <0.5) early in the nap is at greater risk of losing vigilance under the alerting conditions of normal daily living than another patient in whom ORP fails to progress <1.0 during the nap, despite the highly sleep-promoting conditions of the test. Second, when combined with asking the patient after each nap whether he slept, the relation between sleep depth and sleep perception can be determined. Such information may be helpful in diagnosing sleep misperception.7 Third, it could serve as a quality control instrument to identify instances of errors in manual scoring of SOL.
In the current study, we determined the time course of ORP during MSLTs in 30 patients with complaints of excessive daytime somnolence to determine the relation between SOL and the rate and extent of sleep deepening during MSLT naps. An excellent agreement between SOL and measures of sleep depth would indicate that ORP does not provide any additional information beyond SOL, and vice versa. Using the pattern of change in ORP during naps, we also determined the amount of sleep required for patients to recognize that they slept during the nap, thereby establishing a sleep perception threshold.
Methods
Thirty patients referred to the sleep center with a complaint of excessive daytime sleepiness were studied. We included all comers who had symptoms of excessive somnolence, no significant organic disorder during nocturnal PSG, and underwent an MSLT. Subjective sleepiness was assessed by the Epworth Sleepiness Scale. The patients underwent overnight PSG with the standard montage, consisting of two central (C3, C4), two frontal (F3, F4), and two occipital (O1, O2) electroencephalography (EEG) derivations, two electro-occulograms, chin electromyogram, electrocardiogram, two respiratory bands (Embla XactTrace reusable belts; Natus, Middleton, WI, USA), nasal cannula (Thermocan, Sleep Sense, Elgin, IL, USA) and thermister (Thermocan, Sleep Sense) sensors to measure flow, oxyhemoglobin saturation (Pulse Oximeter; Nonin Medical Inc, Plymouth, Minnesota, USA), audio, and leg electromyogram. Having demonstrated no significant respiratory or movement disorder during the PSG, they underwent a five-nap MSLT the next day starting at 7.30 am. This was done using the same montage, in the same room as the PSG and followed all the American Academy of Sleep Medicine recommendations for performing MSLT.1 After each nap, the patient was asked (yes/no) whether he felt he slept. In addition, the patient completed a questionnaire in which he reported his assessment of sleep variables at home and on the morning following the overnight PSG.
PSG and MSLT data were recorded on a Sandman system (Embla Natus v.10.1) at the frequencies recommended by American Academy of Sleep Medicine.6 SOL and REM onset latency, if any, in each nap were scored manually by two experienced technologists (>15 years of experience each). No other visual scoring was performed. The average of the two scores was used. Subsequently, the MSLT records were exported in the European Data Format format and sent to Younes Respiratory Technologies Ltd for scoring by the Michele Sleep Scoring system,8 which provided ORP data in consecutive 30-second epochs. All analysis relating to the rest of the nap was performed by the investigators.
The method of determining ORP has been described in detail previously.5 Briefly, consecutive 3-second epochs of the EEG are subjected to spectral analysis (Fourier), and the powers in the delta, theta, alpha/sigma, and beta frequencies are calculated. The power within each frequency range is assigned a rank (0–9) based on its relative location within the entire range encountered in clinical PSGs for each frequency range. As a result, each 3-second EEG epoch is assigned one of 10,000 four-digit numbers (signature) reflecting the delta, theta, alpha/sigma, and beta ranks. Thus, a 3-second signature of 9289 indicates very high delta, alpha, and beta powers and little theta power. The probability of each EEG pattern (signature) to occur during wakefulness is determined from a look-up table that was constructed by determining the number of times each signature was found in periods scored awake (by a consensus of experienced technologists) divided by the total number of times the signature was seen in the database (>400,000 3-second epochs were used to construct the table). The 3-second epoch then receives a probability ranging from 0% (never occurs during wakefulness) to 100% (never occurs during sleep). This range is normalized by dividing by 40 (% of 30-second epochs manually scored awake in the database), thereby reducing the range to 0–2.5. Accordingly, an ORP of 2.5 describes an epoch that is never seen during sleep, and an ORP of 1.5 describes an epoch that is seen 60% of the time during wakefulness and 40% of the time during sleep, thereby indicating that this pattern tends to occur in transitional states, and so on.
All the data used in this study were from patients who provided written informed consent. Because this study was a retrospective analysis of clinical data collected long before, and the study did not involve any intervention or patient contact or disclosure of personal information, this did not require specific approval for the project from the Regional Ethics Board as per procedure.
Analysis
For each patient, we determined the highest ORP value observed in the five naps (ORPMAX) by obtaining average ORP in the first minute of all five naps and selecting the highest of the five values. In addition, for each nap, we calculated the following:
- The ORP value at the manually identified SO (ORPSO).
- The times at which ORP crossed <2.0 (T<2.0), <1.5 (T<1.5), <1.0 (T<1.0), and <0.5 (T<0.5).
- The lowest ORP reached in the entire nap (ORPMIN) and in the first 5 minutes of the nap (ORPMIN(5)).
- The total time ORP remained <2.0 (D<2.0), <1.5 (D<1.5), and <1.0 (D<1.0).
- The integral of the difference between each epoch’s ORP value and ORPMAX over the entire nap time (ΔORPINT). This is expressed as ΔORP*epoch. For example, if ORPMAX were 2.40, ORP values at successive 30-second intervals throughout the nap were subtracted from 2.40, and the differences were summed.
Average values for all five naps in each individual were calculated. In addition, we separately calculated average of all 30 values in naps 1–5. Spearman’s correlation, chi test, t-test, and analysis of variance for repeated measures with Tukey’s test for multiple comparisons were performed where indicated in the text.
To determine whether ORP behavior during the nap might explain the difference between naps that were followed by sleep perception (positive tests) or no sleep perception (negative tests) in the same patient, we identified 12 patients who had both types and compared ORP values in the positive and negative tests using the paired t-test. To determine whether ORP variables may explain between-patient differences in sleep perception, the patients were divided into four categories: positive response following all five naps, four of five naps, two or three naps, and less than two naps. Average ORP values were obtained for all five naps in each patient, and differences between average ORP values in the four groups were compared by analysis of variance. Finally, we used ΔORPINT to determine the threshold for sleep perception, as this variable incorporates all the other variables. All ΔORPINT values obtained from 145 naps with available perception data were sorted in ascending order, and the ten-point moving average was calculated. The % of naps in which sleep was perceived in the same ten naps was also calculated.
Intra-class correlation (ICC) was used to determine agreement between scorers. Except where indicated otherwise, all values are means ± standard deviation.
Results
We included 30 patients (eleven men), with a mean age of 37.1±13.6 years (range, 19–65). Epworth Sleepiness Scale was 15.2±3.0. Table 1 shows the results of the sleep questionnaire. Patients slept an average 7.0±1.2 hours/night, and many (16/30) had additional naps during the day, for a total estimated sleep time of 7.7±1.1 hours/day. Only four patients felt rested upon waking up, and most complained of tiredness and strong urges to fall asleep during the day. Seven patients admitted to driving problems, and three had motor vehicle accidents (MVAs).
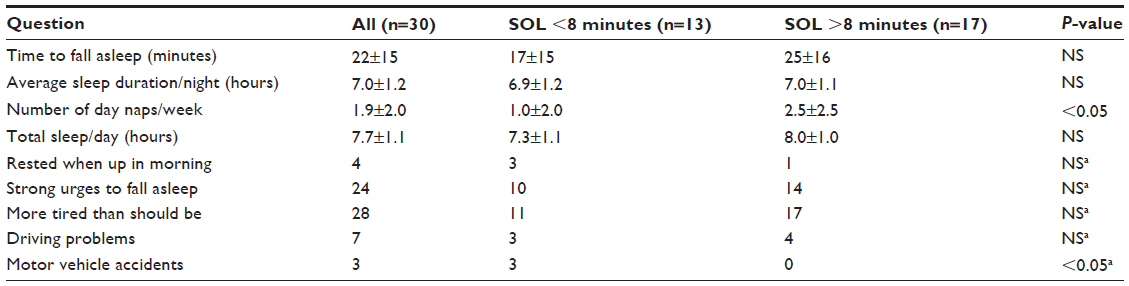 | Table 1 Results of sleep questionnaire prior to polysomnography |
Table 2 shows patient characteristics and results of overnight PSG. Twenty patients received no medications prior to the PSG. Medications taken by the other ten are listed in Table 2. Some of these patients received more than one medication. None of the patients had an apnea–hypopnea index >6 hour–1, while six had a periodic leg movement index >15 hour–1. Periodic leg movements in these patients were not associated with arousals (Table 1).
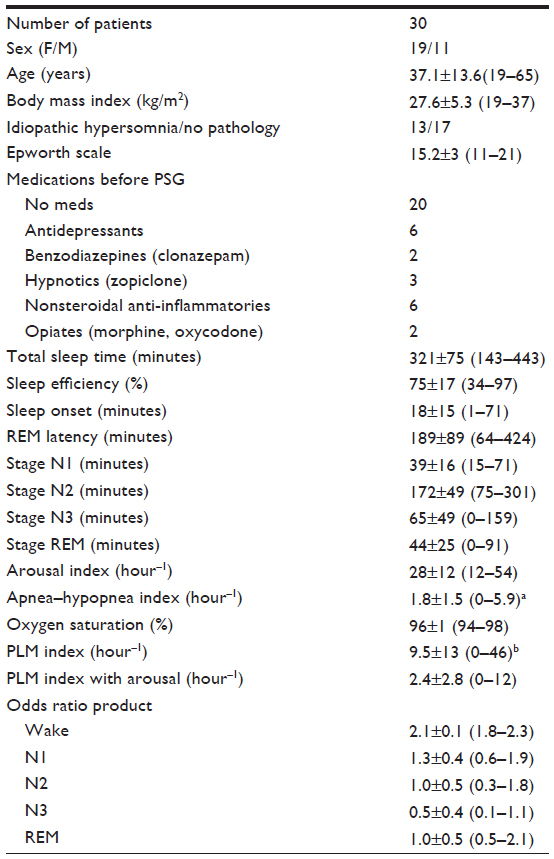 | Table 2 Patient characteristics and results of overnight PSG |
Sleep variables were typical of studies in the sleep laboratory population with moderate sleep efficiency, predominant time in N2 and highly variable times in awake, N1, N3, and REM sleep. Results of the ORP were consistent with the original description,3 showing a progressive reduction as the stage progressed from wakefulness to deep sleep, with REM ORP being similar to ORP in N1. Also, as described previously,5 except for the awake state, there was a wide range of ORP among patients in each stage. For example, during N2, ORP ranged from 0.3 (deep sleep) to 1.8 (unstable sleep) (Table 2), again emphasizing that conventional sleep staging has poor resolution (only three levels) with respect to sleep depth. However, as shown in Table 3, nocturnal ORP values in non-REM sleep in the current patients were significantly higher than the average values seen in our laboratory.9
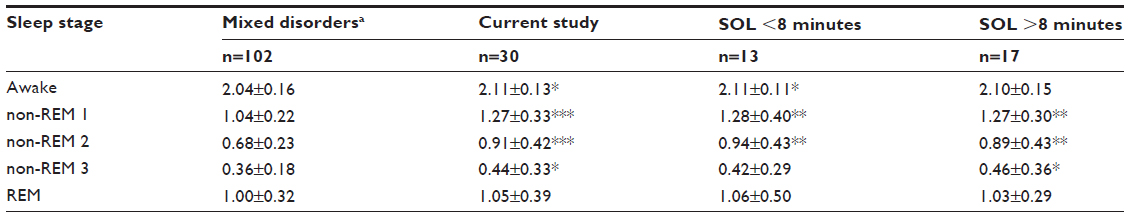 | Table 3 Odds ratio product during nocturnal polysomnography in current patients vs patients with mixed sleep disorders |
An SOL was scored in 121 of the 150 naps (81%). Average (of five naps) SOL ranged from 1.0 to 17.7 minutes (9.6±4.5 minutes). In 13 patients, average SOL was <8 minutes (5.5±2.0 minutes), while in the remaining 17 patients, SOL was 12.8±2.9 minutes. Twelve patients developed one REM onset (SOREM), and none had two SOREMs. REM latency was 9.3±4.7 minutes.
Patients reported that they slept following only three of 27 naps in which sleep was not detected manually. In the other 24 (90%), patient’s assessment was in agreement with the manual score. Perception of sleep was reported following 96 of 118 naps with an SOL, while no sleep was reported in the other 22 naps despite an SOL of 6.6±4.1 minutes.
Patterns of ORP during MSLT naps
A total of 150 naps were analyzed. The evolution patterns of ORP varied considerably but can be generally grouped into three patterns (Figure 1, patterns A–C). In pattern A, seen in 40 naps (27% of naps), ORP remained >2.0 for a variable time (4.4±4.4 minutes) before crossing <2.0. But, once it did, ORP decreased rapidly to stable sleep (ORP <1.0) in <5 minutes (3.4±1.9 minutes). In pattern B (29 naps; 19% of all naps), ORP remained continuously >2.0 with the exception that in 17 naps, there were brief dips (3.9±1.9 dips; <2.0 minutes each, totaling 2.7±1.8 minutes) in ORP <2.0, with the lowest ORP value reached in these dips averaging 1.57±0.25. No sleep was identified by the technologist in 23 of these naps (SOL =20), while an SO was identified in one of the brief dips in ORP in six naps (SOL =14.4±3.5 minutes). In the remaining 81 naps (54%), ORP decreased <2.0 at different times (0–15 minutes; 4.4±3.9 minutes) but remained between 1.0 and 2.0, displaying wide fluctuations (eg, pattern C, Figure 1) for >5 minutes (5.5–19.5; 11.7±4.1 minutes). SO was identified in 76 naps with this pattern (94%), and onset ranged from 3 minutes before (during a brief dip >2.0) to 16.5 minutes after ORP crossed <2.0 (3.5±4.5 minutes). Figure 1 shows two examples with nearly identical evolution of sleep within pattern C where SO was identified at 2 minutes in one nap and at 18 minutes in the other.
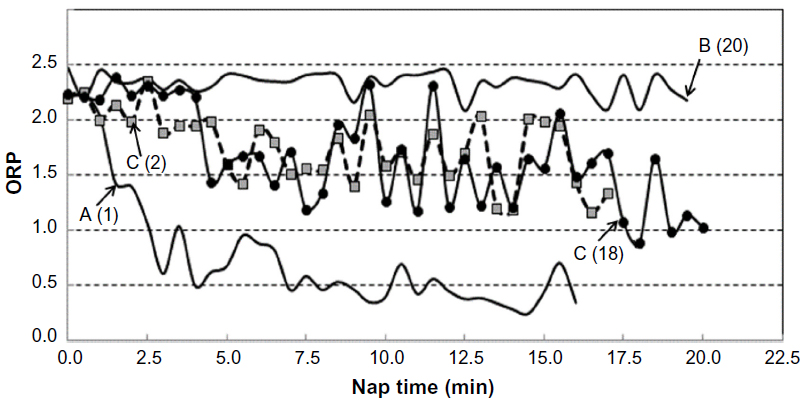 | Figure 1 Different patterns of evolution of ORP during naps. |
The three patterns were seen in 19, 17, and 28 patients, respectively. Ten patients demonstrated all three patterns, 14 patients had two patterns (seven A and C, six B and C, one A and B), and six patients had only one pattern (five with pattern C and one with pattern A in all naps). There was no tendency for any pattern to occur in any particular nap. The frequency of occurrence of any of the three patterns in the different naps (1–5) was not different from expected (0.29, 0.46, and 0.99 for patterns A, B, and C, respectively; Chi-squared test). As may be expected, pattern B was not seen in any patient with average SOL <5.0 (P<0.002; chi test), and pattern A occurred less frequently than expected in patients with average SOL >10 minutes (9 vs 16, P<0.01).
ORPMAX averaged 2.33±0.17. Figure 2A shows the ORP values in individual naps at the point where SO was manually identified (n=121). ORPSO averaged 1.63±0.34 (Figure 2). The large scatter of ORPSOL values is largely of a technical nature and results from the large step changes in ORP around SO. This precludes precise resolution of this value in single naps. As seen in Figures 1 (patterns A and C) and 3, ORP in a given nap can change by a large amount within one or two epochs. Since ORPSOL is assigned the average ORP of the epoch where SO was scored, ORPSOL could be at any value below the true ORPSOL. Likewise, an epoch with 12 seconds at an ORP >2.0 and 18 seconds at an ORP <1.5 would be scored asleep, even though the average ORP for the epoch may be 2.0. The true ORPSOL can only be obtained through averaging. As seen in Figure 2B, when the average of the five naps in each patient was obtained, the scatter was considerably less.
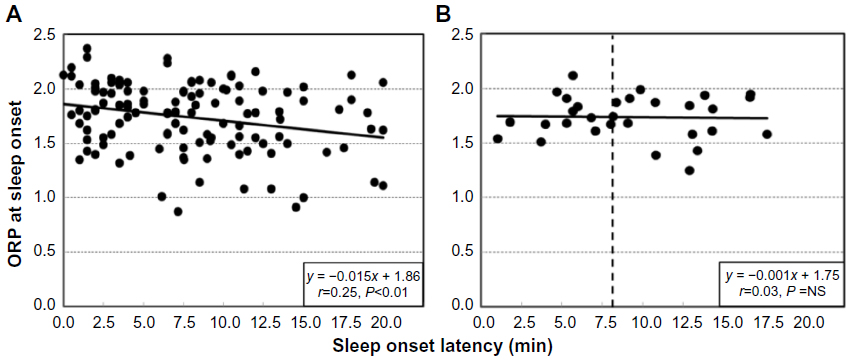 | Figure 2 ORP at the time of manually determined sleep onset in 122 naps in which an onset was scored as a function of SOL. |
There was a significant tendency for ORPSO to be lower when SOL was longer (Figure 2A), suggesting that when SO was scored late in the nap, the scorer waited for a more convincing sleep pattern to score the event. However, there was no such tendency when the averages of the five naps in each patient were similarly plotted (Figure 2B). Thus, the tendency described in Figure 2A is not patient specific but is related to the pattern of sleep during individual naps.
ORP patterns in naps with short, long, and no SOL
Figure 3 shows representative ORP patterns in naps with SOL <5.0 minutes (n=44), between 5.0 and 9.5 minutes (n=44), 10 and 20 minutes (n=34), and naps with no sleep scored (n=28). The illustrated naps were selected by sorting the results of all naps in each category by file and nap number and choosing every third nap (every other nap for naps with no scored sleep). It is clear that a given SOL may be associated with a wide range of sleep patterns (different lines in the same panel can be compared) and that a similar sleep pattern may be found in naps associated with very different SOL.
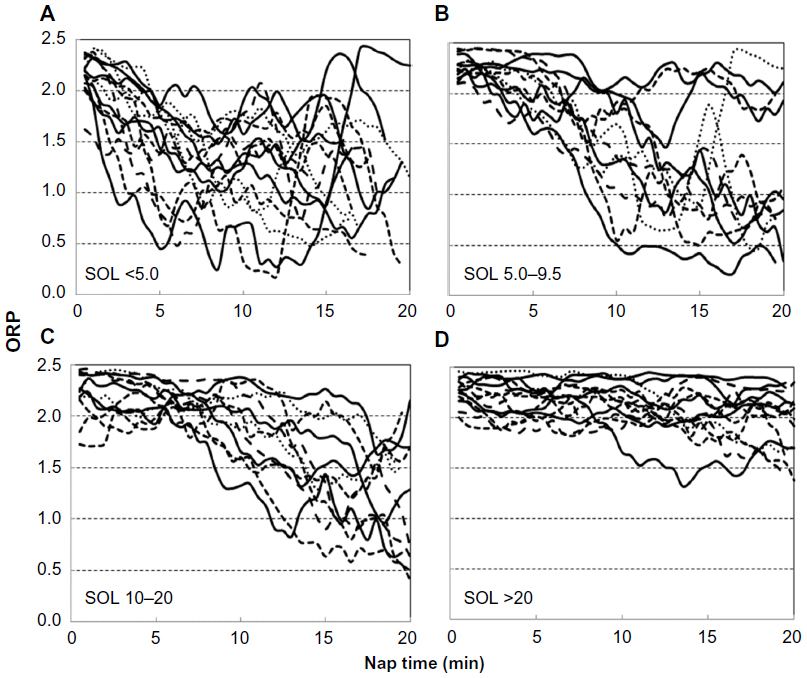 | Figure 3 Examples of ORP patterns in naps with different ranges of SOLs. |
Table 4 shows the frequency of naps in which different ORP levels were reached and the times within the naps that these thresholds were crossed. In all patients, ORP crossed the 2.0 and 1.5 thresholds at some point in at least one nap. However, this occurred in the first 5 minutes in only 25 and 15 patients, respectively. ORP decreased <1.0 at some point in 80 naps in 27 patients, but only nine patients reached this level before 5 minutes in at least one nap. Finally, ORP decreased <0.5 before 5 minutes in only two naps in one patient.
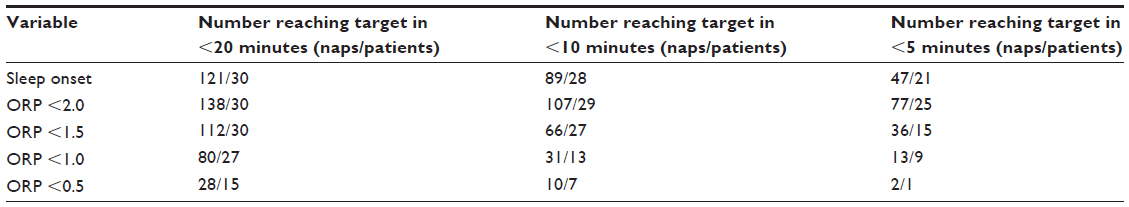 | Table 4 Frequency and time of reaching different ORP levels (n=150) |
Figure 4A shows the relation between average SOL in each patient (n=30), and the lowest ORP reached at any time during the five naps. Except for two patients in whom average SOL was >17 minutes, ORP decreased <1.0 at some point during at least one nap in all patients, and <0.5 (deep sleep) in 20 patients; there was no significant correlation between average SOL and the lowest ORP observed during the MSLT. Figure 4B shows the relation between average SOL and the lowest ORP reached during the first 5 minutes in any of the five naps. There is now a significant correlation (P=0.006), but the scatter is very large. The lower two panels of Figure 4 show the same relations, but the average of the respective values seen in the five naps is shown instead of the lowest overall value. Again, significant correlations were seen, but there was still a wide scatter (r2=0.23 and 0.32, respectively).
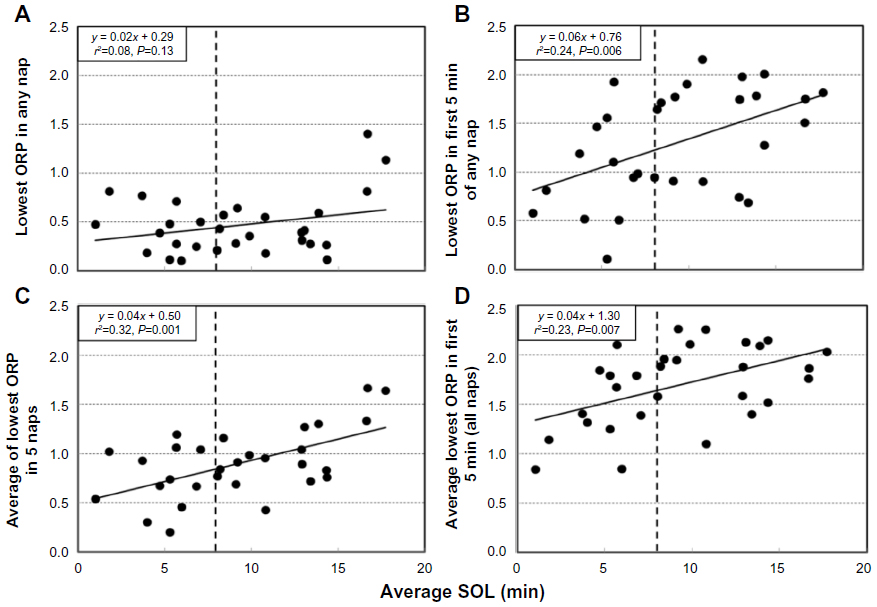 | Figure 4 Relation between average sleep onset latency and the deepest sleep reached during naps. |
SOL and ORP variables according to nap order
Table 5 shows average SOL and ORP variables in different naps. SOL was shortest in nap 2, corresponding to ≈9.30 am. ORP at SOL was the same in all naps. Average nap ORP, and lowest ORP in the entire study and in the first 5 minutes of the nap showed the same pattern as SOL, being lowest in nap 2. However, within each nap, the relation between SOL and the depth of sleep reached in the nap showed much scatter, similar to that shown in Figure 4B.
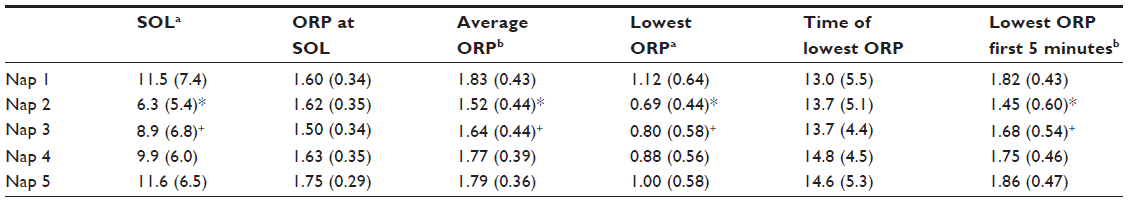 | Table 5 SOL and ORP variables according to nap order |
Comparison of patients with average SOL <8 and >8 minutes
Table 1 shows that the two groups had basically the same sleep habits and complaints except for a tendency for the group with short SOL to have fewer naps and to be involved in MVAs. There were also no significant differences in any of the patient characteristics and nocturnal PSG variables listed in Table 2, including in the number of patients receiving different categories of medications (chi test). In both groups, nocturnal ORP values at different non-REM sleep stages were significantly higher than historical averages, but there were no significant differences between the two groups (Table 3). Patients with average SOL <8 minutes reached lower ORP (deeper sleep) in the first 5 minutes of the MSLT naps (Figure 4B; 0.97±0.49 vs 1.55±0.47, P<0.002), but there was much variability within each group. In patients with SOL <8 minutes, the lowest ORP reached within 5 minutes ranged from 0 (deepest sleep) to 1.9 (just barely asleep) (Figure 4B). There was no difference in ORPSO between patients with average SOL <8 minutes vs those with higher average SOL (1.75±0.17 vs 1.73±0.22, P<0.5).
Figure 5 compares the deepest sleep level reached in the first 5 minutes in the two groups as a function of nap order. In both groups, the lowest average value was in nap 2, but patients with SOL <8 minutes reached deeper sleep (1.16±0.63 vs 1.67±0.50, P<0.01).
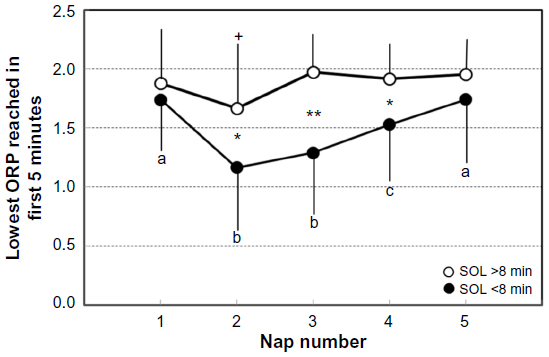 | Figure 5 The lowest ORP reached in the first 5 minutes of the nap as a function of nap order. |
ORP patterns and sleep perception
Twelve patients perceived sleep following some, but not all, naps. Table 6 compares the average values for ORP variables and SOL for naps with and without sleep perception. Values for all naps in a given category were averaged in each patient. There were highly significant differences in all ORP variables between naps with and without sleep perception. Differences in ΔORPINT integral were the most significant. Differences in SOL were not significant.
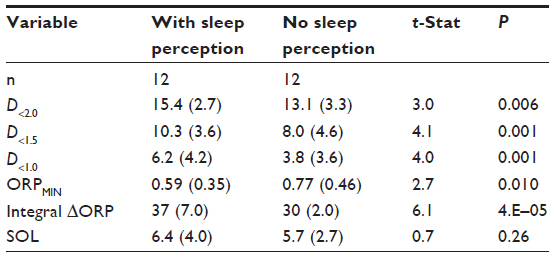 | Table 6 SOL and ORP variables in naps with and without sleep perception |
Table 7 shows sleep patterns among different patients categorized by frequency of sleep perception in the five naps. Only D<2.0 and SOL approached significance.
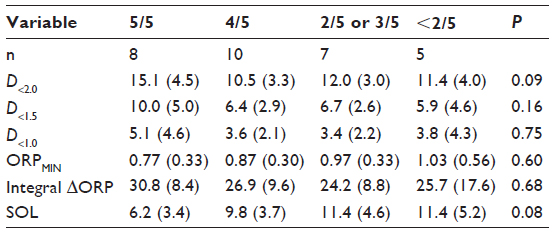 | Table 7 SOL and ORP variables in patients with different frequencies of sleep perception |
Figure 6A shows the relation between ΔORPINT during naps and the frequency of sleep perception after the naps. As ΔORPINT increased from zero, the frequency of perception increased up to an apparent asymptote around 80% perception. Failure of overall perception rate to increase to 100% was due to lack of sleep perception in a few patients even at very high ΔORPINT levels. The large open dots in Figure 6A are the levels at which sleep perception occurred 50% (D50) and 80% (D80) of the time. Figure 6B shows the average ΔORPINT and average perception frequency in individual patients superimposed on the overall response. In most patients, the results were very close to the overall response. However, in eight patients, perception frequency was well below the overall response. Similar analysis for the different contributors to the integral indicated that D50 and D80 for time ORP was <2.0 are 8 and 10 minutes, respectively. For time ORP was <1.5, D50 and D80 were 1.5 and 2.5 minutes, while any time ORP was <1.0, it resulted in perception 80% of the time.
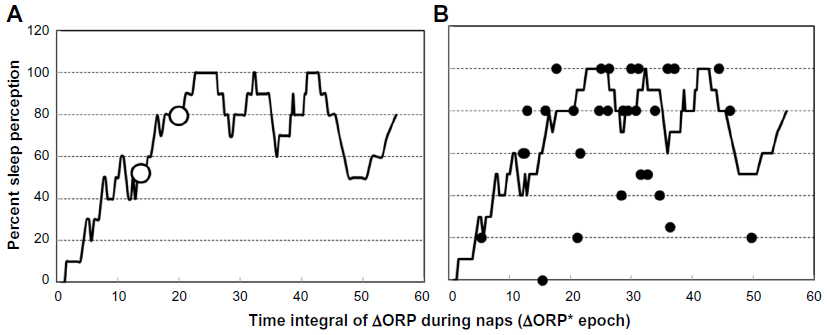 | Figure 6 Frequency of sleep perception following naps as a function of the decrease in ORP. |
Discussion
The present study is the first to document the evolution of sleep during MSLTs using a continuous index of sleep depth. We found that a) pattern of progression of sleep depth varies considerably even among naps with short SOL, with a majority of naps in which arousability remains high throughout; b) SO is reliably identified by experienced technologists when ORP decreases <1.3; and c) there is a well-defined relation between the duration and depth of sleep during the nap and perception of sleep following the nap. Our findings suggest that documentation of the time course of ORP during MSLT naps may a) provide information about the likelihood of loss of vigilance in the presence of normal environmental stimuli; b) serve as a quality control instrument; and c) when combined with assessment of sleep perception following the naps, could identify patients with impaired sleep perception. In addition, nearly half the patients met the criteria of idiopathic hypersomnia (IH). As a result, this study provided new insights into this disorder, including poor nocturnal sleep quality, maximum sleepiness in mid-morning, and considerable variability in the depth of sleep reached during naps even when average SOL is very short.
Relation between ORP and sleep/wakefulness state
In a validation study in which two experienced technologists scored each of 44,274 30-second epochs,5 it was shown that when ORP was >2.25, epochs were invariably scored awake. Between 2.25 and 2.0, brief sleep periods began to appear, but they did not add up to the requisite 15 seconds/epoch. As a result, epochs with ORP >2.0 were scored awake by at least one scorer 99% of the time and by both scorers in 95% of cases. As ORP decreased <2.0, the fraction of epochs meeting sleep criteria increased progressively from 18% when ORP was 1.75–2.0, to 31% for ORP 1.50–1.75, to 50% between 1.25 and 1.50, and to 66% when it was 1.0–1.25. Most disagreements between technologists in scoring sleep vs awake occurred when ORP was between 1.0 and 2.0. Below an ORP of 1.0, the epochs were scored asleep by at least one scorer in 98% of cases and by both scorers in 94% of cases. However, there was still a gradation of arousability within this range, with the arousal index decreasing from near 70 hour–1 at an ORP of 1.0 to <10 hour–1 when ORP was <0.5. It is then clear that this index represents a continuous scale from full wakefulness to deep sleep, with the range between 1.0 and 2.0 representing an unstable state during which the EEG may or not meet the standard criteria for sleep.
The finding that ORP at SO is almost invariably between 1.0 and 2.0 (Figure 2A) is consistent with the results obtained in nocturnal studies.5 This is to be expected since ORP is determined by EEG patterns and the EEG manifestations defining SO are the same whether sleep is nocturnal or diurnal. The current results also show that ORP at SO is not affected by the degree of sleepiness in individual patients (average SOL; Figure 2B) or by nap order (Table 5).
Utility of ORP as a measure of likelihood of loss of vigilance
Although mean SOL of the MSLT in a given individual changes in the right direction following experimental, pharmacological, or medical interventions/conditions that are expected to increase or decrease sleepiness,10–16 differences between individuals in mean SOL do not correlate well with performance on tasks of skill.17 Furthermore, 10%–15% of normal adults with no sleepiness have a mean SOL ≤5 minutes, and in 40%–50% of normal subjects, mean latency is ≤10 minutes.3,4 An important study on risk of MVAs found a barely significant increase in the risk associated with a mean SOL <5 minutes relative to mean SOL >10 minutes. This was despite the fact that the study involved >600 subjects and rate of MVAs was determined over 10 years.4 Clearly, a mean SOL <5 is not a good predictor of likelihood of loss of vigilance in a given individual.
Conventionally defined SO occurs almost invariably when ORP is between 1.0 and 2.0 (Figure 2). At these levels, sleep is extremely light and unstable, and wakefulness can resume at any time, even spontaneously.5 That a person simply reaches such an unstable level within 5–10 minutes under conditions that strongly promote sleep (MSLT conditions) clearly need not indicate a tendency for that person to fall asleep under conditions of normal or increased environmental stimuli. As shown in Figure 4, while most patients reached deep sleep (ORP <0.5) during the 20 minutes of the nap (Figure 4A), only a few did so within the first 5 minutes (Figure 4B). Within the group that met the MSLT criteria of hypersomnia (average SOL <8 minutes),18 the lowest ORP reached in the first 5 minutes ranged from 0.1 (very deep sleep) to 1.9 (lightest possible sleep). The frequency of reaching a given ORP level decreased rapidly as the threshold ORP decreased (Table 2). Whereas an SOL ≤5 minutes was reached in 47 naps in 21 patients, ORP decreased <1.0 in ≤5 minutes in only 13 naps in nine patients and decreased <0.5 (deep sleep) in only one patient (Table 2 and Figure 4B). Measurement of latency to reaching different levels of ORP, in addition to conventional SOL, may enhance the specificity of the MSLT in this respect. Such a prediction obviously needs experimental validation, and it would be quite interesting to reanalyze the records of Drake et al4 with this in mind since such a study is very difficult to replicate.
ORP as a quality control instrument for MSLTs
The ORP range in which SO is identified (1.0–2.0, Figure 2) is associated with much inter-rater disagreement in scoring sleep vs wakefulness in nocturnal PSGs.5 Thus, it may be expected that large differences in SOL may exist between scorers, particularly when ORP remains between 1 and 2 for long periods (pattern C, Figure 1), which occurred very frequently in this study (81/150). That inter-scorer variability may be responsible for much unwarranted variability in SOL may appear to be at odds with results of studies that reported excellent inter-scorer agreement in scoring the MSLT.19–21 However, the nature of the MSLT dictates high correlation coefficients between scorers. In a substantial fraction of naps, EEG will show an unequivocal awake pattern, and there is no possibility of disagreement (eg, pattern B in Figure 1). SOL will be 20/20 in such cases. In another substantial fraction of naps, sleep progresses rapidly to a stable, deep sleep (pattern A, Figure 1). Here again, any disagreement will be limited to one or two epochs. With a substantial number of points showing agreement at both ends of the spectrum, correlations are bound to be high.
Figure 7A, which shows the agreement between the two technologists of the current study (ICC =0.98), may seem to refute the notion that scoring SO in this ORP range is problematic. However, these technologists had worked together in the same laboratory for >15 years, are well known for their competence, and were trained by the same senior technologist. Reported ICCs between scorers with mixed training experience, scoring clinical MSLTs, range between 0.80 and 0.90.10,19,20 These levels are ordinarily considered excellent. However, in the setting of the MSLT, with large fractions of the data presenting no scoring challenge, such agreements may still be consistent with unacceptable differences in many naps. This is illustrated in Figure 7B, which compares manual SOL with the time at which ORP decreased below a fixed level (1.6) for two epochs. Despite the large differences in SOL in several naps, ICC was a very respectable 0.84.
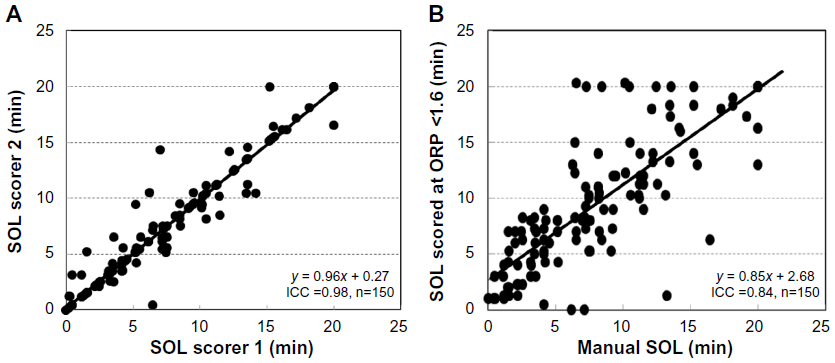 | Figure 7 Agreement between scorers in scoring sleep onset latency. |
Since MSLTs are usually scored by more than one scorer and laboratories generally employ technologists of varied experience, errors may occur, particularly with less experienced technologists. Reporting the ORP at the manually identified SO (ORPSO) and lowest ORP in the nap and in the first 5 minutes would provide a quick check that should prompt a careful review of scoring in some records. Given the current results (Figure 2), examples of instances that would warrant such review include ORPSO >2.0 or <1.0, failure to report SOL when the lowest ORP was <1.3, and SOL >5 minutes when lowest ORP in the first 5 minutes was <1.3.
ORP for evaluation of sleep perception
Sleep misperception is ubiquitous among patients with insomnia (reviewed by Harvey and Tang7). Multiple theories have been advanced for its mechanism, ranging from coexistent psychopathology to impairment of central perception mechanisms to differences in sleep quality or sleep definitions (reviewed by Harvey and Tang7). The present study was not intended to study sleep misperception, and only one of the patients complained of insomnia but had no evidence of sleep misperception. Nonetheless, the data collected during this study, particularly including quantitative data on depth of sleep, gave us the opportunity to study the relation between sleep depth and duration on one hand and sleep perception on the other.
We found that perception of sleep during MSLT naps is highly dependent on both duration and depth of sleep. Whereas at least 8 minutes below an ORP of 2.0 is required for perception 50% of the time, only 1.5 minutes below an ORP of 1.5 and one epoch (30 seconds) <1.0 would suffice. Within the same individual, naps in which sleep was perceived had significantly longer times with low ORP than naps without sleep perception (Table 6). Interestingly, however, there were no significant differences in ORP values between patients who perceived sleep following all naps and those who did not perceive sleep in most naps (Table 7). This suggests that differences between patients in sleep perception reflect differences in the amount of sleep required for perception (ie, perception threshold) rather than how much they slept during naps.
To further investigate differences in perception threshold, the frequency of sleep perception was plotted as a function of ORPINT, which combines both time and sleep depth (Figure 6A). When all 145 data points were used, there was an orderly increase in perception frequency as the integral increased (Figure 6A). However, when average data of individual patients were superimposed on the general plot, perception in eight patients was clearly different from the others (Figure 6B). Interestingly, these patients had no evidence of sleep misperception as indicated by an accurate estimate of total sleep time (TST) following the nocturnal PSG (6.3±0.8 vs 5.7±0.7 hours; not significant), and although they overestimated objective SOL (34±26 vs 15±10 minutes), they were not different from the others in that respect (40±37 vs 18±17 minutes). The lack of clinical sleep misperception in these eight patients may appear to contradict the ORP-based finding of impaired sleep perception during the MSLT. However, these patients had good sleep quality during the nocturnal PSG with little stage N1 sleep where ORP was 1.2±0.4, an average ORP during N2 of 0.81±0.35, and plenty of stage N3 (63±39 minutes) with an average ORP of 0.33±0.23. Thus, even though their perception threshold was high, the threshold was met throughout most nocturnal sleep time. It is possible therefore that clinical misperception develops only in patients with a high perception threshold who also suffer from poor-quality sleep.
The possibility that clinical sleep misperception occurs when patients with a high perception threshold also sustain poor-quality sleep is in keeping with one of the proposed mechanisms of this disorder, namely that it occurs when poor sleep quality is present but is unrecognized by conventional scoring guidelines.7 Thus, Perlis et al22 found that the discrepancy between subjective and objective TST was significantly correlated with beta activity in non-REM sleep, while Krystal et al23 found reduced delta and increased alpha, sigma, and beta activities in patients with sleep misperception. Furthermore, Parrino et al24 found increased cyclic alternating pattern rates and increased arousal index in patients with sleep misperception.
Abnormalities in central perception mechanisms have also been proposed as a mechanism for sleep misperception.7,25 Determination of perception threshold using the current approach may help identify patients with misperception in whom the problem is in the perception mechanisms.
The current results suggest that MSLT may be useful in investigating insomnia with sleep misperception to distinguish patients with an elevated sleep perception threshold from those with other causes.
Insights into IH
Thirteen of the current patients met the currently accepted criteria of IH18 in that they had symptomatic excessive daytime somnolence with unrefreshing sleep and strong urges to fall asleep during the day despite a normal amount of daily sleep, an average SOL <8 minutes on the MSLT, and the absence of other disorders that may explain the excessive sleepiness. Sleep architecture in IH was previously evaluated in several studies, and other than longer sleep time, only minor inconsistent differences from controls were found.26–30 Specifically, slow wave sleep time was reported to be slightly below that in controls in some26,27 but not in other studies.28,29 Sleep fragmentation was reported to be less26 or more29 than control. The current study is the first to use an objective quantitative index of sleep depth in these patients. As indicated earlier,5 each sleep stage encompasses a wide range of sleep depth (Table 2). These differences are not captured by conventional scoring. The current results indicate that the quality of nocturnal sleep in IH is substantially lower than in other patients with various sleep disorders, and this applies to all non-REM sleep stages (Table 3). To put this in perspective, average ORP in stage N2 in 24 patients with moderate/severe obstructive apnea (apnea–hypopnea index 42±30 hour–1) studied in the same laboratory (a subgroup of the data in Table 3) was 0.77±0.31, corresponding to light stage 2. In the current patients, average ORP in stage N2 was considerably higher, at 0.94±0.43 for patients with SOL <8 minutes and 0.89±0.43 for patients with SOL >8 minutes (Table 3). These results suggest that poor sleep quality may, at least partly, be responsible for the excessive sleep need.
We found that our patients were most sleepy in mid-morning (Table 5 and Figure 5). Several other investigators reported on the diurnal variation in SOL of the MSLT in different patient groups, not including IH.31–35 In most studies, early- to mid-afternoon was the reported time of maximum sleepiness.31–34 It is not clear whether the earlier peak in the current study has any significance. At least one other study reported maximum sleepiness in mid-morning in normal subjects.35
Our results show that patients with IH vary considerably in the sleep depth to which they can rapidly (within 5 minutes) progress during naps (Figure 4B). This may have clinical implications with respect to evaluating the severity of the disorder.
Finally, we found little difference between patients with SOL >8 or <8 minutes. The patient shared the same sleep history and complaints (Table 1), and their conventionally scored nocturnal sleep was indistinguishable. In both groups, nocturnal sleep quality was poor (Table 3). And, although SOL was clearly different, all patients could reach deep sleep during at least one nap (Figure 4A). With respect to speed of sleep progression, some patients with SOL >8 minutes reached deep sleep early in naps, while some with SOL <8 minutes failed to progress beyond dozing during the first 5 minutes (Figure 4B). The time of maximum sleepiness was the same (Figure 5). Thus, our results do not support a clear distinction between those with SOL >8 or <8 minutes. Rather, these patients with the same complaints likely represent a spectrum of severity within the same disorder.
Limitations
The enhancements proposed here remain only of presumptive clinical utility. Use of this new approach must await experimental confirmation a) that reaching a low ORP level early during naps is more predictive than a short SOL of loss of vigilance during daytime activities; b) that patients with sleep state misperception have high perception threshold, as measured here; and c) that instances of high ORP (eg, >2.0) at SOL will, upon review, prove to be erroneous in many cases and instances of ORP going <1.0 with no identified SOL will also prove erroneous in many cases. Nonetheless, it was necessary to perform this exploratory study first to determine the range of these values/responses in order to formulate hypotheses for further testing.
Average sleep time in the pre-MSLT sleep study was less than the 6 hours recommended (Table 2).18 This was dictated by the need to begin the MSLT at 7.30 am because of staffing issues. This recommendation is primarily to avoid uncertainty about a diagnosis of narcolepsy in case there were two REM SOs. None of the current patients had more than one SOREM. In addition, there was no correlation between TST in the preceding PSG and average SOL during the MSLT (r=0.16, P=0.39). Thus, the results pertaining to IH are not likely to have been impacted by the shorter pretest sleep time. In particular, the data regarding ORP during nocturnal sleep could not have been affected.
In summary, this study shows that incorporating a continuous measure of sleep depth in the MSLT may enhance the clinical utility of the test by a) providing information about the depth of sleep reached during the nap and hence the likelihood of serious lapses in vigilance; b) serving as a quality control tool to identify errors in scoring SOL; and c) making it possible to identify abnormalities in the sleep perception threshold.
Acknowledgment
This study was supported by funds from the Department of Medicine, University of Manitoba.
Disclosure
MY is the owner of YRT Ltd, the company that developed the ORP technology. The other authors report no conflicts of interest in this work.
References
Littner MR, Kushida C, Wise M, et al. Practice parameters for clinical use of the multiple sleep latency test and the maintenance of wakefulness test. Sleep. 2005;28(1):113–121. | |
Coelho FM, Narayansingh M, Murray BJ. Testing sleepiness and vigilance in the sleep laboratory. Curr Opin Pulm Med. 2011;17(6):406–411. | |
Levine B, Roehrs T, Zorick F, Roth T. Daytime sleepiness in young adults. Sleep. 1988;11(1):39–46. | |
Drake C, Roehrs T, Breslau N, et al. The 10-year risk of verified motor vehicle crashes in relation to physiologic sleepiness. Sleep. 2010;33(6):745–752. | |
Younes M, Ostrowski M, Soiferman M, et al. Odds ratio product of sleep EEG as a continuous measure of sleep state. Sleep. 2015; 38(4):641–654. | |
Iber C, Ancoli-Israel S, Chesson AL Jr, Quan SF. The AASM Manual for the Scoring of Sleep and Associated Events. Westchester, IL: American Academy of Sleep Medicine; 2007. | |
Harvey AG, Tang NK. (Mis)perception of sleep in insomnia: a puzzle and a resolution. Psychol Bull. 2012;138(1):77–101. | |
Malhotra A, Younes M, Kuna ST, et al. Performance of an automated polysomnography scoring system versus computer-assisted manual scoring. Sleep. 2013;36(4):573–582. | |
Younes M, Younes MK, Giannouli E. Accuracy of automatic polysomnography scoring using frontal electrodes. I. Clin Sleep Med. In press. | |
Arand D, Bonnet M, Hurwitz T, Mitler M, Rosa R, Sangal RB. The clinical use of the MSLT and MWT. Sleep. 2005;28(1):123–144. | |
Rosenthal L, Roehrs TA, Rosen A, Roth T. Level of sleepiness and total sleep time following various time in bed conditions. Sleep. 1993;16(3):226–232. | |
Roehrs T, Merlotti L, Petrucelli N, Stepanski E, Roth T. Experimental sleep fragmentation. Sleep. 1994;17(5):438–443. | |
Bliwise D, Seidel W, Karacan I, et al. Daytime sleepiness as a criterion in hypnotic medication trials: comparison of triazolam and flurazepam. Sleep. 1983;6(2):156–163. | |
Johnson LC, Spinweber CL, Gomez SA. Benzodiazepines and caffeine: effect on daytime sleepiness, performance, and mood. Psychopharmacology. 1990;101(2):160–167. | |
Cassel W, Ploch T, Becker C, Dugnus D, Peter JH, von Wichert P. Risk of traffic accidents in patients with sleep-disordered breathing reduction with nasal CPAP. Eur Respir J. 1996;9(12):2606–2611. | |
George CF, Boudreau AC, Smiley A. Effects of nasal CPAP on simulated driving performance in patients with obstructive sleep apnoea. Thorax. 1997;52(7):648–653. | |
Johnson LC, Spinweber CL, Gomez SA, Matteson LT. Daytime sleepiness, performance, mood, nocturnal sleep: the effect of benzodiazepine and caffeine on their relationship. Sleep. 1990;13(2):121–135. | |
American Academy of Sleep Medicine. International Classification of Sleep Disorders. 3rd ed. Darien, IL: American Academy of Sleep Medicine; 2014. | |
Drake CL, Rice MF, Roehrs TA, Rosenthal L, Guido P, Roth T. Scoring reliability of the multiple sleep latency test in a clinical population. Sleep. 2000;23(7):911–913. | |
Benbadis SR, Qu Y, Perry MC, Dinner DS, Warnes H. Interrater reliability of the multiple sleep latency test. Electroencephalogr Clin Neurophysiol. 1995;95(4):302–304. | |
Chen L, Ho CK, Lam VK, et al. Interrater and intrarater reliability in multiple sleep latency test. J Clin Neurophysiol. 2008;25(4):218–221. | |
Perlis ML, Smith MT, Andrews PJ, Orff H, Giles DE. Beta/gamma EEG activity in patients with primary and secondary insomnia and good sleeper controls. Sleep. 2001;24(1):110–117. | |
Krystal AD, Edinger JD, Wohlgemuth WK, Marsh GR. NREM sleep EEG frequency spectral correlates of sleep complaints in primary insomnia subtypes. Sleep. 2002;25(6):630–640. | |
Parrino L, Milioli G, De Paolis F, Grassi A, Terzano MG. Paradoxical insomnia: the role of CAP and arousals in sleep misperception. Sleep Med. 2009;10(10):1139–1145. | |
Mercer JD, Bootzin RR, Lack LC. Insomniacs’ perception of wake instead of sleep. Sleep. 2002;25(5):564–571. | |
Vernet C, Arnulf I. Idiopathic hypersomnia with and without long sleep time: a controlled series of 75 patients. Sleep. 2009;32:753–759. | |
Sforza E, Gaudreau H, Petit D, Montplaisir J. Homeostatic sleep regulation in patients with idiopathic hypersomnia. Clin Neurophysiol. 2000;11:277–282. | |
Vgontzas AN, Bixler EO, Kales A, Criley C, Vela-Bueno A. Differences in nocturnal and daytime sleep between primary and psychiatric hypersomnia: diagnostic and treatment implications. Psychosom Med. 2000;62:220–226. | |
Pizza F, Ferri R, Poli F, Vandi S, Consentino FI, Plazzi G. Polysomnographic study of nocturnal sleep in idiopathic hypersomnia without long sleep time. J Sleep Res. 2013;22:185–196. | |
Billiard M, Sonka K. Idiopathic hypersomnia. Sleep Med Rev. 2016;29:23–33. | |
Richardson GS, Carskadon MA, Flagg W, Van den Hoed J, Dement WC, Mitler MM. Excessive daytime sleepiness in man: multiple sleep latency measurement in narcoleptic and control subjects. Electroencephalogr Clin Neurophysiol. 1978;45:621–627. | |
Reynolds CF III, Coble PA, Kupfer DJ, Holzer BC. Application of the multiple sleep latency test in disorders of excessive sleepiness. Electroencephalogr Clin Neurophysiol. 1982;53:443–452. | |
Clodoré M, Benoit O, Foret J, Bouard G. The Multiple Sleep Latency Test: individual variability and time of day effect in normal young adults. Sleep. 1990;13:385–394. | |
Dostalova S, Susta M, Vorlova T, Sonka K. Sleepiness in patients with obstructive sleep apnoea – daytime course and impact of nocturnal respiratory events. Neuro Endocrinol Lett. 2012;33:684–688. | |
Danker-Hopfe H, Kraemer S, Dorn H, Schmidt A, Ehlert I, Herrmann WM. Time-of-day variations in different measures of sleepiness (MSLT, pupillography, and SSS) and their interrelations. Psychophysiology. 2001;38:828–835. |
 © 2016 The Author(s). This work is published and licensed by Dove Medical Press Limited. The full terms of this license are available at https://www.dovepress.com/terms.php and incorporate the Creative Commons Attribution - Non Commercial (unported, v3.0) License.
By accessing the work you hereby accept the Terms. Non-commercial uses of the work are permitted without any further permission from Dove Medical Press Limited, provided the work is properly attributed. For permission for commercial use of this work, please see paragraphs 4.2 and 5 of our Terms.
© 2016 The Author(s). This work is published and licensed by Dove Medical Press Limited. The full terms of this license are available at https://www.dovepress.com/terms.php and incorporate the Creative Commons Attribution - Non Commercial (unported, v3.0) License.
By accessing the work you hereby accept the Terms. Non-commercial uses of the work are permitted without any further permission from Dove Medical Press Limited, provided the work is properly attributed. For permission for commercial use of this work, please see paragraphs 4.2 and 5 of our Terms.