")
Back to Journals » International Journal of Nanomedicine » Volume 10 » Issue 1
Enhanced magnetic resonance imaging and staining of cancer cells using ferrimagnetic H-ferritin nanoparticles with increasing core size
Authors Cai Y, Cao C, He X, Yang C, Tian L, Zhu R, Pan Y
Received 30 December 2014
Accepted for publication 16 February 2015
Published 1 April 2015 Volume 2015:10(1) Pages 2619—2634
DOI https://doi.org/10.2147/IJN.S80025
Checked for plagiarism Yes
Review by Single anonymous peer review
Peer reviewer comments 4
Editor who approved publication: Professor Lei Yang
Yao Cai,1–3 Changqian Cao,1,2 Xiaoqing He,1 Caiyun Yang,1–3 Lanxiang Tian,1,2 Rixiang Zhu,2 Yongxin Pan1,2
1France–China Bio-Mineralization and Nano-Structures Laboratory, 2Paleomagnetism and Geochronology Laboratory, Key Laboratory of the Earth and Planetary Physics, Institute of Geology and Geophysics, Chinese Academy of Sciences, 3University of Chinese Academy of Sciences, Beijing, People’s Republic of China
Purpose: This study is to demonstrate the nanoscale size effect of ferrimagnetic H-ferritin (M-HFn) nanoparticles on magnetic properties, relaxivity, enzyme mimetic activities, and application in magnetic resonance imaging (MRI) and immunohistochemical staining of cancer cells.
Materials and methods: M-HFn nanoparticles with different sizes of magnetite cores in the range of 2.7–5.3 nm were synthesized through loading different amounts of iron into recombinant human H chain ferritin (HFn) shells. Core size, crystallinity, and magnetic properties of those M-HFn nanoparticles were analyzed by transmission electron microscope and low-temperature magnetic measurements. The MDA-MB-231 cancer cells were incubated with synthesized M-HFn nanoparticles for 24 hours in Dulbecco’s Modified Eagle’s Medium. In vitro MRI of cell pellets after M-HFn labeling was performed at 7 T. Iron uptake of cells was analyzed by Prussian blue staining and inductively coupled plasma mass spectrometry. Immunohistochemical staining by using the peroxidase-like activity of M-HFn nanoparticles was carried out on MDA-MB-231 tumor tissue paraffin sections.
Results: The saturation magnetization (Ms), relaxivity, and peroxidase-like activity of synthesized M-HFn nanoparticles were monotonously increased with the size of ferrimagnetic cores. The M-HFn nanoparticles with the largest core size of 5.3 nm exhibit the strongest saturation magnetization, the highest peroxidase activity in immunohistochemical staining, and the highest r2 of 321 mM-1 s-1, allowing to detect MDA-MB-231 breast cancer cells as low as 104 cells mL-1.
Conclusion: The magnetic properties, relaxivity, and peroxidase-like activity of M-HFn nanoparticles are size dependent, which indicates that M-HFn nanoparticles with larger magnetite core can significantly enhance performance in MRI and staining of cancer cells.
Keywords: magnetic nanoparticles, magnetoferritin, peroxidase-like activity, magnetic resonance imaging, cancer cells
Introduction
Application of magnetic nanoparticles in magnetic resonance imaging (MRI) and immunoassay is mainly dependent on the best performance of superparamagnetism below a critical size value.1 The superparamagnetic properties make magnetic nanoparticles monodisperse and exhibit high enzyme mimetic activity. Among the various magnetic nanoparticles, magnetoferritin was first synthesized within horse spleen ferritin (HoSF) cavity through removing native ferrihydrite core and replacing magnetite/maghemite core.2–4 Recently, a novel magnetoferritin with a magnetite core, named as M-HFn, was successfully synthesized by using genetically engineered recombinant human H chain ferritin (HFn) as a biotemplate.5–7 The HFn shell is stable as a hydrophilic protein which is tolerant to heat and urea or guanidinium chloride due to the special structure with outer diameter of 12 nm and inner cavity diameter of 8 nm.8 Several studies have demonstrated that without tumor-targeted ligand modification, the HFn shell of M-HFn nanoparticles can be specifically targeted to transferrin receptor 1 (TfR1) overexpressed on various cancer cells,9–13 which allow efficiently distinguishing cancerous cells from normal cells both in vitro and in vivo. Because of their high transverse relaxivity and good peroxidase-like activity,11,14 the M-HFn nanoparticles are found to be a very promising contrast agent for the in vivo detection of microscopic (<1–2 mm) tumors by MRI and in vitro detection of tumor tissues with a high sensitivity of 98% and specificity of 95%.10,11 In addition, tumor-targeted arginine–glycine–aspartate peptide can be easily loaded on the HFn shell via genetic means, which make M-HFn nanoparticles specifically bind to αvβ3 integrin implicated in tumor of a variety of cancer types.5,15
The nanoscale size plays a key role in avoiding from agglomeration, usage of MRI, clinical diagnosis, and therapeutics.16–20 Compared with traditional magnetoferritin synthesized using HoSF cavity as a template, the genetic engineering of HFn cavity provides a superior nanoplatform for synthesizing monodispersed, noninteracting, and stoichiometric magnetite nanoparticles with nearly the same spherical shape, narrow size distribution, and high crystallinity.5–7,14,21 Thus, the M-HFn nanoparticles are ideal for studying the nanoscale size effects on magnetic properties, MRI and immunoassay, and so forth.
In this study, M-HFn nanoparticles with different sizes of magnetite cores were successfully synthesized through strictly controlling iron loading into HFn shells. The nanoscale size effects on application of M-HFn nanoparticles in MRI and immunohistochemical staining of cancer cells were analyzed and discussed.
Materials and methods
Preparation of recombinant ferritin cage
The recombinant plasmid pET12b-HFn, which contains the sequence coding of the human HFn, was transformed into Escherichia coli strain Rosetta. The E. coli cells were grown at 37°C in Luria–Bertani medium, with ampicillin and chloromycetin acting as selection markers, for 3 hours. Isopropyl-β-D-thiogalactopyranoside (1 mM) was used as an inductive agent to induce the expression of ferritin. The E. coli cells were incubated at 30°C for 10 hours. Cells were harvested by centrifugation and washed in Tris–HCl buffer (0.025 M Tris, 0.1 M NaCl, pH 7.4). The solution was sonicated on ice–water mixture, and the supernatant was then acquired by centrifugation. To remove other proteins, the supernatant was heated at 75°C for 15 minutes. Finally, the HFn was purified through size exclusion chromatography (Sepharose 6B, GE Healthcare), and the purity of HFn was analyzed by sodium dodecyl sulfate polyacrylamide gel electrophoresis (PAGE). The protein concentration was determined by bicinchoninic acid protein assay reagent (Pierce) with bovine serum albumin as standard.
Synthesis of M-HFn nanoparticles
The M-HFn nanoparticles were synthesized using our previous experimental procedure with minor modifications.6 Fe (II) was added in a rate of 50 Fe/protein/minute. Simultaneously, freshly prepared H2O2 was added as an oxidant in accordance with stoichiometric equivalents (1:3, H2O2:Fe2+). After adding theoretical 1,000, 3,000, 5,000, and 7,000 iron atoms per protein cage to the reaction vessel, the reaction continued for another 5 minutes. Then, 200 μL of 300 mM sodium citrate was added to chelate any free iron to each sample. Finally, the purification was performed through centrifugation and size exclusion chromatography. These four sets of synthesized M-HFn nanoparticles are named here as M-HFn1000, M-HFn3000, M-HFn5000, and M-HFn7000, respectively.
Characterization of synthesized M-HFn nanoparticles
The core structure and composition of M-HFn nanoparticles were analyzed by transmission electron microscope (TEM). TEM observations were performed on a FEI-TECNAI G2 F20 electron microscope with an accelerating voltage of 200 keV. The size of M-HFn core for each sample set was determined by measuring 800 particles. The crystalline structure of cores was examined by selected area electron diffraction (SAED) patterns. The stability and integrity of M-HFn protein cages were examined by native PAGE and circular dichroism (CD) spectra analysis. The gels were used to perform protein staining with Coomassie Brilliant Blue R250 and iron staining with potassium ferrocyanide. The CD spectra were performed using a Chirascan™-Plus CD spectrometer (Applied Photophysics, Leatherhead, UK) at 190–300 nm (bandwidth: 1 nm) with protein concentration of 0.15 mg mL−1.
The magnetic measurements were performed on a Quantum Design MPMS SQUID magnetometer (Model XP-5XL, with magnetic moment sensitivity of 5.0×10⁻¹⁰ Am2). Low-field magnetization curves were measured between 5 K and 200 K in a field of 1.5 mT, after the sample was cooled to 5 K in zero field (zero-field cooling) and after cooling in a 1.5 mT field (field cooling). To evaluate magnetostatic interactions of these M-HFn nanoparticles, the acquisition of isothermal remanent magnetization and DC field demagnetization curves were measured at 5 K in DC field up to ±1,000 mT. For each field step, a constant magnetic field was applied for 120 seconds; the remanent moment was measured after removal of the field and a delay of 120 seconds. Magnetostatic interactions between M-HFn cores were evaluated using Wohlfarth–Cisowski test.22 The hysteresis loops at 5 K were also measured in fields of ±3 T.
The real iron content in the M-HFn nanoparticles was determined by inductively coupled plasma mass spectrometry (ICP-MS) (Agilent, 7500A). Nitration of all samples was performed with high-purity hydrogen nitrate at high temperature in a clean room. The solution volume of all samples was quantified to a constant value of 1 mL. Calculation of iron content was done by iron standard.
The MRI experiments were performed on a Bruker Biospec imager at 4.7 T field. The transverse relaxation times (T2) in phosphate-buffered saline (PBS) (iron concentration of 0–1 mM) were measured using multi-slice multi-echo (MSME) sequence with the following parameters: field of view (FOV) =5 cm ×5 cm, matrix =128×96, repetition time (TR) =3,000 ms, echo time (TE) =8.5–85 ms, and ten echoes. To measure the longitudinal relaxation times (T1), MSME sequence was used with the following parameters: FOV =5 cm ×5 cm, matrix =128×96, TR =90 ms, 150 ms, 300 ms, 500 ms, 800 ms, 1,200 ms, 2,000 ms, and 3,000 ms, and TE =8.5 ms. The T1 for each sample was calculated in MATLAB (The Mathworks, R2012b) by using the equation of f(x)=a+c×(1−exp(−1×x/b)).
Uptake assay in cancer cells and MRI
In order to assess the size effect on cancer detection applications, the MDA-MB-231 breast cancer cell line with high TfR1 expression was chosen based on our previous studies.10,11 Cancer cells were cultured by using Dulbecco’s Modified Eagle’s Medium (DMEM, cat 12800-058, Invitrogen) supplemented with 10% fetal bovine serum and 1% penicillin–streptomycin solution (cat C0222, Beyotime) at 37°C in 5% CO2 atmosphere. In the present study, cells were seeded into six-well polystyrene plate, and then, M-HFn nanoparticles were added until the cell attachment rate reaches about 80%, while the control group of cells was incubated in the absence of M-HFn nanoparticles. The final concentration of M-HFn nanoparticles in experimental groups was diluted to 0.3 mg mL−1 (protein concentration) in DMEM. After 24 hours of incubation, the medium was removed, and cells were washed three times with PBS. Finally, cells were resuspended in PBS and counted after collecting by using trypsin solution, and then, the cell pellets were dissolved in hydrogen nitrate after being centrifuged and washed in distilled water several times. The amount of Fe taken up by cells was measured by ICP-MS (Agilent, 7700).
For MRI analysis, the cancer cells were treated as described earlier in this paper; uniform gel suspensions (1% agarose gel) were prepared with cell concentration of 3×10⁵ cells mL−1, and placed in a 96-well microtiter plate. Sampling was performed at 7 T on a Bruker Biospec imager using MSME sequence with the following parameters: FOV =3.5 cm ×3.5 cm, matrix =256×256, TR =2,500 ms, TE =20–320 ms, and 16 echoes. To evaluate the efficiency of M-HFn7000, cells of different concentrations were prepared for MRI.
To visualize M-HFn nanoparticles uptaken by cancer cells, a 12-well polystyrene plate-sized glass slide was put in the well before cells seeding. The cells were fixed with 4% formaldehyde subsequently for 1 hour, and then stained with Prussian blue and counterstained with eosin. The glass slide was eventually dehydrated and mounted with neutral gums. All samples were recorded under a light microscope.
Peroxidase activity assay and staining of tumors
The peroxidase activity was examined at room temperature. Constant protein concentration of M-HFn (0.25 mg mL−1) nanoparticles and 500 mM H2O2 were used in 0.2 M sodium acetate buffer (pH 4.5), and 0.2 mg mL−1 of 3,3′,5,5′-tetramethylbenzidine (TMB, Sigma) was used as the substrate. Color reactions were taken for 15 minutes and then recorded. 0.05 M Tris–HCl (pH 7.5) was used as the color reaction buffer, while 3,3′-diaminobenzidine tetrahydrochloride (DAB, Sigma) was used as the substrate. To further characterize the peroxidase-like activity of M-HFn nanoparticles, quadruple amount of sodium acetate buffer and half amount of M-HFn, H2O2, and TMB were used in the color reaction; the absorbance was acquired at 652 nm on a spectrometer for 10 minutes.
MDA-MB-231 tumor implantation was performed according to previously used procedure.14 The tumor tissues were harvested and kept in the form of paraffin embedded. For immunohistochemical staining, the paraffin-embedded tissue sections were firstly heated at 55°C for 60 minutes and then deparaffinized by washing twice in xylene for 10 minutes, using an ethanol gradient for sections hydrating. Antigen retrieval was carried out in microwave oven where sections were boiled in 0.01 M citrate buffer (pH 6.0) for 30 minutes. To quench endogenous peroxidase activity, tissue sections were incubated with 0.3% H2O2 in methanol for 20 minutes after cooling to room temperature and rinsing in PBS. Five percent goat serum in PBS was used to block tissue sections for 1 hour at 37°C, and after rinsing, the tissue sections were independently incubated with M-HFn nanoparticles of different core sizes (2 μM) overnight at 4°C. Then, sections were re-incubated at 37°C for 1 hour and rinsed. Freshly prepared DAB was used for color developing, while hematoxylin was used for counterstaining. All sections were dehydrated in a gradient ethanol and mounted with neutral gums eventually. The analysis of stained sections was done under a microscope, and quantitative analysis was done using Image Pro Plus software (version 6.0). The measurement parameter was density mean, calculated by integrated optical density divided by area sum, and the intensity was averaged from five FOVs for ten tissue sections.
Results
Structure of M-HFn nanoparticles
By loading 1,000, 3,000, 5,000, and 7,000 iron atoms, the synthesized M-HFn nanoparticle samples M-HFn1000, M-HFn3000, M-HFn5000, and M-HFn7000, respectively, in the present study are monodispersed (Figure 1A), having well-crystalline cores with clear lattice fringes (Figure 1B). No obvious lattice defects (such as dislocation and stacking fault) were found. The SAED patterns consist of five distinct rings (Figure 1C), indexed to be the (220), (311), (400), (511), and (440) lattice planes of magnetite. The mean size of the magnetite cores in the M-HFn1000, M-HFn3000, M-HFn5000, and M-HFn7000 nanoparticles is 2.7±0.6 nm, 3.3±0.8 nm, 4.4±1.2 nm, and 5.3±1.3 nm, respectively (Figure 1D and Table 1), with major_axis/minor_axis ratios of 1.15, 1.13, 1.12, and 1.11, respectively.
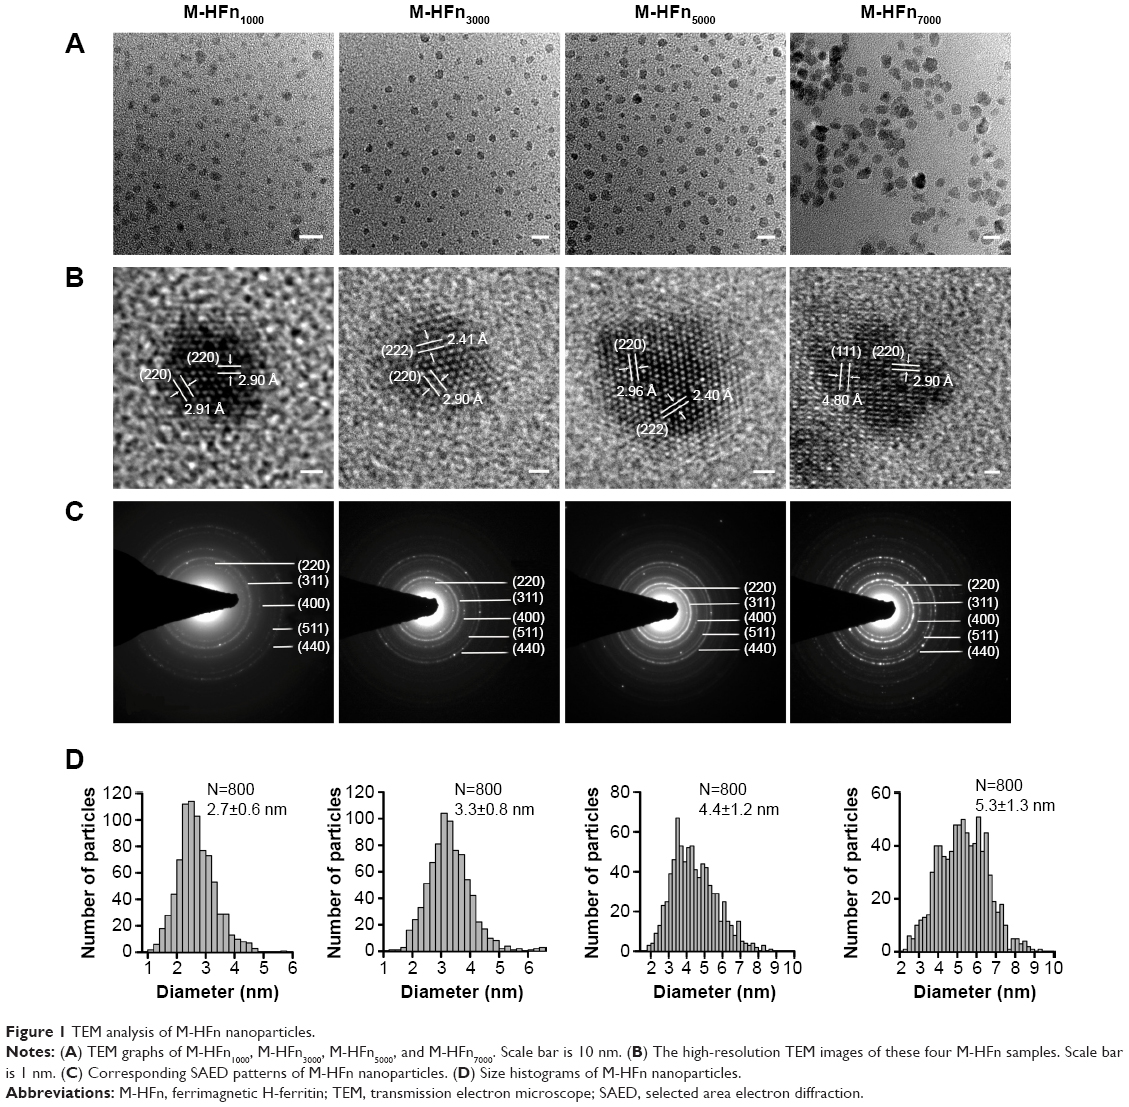 | Figure 1 TEM analysis of M-HFn nanoparticles. |
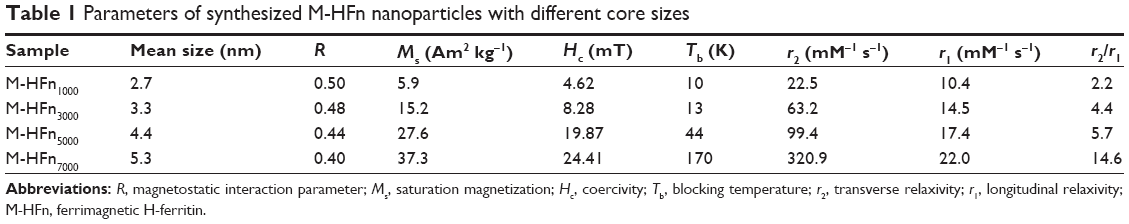 | Table 1 Parameters of synthesized M-HFn nanoparticles with different core sizes |
Iron content of the synthesized M-HFn nanoparticles determined by using ICP-MS (Agilent, 7500A) with external and internal standard iron calibration showed that the average iron content per protein of the synthesized M-HFn1000, M-HFn3000, M-HFn5000, and M-HFn7000 was 786, 1,707, 2,456, and 4,709 Fe atoms, respectively. The loss of iron might be due to the formation of iron oxide or remaining as free iron outside of protein shells during the reaction period used in this study, which were removed.
Native PAGE and CD spectra of the synthesized M-HFn nanoparticles show that the synthesized M-HFn nanoparticles have intact protein cages (Figure 2). The gradual darkening of blue color from lane 2 to lane 5 (Figure 2A) indicates the increase in iron contents in M-HFn1000, M-HFn3000, M-HFn5000, and M-HFn7000. Comparable protein-staining bands from lane 2 to lane 5 with native HFn protein cage in lane 1 (Figure 2B) and the CD spectra (Figure 2C) indicate that the protein structure of HFn cages/shells in the synthesized M-HFn nanoparticles is likely intact after the mineralization process.
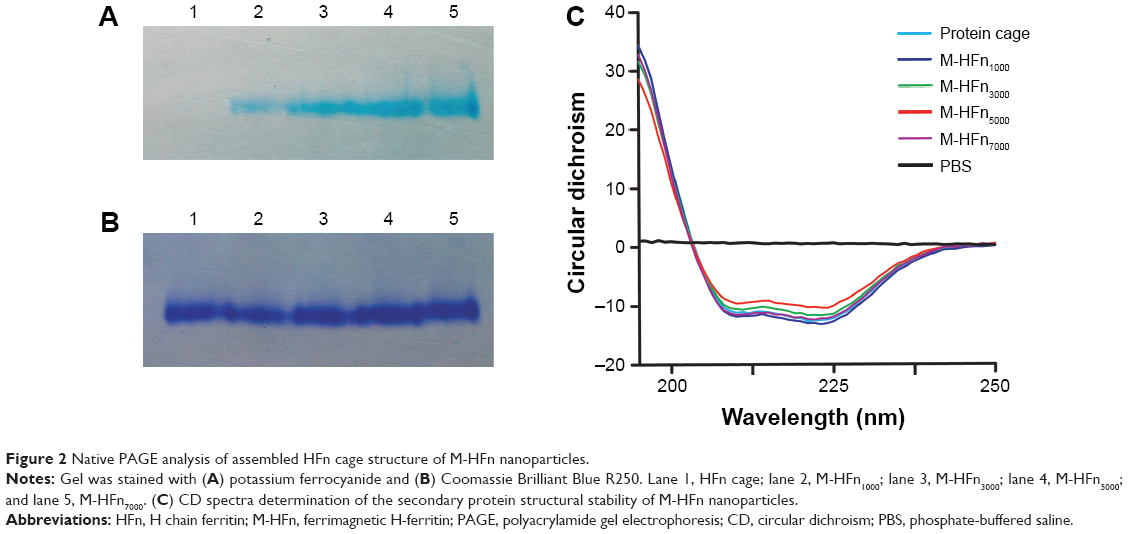 | Figure 2 Native PAGE analysis of assembled HFn cage structure of M-HFn nanoparticles. |
Magnetism of M-HFn nanoparticles
The R-value of the Wohlfarth–Cisowski test of M-HFn1000 is 0.5, suggesting no magnetostatic interactions between the M-HFn cores. However, the R-value of M-HFn3000, M-HFn5000, and M-HFn7000 decreases slightly to 0.48, 0.44, and 0.40, respectively, suggesting weak magnetic interaction in these samples (Table 1 and Figure S1). With the increase in core sizes, the saturation magnetization (Ms), coercivity (Hc), and blocking temperature (Tb) of those samples measured at 5 K are increasing. Specifically, the M-HFn1000, M-HFn3000, M-HFn5000, and M-HFn7000 have Ms values of 5.9 Am2 kg−1, 15.2 Am2 kg−1, 27.6 Am2 kg−1, and 37.3 Am2 kg−1, Hc values of 4.62 mT, 8.28 mT, 19.87 mT, and 24.41 mT, and Tb values of 10 K, 13 K, 44 K, and 170 K, respectively (Figures 3 and S2 and Table 1).
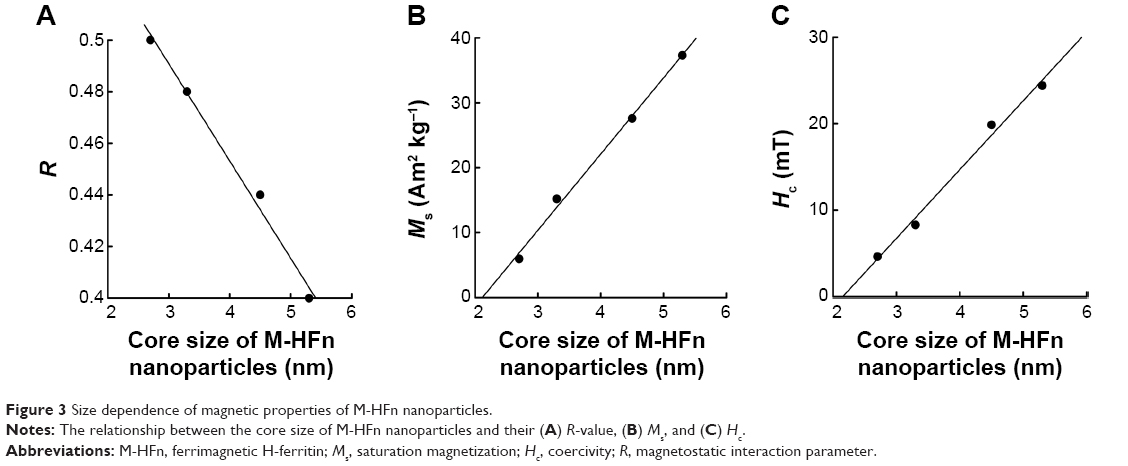 | Figure 3 Size dependence of magnetic properties of M-HFn nanoparticles. |
Relaxivity and peroxidase activity of M-HFn nanoparticles
The determined transverse relaxivity (r2) and longitudinal relaxivity (r1) were acquired by linear mapping of iron concentration, and 1/T2 (R2) and 1/T1 (R1) (Figures S3 and S4). The r2 values of M-HFn1000, M-HFn3000, M-HFn5000, and M-HFn7000 are 22.5 mM−1 s−1, 63.2 mM−1 s−1, 99.4 mM−1 s−1, and 320.9 mM−1 s−1, respectively. The r1 values of these M-HFn nanoparticles are 10.4 mM−1 s−1, 14.5 mM−1 s−1, 17.4 mM−1 s−1, and 22.0 mM−1 s−1. This strongly indicates that the transverse and longitudinal relaxivity increase with the size of M-HFn cores. The values of r2/r1 are 2.2, 4.4, 5.7, and 14.6 for M-HFn1000, M-HFn3000, M-HFn5000, and M-HFn7000, respectively (Table 1).
Peroxidase-like activity of M-HFn nanoparticles tested at constant concentration of HFn nicely increased with size of M-HFn cores (Figure 4). M-HFn nanoparticles catalyze the oxidation of peroxidase substrates TMB and DAB in the presence of H2O2 to give a blue color (Figure 4A) and a brown color product (Figure 4B), respectively. It is clear that the M-HFn nanoparticles with larger size of cores have higher peroxidase-like activity and absorbance. The M-HFn7000 nanoparticles have nearly five times absorbance compared to M-HFn1000 at 10 minutes (Figure 4C).
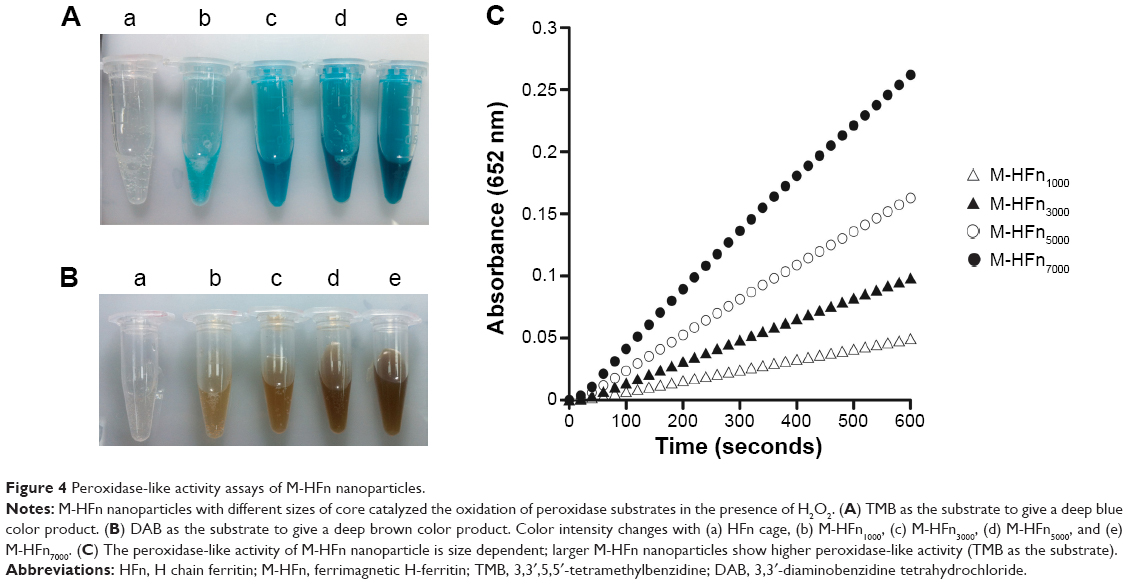 | Figure 4 Peroxidase-like activity assays of M-HFn nanoparticles. |
Uptaken assay and MRI of cancer cells
In vitro MRI of MDA-MB-231 tumor cells after incubation with M-HFn nanoparticles shows obvious dark images compared to cells-only control (Figure 5A). The MDA-MB-231 cancer cells incubated with M-HFn1000, M-HFn3000, M-HFn5000, and M-HFn7000 have T2 values equal to 110.9 ms, 99.1 ms, 90.0 ms, and 81.2 ms, respectively, while the cells-only control (incubated without M-HFn nanoparticles) has a T2 value of 122.5 ms. As shown in Figure 5B, the T2 values of MDA-MB-231 tumor cells with cell densities of 1×10⁴ cells mL−1, 1×10⁵ cells mL−1, 2×10⁵ cells mL−1, and 3×10⁵ cells mL−1 incubated with M-HFn7000 reduce to 73.5%, 66.3%, 63.2%, and 57.8%, respectively, compared with the T2 value of control (0 cells mL−1).
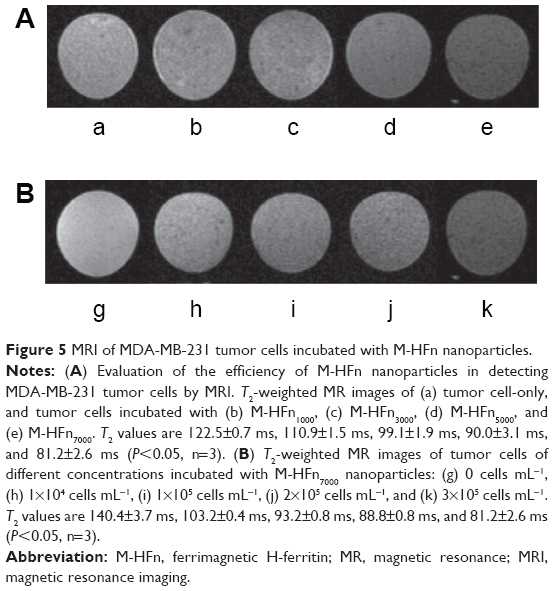 | Figure 5 MRI of MDA-MB-231 tumor cells incubated with M-HFn nanoparticles. |
To further identify iron uptaken by cancer cells, we performed Prussian blue staining for cancer cells after incubation with the M-HFn nanoparticles. Results are shown in Figure 6. It can be seen that there is more blue deposition in cancer cells incubated with M-HFn nanoparticles with larger core size. We also assessed the iron content in cancer cells by ICP-MS and found that cancer cells accumulated 0.16 pg cell−1, 0.29 pg cell−1, 0.80 pg cell−1, and 1.23 pg cell−1 of Fe after being incubated with equal amount of M-HFn1000, M-HFn3000, M-HFn5000, and M-HFn7000 for 24 hours, respectively (Figure 6F).
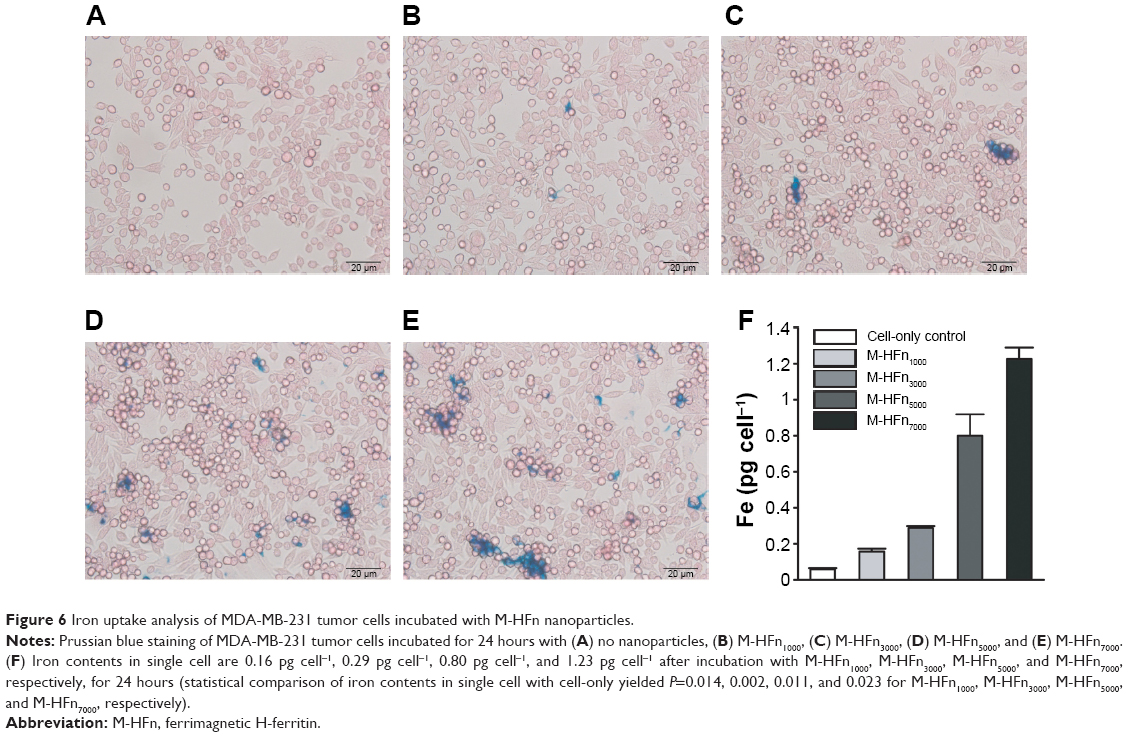 | Figure 6 Iron uptake analysis of MDA-MB-231 tumor cells incubated with M-HFn nanoparticles. |
Immunohistochemical-like staining of xenografted tumor tissues
Figure 7 shows the M-HFn-based peroxidase staining performed on xenografted MDA-MB-231 tumor tissues. Tumor tissues incubated with M-HFn nanoparticles showed brown color, which is in contrast to purple color of the normal tissues counterstained by hematoxylin. Quantitative analysis of effect on staining with M-HFn nanoparticles was performed using Image Pro Plus software, which shows that M-HFn nanoparticles with large core size generate high value of density mean.
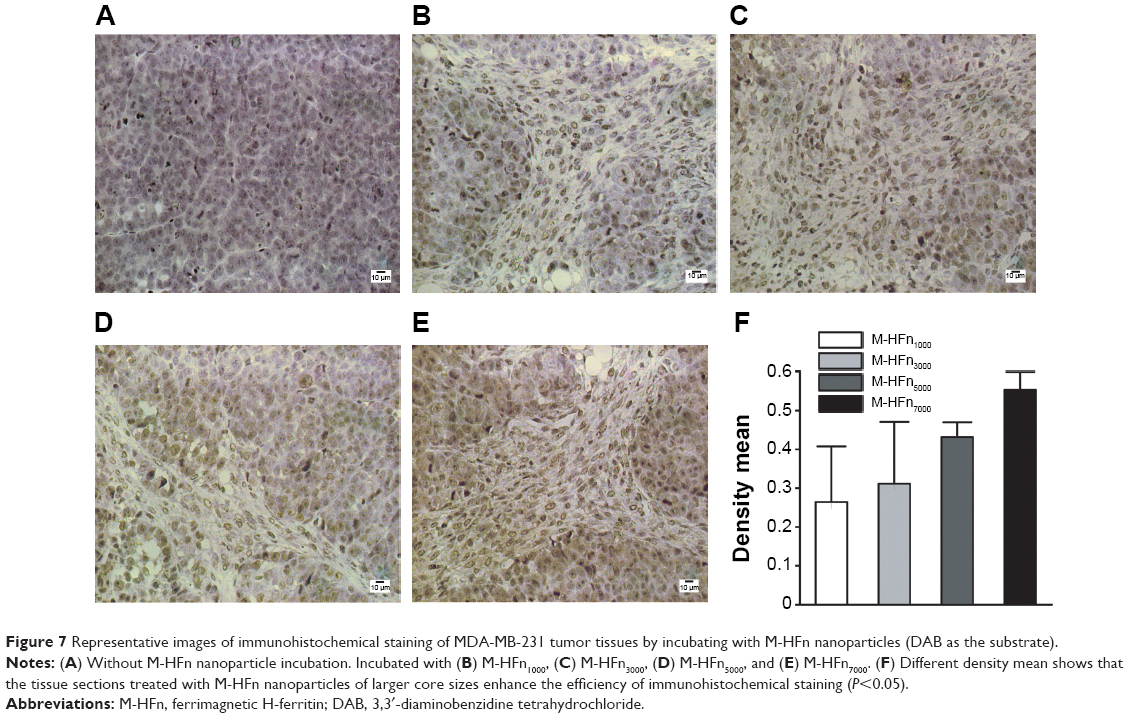 | Figure 7 Representative images of immunohistochemical staining of MDA-MB-231 tumor tissues by incubating with M-HFn nanoparticles (DAB as the substrate). |
Discussion
The M-HFn nanoparticles are different from previously synthesized M-HoSF nanoparticles, which were reconstituted in HoSF. The M-HFn nanoparticles are directly synthesized in recombinant human HFn cavity under well-controlled condition in anaerobic box with stat pH, temperature, and addition rate of Fe (II) and oxidant, while the M-HoSF needs to remove native ferrihydrite cores before reconstitution of magnetite cores. The removal process and the difference of ferritins may affect the mineralization of the core. The uniform size and nearly spherical shape of M-HFn nanoparticles imply that the mineralization of iron oxide core (magnetite) is highly controlled by the HFn protein shells, in spite of non-physiological condition (65°C, pH 8.5). It has been estimated that ferritin cavity can be capable of sorting up to 4,500 Fe atoms as a hydrated ferrihydrite and 8,400 Fe atoms as a magnetite.21,23 In this study, out of theoretically added 7,000 iron atoms, the M-HFn nanoparticle has taken 4,709 Fe atoms per HFn (determined by ICP-MS), forming magnetite core of 5.3 nm. This suggests that the ferritin cage still has the capability to load more iron. Figure 2 indicates that the protein structure of HFn cages/shells in the synthesized M-HFn nanoparticles is nearly intact after the mineralization process.
Owing to the nano-size effect, smaller nanoparticles may have longer circulation half-life in the body and exhibit better contrast.24,25 The smaller size of nanoparticles also influences the relaxivity and contrast enhancement.26–28 It is noted in this study that the M-HFn7000 with the largest core size (5.3 nm) exhibits the highest value of r2 (320.9 mM−1 s−1), which is ten times higher than that of the M-HFn1000 with the smallest magnetite cores (2.7 nm). The increase in transverse relaxivity with increased size of M-HFn cores is well consistent with typical behavior of relatively small particles in motional averaging regime.19 This is mainly because the transverse relaxivity is proportional to the magnetic moment;29 that is, the larger the magnetization particles are, the higher the r2 the particles exhibit.30 The saturation magnetization of M-HFn nanoparticles synthesized here increased from 5.9 Am2 kg−1 to 37.3 Am2 kg−1 with the increasing size from 2.7 nm to 5.3 nm. In addition, the longitudinal relaxivity also increased with the augmentation of core size. The increasing nanoparticle size may enhance the water protons chemically exchanging with surface paramagnetic centers of particles; consequently, T1 relaxation enhanced.31 The values of r1 and ratio of r2/r1 are important parameters for evaluating magnetic nanoparticles as MR-positive contrast agents. In general, T1 agents have r2/r1 ratios of 1–2.32 For M-HFn1000, M-HFn3000, M-HFn5000, and M-HFn7000 nanoparticles, the r2/r1 ratios are 2.2, 4.4, 5.7, and 14.6, respectively (Table 1). Previous study showed that the ultrasmall magnetic iron oxide nanoparticles of 3.3 nm have r2/r1 ratio of 4.2 and they could be used as both positive contrast agents and negative contrast agents.33 The relatively low r2/r1 ratios of M-HFn1000 and M-HFn3000 suggest that they may be potential dual-contrast agents.
As a negative contrast agent, magnetic nanoparticles primarily act to alter transverse relaxation time (T2) values of the water proton surrounding the particles.34 When these nanoparticles present in cells (or tissues) and are subject to an external magnetic field, the magnetic moments of the magnetite crystals align to create large heterogeneous field gradients and dipolar coupling between the magnetic moments of water protons and the magnetic moments of particles, and cause a decrease in signal intensity in T2- and T2*-weighted MRI. Magnetic nanoparticles with higher magnetic moments and transverse relaxivity can significantly shorten the relaxation time of protons. As seen in Figure 5, T2 maps of MDA-MB-231 cancer cells incubated with larger M-HFn nanoparticles show darker images. For MRI detection, cells need to be internally labeled with MRI contrast agents. Enhancing the intracellular cell-labeling efficiency of iron oxide nanoparticles is desired.35 In this study, it shows that the largest M-HFn (M-HFn7000) nanoparticles can sensitively detect cancer cells with very low cell density of 1×10⁴ cells mL−1 of MDA-MB-231 cancer cells, suggesting a promising application in cancer detection.
Previous studies have shown that circulation half-life of magnetic nanoparticles can be reduced drastically if their size is below 10 nm,36,37 while the magnetic nanoparticles will easily be cleared by phagocyte systems, if the size is too large.38,39 For in vivo tumor imaging, M-HFn nanoparticles can be accumulated in tumor tissues via receptor-mediated pathway and not be cleared quickly.11 It was also found by acute toxic study on mice that there was no lethal effect with injection of the M-HFn nanoparticles at proposed high dose over 14 days.11 Figure 6 shows that the quantitative analysis of Fe uptaken is similar to the Prussian blue staining. It can be seen that there is more blue deposition in cancer cells incubated with M-HFn nanoparticles with larger core size, indicating that more iron of M-HFn with larger size was endocytosed by cancer cells. This suggests that more Fe atoms could be loaded into ferritin while keeping the ferritin shell unchanged; the synthesized M-HFn nanoparticles would be more efficient for T2-weighted MRI.
Possessing intrinsic peroxidase-like activity is one of the pronounced features of magnetic nanoparticles.40–42 Figures 4 and 7 show that M-HFn nanoparticles with large size of cores have better performance of the peroxidase activity. This can be attributed to the larger magnetite core having more Fe2+ sites on surface than the smaller size crystals. During the color reaction process of M-HFn nanoparticles, in the presence of H2O2 and oxidant substrate, a key issue is the generation of •OH when H2O2 enters the ferritin cavity and interacts with the iron oxide core of M-HFn nanoparticles. This reaction is strongly influenced by the surface Fe2+.43 The peroxidase-like activity of nanoparticles could be used in various applications such as glucose detection and immunohistochemical detection.44,45 The results in this study also clearly demonstrate that the M-HFn nanoparticles with larger size are capable of being more efficient for immunohistochemical staining of tumor tissues. In other words, large cores can enhance the performance of immunohistochemical staining by taking advantage of peroxidase-like activity of M-HFn nanoparticles.
Many efforts have been made on improving the specificity of magnetic nanoparticles to target molecules by surface-coating modification as well as improving the magnetic properties of the core. For example, ferritin shell was reengineered by fusing tumor cell-specific peptide arginine–glycine–aspartate and green fluorescent protein, forming a new nanostructure for multifunctional imaging of tumor cells.15 On the other hand, gold clusters were successfully synthesized within ferritin shells, and these nanoparticles were used for kidney and liver imaging in live animals.46 The present study demonstrated that, by simply controlling the size of magnetite core, the contrast ability of M-HFn nanoparticles can be finely tuned. Finally, the peroxidase-like activity of magnetic nanoparticles can be utilized to efficiently catalyze the oxidation of phenols.47 Possibly, M-HFn nanoparticles with higher peroxidase-like activity could also be applied in environmental studies.
Conclusion
The M-HFn nanoparticles with different magnetite core sizes can be synthesized by controlling the quantity of iron loading. The synthesized M-HFn nanoparticles have well-crystalline, near spherical-shaped, and ferrimagnetic magnetite cores with intact ferritin shells. Lines of evidences have demonstrated that the magnetic properties, relaxivity, and peroxidase-like activity of M-HFn nanoparticles are clearly size dependent. The M-HFn nanoparticles with larger magnetite cores have superior performance in MRI and immunoassay.
Acknowledgments
This work was supported by the CAS/SAFEA International Partnership Program for Creative Research Teams (KZCX2-YW-T10), the National Natural Science Foundation of China (numbers 41330104 and 41204053), and the R&D of Key Instruments and Technologies for Deep Resources Prospecting (the National R&D Projects for Key Scientific Instruments, number ZDYZ2012-1-01-02). We thank Drs F Fang and H Lei of Wuhan Institute of Physics and Mathematics, CAS, for selfless help in the MRI experiment. We are grateful to three anonymous reviewers for their constructive comments that significantly improved the manuscript.
Disclosure
The authors declare that they have no competing interests.
References
Lu AH, Salabas E, Schüth F. Magnetic nanoparticles: synthesis, protection, functionalization, and application. Angew Chem Int Ed. 2007;46:1222–1244. | ||
Meldrum FC, Heywood BR, Mann S. Magnetoferritin: in vitro synthesis of a novel magnetic protein. Science. 1992;257:522–523. | ||
Moskowitz BM, Frankel RB, Walton SA, et al. Determination of the preexponential frequency factor for superparamagnetic maghemite particles in magnetoferritin. J Geophys Res. 1997;102(22671–22622):22680. | ||
Wong KKW, Douglas T, Gider S, Awschalom DD, Mann S. Biomimetic synthesis and characterization of magnetic proteins (magnetoferritin). Chem Mater. 1998;10:279–285. | ||
Uchida M, Flenniken ML, Allen M, et al. Targeting of cancer cells with ferrimagnetic ferritin cage nanoparticles. J Am Chem Soc. 2006;128: 16626–16633. | ||
Cao C, Tian L, Liu Q, Liu W, Chen G, Pan Y. Magnetic characterization of noninteracting, randomly oriented, nanometer-scale ferrimagnetic particles. J Geophys Res. 2010;115:B07103. | ||
Uchida M, Terashima M, Cunningham CH, et al. A human ferritin iron oxide nano-composite magnetic resonance contrast agent. Magn Reson Med. 2008;60:1073–1081. | ||
Harrison PM, Arosio P. The ferritins: molecular properties, iron storage function and cellular regulation. Biochim Biophys Acta. 1996;1275: 161–203. | ||
Li L, Fang CJ, Ryan JC, et al. Binding and uptake of H-ferritin are mediated by human transferrin receptor-1. Proc Nat Acad Sci U S A. 2010;107:3505–3510. | ||
Fan K, Cao C, Pan Y, et al. Magnetoferritin nanoparticles for targeting and visualizing tumour tissues. Nat Nanotechnol. 2012;7:459–464. | ||
Cao C, Wang X, Cai Y, et al. Targeted in vivo imaging of microscopic tumors with ferritin-based nanoprobes across biological barriers. Adv Mater. 2014;26:2566–2571. | ||
Daniels TR, Delgado T, Rodriguez JA, Helguera G, Penichet ML. The transferrin receptor part I: biology and targeting with cytotoxic antibodies for the treatment of cancer. Clin Immunol. 2006;121:144–158. | ||
Ryschich E, Huszty G, Knaebel HP, Hartel M, Buchler MW, Schmidt J. Transferrin receptor is a marker of malignant phenotype in human pancreatic cancer and in neuroendocrine carcinoma of the pancreas. Eur J Cancer. 2004;40:1418–1422. | ||
Melnikova L, Pospiskova K, Mitroova Z, Kopcansky P, Safarik I. Peroxidase-like activity of magnetoferritin. Microchim Acta. 2014;181: 295–301. | ||
Li K, Zhang ZP, Luo M, et al. Multifunctional ferritin cage nanostructures for fluorescence and MR imaging of tumor cells. Nanoscale. 2012; 4:188–193. | ||
Jun YW, Huh YM, Choi JS, et al. Nanoscale size effect of magnetic nanocrystals and their utilization for cancer diagnosis via magnetic resonance imaging. J Am Chem Soc. 2005;127:5732–5733. | ||
Milivojević D, Babić-Stojić B, Jokanović V, Jaglicčić Z, Makovec D, Jović N. Magnetic properties of ultrasmall iron-oxide nanoparticles. J Alloys Compd. 2014;595:153–157. | ||
Gao L, Zhuang J, Nie L, et al. Intrinsic peroxidase-like activity of ferromagnetic nanoparticles. Nat Nanotechnol. 2007;2:577–583. | ||
Tromsdorf UI, Bigall NC, Kaul MG, et al. Size and surface effects on the MRI relaxivity of manganese ferrite nanoparticle contrast agents. Nano Lett. 2007;7:2422–2427. | ||
Stephen ZR, Kievit FM, Zhang MQ. Magnetite nanoparticles for medical MR imaging. Mater Today. 2011;14:330–338. | ||
Walls MG, Cao C, Yu-Zhang K, Li J, Che R, Pan Y. Identification of ferrous-ferric Fe3O4 nanoparticles in recombinant human ferritin cages. Microsc Microanal. 2013;19:835–841. | ||
Cisowski S. Interacting vs non-interacting single domain behavior in natural and synthetic samples. Phys Earth Planet In. 1981;26:56–62. | ||
Harrison P, Andrews S, Artymiuk P, et al. Probing structure-function relations in ferritin and bacterioferritin. Adv Inorg Chem. 1991;36:449–486. | ||
Hu F, Zhao YS. Inorganic nanoparticle-based T1 and T1/T2 magnetic resonance contrast probes. Nanoscale. 2012;4:6235–6243. | ||
Di Marco M, Sadun C, Port M, Guilbert I, Couvreur P, Dubernet C. Physicochemical characterization of ultrasmall superparamagnetic iron oxide particles (USPIO) for biomedical application as MRI contrast agents. Int J Nanomed. 2007;2:609–622. | ||
Perez JM, Josephson L, O’Loughlin T, Högemann D, Weissleder R. Magnetic relaxation switches capable of sensing molecular interactions. Nat Biotechnol. 2002;20:816–820. | ||
Berret JF, Schonbeck N, Gazeau F, et al. Controlled clustering of superparamagnetic nanoparticles using block copolymers: design of new contrast agents for magnetic resonance imaging. J Am Chem Soc. 2006;128:1755–1761. | ||
Lee JH, Huh YM, Jun YW, et al. Artificially engineered magnetic nanoparticles for ultra-sensitive molecular imaging. Nat Med. 2006;13:95–99. | ||
Koenig SH, Kellar KE. Theory of 1/T1 and 1/T2 NMRD profiles of solutions of magnetic nanoparticles. Magn Reson Med. 1995;34:227–233. | ||
Huang J, Zhong X, Wang L, Yang L, Mao H. Improving the magnetic resonance imaging contrast and detection methods with engineered magnetic nanoparticles. Theranostics. 2012;2:86–102. | ||
Huang G, Li H, Chen J, et al. Tunable T1 and T2 contrast abilities of manganese-engineered iron oxide nanoparticles through size control. Nanoscale. 2014;6:10404–10412. | ||
Caravan P, Ellison JJ, McMurry TJ, Lauffer RB. Gadolinium(III) chelates as MRI contrast agents:structure, dynamics, and applications. Chem Rev. 1999;99:2293–2352. | ||
Li Z, Yi P, Sun Q, et al. Ultrasmall water-soluble and biocompatible magnetic iron oxide nanoparticles as positive and negative dual contrast agents. Adv Funct Mater. 2012;22:2387–2393. | ||
Jun YW, Lee JH, Cheon J. Chemical design of nanoparticle probes for high-performance magnetic resonance imaging. Angew Chem Int Ed. 2008;47:5122–5135. | ||
Lu CW, Hung Y, Hsiao JK, et al. Bifunctional magnetic silica nanoparticles for highly efficient human stem cell labeling. Nano Lett. 2007;7:149–154. | ||
Laurent S, Forge D, Port M, et al. Magnetic iron oxide nanoparticles: synthesis, stabilization, vectorization, physicochemical characterizations, and biological applications. Chem Rev. 2008;108:2064–2110. | ||
Choi HS, Liu W, Misra P, et al. Renal clearance of quantum dots. Nat Biotechnol. 2007;25:1165–1170. | ||
Xie J, Chen K, Lee HY, et al. Ultrasmall c (RGDyK)-coated Fe3O4 nanoparticles and their specific targeting to integrin αvβ3-rich tumor cells. J Am Chem Soc. 2008;130:7542–7543. | ||
Huang J, Bu L, Xie J, et al. Effects of nanoparticle size on cellular uptake and liver MRI with polyvinylpyrrolidone-coated iron oxide nanoparticles. ACS Nano. 2010;4:7151–7160. | ||
Xie J, Zhang X, Wang H, Zheng H, Huang Y. Analytical and environmental applications of nanoparticles as enzyme mimetics. Trends Ana Chem. 2012;39:114–129. | ||
Wei H, Wang E. Nanomaterials with enzyme-like characteristics (nanozymes): next-generation artificial enzymes. Chem Soc Rev. 2013;42:6060–6093. | ||
Beveridge JS, Stephens JR, Williams ME. The use of magnetic nanoparticles in analytical chemistry. Ann Rev Anal Chem. 2011;4:251–273. | ||
Kwan WP, Voelker BM. Decomposition of hydrogen peroxide and organic compounds in the presence of dissolved iron and ferrihydrite. Environ Sci Technol. 2002;36:1467–1476. | ||
Wu Y, Song M, Xin Z, et al. Ultra-small particles of iron oxide as peroxidase for immunohistochemical detection. Nanotechnology. 2011;22:225703. | ||
Wei H, Wang E. Fe3O4 magnetic nanoparticles as peroxidase mimetics and their applications in H2O2 and glucose detection. Anal Chem. 2008;80:2250–2254. | ||
Sun C, Yang H, Yuan Y, et al. Controlling assembly of paired gold clusters with apoferritin nanoreactor for in vivo kidney and biomedical imaging. J Am Chem Soc. 2011;133:8617–8624. | ||
Zuo X, Peng C, Huang Q, et al. Design of a carbon nanotube/magnetic nanoparticle-based peroxidase-like nanocomplex and its application for highly efficient catalytic oxidation of phenols. Nano Res. 2009;2:617–623. |
Supplementary materials
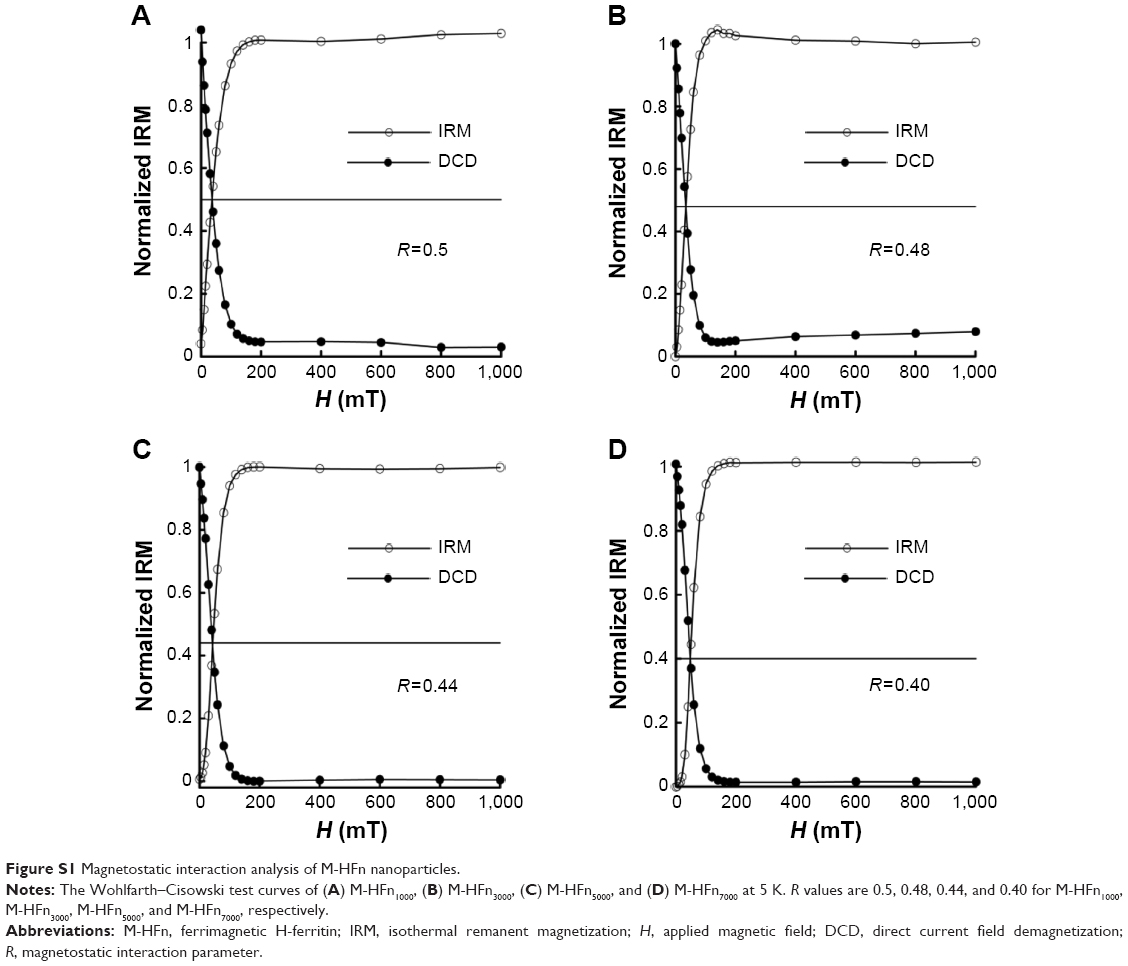 | Figure S1 Magnetostatic interaction analysis of M-HFn nanoparticles. |
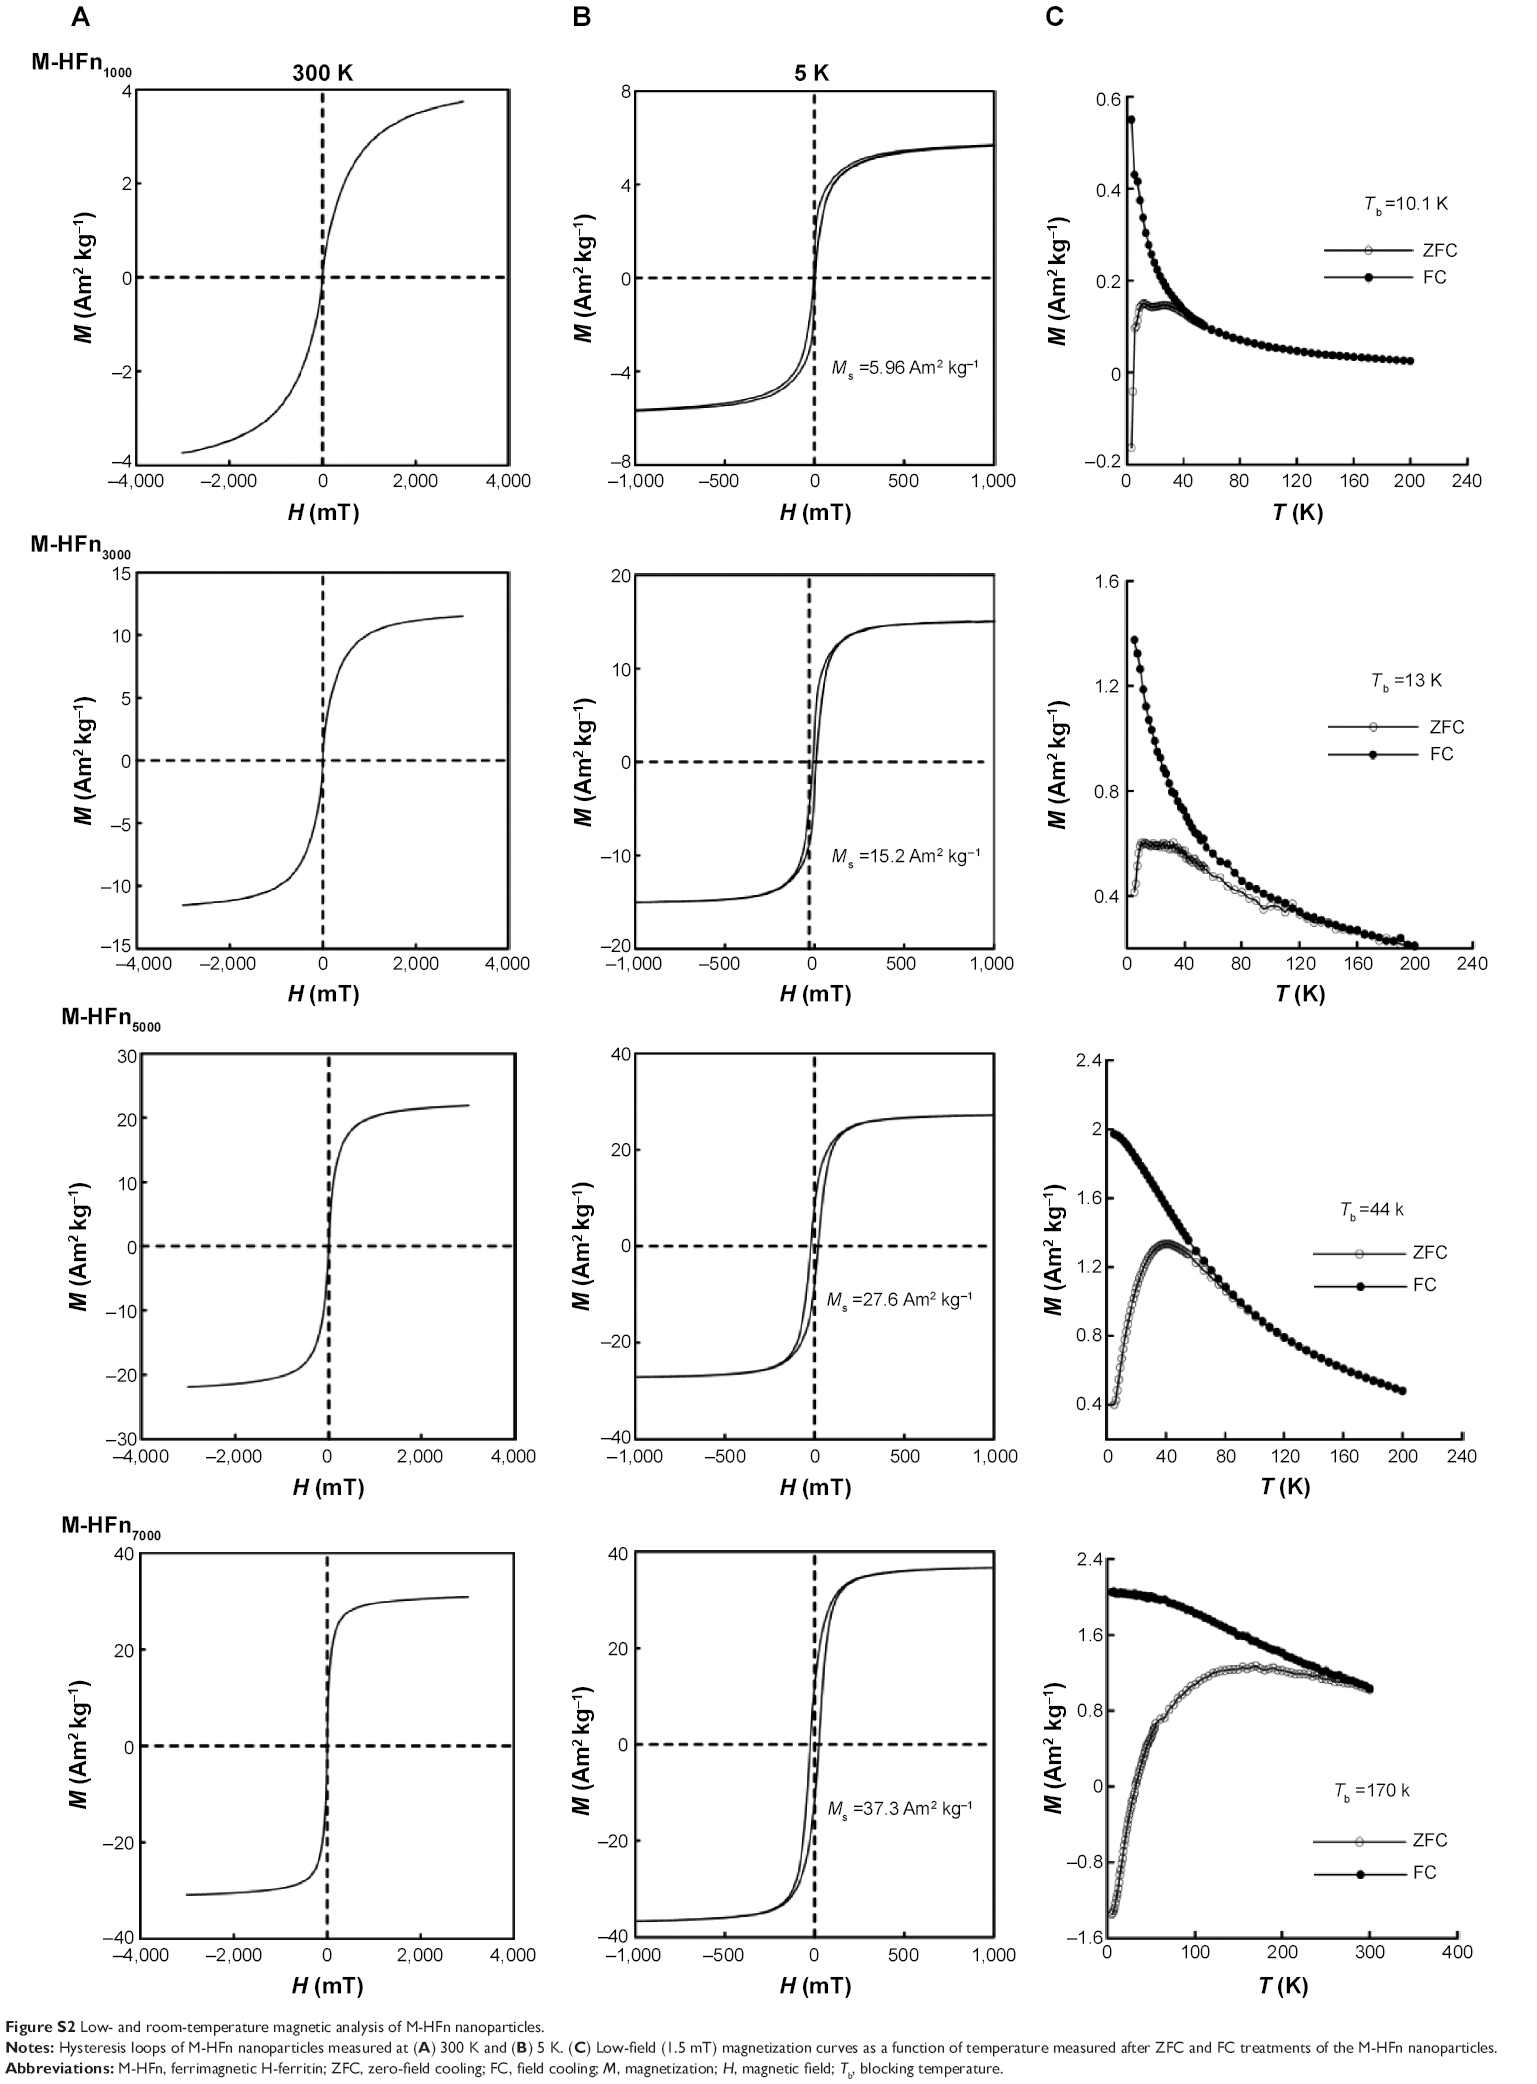 | Figure S2 Low- and room-temperature magnetic analysis of M-HFn nanoparticles. |
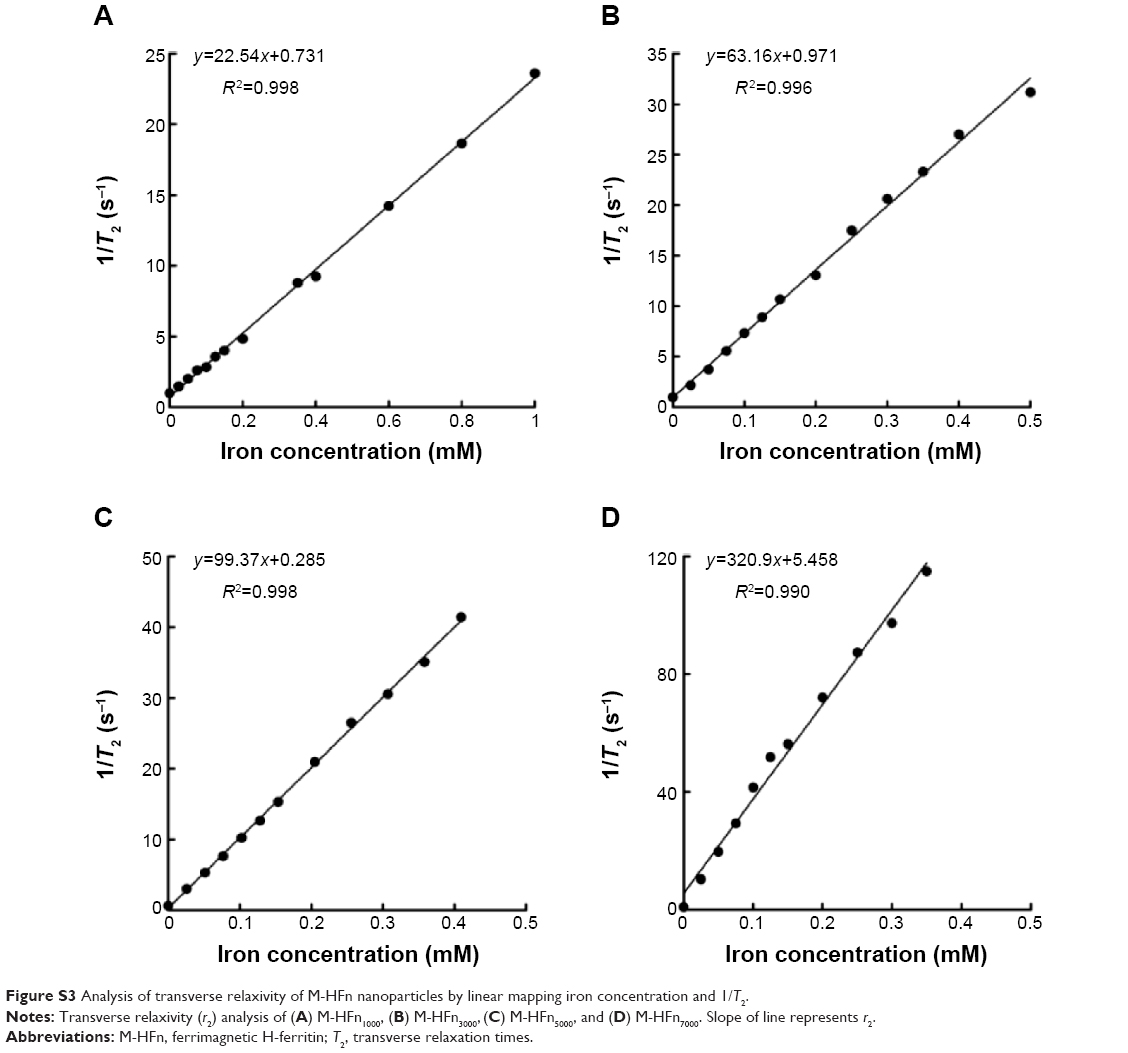 | Figure S3 Analysis of transverse relaxivity of M-HFn nanoparticles by linear mapping iron concentration and 1/T2. |
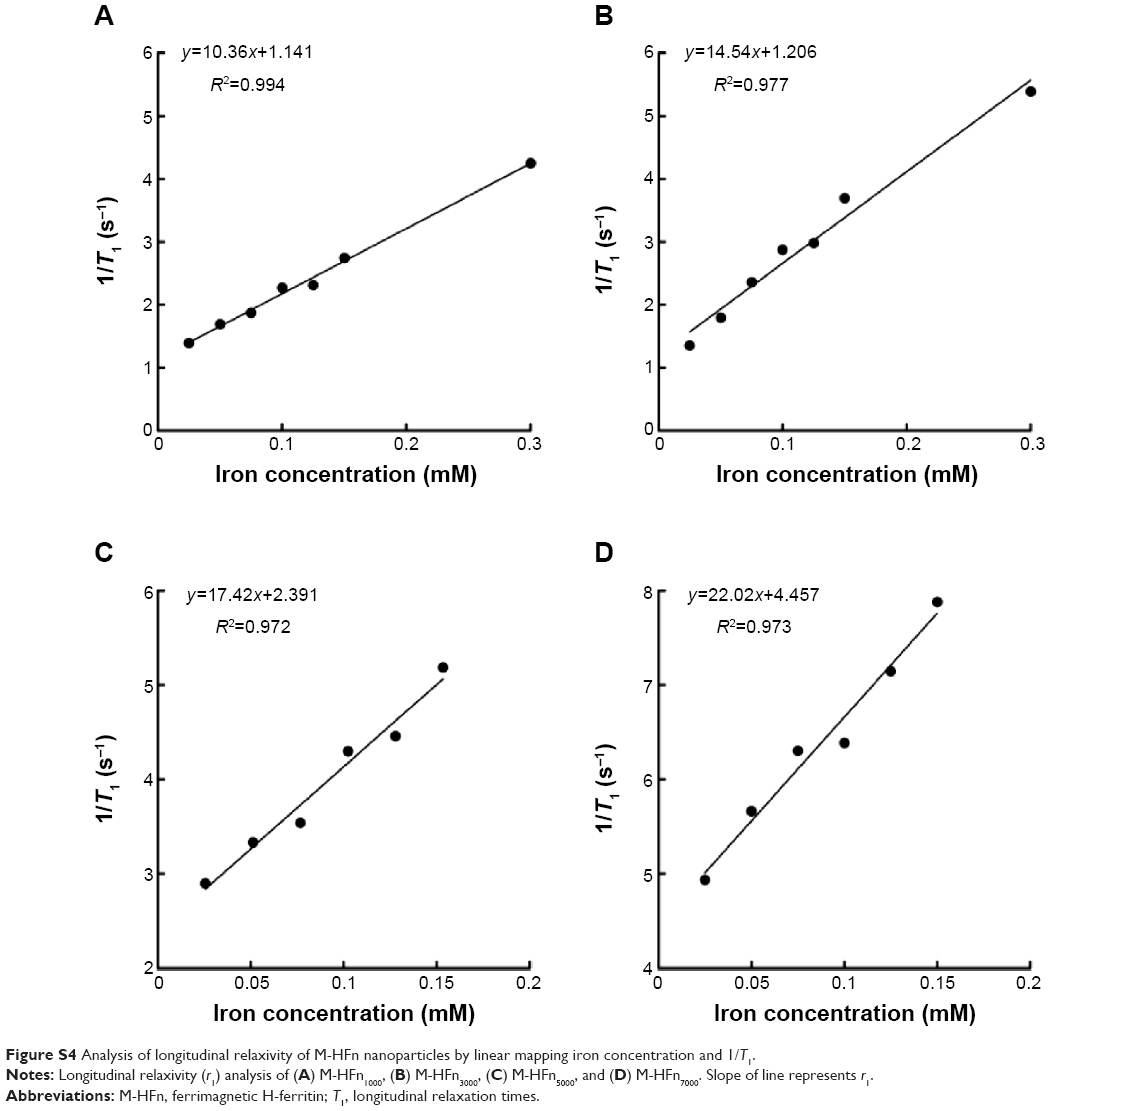 | Figure S4 Analysis of longitudinal relaxivity of M-HFn nanoparticles by linear mapping iron concentration and 1/T1. |
 © 2015 The Author(s). This work is published and licensed by Dove Medical Press Limited. The full terms of this license are available at https://www.dovepress.com/terms.php and incorporate the Creative Commons Attribution - Non Commercial (unported, v3.0) License.
By accessing the work you hereby accept the Terms. Non-commercial uses of the work are permitted without any further permission from Dove Medical Press Limited, provided the work is properly attributed. For permission for commercial use of this work, please see paragraphs 4.2 and 5 of our Terms.
© 2015 The Author(s). This work is published and licensed by Dove Medical Press Limited. The full terms of this license are available at https://www.dovepress.com/terms.php and incorporate the Creative Commons Attribution - Non Commercial (unported, v3.0) License.
By accessing the work you hereby accept the Terms. Non-commercial uses of the work are permitted without any further permission from Dove Medical Press Limited, provided the work is properly attributed. For permission for commercial use of this work, please see paragraphs 4.2 and 5 of our Terms.