")
Back to Journals » International Journal of Nanomedicine » Volume 10 » Issue 1
Enhanced combination therapy effect on paclitaxel-resistant carcinoma by chloroquine co-delivery via liposomes
Received 30 June 2015
Accepted for publication 7 September 2015
Published 22 October 2015 Volume 2015:10(1) Pages 6615—6632
DOI https://doi.org/10.2147/IJN.S91463
Checked for plagiarism Yes
Review by Single anonymous peer review
Peer reviewer comments 4
Editor who approved publication: Professor Lei Yang
Menghua Gao,1 Yuzhen Xu,1 Liyan Qiu2,3
1College of Pharmaceutical Sciences, 2Ministry of Education (MOE) Key Laboratory of Synthesis and Functionalization, Department of Polymer Science and Engineering, Zhejiang University, Hangzhou, 3Collaborative Innovation Center for Biotherapy, West China Hospital, Sichuan University, Chengdu, People’s Republic of China
Abstract: A novel composite liposomal system co-encapsulating paclitaxel (PTX) with chloroquine phosphate (CQ) was designed for treating PTX-resistant carcinoma. It was confirmed that liposomal CQ can sensitize PTX by means of autophagy inhibition and competitively binding with multidrug-resistance transporters. Furthermore, according to the in vitro cytotoxicity and apoptosis assay, real-time observation of cellular uptake, and in vivo tissue distribution study, co-encapsulation of PTX and CQ in liposomes was validated as superior to the mixture of PTX liposome plus CQ liposome due to the simultaneous delivery and synergetic effect of the two drugs. Consequently, this composite liposome achieved significantly stronger anticancer efficacy in vivo than the PTX liposome plus CQ liposome mixture. This study helps to guide and enlighten ongoing and future clinical trials about the optimal administration modes for drug combination therapy.
Keywords: paclitaxel, chloroquine, liposome, drug resistance, combination therapy
Introduction
Paclitaxel (PTX) is an effective mitotic inhibitor for treating ovarian, breast, and non-small-cell lung cancers and advanced forms of Kaposi’s sarcoma.1–4 In the last few decades, many strategies based on nanotechnology have been explored to improve its solubility in aqueous solutions and selectively deliver it to tumor via the enhanced permeability and retention effect to reduce its side effects.5 However, the potentially wide application of PTX is still seriously limited due to the development of multidrug resistance (MDR). Cellular resistance to PTX is a very complicated phenomenon, following different molecular mechanisms.6 The MDR phenotype of malignant tumor cells was the first and most extensively studied mechanism of cellular resistance to PTX, which was associated with overexpression of the ATP-binding cassette superfamily of drug transporters such as P-glycoprotein (P-gp) and MDR-associated proteins (MRPs). These transporters act as efflux pumps to keep intracellular drug concentration quite low and remarkably weaken the cytotoxicity of PTX in tumors. On the other hand, upregulation of autophagy response was found to play an important role in resistance to chemotherapy and radiation treatment.7 The main function of autophagy is to maintain intracellular metabolic homeostasis through digestion of sequestered proteins and organelles via the lysosomal degradation pathway.8 However, autophagy may promote cell adaptation to stressful conditions, such as chemo- or radiation therapy, and facilitates cancer cell survival and development of drug resistance.9 A number of studies have shown that autophagy inhibitors or knockdown of autophagy-associated molecules can resensitize cancer cells to chemotherapeutic drugs, including PTX.10–12
Chloroquine phosphate (CQ) is a traditional agent for the treatment or prevention of malaria.13 Notably, some potential new functions of CQ for cancer therapy have been discovered recently, such as autophagy inhibition and drug resistance reversal by interacting with efflux transporters.14,15 These findings imply that chloroquine could act as an effective sensitizer with multiple targets in drug-resistant cancers to enhance the treatment efficacy of PTX. With this rational assumption, we constructed a novel liposomal delivery system (PCL) co-encapsulating PTX with CQ to treat PTX-resistant carcinoma.
Actually, a number of references have reported various co-delivery formulations of multiple drugs or genes via one nanoparticle,16,17 despite there being no product on the market. Unlike these studies, combination therapy in clinics is usually executed by means of taking two or more individual drug preparations simultaneously, which is apparently more practicable. However, the difference between the above two administration modes has been paid little attention. Therefore, it becomes quite important to confirm the necessity of preparing a multiple-drug co-delivery system. Thus, besides the investigation about the effect of liposomal CQ on reversal of PTX resistance, we performed systematic experiments to explore the potential superiority of PCL over a simple mixture of PTX and CQ preparations. Indeed, based on the experiments on in vitro cell culture and a xenograft mouse model, we found in this study that PCL was more effective in suppressing the growth of PTX-resistant cancer than the simple co-injection of PTX-loaded liposome (PTXL) and CQ-loaded liposome (CQL) in the mixture. Thus, to achieve the greatest synergistic effect of multiple drugs as possible, it is worth considering thoroughly how to choose administration modes for combination drug therapy.
Materials and methods
The authors advise that the ethics committee/institutional review board of Zhejiang University did not require that they seek approval for the use of human tissue, as the cell lines used are all commercially available.
Materials, cell lines, and animals
CQ (purity 99.6%) was purchased from Kaiyang Biotechnology Pharmaceutical (Shanghai, People’s Republic of China). PTX and Taxol® were obtained from Zhejiang HISUN Pharmaceutical Co., Ltd (Hangzhou, People’s Republic of China). Cholesterol was purchased from Tokyo Chemical Industry Co., Ltd. (TCI) (Tokyo, Japan). Soybean phosphatidylcholine was purchased from Lipoid GmbH (Ludwigshafen, Germany). All other chemicals were of commercially available grade.
PTX-resistant derivatives of human lung adenocarcinoma (A549/T) cells, PTX-resistant derivatives of human ovarian carcinoma (A2780/T) cells, and mouse sarcoma (S180) cells were bought from KeyGEN BioTech (Nanjing, People’s Republic of China). They were cultured in Roswell Park Memorial Institute (RPMI)-1640 medium (Ji Nuo Biotechnology, Hangzhou, People’s Republic of China) containing 10% fetal bovine serum, 100 U/mL penicillin, and 100 μg/mL streptomycin and maintained at 37°C in a humidified and 5% CO2 incubator.
Four- to five-week-old female Balb/c nude mice (Shanghai SLAC Laboratory Animal Co. Ltd, Shanghai, People’s Republic of China) were maintained in a pathogen-free laboratory environment, and animal experiments were approved by the Animal Ethics Committee of Zhejiang University and performed in accordance with the Regulations on Experimental Animals of Zhejiang University (Hangzhou, People’s Republic of China).
Liposome preparations and in vitro drug release
The composite liposome system (PCL) was prepared by thin-film hydration method combined with transmembrane pH-gradient method. Briefly, PTX (4 mg), soybean phosphatidylcholine (500 mg), and cholesterol (100 mg) were dissolved in 5 mL of ethanol and dried under vacuum at 50°C with a rotary evaporator to remove organic solvents. After a thin film layer was formed, it was hydrated with 0.3 M citric acid buffer (pH 3.5). Then, the liposome dispersion was sonicated with a probe sonicator (JY92-2D; Scientz, Ningbo, People’s Republic of China) to obtain small and homogeneous vesicles. The resulting solution was filtered through a 0.22 μm pore-size polycarbonate filter (Millipore, Billerica, MA, USA). Subsequently, CQ was added into the obtained solution with 0.2 M Na2HPO4 solution, adjusting the external pH of liposome to 7.4. Finally, the preparation was incubated at 40°C for 10 minutes and the free drug was separated from the liposomes with Sephadex G-50 mini-columns, then PCL was obtained. By adjusting the weight ratio of PTX to CQ, we got PTXL, CQL, and various composite liposomes, including PCL1:0.5, PCL1:1, PCL1:2, PCL1:3, and PCL1:5, where the ratio is the weight ratio of PTX to CQ.
The mean diameters and zeta potentials of these preparations were determined using dynamic light scattering (NanoS90; Malvern Instruments, Worcestershire, UK). The morphology was examined by transmission electron microscopy (JEM-1230; JEOL, Tokyo, Japan) without negative staining. Briefly, 15–30 μL droplets of liposome suspension were placed on a formvar-coated copper grid (230-mesh, hexagonal fields). Then the grids were dried at room temperature, and the morphology of the liposome was observed under transmission electron microscopy.
The content of PTX and CQ in various liposomal formulations was analyzed by high-performance liquid chromatography (SPD-20A; Shimadzu, Kyoto, Japan) at 227 nm and by UV spectrophotometry (TU-1800PC; Beijing PERSEE Co., Ltd., Beijing, People’s Republic of China) at 330 nm, respectively. The drug loading content (LC) was defined as the weight ratio of loaded drug to the drug-loaded liposomes. The drug encapsulation efficiency (EE) was calculated from the weight ratio between the drug incorporated in liposomes and that fed in the fabrication.
The PTX and CQ release of liposomes in vitro was studied using a dialysis bag (molecular weight cutoff: 8,000–14,000 kDa). The drug-loaded liposome (0.5 mL) was put into the dialysis bag, which was immersed in 20 mL 0.2 M phosphate-buffer saline (pH 7.4 or 5.5, 37°C, 100 rpm) containing 0.1% (v/v) Tween 80 to maintain a sink condition (solubility 6.32 μg/mL).18 At the designated time intervals, 2 mL release medium was removed and, subsequently, 2 mL fresh medium was added. Then the content of PTX and CQ was quantified by high-performance liquid chromatography and UV spectrophotometry, respectively, as described above. All release tests were run in triplicate.
Cell viability and apoptosis assay
In vitro cytotoxicity was determined by methyl thiazolyl tetrazolium (Sigma-Aldrich Co., St Louis, MO, USA) assay. Cells were seeded in 96-well plates and incubated for 24 hours to allow adherence followed by drug exposure for 48 hours. Apoptosis was determined by annexin V-fluorescein isothiocyanate/propidium iodide assay with flow cytometry. Cells were cultured in six-well plates and treated with different preparations for 48 hours. The detailed procedures are provided in the Supplementary materials.
Real-time observation of cell uptake of liposomes
The potential different cell uptake characteristics between PTXL+CQL(1:2) (PTXL plus CQL at a weight ratio of 1:2) and PCL1:2 were explored. Water-insoluble curcumin (CUR) and water-soluble doxorubicin hydrochloride (DOX) were used to mimic PTX and CQ since they both have autofluorescence but a different maximum emission wavelength. CUR liposome (CURL), DOX liposome (DOXL), and CUR–DOX co-encapsulated liposome (CDL) with a weight ratio of 1:2 (CDL1:2) were prepared according to the methods to prepare CQL, PTXL and PCL. A 5-minute real-time observation of cell uptake was performed with CURL+DOXL(1:2) (CURL plus DOXL at a weight ratio of 1:2) or CDL1:2. Briefly, A549/T cells were seeded on a glass-bottom plate and allowed to adhere. Cells were observed in real time with a spinning disk confocal microscope (Andor Technology, Belfast, Northern Ireland), acquiring a picture every 0.6 seconds. CURL+DOXL(1:2) and CDL1:2 were separately added at 12 seconds and pictures were continually acquired within 5 minutes.
P-gp and MRP functional activity analysis
To assess the effect of CQ on the functional activity of P-gp and MRP, flow cytometer analysis was used to detect the intracellular uptake of P-gp substrate rhodamine 123 (Rh123) and MRP substrate 5-carboxyfluorescein (5-CFDA). 5-CFDA was reported to be an MRP1-specific compound but not a substrate of P-gp.19 5-CFDA can permeate the plasma membrane and be transformed into the fluorescent anion 5-carboxyfluorescein under the function of enzymes in the cytoplasm.20 The experimental method is described in the Supplementary materials.
Western blot analysis
To detect the function of CQ on MDR-related protein (P-gp and MRP1) and autophagy marker light chain 3 (LC3), Western blot was used to analyze the expression of these proteins (Supplementary materials).
Multicellular tumor spheroids assay
A three-dimensional (3D) multicellular tumor spheroids (MTS) assay was developed to simulate the damage to tumor spheroids caused by PTX preparations. Firstly, A549/T cells were grown in 24-well plates (37°C, 5% CO2), which were coated with 4% (w/v) agarose to prevent cell adhesion, at a density of 1×10⁴ cells per well. After approximately 1 week, the A549/T spheroids were formed. Then, the spheroids were treated with various preparations of PTX with concentrations of 3 μg/mL for 24 hours. After the determined time intervals, the spheroids were washed with phosphate-buffered saline three times, fixed with 2.5% glutaraldehyde at 4°C, and incubated in osmic acid for 1 hour. Subsequently, a gradient concentration of acetone was used to dehydrate the spheroids. Finally, the spheroids were dried with critical-point CO2. The superficial morphology of these spheroids was observed with a scanning electron microscope (S3000N; Hitachi Ltd., Tokyo, Japan).
In vivo antitumor efficacy
A549/T cells (1×10⁷ ) in a volume of 0.2 mL were implanted subcutaneously in the right flank of Balb/c nude mice. When the tumors reached a volume of approximately 100–200 mm3, mice were randomly divided into seven groups (five for each group). Saline, Taxol (PTX 20 mg/kg), free CQ (40 mg/kg), PTXL (20 mg/kg), CQL (40 mg/kg), mixture of PTXL (20 mg/kg) plus CQL (40 mg/kg), and PCL1:2 (PTX 20 mg/kg, CQ 40 mg/kg) were injected through the tail vain. The injections were administrated to mice every 2 days to a total of four injections and tumor volume was measured every 2 days until it reached 2,000 mm3. The animals were sacrificed on the 16th day and tumors were detached and weighed. Tumor volume (V) was determined with the following formula:
V = (Length × Width2)/2 | (1) |
In vivo biodistribution and pharmacokinetic studies
One week after S180 cell implantation, mice were intravenously injected with PTXL+CQL(1:2) (PTX 20 mg/kg, CQ 40 mg/kg) or PCL1:2 (PTX 20 mg/kg, CQ 40 mg/kg). Mice were sacrificed at the predetermined time points of 5 minutes, 30 minutes, 1 hour, 2 hours and 6 hours post-injection. Samples of plasma, heart, liver, spleen, lungs, kidneys, and tumor were harvested and stored at −20°C until analysis. The measurement of drug concentration in plasma and tissue is described in the Supplementary materials.
Results
Liposome preparations and in vitro drug release
PTX is lipophilic, and its loading into liposomes can be readily accomplished by the conventional thin-film hydration method. However, CQ is a water-soluble weak base. A pH-gradient method is required to fabricate CQLs with high EE and controlled LC, as we previously reported.21 Thus, we used a two-step method to sequentially encapsulate PTX and CQ into liposomes.
Table 1 presents the drug LCs and EEs of various liposomes, including PTXL, CQL, and PCLs with different PTX/CQ ratios. Since PTX and CQ were separately distributed in the hydrophobic area and hydrophilic core of liposomes, the EE of PTX and CQ both reached approximately 80%–100% irrespective of the PTX/CQ ratio. The size and polydispersity index of the various liposomes did not change significantly when the amount of CQ increased from 0.29% to 3.17%. The zeta potential of all liposomes was almost neutral since natural soybean phosphatidylcholine was used. As shown in Figure 1A, PTXL, CQL, and PCL1:2 had nearly spherical shapes and their sizes were consistent with those measured by dynamic light scattering. In addition, PTXL had an empty core since PTX was located in the lipid bilayer, while CQL and PCL1:2 were solid spheres owing to the encapsulation of hydrophilic CQ in the core of the liposomes. These results indicate that the preparation method was able to construct the dual-drug-loaded liposomes with the controlled loading ratios.
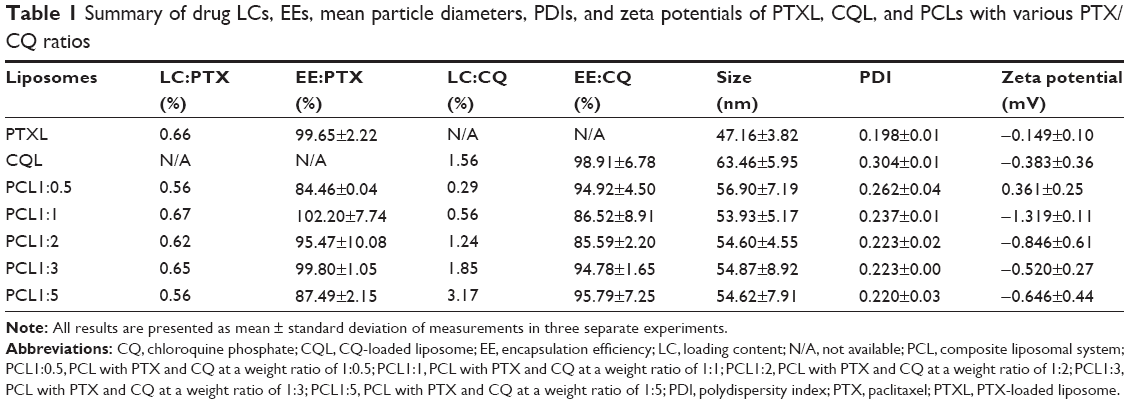 | Table 1 Summary of drug LCs, EEs, mean particle diameters, PDIs, and zeta potentials of PTXL, CQL, and PCLs with various PTX/CQ ratios |
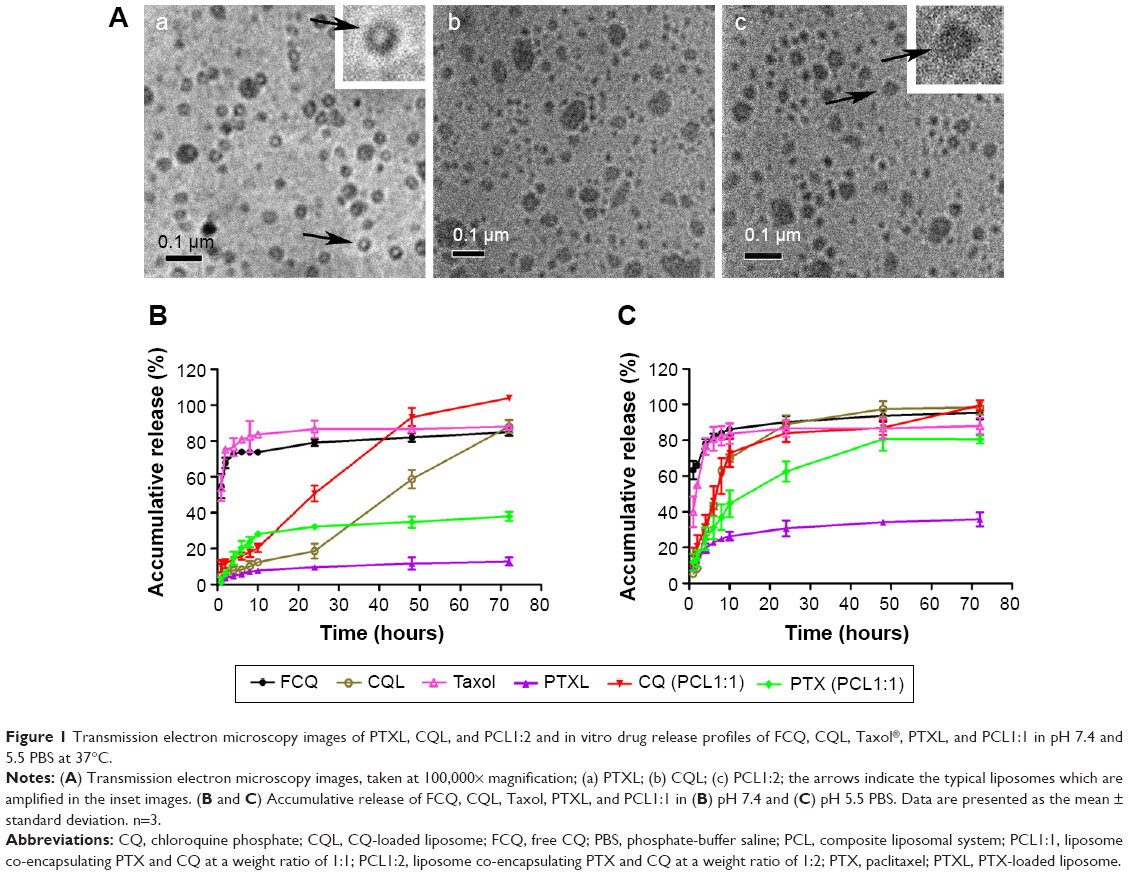 | Figure 1 Transmission electron microscopy images of PTXL, CQL, and PCL1:2 and in vitro drug release profiles of FCQ, CQL, Taxol®, PTXL, and PCL1:1 in pH 7.4 and 5.5 PBS at 37°C. |
The drug release properties of PCLs were examined under pH 7.4 or 5.5 conditions, simulating the pH of physiological fluids and endosomal compartments, respectively.22 PTXL and CQL both showed a slower release rate compared with Taxol and free CQ (Figure 1B), indicating the sustained drug release effect of liposomes. All PCLs displayed similar release behaviors for CQ and PTX. The release rates of PTX and CQ both increased in PCL groups when compared with those of the PTXL and CQL groups due to the loss of the compactness of the phospholipid delayer once one drug diffused outside. When the pH of release media declined from 7.4 to 5.5, a faster drug release occurred (Figure 1C), suggesting that the liposomes could be comparatively stable in the blood circulation and release drug fast in cancer cells. Moreover, CQ was released much faster than PTX in PCL groups, which favored the action of CQ as a sensitizer.
In vitro cytotoxicity and apoptosis
The 50% inhibitory concentrations (IC50s) of PTX and CQ in various preparations in A549/T and A2780/T cells are summarized in Table 2. The IC50 values of Taxol in A549/T and A2780/T cells were 4.46 and 3.72 μM, respectively. As previously reported, however, the cell viability of A549/T cells was over 75% after treatment with 20 μg/mL (23.42 μM) free PTX,23 and the IC50 value of free PTX in A2780/T cells was approximately 80 μg/mL (93.69 μM) at 48 hours.24 These data indicate that Cremophor EL, an integral component of Taxol as a surfactant with high concentration, aggravated the toxicity of free PTX. Considering the possible serious acute hypersensitivity reactions and neurological toxicity of Cremophor EL, the liposome vehicle would be an ideal alternative.25 The cell viability of resistant cells treated with blank liposomes in our study was all over 90%. When A549/T and A2780/T cells were treated with PCL1:0.5, the corresponding IC50 values significantly decreased by 4.86- and 2.86-fold, respectively, compared with those for PTXL. The effect was further enhanced as the amount of CQ increased in PCL. According to the combination index (CI) values measured by the Chou–Talalay method,26 PTX and CQ showed synergistic action in both cells when co-loaded into one liposome, and a stronger effect was achieved in A549/T cells compared with A2780/T cells. However, a significant difference in cytotoxicity between PTXL+CQL(1:2) and PCL1:2 was observed. The IC50 values were much lower for PCL1:2 in both cells than those for the mixture of PTXL and CQL, indicating stronger cytotoxicity was exerted when PTX and CQ were administrated in the co-delivery form. Moreover, PCL1:2 showed synergism and a slight synergistic effect in A549/T cells and A2780/T cells, respectively, while PTXL+CQL(1:2) gave an antagonistic effect based on the CI values (CI >1).
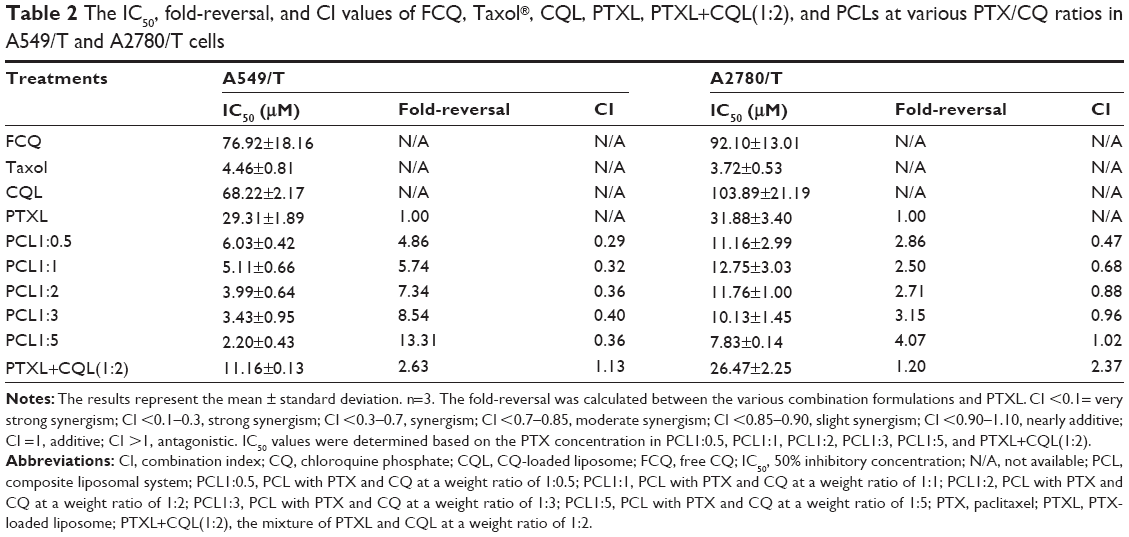 | Table 2 The IC50, fold-reversal, and CI values of FCQ, Taxol®, CQL, PTXL, PTXL+CQL(1:2), and PCLs at various PTX/CQ ratios in A549/T and A2780/T cells |
We also measured the apoptosis in cells treated with different formulations. As shown in Figures 2, S1, and S2, less than 10% of cells treated with CQ and CQL were apoptotic, indicating that CQ was almost nontoxic to A540/T and A2780/T cells. However, the treatment with PTX and CQ combined in liposomes, particularly PCL1:2 and PCL1:5, significantly increased the proportion of apoptotic cells. Nevertheless, PCL1:0.5 did not show an obvious advantage over PTXL, suggesting that an appropriate concentration of CQ was necessary to induce apoptosis. It is notable that PTXL+CQL(1:2) caused a 14.57% apoptosis rate in A549/T cells and a rate of 13.71% in A2780/T cells, while PCL1:2 resulted in a rate of 21.97% and 28.97%, respectively (Figures 2 and S3). These results were consistent with the cytotoxicity assay, and further proved the superiority of co-delivery over the simple mixture of liposomes.
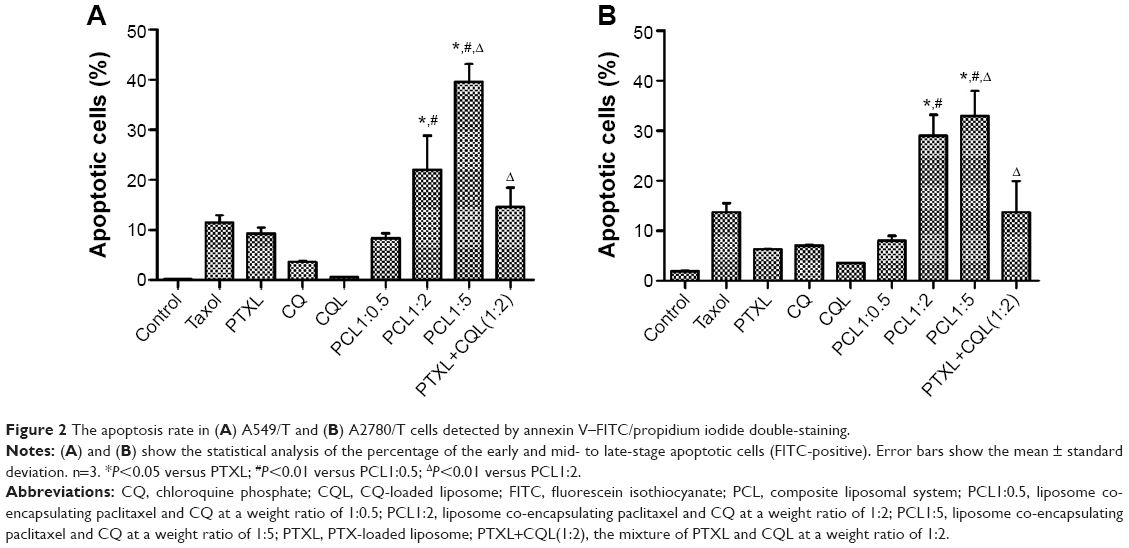 | Figure 2 The apoptosis rate in (A) A549/T and (B) A2780/T cells detected by annexin V–FITC/propidium iodide double-staining. |
Different characteristic of cell uptake between CURL+DOXL and CDL
The potential different cellular uptake patterns of the mixture of CURL+DOXL(1:2) and CDL1:2 were also investigated using fluorescent CUR and DOX as the corresponding mimics of PTX and CQ, respectively. Confocal microscopy was applied to observe the cellular uptake process in real time. As shown in Figure 3A and B, the pictures presented only the background fluorescence at time 00:00. CURL+DOXL(1:2) and CDL1:2 were added separately at time 00:12 and the background got extremely strong immediately (at time 00:14). With the incubation time increased, the background gradually became dark while the cells became bright, tracing the cell uptake process of fluorescent substances. CUR and DOX emit green and red fluorescence, respectively, which merge to orange. For the CDL1:2 group (Figure 3B), the orange can be observed at the early stage of incubation (00:33), which indicates that CUR and DOX were simultaneously taken by cells when they were co-encapsulated in the liposomes. This conclusion was further proved by the quantified data, shown in Figure 3C, that show the amount of CUR and DOX changed quite synchronously versus the incubation time. However, for the CURL+DOXL(1:2) group, the orange fluorescence was hardly observed in the cells until time 01:02 (Figure 3A). Meanwhile, it seems that CUR went into A549/T cells faster than DOX. The quantified data also clearly display the different cell uptake behaviors between CUR and DOX in the CURL+DOXL(1:2) group (Figure 3D). Therefore, it is reasonable to conclude that PCL can simultaneously deliver PTX and CQ into target cells at the optional ratios while PTXL+CQL cannot, which may explain the advantage of PCL over PTXL+CQL in cell cytotoxicity and apoptosis.
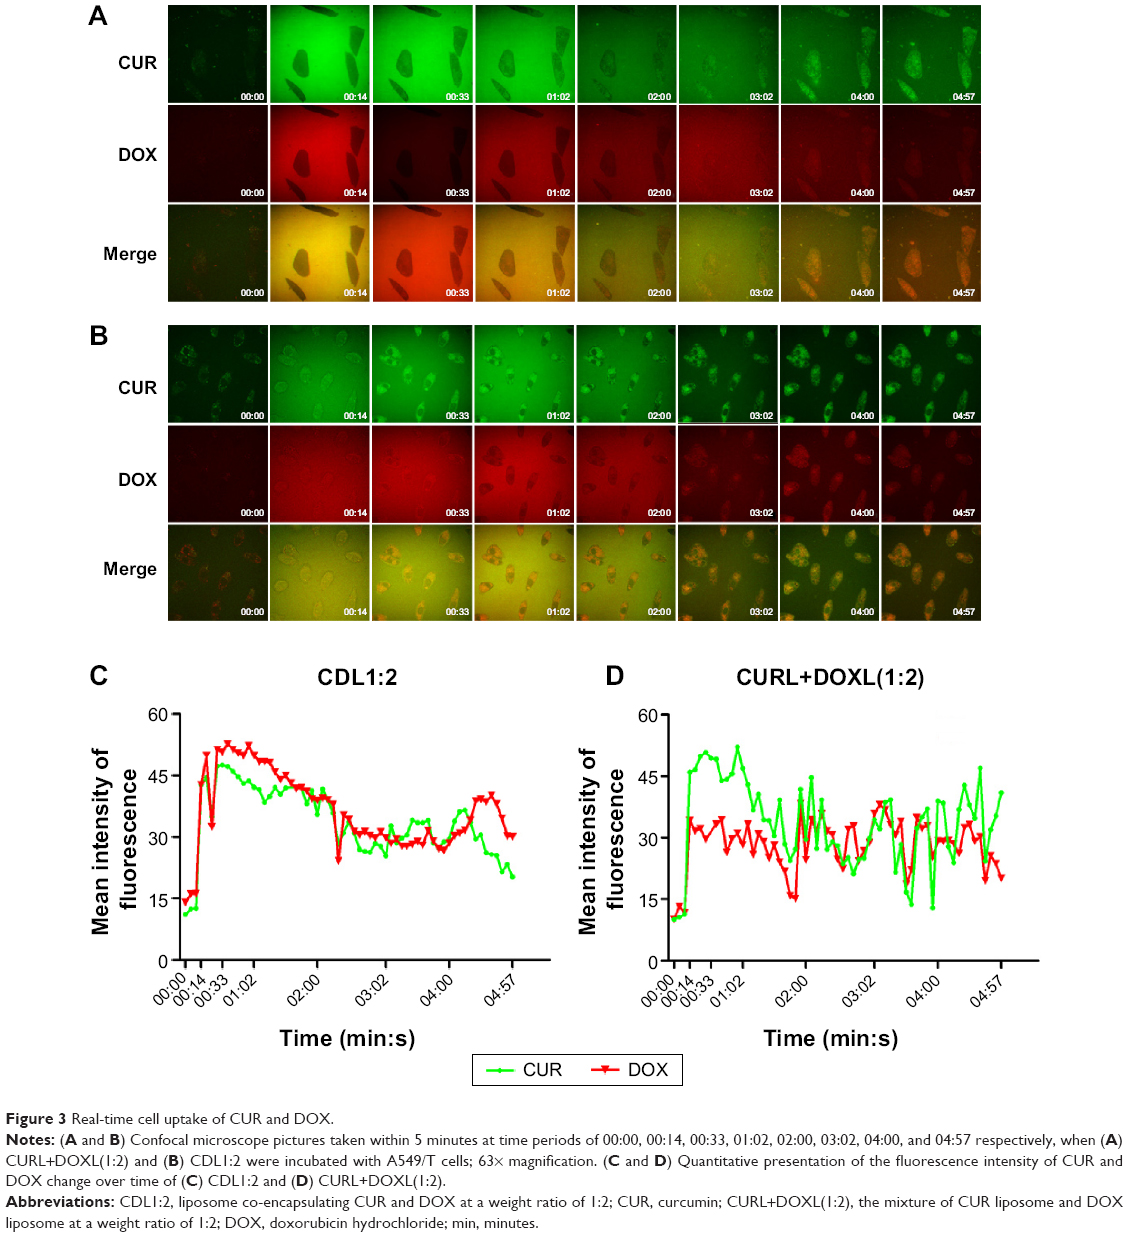 | Figure 3 Real-time cell uptake of CUR and DOX. |
Detection of P-gp and MRP1 functional activity
Rh123 accumulation in both cell lines increased with increasing CQ concentrations (Figure 4A and B), which demonstrates the inhibitory effect of CQ on P-gp transporting activity. CQL treatment enhanced Rh123 accumulation in A2780/T cells until CQ concentration exceeded 100 μM. However, no significant effect was observed in A549/T cells treated with CQL for 4 hours. To account for slow drug release from liposomes, a 12-hour Rh123 accumulation assay was performed with CQL. The results showed that CQL gradually increased Rh123 accumulation in both cell lines in a dose-dependent manner (Figure 4C). In addition, the increase degree was significantly higher in A549/T cells than in A2780/T cells.
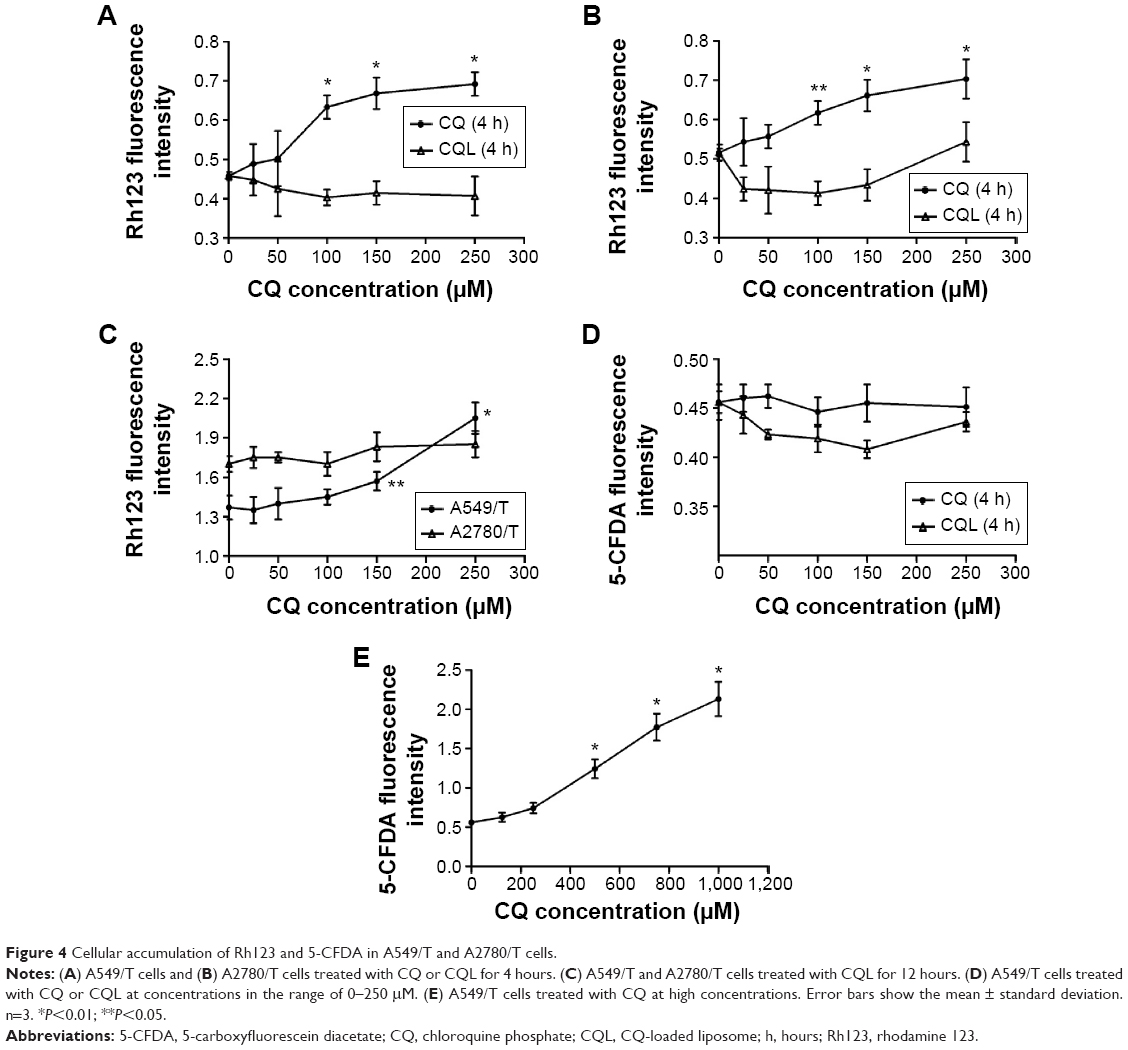 | Figure 4 Cellular accumulation of Rh123 and 5-CFDA in A549/T and A2780/T cells. |
A549/T cells overexpress MRP1,27 while A2780/T cells have basal MRP1 expression.28 Therefore, the effect of CQ on MRP1 activity was measured in A549/T cells with the specific substrate 5-CFDA. As shown in Figure 4D, free CQ and CQL did not significantly change the cellular uptake of 5-CFDA even at CQ concentrations up to 250 μM. However, 5-CFDA accumulation was markedly increased at higher CQ concentrations ranging from 300 to 1,000 μM (Figure 4E). These results demonstrate that CQ could inhibit MRP1 functional activity at a relatively high concentration. Since CQ was proven to be a substrate of MRP1,29 our results indicate that CQ presented lower affinity with MRP1 compared with 5-CFDA. Because of the limited LC of CQ, CQL displayed little effect on 5-CFDA uptake.
Expression of P-gp, MRP1, and LC3
The expression levels of MDR-related proteins (P-gp and MRP1) and the autophagy-associated protein LC3 in A549/T cells and A2780/T cells were analyzed by Western blot. P-gp and MRP1 expression in both cell lines was hardly affected by treatment with free CQ or PCL preparations (Figure 5). However, the expression level of the autophagy marker LC3-II significantly changed after treatment with different concentrations of free CQ. Further, as the concentration of CQ increased, LC3-II expression also markedly increased in a concentration-dependent manner. In the autophagy process, LC3-I is catalyzed by a phospholipid and turns to LC3-II, which is an important part of the autophagic vesicle called autophagosome.30 Considering the property of CQ in inhibiting autophagosome fusion with lysosome and autophagosome degradation,31 the enhanced expression of LC3-II indicated that the autophagy response was significantly inhibited in the autophagosome degradation step. Therefore, different PCL preparations were also examined for their effect on LC3 expression. Taxol and PTXL did not have an effect on autophagy, while the co-delivery system showed a significant and concentration-dependent effect on LC3-II expression. PCL1:5, which contained the highest percentage of CQ, demonstrated the most significant change of expression level of LC3-II among all PCLs. CQ encapsulated in liposomes increased LC3-II expression to a lesser extent than free CQ because of the slow release of CQ from liposomes.
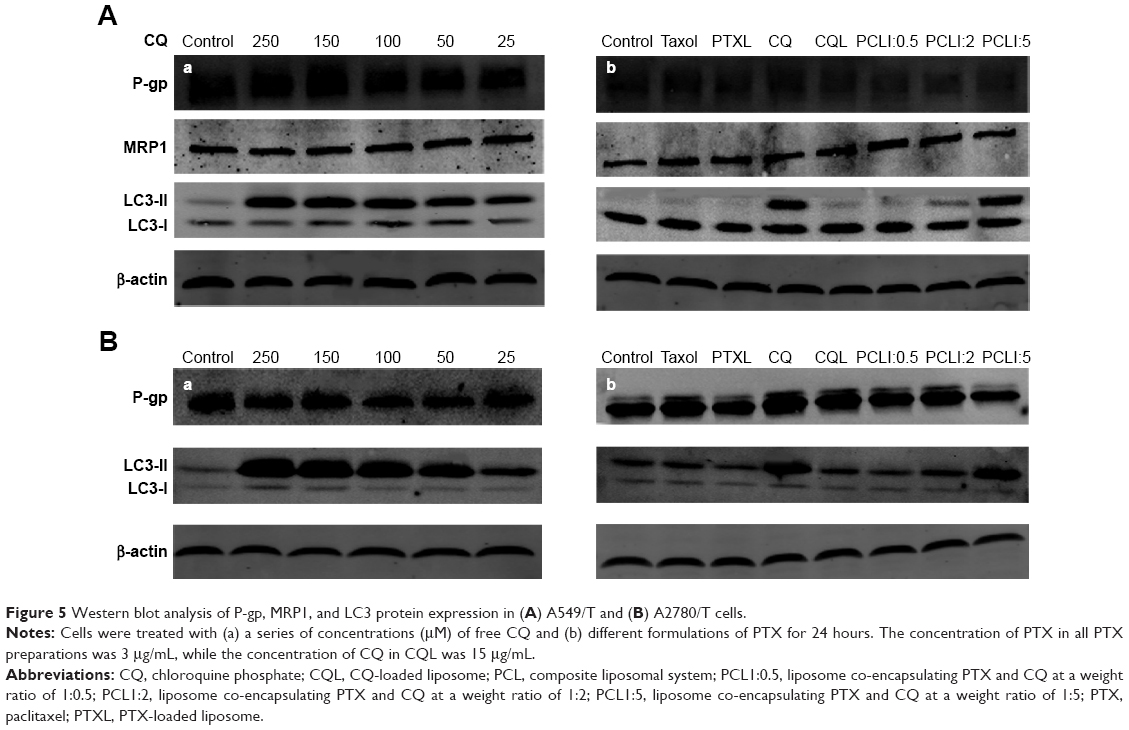 | Figure 5 Western blot analysis of P-gp, MRP1, and LC3 protein expression in (A) A549/T and (B) A2780/T cells. |
PCL induces cell damage in MTS
The 3D MTS assay provides a bridge to the gap between complex in vivo tumors and simple in vitro monolayer cell cultures. It is also a convenient and low-cost way for preliminary exploration and screening of anticancer drugs in the simulated in vivo condition. Thus, an in vitro 3D MTS model of A549/T cells was established to assess the effect of PTX and CQ combination therapy using liposomes. The superficial morphology and microstructure of MTS were analyzed by scanning electron microscopy. The cells in the control group (Figure 6Aa) were spherical and smooth with numerous filopodia, and MTS (Figure 6Ab–d) appeared intact. However, MTS treated with PCL1:2 and PCL1:5 (Figure 6Ae and f) contained cell fragments and apoptotic bodies and the normal cells were almost absent. These morphological characteristics indicate that PTX and CQ combination therapy had a stronger capability to kill cancer cells and that the efficacy was proportional to the CQ dose.
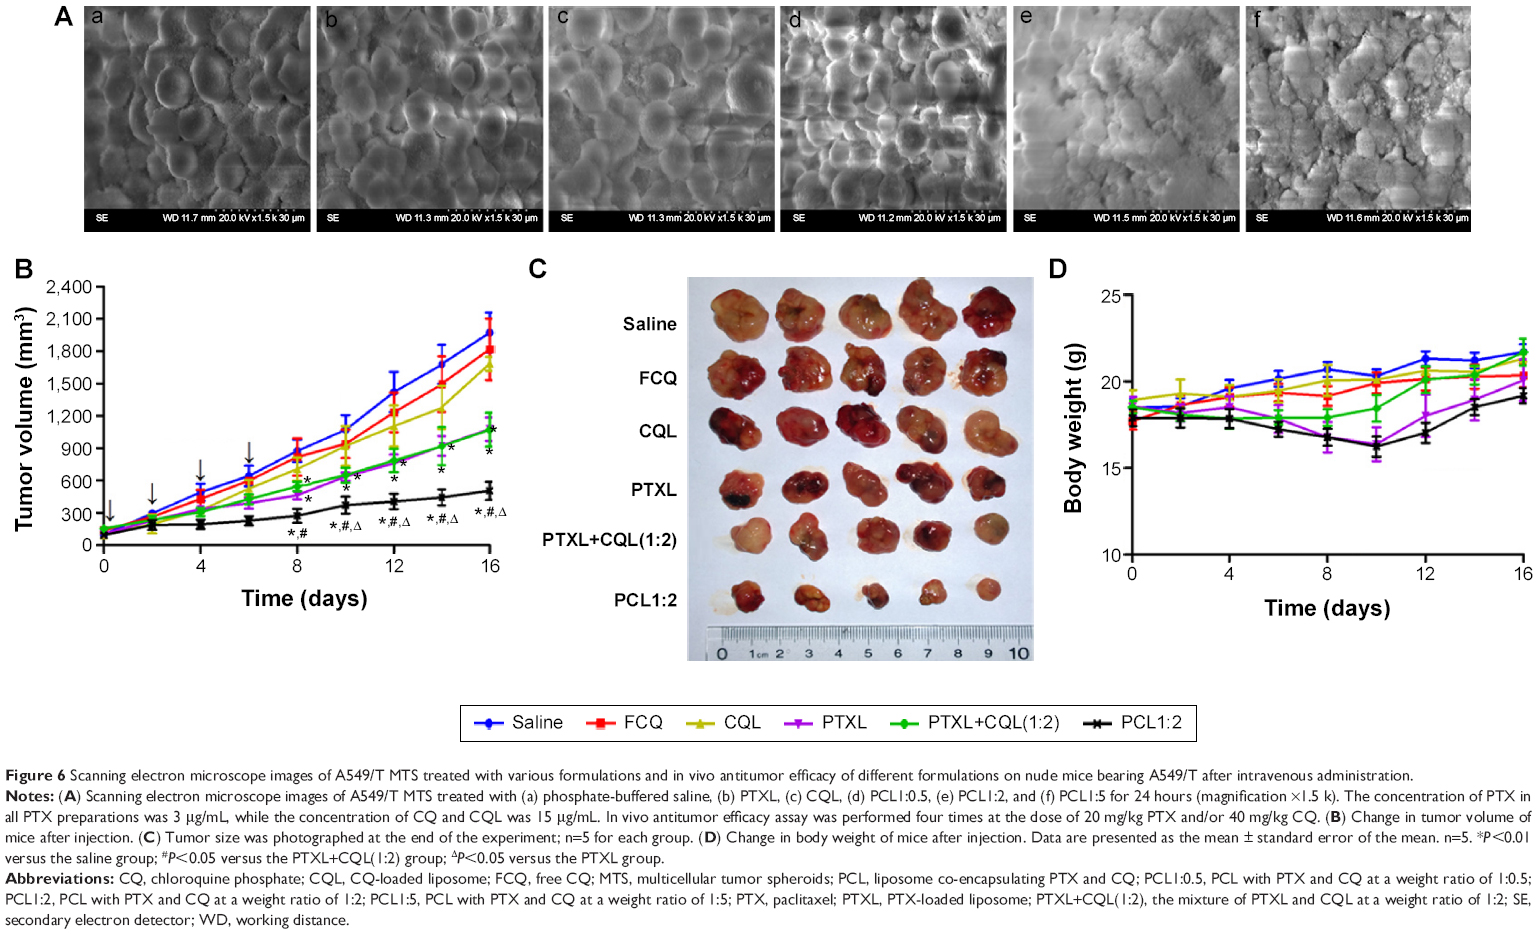 | Figure 6 Scanning electron microscope images of A549/T MTS treated with various formulations and in vivo antitumor efficacy of different formulations on nude mice bearing A549/T after intravenous administration. |
In vivo antitumor activity
The in vivo antitumor efficacy of Taxol, free CQ, CQL, PTXL, PTXL+CQL(1:2), and PCL1:2 was evaluated in an A549/T xenograft model in nude mice. The dose of PTX was 20 mg/kg for the Taxol, PTXL, PTXL+CQL(1:2), and PCL1:2 groups. However, the mice in the Taxol group died successively after injection every other day to a total of four injections, since the maximum tolerated dose in nude mice was determined to be 20 mg/kg.32 As shown in Figure 6B, both free CQ and CQL slightly inhibited tumor progression with little difference in tumor volume compared to that in the saline group, confirming that CQ alone did not work at this dose. The tumor growth in all groups treated with PTX or PTXL was significantly inhibited, indicating considerable therapeutic efficacy. Treatment with PTXL+CQL(1:2) inhibited tumor growth to a similar extent as PTXL did, while PCL1:2 had the highest antitumor activity. At the end of the experiment, all tumors were removed and weighed (Figure 6C). The PCL1:2 group had the smallest tumor size, which was 5.4-fold smaller than that in the saline group and nearly twofold smaller than that in the PTXL or PTXL+CQL(1:2) groups. These results demonstrate that CQ could promote the antitumor effect of PTX and that the enhancement was much more pronounced when CQ was co-encapsulated with PTX in the same vehicle. Weight loss was observed in the PTXL, PTXL+CQL(1:2), and PCL1:2 groups; however, the body weight of mice in all groups gradually recovered to normal after the four injections (Figure 6D), suggesting that these formulations did not cause severe side effects.
In vivo biodistribution and pharmacokinetic studies
We performed a pharmacokinetic and tissue distribution study of PCL and PTXL+CQL(1:2) in S180 tumor-bearing mice to further investigate the significance of dual-drug co-delivery via liposomes. The plasma concentration–time curves (Figure 7A) for PTXL+CQL and PCL injection were all fitted to the two-compartment model, and the pharmacokinetic parameters were also calculated. PTX and CQ have separate and independent kinetic characteristics. It has been reported that the plasma concentration of PTX declined with a distribution half-life (T1/2α) of 5–7 minutes in mice,33 while that of CQ decreased relatively more slowly due to its extensive binding to plasma proteins after intravenous injection.34 Of note, however, the T1/2αs of PTX and CQ were almost equivalent for both PTXL+CQL(1:2) (PTX 35.98 minutes, CQ 38.11 minutes) and PCL1:2 (PTX 31.56 minutes, CQ 38.31 minutes), indicating the distribution rates of PTX and CQ were homogenized via liposomal carriers. As shown in Figure 7B and C, during the initial 6 hours post-injection, the PTX and CQ distribution at the various primary organs in the PTXL+CQL(1:2) group was similar to that in the PCL1:2 group due to the similar size and surface charge of PTXL, CQL, and PCL1:2. However, compared with PTXL+CQL(1:2), the concentration of CQ remained nearly twice that of PTX at the tumor site after PCL1:2 administration, which was closer to the co-administration ratio of CQ to PTX. This result revealed that PTX and CQ in the PCL1:2 group would go through a more synchronized pharmacokinetic process when co-encapsulated in the same liposome, providing a more favorable means for combination cancer treatment.
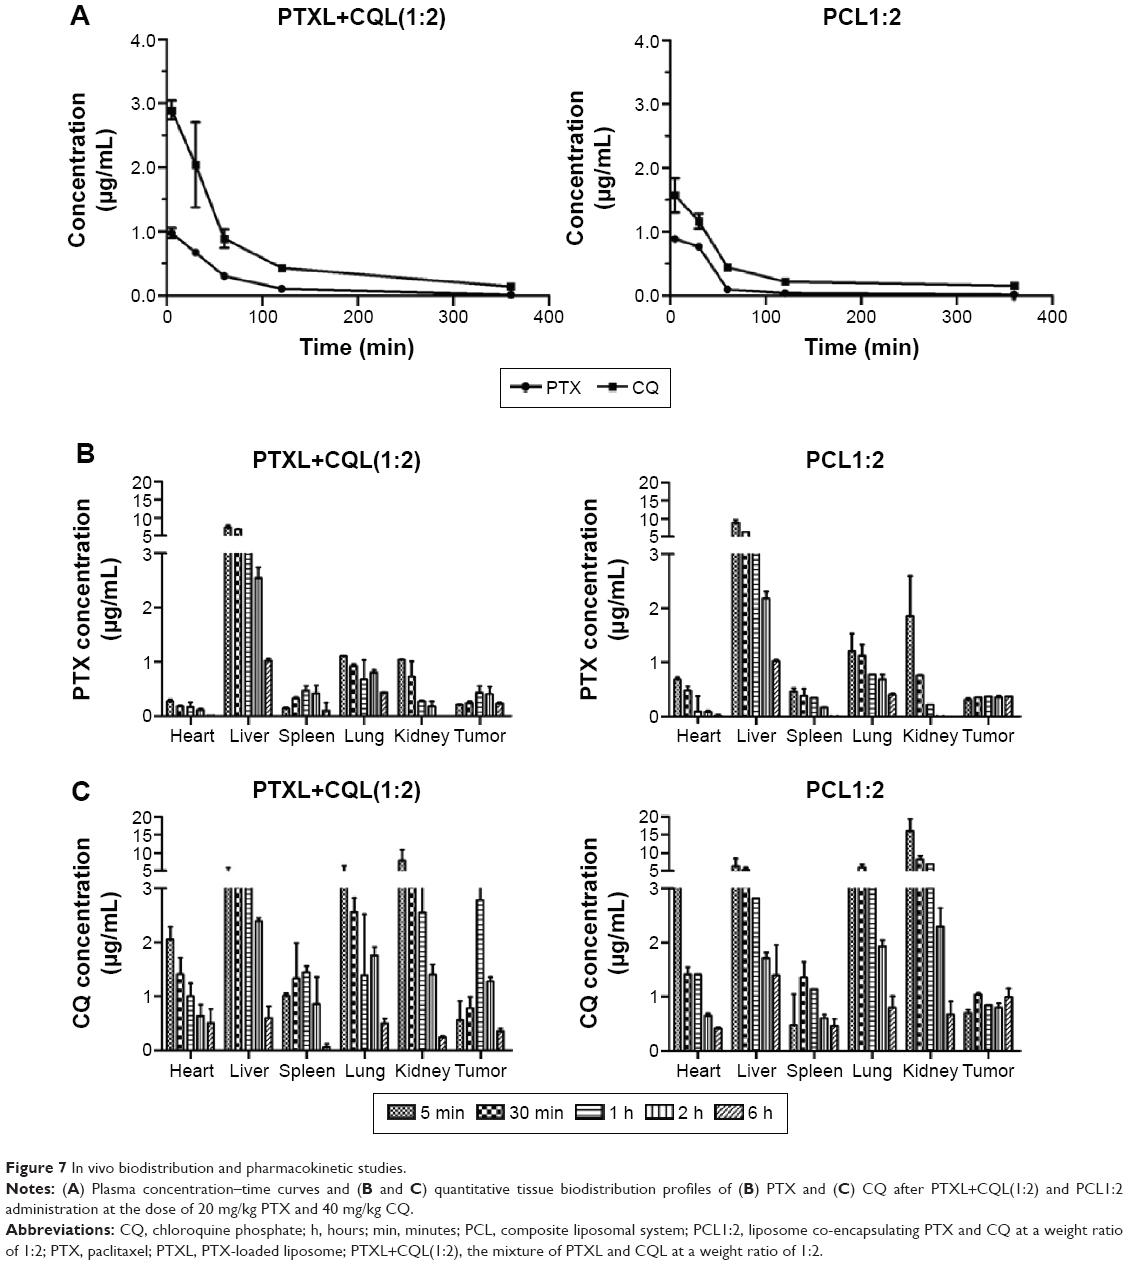 | Figure 7 In vivo biodistribution and pharmacokinetic studies. |
Discussion
In this study, we developed a novel liposome to co-deliver PTX and CQ at the optimal weight ratio with a stronger antitumor effect as compared with free PTX, PTXL, or the mixture of PTXL and CQL. More importantly, our results illustrate the sensitization mechanism of liposomal CQ for PTX in drug-resistant cancers and emphasize the significance of choosing the optimal administration modes when two synergistic drugs are used for combination therapy.
Using a classical substrate uptake test, we confirmed that CQ loaded in the liposome could effectively inhibit the efflux of P-gp substrate via competition binding with P-gp (Figure 4). This result indicated that liposomal CQ could maintain this function like free CQ, though this process cost more time due to its sustained released from liposomes. Furthermore, as Ajabnoor et al reported in 2012, autophagy activation majorly contributed to PTX resistance of cancers.12 The capability of inhibiting autophagosome degradation was closely related to the enhancement of cancer cell death.31 Maiuri et al also found that autophagy and apoptosis share common pathways and can be triggered by the same upstream signals.35 Thus, the action mechanism of CQ as an autophagy inhibitor was also explored by measuring the expression of autophagy marker protein. We found that free CQ significantly increased LC3-II expression in A549/T and A2780/T cells in a concentration-dependent manner, and this inhibition effect also occurred when CQ was co-encapsulated with PTX in liposomes (Figure 5). Therefore, liposomal CQ could still act as a sensitizer to enhance PTX-induced apoptosis36,37 and cytotoxicity in A549/T and A2780/T cells (Figure 2; Table 2). These results show that A549/T cells were more sensitive to the treatment with PCL preparations compared to A2780/T cells. Then, the antitumor experiment was performed with PTX-resistant human lung carcinoma. PCL1:2 displayed remarkable superiority to PTXL+CQL(1:2) in vivo (Figure 6), consistent with the results of in vitro cytotoxicity and apoptosis assay.
CQ and its analogs have been evaluated in clinical trials for cancer chemotherapy with various chemotherapeutics.36 Based on the published data, these combined modalities of CQ have great potential to suppress tumor growth. However, the traditional combination therapy usually focuses on the screening of drug combination ratios and pays less attention to the subsequent in vivo kinetic process. With completely different pharmacokinetic behaviors, two drugs will work extremely inefficiently since the actual ratio for cooperation may be quite different from the optimized one in tumor tissue and in tumor cells. Therefore, it is very important to inspect the pharmacokinetic process under the different conditions.
As we know, after injection into the vascular system, liposomes will persist in the circulation for a prolonged period and finally accumulate in tumor tissues because of the enhanced permeability and retention effect. Then, they will be internalized by tumor cells through endocytosis, followed by drug release and action at the target sites. Therefore, we made a comparison between PCL and PTXL+CQL on the distribution characters and endocytosis process.
First, the tissue distribution of drugs was compared, and it was shown that, at the tumor site, PTX/CQ in the PCL1:2 group remained at the synergistic ratio within 6 hours after administration, while irregular ratios were observed in the PTXL+CQL(1:2) group (Figure 7). It was demonstrated that the optimal ratio of two synergistic drugs would be kept at the target tissue by co-delivery in the same vesicle. Subsequently, the cellular uptake pattern for both groups was explored. Cellular uptake is a relatively quick process, and the individual drug may be internalized by different cancer cells, which results in the improper drug concentration ratio in one cancer cell and would hinder two drugs from exerting the synergism effect. According to the fluorescence signals of DOX and CUR in real-time cellular uptake (Figure 3), it could be predicted that PTX and CQ in the PCL group would be taken in by cancer cells at the synergistic ratio while PTX and CQ in PTXL+CQL(1:2) were internalized independently. The synchronized internalization pattern was proved to be very important according to the in vivo antitumor effect. In summary, co-delivery of synergistic drugs by means of nanoparticles may assure efficient synergistic proportions both in the target tissue and in the target cells. As expected, PCL1:2 displayed a significantly stronger anticancer effect on PTX-resistant cancers than PTXL+CQL(1:2) both in vitro (Figure 2; Table 2) and in vivo (Figure 6).
Conclusion
In this study, we prepared a series of composite liposomes with controlled co-encapsulation ratios and high EE for both PTX and CQ. This achievement supplied us with the possibility of determining the contribution of CQ to its resistance reversal effect on PTX-resistant cancers through both in vitro and in vivo tests. The CQ reversal mechanism of PTX resistance was found to be relevant to the competitive binding of drug transporters on the cell membrane and inhibition of cellular autophagy responses. More importantly, by comparing the antitumor effects of the PTX–CQ co-delivery liposome and the mixture of liposomes loading PTX and CQ individually, this study provides meaningful information about administration modes for two synergistic drugs in combination cancer therapy.
Acknowledgments
This work was financially supported by the National Natural Science Funds for Excellent Young Scholar (81222047) and the Fundamental Research Funds for the Central Universities (2014XZZX003-20).
Disclosure
The authors report no conflicts of interest in this work.
References
McGuire WP, Rowinsky EK, Rosenshein NB, et al. Taxol: a unique antineoplastic agent with significant activity in advanced ovarian epithelial neoplasms. Ann Intern Med. 1989;111:273–279. | ||
Holmes FA, Walters RS, Theriault RL, et al. Phase II trial of taxol, an active drug in the treatment of metastatic breast cancer. J Natl Cancer Inst. 1991;83:1797–1805. | ||
Georgiadis MS, Russell EK, Gazdar AF, Johnson BE. Paclitaxel cytotoxicity against human lung cancer cell lines increases with prolonged exposure durations. Clin Cancer Res. 1997;3:449–454. | ||
Patel N, Salifu M, Sumrani N, et al. Successful treatment of post-renal transplant Kaposi’s sarcoma with paclitaxel. Am J Transplant. 2002;2:877–879. | ||
Zhang Z, Mei L, Feng SS. Paclitaxel drug delivery systems. Expert Opin Drug Deliv. 2013;10:325–340. | ||
Galletti E, Magnani M, Renzulli ML, Botta M. Paclitaxel and docetaxel resistance: molecular mechanisms and development of new generation taxanes. ChemMedChem. 2007;2:920–942. | ||
Liu L, Yang M, Kang R, et al. DAMP-mediated autophagy contributes to drug resistance. Autophagy. 2011;7:112–114. | ||
Williams A, Jahreiss L, Sarkar S, et al. Aggregate – prone proteins are cleared from the cytosol by autophagy: therapeutic implications. Curr Top Dev Biol. 2006;76:89–101. | ||
Chen S, Rehman SK, Zhang W, Wen A, Yao L, Zhang J. Autophagy is a therapeutic target in anticancer drug resistance. Biochim Biophys Acta. 2010;1806:220–229. | ||
Carew JS, Nawrocki ST, Kahue CN, et al. Targeting autophagy augments the anticancer activity of the histone deacetylase inhibitor SAHA to overcome Bcr-Abl-mediated drug resistance. Blood. 2007;110:313–322. | ||
Apel A, Herr I, Schwarz H, Rodemann HP, Mayer A. Blocked autophagy sensitizes resistant carcinoma cells to radiation therapy. Cancer Res. 2008;68:1485–1494. | ||
Ajabnoor G, Crook T, Coley HM. Paclitaxel resistance is associated with switch from apoptotic to autophagic cell death in MCF-7 breast cancer cells. Cell Death Dis. 2012;3:e260. | ||
Wellems TE, Plowe CV. Chloroquine-resistant malaria. J Infect Dis. 2001;184:770–776. | ||
Verschooten L, Barrette K, Van Kelst S, et al. Autophagy inhibitor chloroquine enhanced the cell death inducing effect of the flavonoid luteolin in metastatic squamous cell carcinoma cells. J Clin Invest. 2012;7:e48264. | ||
Wu D, Ma S, Sui F, Zhang C, Yin L, Lu H. Reversal of CQ11, a chloroquine derivative, on multidrug resistance in doxorubicin-resistant breast cancer cell line MCF/DOX. The Chinese-German Journal of Clinical Oncology. 2008;7:647–649. | ||
Zucker D, Barenholz Y. Optimization of vincristine-topotecan combination – paving the way for improved chemotherapy regimens by nanoliposomes. J Control Release. 2010;146:326–333. | ||
Chen AM, Zhang M, Wei D, et al. Co-delivery of doxorubicin and Bcl – 2 siRNA by mesoporous silica nanoparticles enhances the efficacy of chemotherapy in multidrug-resistant cancer cells. Small. 2009;5:2673–2677. | ||
Yang T, Cui FD, Choi MK, et al. Enhanced solubility and stability of PEGylated liposomal paclitaxel: in vitro and in vivo evaluation. Int J Pharm. 2007;338:317–326. | ||
Dogan AL, Legrand O, Faussat AM, Perrot JY, Marie JP. Evaluation and comparison of MRP1 activity with three fluorescent dyes and three modulators in leukemic cell lines. Leuk Res. 2004;28:619–622. | ||
Meszaros P, Klappe K, van Dam A, et al. Long term myriocin treatment increases MRP1 transport activity. Int J Biochem Cell Biol. 2013;45:326–334. | ||
Qiu L, Jing N, Jin Y. Preparation and in vitro evaluation of liposomal chloroquine diphosphate loaded by a transmembrane pH-gradient method. Int J Pharm. 2008;361:56–63. | ||
Fritze A, Hens F, Kimpfler A, Schubert R, Peschka-Süss R. Remote loading of doxorubicin into liposomes driven by a transmembrane phosphate gradient. Biochim Biophys Acta. 2006;1758:1633–1640. | ||
Ji X, Gao Y, Chen L, Zhang Z, Deng Y, Li Y. Nanohybrid systems of non-ionic surfactant inserting liposomes loading paclitaxel for reversal of multidrug resistance. Int J Pharm. 2012;422:390–397. | ||
Xiao L, Xiong X, Sun X, et al. Role of cellular uptake in the reversal of multidrug resistance by PEG-b-PLA polymeric micelles. Biomaterials. 2011;32:5148–5157. | ||
Gelderblom H, Verweij J, Nooter K, Sparreboom A. Cremophor EL: the drawbacks and advantages of vehicle selection for drug formulation. Eur J Cancer. 2001;37:1590–1598. | ||
Zahedi P, De Souza R, Huynh L, Piquette-Miller M, Allen C. Combination drug delivery strategy for the treatment of multidrug resistant ovarian cancer. Mol Pharm. 2010;8:260–269. | ||
Sharma R, Sharma A. Multidrug resistance (MDR) in lung cancer: finding the holy grail of MDR reversal. J Cancer Sci Ther. 2012;S11:e001. | ||
Renes J, de Vries EG, Nienhuis EF, Jansen PL, Müller M. ATP- and glutathione-dependent transport of chemotherapeutic drugs by the multidrug resistance protein MRP1. Br J Pharmacol. 1999;126:681–688. | ||
Vezmar M, Georges E. Direct binding of chloroquine to the multidrug resistance protein (MRP): possible role for MRP in chloroquine drug transport and resistance in tumor cells. Biochem Pharmacol. 1998;56:733–742. | ||
Orrenius S, Kaminskyy VO, Zhivotovsky B. Autophagy in toxicology: cause or consequence? Annu Rev Pharmacol Toxicol. 2013;53:275–297. | ||
Bellodi C, Lidonnici M R, Hamilton A, et al. Targeting autophagy potentiates tyrosine kinase inhibitor–induced cell death in Philadelphia chromosome–positive cells, including primary CML stem cells. J Clin Invest. 2009;5:1109. | ||
Kim SC, Kim DW, Shim YH, et al. In vivo evaluation of polymeric micellar paclitaxel formulation: toxicity and efficacy. J Control Release. 2001;72:191–202. | ||
Eiseman JL, Eddington ND, Leslie J, et al. Plasma pharmacokinetics and tissue distribution of placlitaxel in CD2F1 mice. Cancer Chemother Pharmacol. 1994;34:465–471. | ||
Verbeeck RK, Junginger HE, Midha KK, Shah VP, Barends DM. Biowaiver monographs for immediate release solid oral dosage forms based on biopharmaceutics classification system (BCS) literature data: chloroquine phosphate, chloroquine sulfate, and chloroquine hydrochloride. J Pharm Sci. 2005;94:1389–1395. | ||
Maiuri MC, Zalckvar E, Kimchi A, Kroemer G. Self-eating and self-killing: crosstalk between autophagy and apoptosis. Nat Rev Mol Cell Biol. 2007;8:741–752. | ||
Solomon VR, Lee H. Chloroquine and its analogs: a new promise of an old drug for effective and safe cancer therapies. Eur J Pharmacol. 2009;625:220–233. | ||
Chaabane W, User SD, El-Gazzah M, et al. Autophagy, apoptosis, mitoptosis and necrosis: interdependence between those pathways and effects on cancer. Arch Immunol Ther Exp (Warsz). 2013;61:43–58. |
Supplementary materials
Methods
In vitro cell viability
Cells were seeded in 96-well plates and incubated for 24 hours to allow adherence, followed by drug exposure for 48 hours. Subsequently, 31.5 μL MTT (5 mg/mL) was added to each well and the plate was incubated at 37°C for 4 hours. The medium was then removed, and the cells were lysed with 200 μL dimethylsulfoxide (DMSO) solution. The absorbance values of the formazan crystals were recorded on a microplate reader (SPECTRAmax; Molecular Devices LLC, Sunnyvale, CA, USA) at 570 nm. Cell viability was assessed by the absorbance readings as a percentage of the control.
Evaluation of cell apoptosis
Apoptosis was determined by annexin V–fluorescein isothiocyanate/propidium iodide assay with flow cytometry. Briefly, cells were cultured in six-well plates and treated with different preparations for 48 hours. The staining was performed with an annexin V–fluorescein isothiocyanate-conjugated apoptosis detection kit (MultiSciences Biotech, Shanghai, People’s Republic of China) incorporating propidium iodide according to the manufacturer’s instructions. The population of viable cells and apoptotic cells were evaluated with flow cytometry.
P-gp and MRP functional activity analysis
The accumulation of rhodamine 123 (Rh123) was performed in 24-well plates. Cells were seeded at a density of 1×10⁵ cells per well. After adherence, cells were treated with free chloroquine phosphate (CQ) or CQ-loaded liposome at various concentrations for a certain period. Then Rh123 (5 μM) was added to the cells, followed by incubation at 37°C for 30 minutes. The medium was removed afterward, and the cells were washed with cold phosphate-buffered saline twice. The fluorescence of Rh123 was analyzed with a flow cytometer (FC500MCL; Beckman Coulter, Miami, FL, USA).
The influence of CQ on MRP1 functional activity was evaluated with MRP-mediated uptake of 5-carboxyfluorescein diacetate (5-CFDA). A549/T cells were incubated with a series of concentrations of free CQ and CQ-loaded liposome at 37°C for 4 hours in Roswell Park Memorial Institute (RPMI) medium. Then, 0.2 μM 5-CFDA was added, and cells were incubated at 37°C for another 30 minutes. Finally, cells were washed twice with cold phosphate-buffered saline and the fluorescence of 5-CFDA was examined with flow cytometry.
Western blot analysis
Briefly, cells were treated with various formulations for 24 hours and then harvested with lysis buffer containing a protease inhibitor cocktail. The total protein concentration was determined with a bicinchoninic acid protein assay kit. Protein samples were separated with 8%–15% sodium dodecyl sulfate polyacrylamide gel electrophoresis and transferred to a 0.2 μm polyvinylidene fluoride membrane (Merck Millipore, MA, Billerica, USA). The membrane was blocked with 5% skim milk for 1 hour and then immunoblotted with P-gp (Abcam, Cambridge, UK), MRP1 (Boster Biotech, Wuhan, People’s Republic of China), LC3 (Cell Signaling Technology, Danvers, MA, USA), and β-actin (MultiSciences Biotech) antibodies at 4°C overnight. IRDye 680RD goat anti-mouse and IRDye 800CW goat anti-rabbit secondary antibodies (1:10,000; LI-COR Biosciences, Lincoln, NE, USA) were incubated at room temperature for 1 hour, and the membranes were visualized on an Odyssey® scanner (LI-COR Biosciences).
Measurement of drug concentration in plasma and tissue
The concentrations of paclitaxel and CQ in the plasma and various tissues were determined by high-performance liquid chromatography (HPLC) with UV detection at 228 nm and 330 nm, respectively. In brief, 100 μL samples of plasma were mixed with isometric methanol–water (v/v, 1:1) containing norethindrone and piperaquine phosphate as internal standard agents of paclitaxel and CQ, vortexed for 5 minutes, and centrifuged at 6,000 rpm for 10 minutes. The supernatant was then centrifuged at 10,000 rpm for 10 minutes, and 20 μL aliquots were injected onto the HPLC system. Tissue samples were homogenized in 300 μL sodium chloride and the homogenate was extracted as described above for plasma and analyzed by HPLC. The pharmacokinetic parameters were calculated using Thermo Kinetica 4.4.1 software.
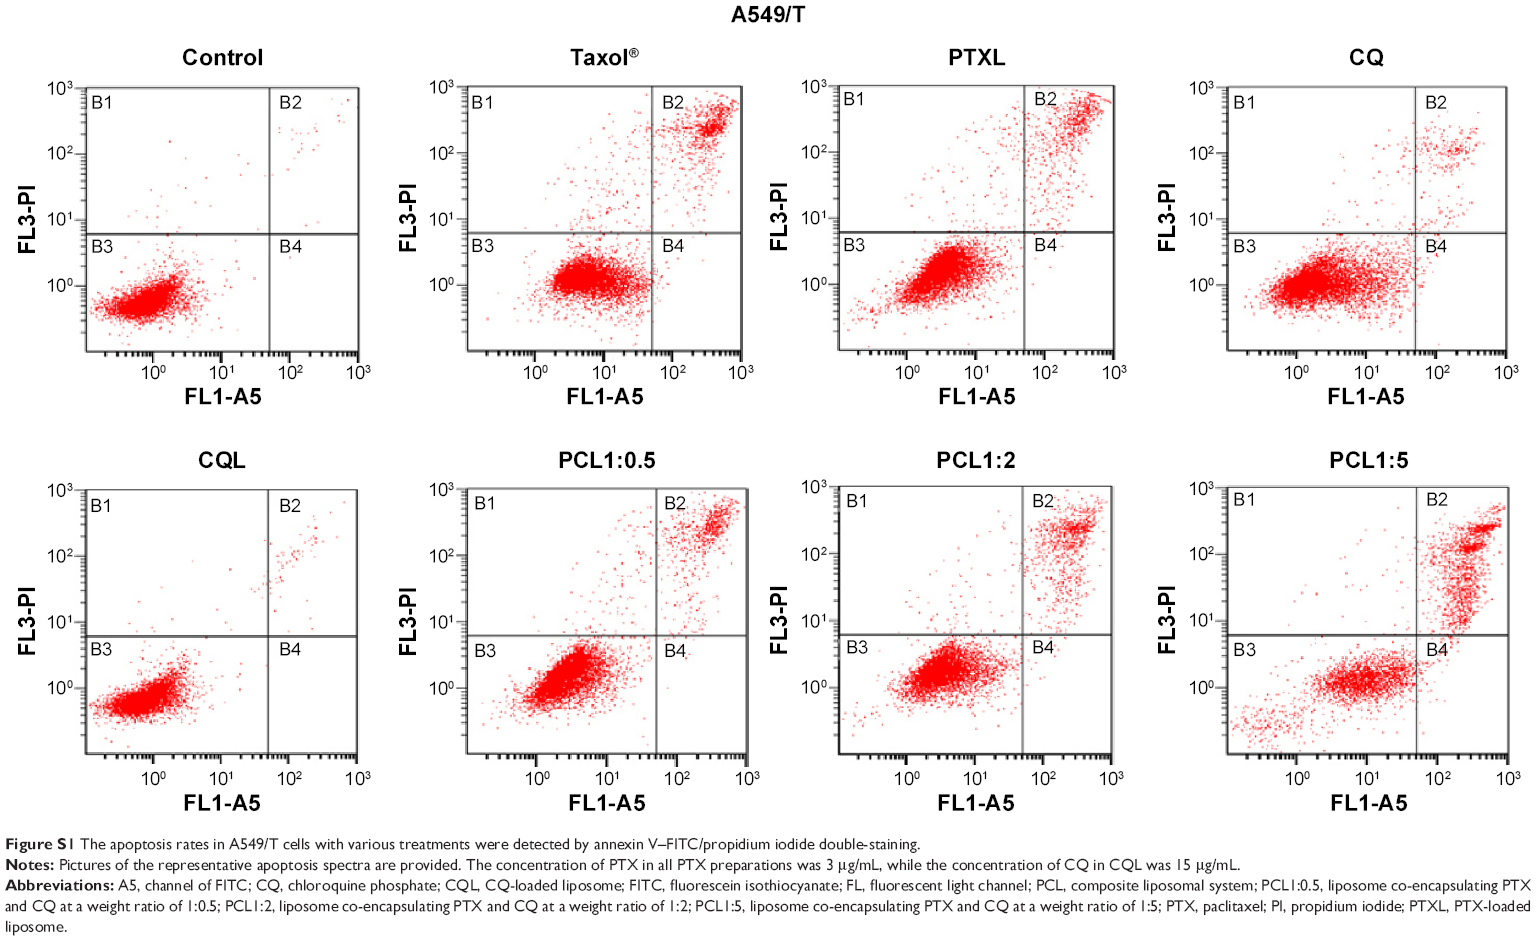 | Figure S1 The apoptosis rates in A549/T cells with various treatments were detected by annexin V–FITC/propidium iodide double-staining. |
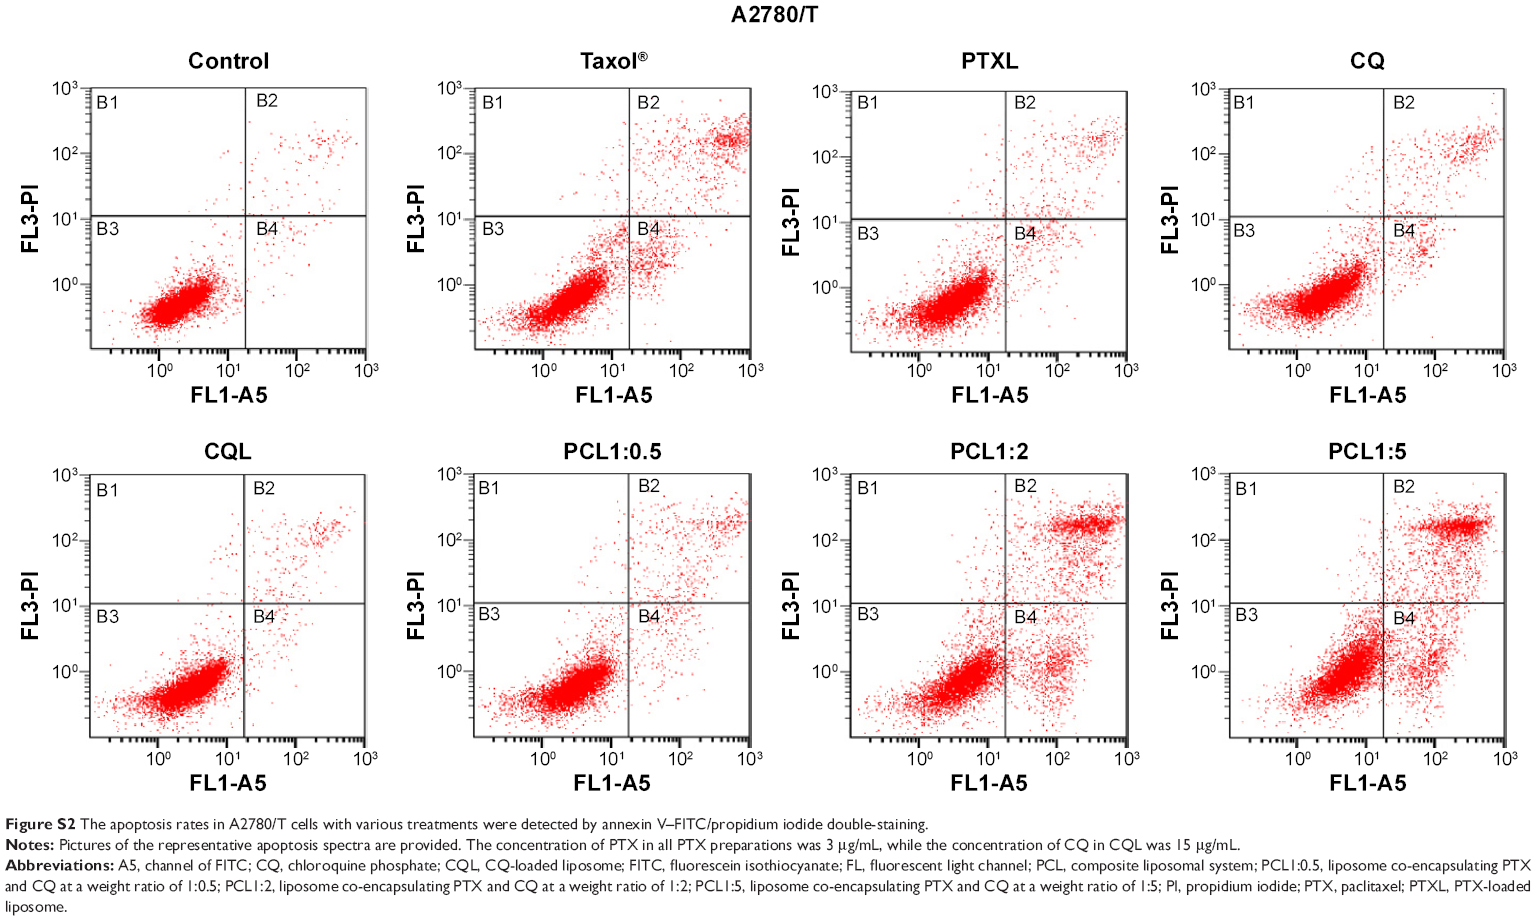 | Figure S2 The apoptosis rates in A2780/T cells with various treatments were detected by annexin V–FITC/propidium iodide double-staining. |
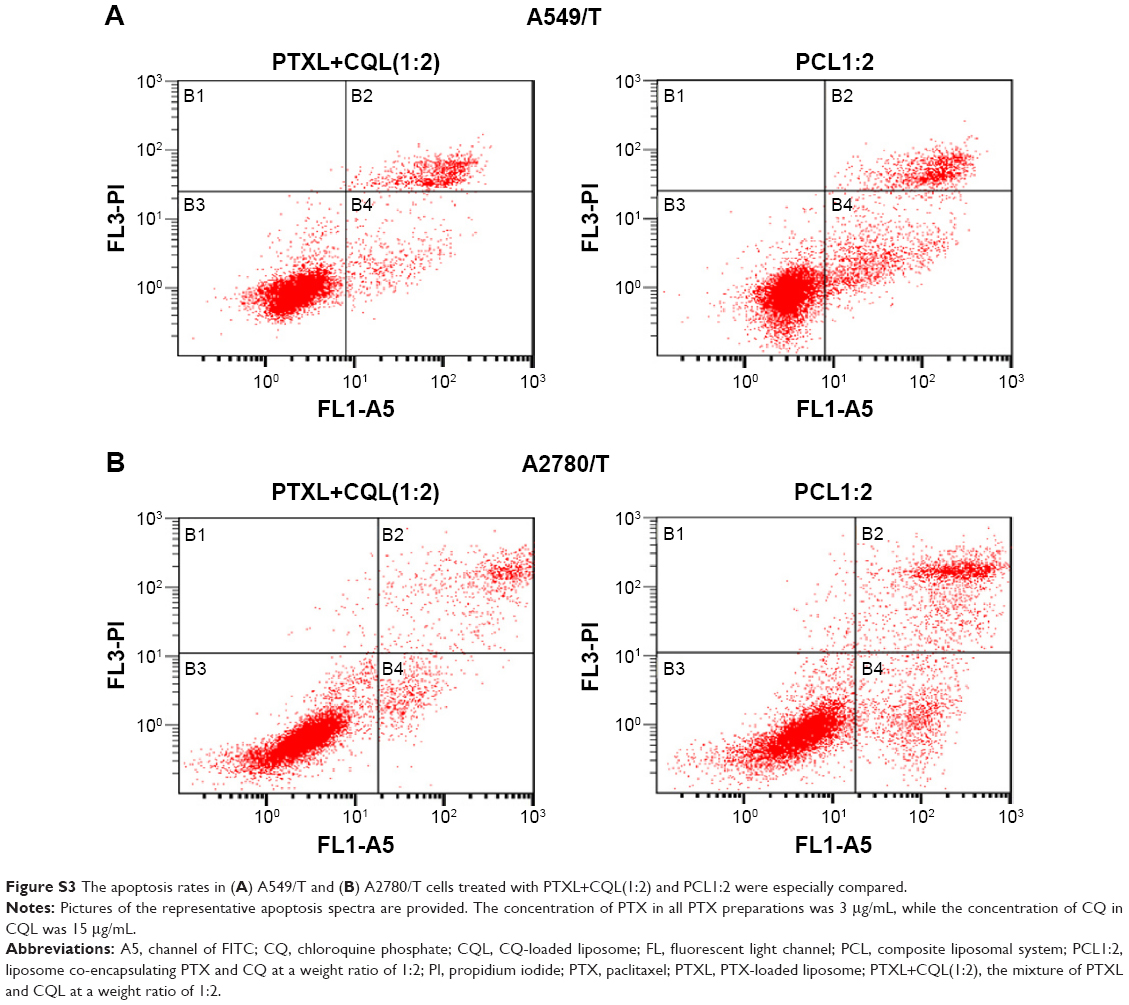 | Figure S3 The apoptosis rates in (A) A549/T and (B) A2780/T cells treated with PTXL+CQL(1:2) and PCL1:2 were especially compared. |
 © 2015 The Author(s). This work is published and licensed by Dove Medical Press Limited. The full terms of this license are available at https://www.dovepress.com/terms.php and incorporate the Creative Commons Attribution - Non Commercial (unported, v3.0) License.
By accessing the work you hereby accept the Terms. Non-commercial uses of the work are permitted without any further permission from Dove Medical Press Limited, provided the work is properly attributed. For permission for commercial use of this work, please see paragraphs 4.2 and 5 of our Terms.
© 2015 The Author(s). This work is published and licensed by Dove Medical Press Limited. The full terms of this license are available at https://www.dovepress.com/terms.php and incorporate the Creative Commons Attribution - Non Commercial (unported, v3.0) License.
By accessing the work you hereby accept the Terms. Non-commercial uses of the work are permitted without any further permission from Dove Medical Press Limited, provided the work is properly attributed. For permission for commercial use of this work, please see paragraphs 4.2 and 5 of our Terms.