")
Back to Journals » International Journal of Nanomedicine » Volume 9 » Issue 1
Enhanced bioavailability of apigenin via preparation of a carbon nanopowder solid dispersion
Authors Ding S, Zhang Z, Song J, Cheng X, Jiang J, Jia X
Received 17 January 2014
Accepted for publication 1 March 2014
Published 13 May 2014 Volume 2014:9(1) Pages 2327—2333
DOI https://doi.org/10.2147/IJN.S60938
Checked for plagiarism Yes
Review by Single anonymous peer review
Peer reviewer comments 4
Shu-min Ding,1–3 Zhen-hai Zhang,1,3 Jie Song,1,3 Xu-dong Cheng,1,3 Jun Jiang,1,3 Xiao-bin Jia1,3
1Affiliated Hospital on Integration of Chinese and Western Medicine, Nanjing University of Chinese Medicine, Nanjing, People's Republic of China; 2School of Pharmaceutical Engineering and Life Science, Changzhou University, Changzhou, People's Republic of China; 3Key Laboratory of New Drug Delivery System of Chinese Materia Medica, Jiangsu Provincial Academy of Chinese Medicine, Nanjing, People's Republic of China
Abstract: In this study, a novel carbon nanopowder (CNP) drug carrier was developed to improve the oral bioavailability of apigenin (AP). Solid dispersions (SDs) of AP with CNP were prepared, and their in vitro drug release and in vivo performance were evaluated. The physicochemical properties of the formulations were examined by differential scanning calorimetry, X-ray diffraction, and scanning electron microscopy. Drug release profiles showed that AP dissolution from the CNP-AP system (weight ratio, 6:1) after 60 minutes improved by 275% compared with that of pure AP. Moreover, the pharmacokinetic analysis of SD formulations in rats showed that the AP area under the curve0–t value was 1.83 times higher for the CNP-AP system than for pure AP, indicating that its bioavailability was significantly improved. In addition, compared with pure AP, SDs had a significantly higher peak and shorter time to peak. Preliminary intestinal toxicity tests indicated that there was no significant difference in the tissues of the rats treated with the CNP-AP system, rats treated with the CNP alone, and controls. In conclusion, CNP-based SDs could be used for enhancing the bioavailability of poorly water-soluble drugs while also improving drug safety.
Keywords: apigenin, carbon nanopowder, solid dispersions, dissolution, oral bioavailability
Introduction
Apigenin (AP), a common bioactive flavonoid, is found in a wide variety of fruits, plants, and vegetables. It has an antiproliferative activity against pancreatic, colorectal, skin, neuroblastoma, and breast cancer cell lines.1–5 However, the oral bioavailability of AP is relatively low because of its low lipid (0.001–1.63 mg/mL in nonpolar solvents)6 and water (2.16 μg/mL in water)7 solubility, which has severely limited its clinical development. Therefore, it is necessary to develop new technologies or formulations to improve AP bioavailability.
According to the Biopharmaceutics Classification System, AP is a class II drug with high intestinal membrane permeability and poor solubility,7 which can be improved by increasing the dissolution rate of the drug. Numerous studies have shown that solid dispersion (SD) is a successful and widely used approach to enhancing the dissolution rate of poorly water-soluble drugs.8–11 In this system, the solubility and dissolution rate of poorly water-soluble drugs can be improved by reducing particle size, enhancing wettability and porosity, and changing the drug state from crystalline to amorphous.12–14 At this time, different novel carriers, such as silica nanopowder, are used in SDs.15 It also has been shown that the dissolution profile can be improved using nanograde SD carriers.
Carbon nanopowders (CNPs) are carbon nanomaterials with a one-dimensional diameter of less than 100 nm. They are small and have many unique features, including inherent chemical inertness, high dispersibility, and a large specific surface area,16–20 which help reduce drug particle size to molecular levels and improve drug dispersion. Carbon nanomaterials have been widely used as drug delivery agents, particularly in targeted therapy.21–24 Because nanomaterials have been successfully applied in SDs, the application of CNP as a carrier for an SD preparation is expected to enhance drug solubility.15 However, there are few reports describing the development of SD, using CNP as the dispersing carrier. The aim of this study was to prepare a novel CNP-AP SD to improve the dissolution rate and oral bioavailability of poorly water-soluble drugs.
Materials and methods
Materials
AP (98%) was purchased from Nanjing Zelang Science and Technology Co, Ltd (Nanjing, People’s Republic of China). Luteolin (purity, >99%) was purchased from National Institute for the Control of Pharmaceutical and Biological Products (Chongwen, Beijing, People’s Republic of China). CNP (average diameter, 40 nm; purity, >99%; color, black; morphology, almost spherical; true density, 0.43 g/cm3; powerful specific surface area, >1,400 m2/g; electrical conductivity, 0.2 Ω · cm) was purchased from Beijing Deco Daojin Ltd (Beijing, People’s Republic of China). All reagents were of analytical grade except methanol, which was of chromatographic grade. Double-distilled water prepared in our laboratory was used.
Animals
Male Sprague-Dawley rats (body weight, 220±10 g) were obtained from Experimental Animal Center of the Jiangsu Provincial Academy of Chinese Medicine (Nanjing, People’s Republic of China). Before the experiments, the rats were housed in a temperature- and humidity-controlled room (23°C; air humidity, 55%) with free access to water. All animal experiments were reviewed and approved by the Institutional Animal Care and Use Committee of the Jiangsu Provincial Academy of Chinese Medicine.
Preparation of SDs and physical mixture systems
SDs of AP and CNP were prepared by solvent evaporation. Briefly, AP and CNP (weight ratios, 1:2, 1:4, 1:6, and 1:8) were dissolved in ethanol to a concentration of 0.4 mg · mL−1 and evaporated in a rotary evaporator over a water bath maintained at 40°C until a clear mixture was formed. The physical mixture (PM) of AP and CNP was prepared by mixing AP with CNP at a ratio of 1:6 (weight:weight) and then grinding them thoroughly, using a mortar and pestle, until a homogeneous mixture was obtained.
In vitro dissolution study
Ultraperformance liquid chromatography analysis of AP
The concentration of AP in the dissolution medium was determined by ultraperformance liquid chromatography (UPLC; Waters Acquity, Milford, MA, USA), using a BEH C18 column (50 mm × 2.1 mm, 1.7 μm) with a mobile phase of acetonitrile and 0.1% formic acid (30:70, volume:volume) at a flow rate of 0.3 mL · minute−1 and ultraviolet detection at 330 nm. All samples were filtered through membrane filters (0.22 μm; Millipore Corp, Billerica, MA, USA) before use, and the injection volume was 4 μL. The linear calibration curve was obtained in the concentration range of 0.22–21.60 μg/mL, with a correlation coefficient of 0.9996.
In vitro dissolution test
The pharmaceutical performance of pure AP and its SDs was assessed by performing an in vitro dissolution test. The test was performed according to the US Pharmacopeia apparatus 2 (paddle) method, using a Beiyang SR8 plus dissolution apparatus (D-800LS dissolution apparatus; Tianjin University exact apparatus Co., Ltd., Tianjin, People’s Republic of China) at 37°C, with constant stirring at 100 rpm.
Each powder sample (equivalent to 5 mg AP) was added to the dissolution medium (900 mL distilled water containing 0.4% sodium dodecyl sulfate), and then 5 mL samples were collected and replaced with a temperature-equilibrated dissolution medium at fixed time intervals. The samples were filtered through a 0.22 μm membrane, and the AP content was analyzed by performing UPLC, as described earlier. Data are expressed as mean ± standard deviation. Statistical comparisons were made using the analysis of variance test and SPSS 18.0 software (IBM, Armonk, NY, USA) for groups at each time.
Characterization of AP SDs
Differential scanning calorimetry
Differential scanning calorimetry (DSC) curves of AP, CNP, PM, and SD were obtained using a DSC 204A/G Phoenix® instrument (Netzsch, Selb, Germany) in a nitrogen atmosphere with a flow rate of 100 mL · minute−1. Solid samples were dried at 40°C before analysis to remove residual water. During the test, each sample was heated from 10°C to 500°C at increasing increments of 10°C/minute.
Scanning electron microscopy
The shape and surface morphology of the powder samples were examined using a scanning electron microscope (S-3000N; Hitachi, Tokyo, Japan).
X-ray diffraction
Powder X-ray diffraction (XRD) patterns were assessed using an XRD system (D8-Advance; Bruker, Karlsruhe, Germany), and the diffraction pattern was recorded with primary monochromated radiation over a 2¸ range of 0°–70°. The step size used was 0.04, at a rate of 10 seconds per step.
Bioavailability study
Animal experiment
Eighteen male Sprague-Dawley rats (weight, 280±20 g) randomly divided into three groups were fasted for 12 hours with free access to water before the experiments. They received oral formulations (AP, AP-PM, and AP-SD with an AP/CNP ratio of 1:6) at a dose equivalent to 60 mg/kg of AP. Plasma samples (0.4 mL) were collected from the eye vein at 0, 0.33, 0.67, 1, 1.5, 2, 2.5, 3, 4, 6, 8, 10, 12, and 24 hours after treatment. Then, the plasma samples were separated by centrifugation at 3,000 rpm for 10 minutes and stored at −40°C until analysis.
Sample preparation and UPLC analysis
The AP concentration in blood samples was determined by performing UPLC, as described earlier, except that luteolin was used as an internal standard. The linear calibration curve was obtained between 0.1 and 11.4 μg/mL, with a correlation coefficient of 0.9995. The results obtained from the relative recoveries of high, middle, and low concentrations were 108.21%±17.39%, 104.23%±14.64%, and 93.15%±7.22%, respectively. All of the absolute recoveries were above 80%, with all relative standard deviation values being less than 15%, which was within the acceptable limits to fulfill the guidelines for bioanalytical methods.
Frozen plasma samples were thawed at room temperature and prepared for analysis. Briefly, 0.2 mL methanol containing luteolin (1.1 μg/mL) was added to 0.2 mL of a plasma sample as an internal standard. Then, 600 μL methanol was added and the mixture was vortex-mixed for 5 minutes to extract AP and luteolin. After centrifugation at 13,000 rpm for 10 minutes, the precipitate containing proteins and carbon nanomaterial was discarded. The supernatant was collected and evaporated to dryness under a gentle stream of nitrogen. Finally, the residue obtained was resuspended in 200 μL methanol and centrifuged at 13,000 rpm for 10 minutes. Four microliters of supernatant was injected into the UPLC system for analysis.
Data presentation and analysis
The main pharmacokinetic parameters, including peak concentration (Cmax), time to maximum, and area under the curve (AUC0–t and AUC0–∞), were determined by a compartmental analysis using the software program DAS version 1.0 (Chinese Pharmacology Society, Beijing, People’s Republic of China). Data are expressed as mean ± standard deviation. Statistical comparisons were made using the analysis of variance test and the SPSS 18.0 software for groups at each time. A P-value less than 0.05 was considered to be statistically significant.
Intestinal toxicity evaluation of carbon nanopowder
Twenty-four male Sprague-Dawley rats (weight, 280±20 g) were used to study the effect of CNP treatment on the intestine. The rats were randomly divided into four groups (six rats each). CNP, PM, and SD (AP/CNP ratio of 1:6) at a dose equivalent to 60 mg/kg of AP were orally administered to three groups, and one group received the same volume of saline solution. After 2 weeks, the rats were killed and the jejunum was excised. Samples were fixed with 10% formalin, followed by paraffin embedding and hematoxylin-eosin staining. Finally, the mucosal structure of the samples was observed under a light microscope (Olympus DX45; Olympus Corporation, Tokyo, Japan).
Results and discussion
In vitro dissolution study
The in vitro dissolution profiles of AP and different SD formulations are shown in Figure 1. Compared with AP alone, SDs showed higher dissolution of AP at different AP/CNP ratios. Only approximately 38% of AP was dissolved from the AP powder during the 180-minute study period under the experimental conditions (900 mL distilled water containing 0.4% sodium dodecyl sulfate). However, approximately 92% of AP was dissolved from the SD with an AP/CNP ratio of 1:6 within 60 minutes, which suggested that the carrier greatly improved the dissolution behavior of AP. Dissolution might have been enhanced because of the disordered structure of amorphous SDs.25 The dissolution rates of poorly water-soluble drugs fenofibrate and celecoxib markedly increased with the use of mesoporous carbon.26,27 Our results indicated that AP dissolution did not increase significantly when the AP/CNP ratio reached 1:8 (P>0.5 versus an AP/CNP ratio of 1:6; Figure 1). Therefore, the SD with an AP/CNP ratio of 1:6 was selected for further study.
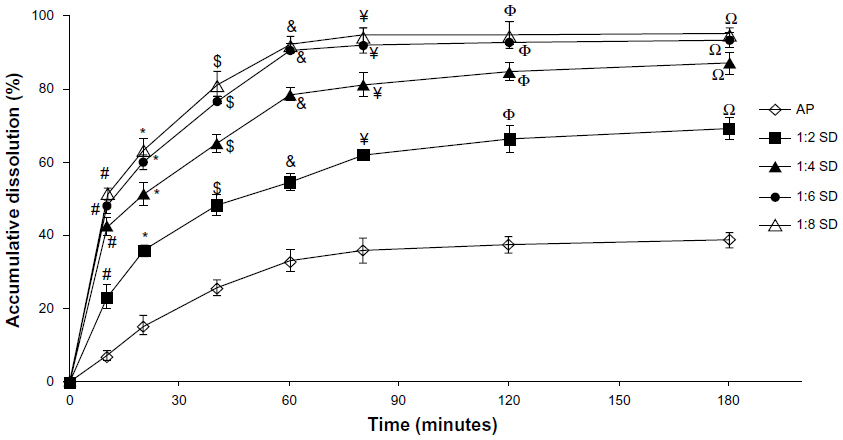 | Figure 1 The dissolution profiles of AP and SDs at different AP/CNP ratios of 1:2, 1:4, 1:6, and 1:8. |
Characterization of AP solid dispersion
Differential scanning calorimetry
Figure 2 shows the results of the DSC analysis of AP, CNP, PM, and SD. The DSC curve of AP (Figure 2A) had a sharp endothermic peak at approximately 365°C corresponding to the melting point of AP and indicating its crystalline nature. This is in agreement with the results reported by Zhang et al.28 However, the characteristic AP peak completely disappeared in the SD with an AP/CNP ratio of 1:6 (Figure 2C), suggesting that AP was molecularly dispersed and might have been in an amorphous form, which facilitated dissolution. A broad endothermic peak appeared at approximately 95°C, indicating water loss resulting from the hygroscopic nature of CNP (Figure 2B). Furthermore, both the drug endothermic peak and dehydration peak were observed in the PM with an AP/CNP ratio of 1:6, which indicated there was no interaction between AP and CNP in the PM.
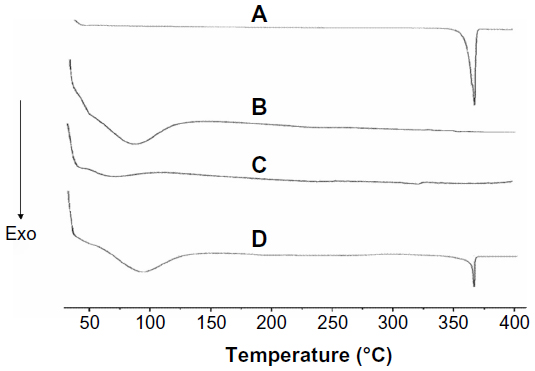 | Figure 2 DSC curves of AP (A), CNP (B), SD at AP/CNP ratio of 1:6 (C) and AP/CNP 1:6 PM (D). |
Scanning electron microscopy
The results of the scanning electron microscopy analysis of AP and the SD with an AP/CNP ratio of 1:6 are shown in Figure 3. AP particles exhibited flat broken needles of different size, with a smooth surface (Figure 3A). In contrast, no AP particles were observed in the SD, indicating that AP was well dispersed in CNP (Figure 3B).
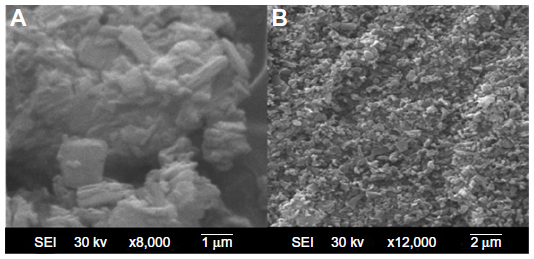 | Figure 3 SEM of AP (A) and AP solid dispersion prepared with an AP/CNP ratio of 1:6 (B); magnification, 8,000×. |
XRD
The powder XRD patterns of AP, CNP, PM, and SD are shown in Figure 4. AP showed characteristic peaks at diffraction angles (Figure 4A), but no typical peaks were found in the XRD patterns of CNP (Figure 4B). As shown in Figure 4D, the XRD pattern of the PM was almost identical to that of AP alone. In contrast, the major AP peaks were not observed in the SD (Figure 4C). XRD results suggested that AP existed in an amorphous state in the SD, which was also demonstrated by the DSC analysis.
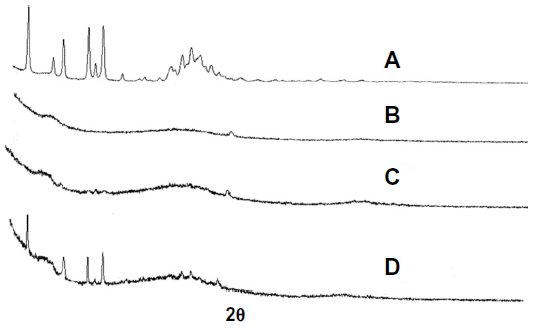 | Figure 4 X-ray diffraction. |
Oral bioavailability
Pharmacokinetic studies in rats were carried out to evaluate the oral absorption of AP and its SD and PM. The mean plasma concentration–time profiles of AP after oral administration are shown in Figure 5. The main pharmacokinetic parameters are listed in Table 1. Compared with AP alone and PM, the SD system showed a significant improvement in Cmax and AUC0–t. Oral administration of AP alone resulted in very low AP blood levels, with a Cmax of 1.33±0.24 μg/mL and AUC0–t of 11.76±1.52 μg · hour/mL. In contrast, the Cmax and AUC0–t values for the SD system reached 3.26±0.33 μg/mL and 21.48±2.83 μg · hour/mL, respectively (Table 1). These results indicate that the SD enhanced the relative oral bioavailability of AP by approximately 183%. Furthermore, compared with AP alone and PM, SD was associated with a short time to maximum. These results were relatively consistent with the results of the dissolution test, suggesting that the enhanced oral bioavailability of the SD might be partly attributable to the increased drug dissolution and absorption rates in rats. Previous studies have demonstrated that a significant increase in the drug dissolution rate might result in higher drug permeability between the gastrointestinal lumen and blood, leading to higher drug bioavailability.29 In addition, the PM had slightly higher bioavailability than pure AP (Table 1), which might have been caused by the absorption-promoting activity of CNP.
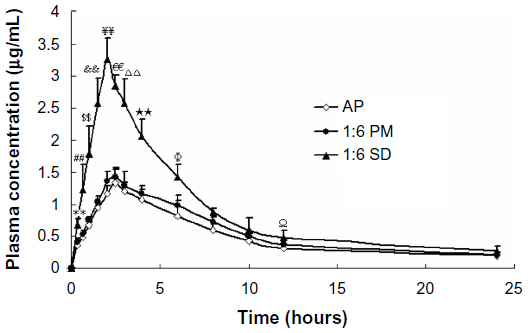 | Figure 5 Mean plasma concentration–time curve of AP in rats after oral administration of AP, SD (AP/CNP ratio of 1:6), and PM (AP/CNP ratio of 1:6) equivalent to 60 mg kg−1 of AP (n=6), respectively. |
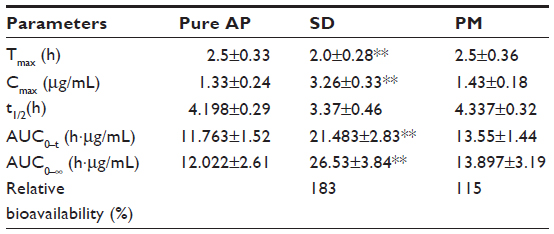 | Table 1 The main pharmacokinetic parameters of AP after oral administration of AP, PM (AP/CNP ratio of 1:6) or SD (AP/CNP ratio of 1:6) in rats in a dose of 60 mg/kg |
Intestinal toxicity evaluation of CNP
The jejunum mucosal structure of rats in the four treatment groups is shown in Figure 6. There were no notable differences in the mucosal structure among the groups (Figure 6A–D). In all groups, the morphology of the jejunum mucosa was normal, and goblet cells were present. There was no degeneration, necrosis, interstitial congestion, edema, or inflammatory cell infiltration in the mucosa, submucosa, muscular, or serosa cells. These preliminary results indicated there were no toxic effects on rat mucosa 2 weeks after exposure to CNP and SD. However, further research is needed to evaluate CNP toxicity.
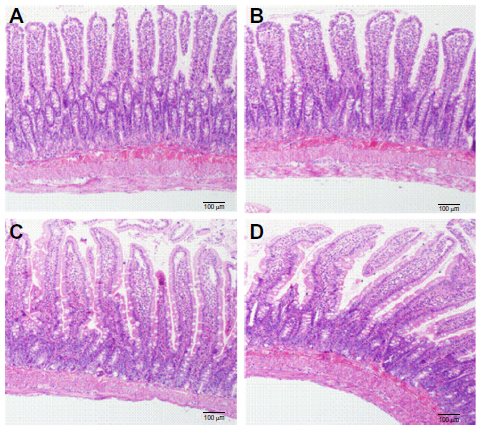 | Figure 6 Influences of CNP, SD (AP/CNP ratio of 1:6), and PM (AP/CNP ratio of 1:6) pretreatment on mucosal structures of rats. |
Conclusion
In this study, a novel SD formulation of AP for oral administration was prepared using CNP. The results demonstrated that CNP-based SD was a successful strategy to improve the dissolution behavior and oral bioavailability of AP. SDs prepared with water-soluble polymer carriers are usually soft and sticky and have poor flow properties, which hinders their application in large-scale pharmaceutical formulation.11,30,31 In this study, SDs prepared with CNPs were not sticky and flowed freely, which may facilitate the downstream processing of solid formulations. Thus, we can conclude that CNP has great potential for clinical application as a novel and promising SD carrier.
Acknowledgments
This work was financially supported by the Natural Science Foundation of China (no 81274088) and the Foundation for High-Level Talent of six areas of Jiangsu province (no HZ09032).
Disclosure
The authors report no conflicts of interest in this work.
References
Wu DG, Yu P, Li JW, et al. Apigenin potentiates the growth inhibitory effects by IKK-β-mediated NF-κB activation in pancreatic cancer cells. Toxicol Lett. 2014;224(1):157–164. | |
Chunhua L, Donglan L, Xiuqiong F, et al. Apigenin up-regulates transgelin and inhibits invasion and migration of colorectal cancer through decreased phosphorylation of AKT. J Nutr Biochem. 2013;24(10):1766–1775. | |
Wei H, Tye L, Bresnick E, Birt DF. Inhibitory effect of apigenin, a plant flavonoid, on epidermal ornithine decarboxylase and skin tumor promotion in mice. Cancer Res. 1990;50(3):499–502. | |
Hossain MM, Banik NL, Ray SK. N-Myc knockdown and apigenin treatment controlled growth of malignant neuroblastoma cells having N-Myc amplification. Gene. 2013;529(1):27–36. | |
Way TD, Kao MC, Lin JK. Apigenin induces apoptosis through proteasomal degradation of HER2/neu in HER2/neu-overexpressing breast cancer cells via the phosphatidylinositol 3-kinase/Akt-dependent pathway. J Biol Chem. 2004;279(6):4479–4489. | |
Block MJ. Chemcycolpedia. American Chemical Society. Washington, 2000:106–107. | |
Zhang J, Liu D, Huang Y, Gao Y, Qian S. Biopharmaceutics classification and intestinal absorption study of apigenin. Int J Pharm. 2012; 436(1–2):311–317. | |
Leuner C, Dressman J. Improving drug solubility for oral delivery using solid dispersions. Eur J Pharm Biopharm. 2000;50(1):47–60. | |
Vo CL, Park C, Lee BJ. Current trends and future perspectives of solid dispersions containing poorly water-soluble drugs. Eur J Pharm Biopharm. 2013;85(3 Pt B):799–813. | |
Kim MS, Kim JS, Park HJ, Cho WK, Cha KH, Hwang SJ. Enhanced bioavailability of sirolimus via preparation of solid dispersion nanoparticles using a supercritical antisolvent process. Int J Nanomedicine. 2011;6:2997–3009. | |
Kim SA, Kim SW, Choi HK, Han HK. Enhanced systemic exposure of saquinavir via the concomitant use of curcumin-loaded solid dispersion in rats. Eur J Pharm Sci. 2013;49(5):800–804. | |
Vasconcelos T, Sarmento B, Costa P. Solid dispersions as strategy to improve oral bioavailability of poor water soluble drugs. Drug Discov Today. 2007;12(23–24):1068–1075. | |
Arias MJ, Gines JM, Moyano JR, Rabasco AM. The application of solid dispersion technique with D-mannitol to the improvement in oral absorption of triamterene. J Drug Target. 1994;2(1):45–51. | |
Dai WG, Dong LC, Song YQ. Nanosizing of a drug/carrageenan complex to increase solubility and dissolution rate. Int J Pharm. 5, 2007; 342(1–2):201–207. | |
Jiang YR, Zhang ZH, Liu QY, Hu SY, Chen XY, Jia XB. Preparation, characterization, and in vivo evaluation of tanshinone IIA solid dispersions with silica nanoparticles. Int J Nanomedicine. 2018:2285–2293. | |
El-Sayed Y, Bandosz TJ. Role of surface oxygen groups in incorporation of nitrogen to activated carbons via ethylmethylamine adsorption. Langmuir. 2005;21(4):1282–1289. | |
Trifonov A, Herkendell K, Tel-Vered R, Yehezkeli O, Woerner M, Willner I. Enzyme-capped relay-functionalized mesoporous carbon nanoparticles: effective bioelectrocatalytic matrices for sensing and biofuel cell applications. ACS Nano. 2013;7(12):11358–11368. | |
Zhu Y, Zhang X, Zhu J, et al. Cytotoxicity of phenol red in toxicity assays for carbon nanoparticles. Int J Mol Sci. 26, 2012;13(10):12336–12348. | |
Wu L, Luderer M, Yang X, et al. Surface passivation of carbon nanoparticles with branched macromolecules influences near infrared bioimaging. Theranostics. 2013;3(9):677–686. | |
Oh WK, Yoon H, Jang J. Size control of magnetic carbon nanoparticles for drug delivery. Biomaterials. 2010;31(6):1342–1348. | |
Xie J, Lee S, Chen X. Nanoparticle-based theranostic agents. Adv Drug Deliv Rev. 2010;62(11):1064–1079. | |
Muthukumar T, Prabhavathi S, Chamundeeswari M, Sastry TP. Bio-modified carbon nanoparticles loaded with methotrexate possible carrier for anticancer drug delivery. Mater Sci Eng C Mater Biol Appl. 2014;36:14–19. | |
Lau BW, Yan A, Weissman BS, et al. Biocompatible, hydrophilic, supramolecular carbon nanopowders for cell delivery. Lung Cancer. 2006;54(S1):S55–S56. | |
Parihar S, Sharon M, Sharon M. Carbon nanomaterial shows drug delivery promise: Part 1 – Selection of carbon nanomaterial and drug loading. Synth React Inorg Met-Org. 2006;36:107–113. | |
Shi NQ, Lei YS, Song LM, Yao J, Zhang XB, Wang XL. Impact of amorphous and semicrystalline polymers on the dissolution and crystallization inhibition of pioglitazone solid dispersions. Powder Technol. 2013;247:211–221. | |
Zhang Y, Wang H, Li C, et al. A Novel Three-Dimensional Large-Pore Mesoporous Carbon Matrix as a Potential Nanovehicle for the Fast Release of the Poorly Water-soluble Drug, Celecoxib. Pharm Res. 2014;31(4):1059–1070. | |
Zhao P, Wang L, Sun C, et al. Uniform mesoporous carbon as a carrier for poorly water soluble drug and its cytotoxicity study. Eur J Pharm Biopharm. 2012;80(3):535–543. | |
Zhang J, Huang Y, Liu D, Gao Y, Qian S. Preparation of apigenin nanocrystals using supercritical antisolvent process for dissolution and bioavailability enhancement. Eur J Pharm Sci. 2013;48(4–5):740–747. | |
Marasini N, Tran TH, Poudel BK, et al. Fabrication and evaluation of pH-modulated solid dispersion for telmisartan by spray-drying technique. Int J Pharm. 2013;441(1–2):424–432. | |
Ford JL, Rubinstein MH. Formulation and ageing of tablets prepared from indomethacin-polyethylene glycol 6000 solid dispersions. Pharm Acta Helv. 1980;55(1):1–7. | |
Guedes FL, de Oliveira BG, Hernandes MZ, et al. Solid dispersions of imidazolidinedione by PEG and PVP polymers with potential antischistosomal activities. AAPS PharmSciTech. 2011;12(1):401–410. |
 © 2014 The Author(s). This work is published and licensed by Dove Medical Press Limited. The full terms of this license are available at https://www.dovepress.com/terms.php and incorporate the Creative Commons Attribution - Non Commercial (unported, v3.0) License.
By accessing the work you hereby accept the Terms. Non-commercial uses of the work are permitted without any further permission from Dove Medical Press Limited, provided the work is properly attributed. For permission for commercial use of this work, please see paragraphs 4.2 and 5 of our Terms.
© 2014 The Author(s). This work is published and licensed by Dove Medical Press Limited. The full terms of this license are available at https://www.dovepress.com/terms.php and incorporate the Creative Commons Attribution - Non Commercial (unported, v3.0) License.
By accessing the work you hereby accept the Terms. Non-commercial uses of the work are permitted without any further permission from Dove Medical Press Limited, provided the work is properly attributed. For permission for commercial use of this work, please see paragraphs 4.2 and 5 of our Terms.