")
Back to Journals » International Journal of Nanomedicine » Volume 9 » Issue 1
Elucidating the role of free polycationic chains in polycation gene carriers by free chains of polyethylenimine or N,N,N-trimethyl chitosan plus a certain polyplex
Authors Xu T, Liu W, Wang S, Shao Z
Received 18 March 2014
Accepted for publication 5 May 2014
Published 3 July 2014 Volume 2014:9(1) Pages 3231—3245
DOI https://doi.org/10.2147/IJN.S64308
Checked for plagiarism Yes
Review by Single anonymous peer review
Peer reviewer comments 6
Tao Xu,1 Wei Liu,2 Suhang Wang,1 Zhengzhong Shao1
1State Key Laboratory of Molecular Engineering of Polymer, Advanced Materials Laboratory, Department of Macromolecular Science, 2Laboratory for Reproductive Immunology, Hospital and Institute of Obstetrics and Gynecology, Fudan University, Shanghai, People’s Republic of China
Abstract: Polycations as gene carriers have attracted considerable attention over the past decade. Generally, polyplexes between polycations and deoxyribonucleic acid (DNA) are formed at low N/P ratios (the ratios of the numbers of nitrogen atoms in a polycation to the numbers of phosphorus atoms in DNA), but high transfection efficiency can only be obtained at much higher N/P ratios. Thus, many polycationic chains are still free in solution. In this study, we investigated the detailed functions of free polyethylenimine chains (PEI-F) and free N,N,N-trimethyl chitosan chains (TMC-F) using the same polyplex, ie, TMC polyplex (TMC-P), which has high stability in Dulbecco’s Modified Eagle’s Medium (DMEM). Meanwhile, PEI polyplex (PEI-P)/PEI-F was also evaluated rather than PEI-P/TMC-F because the stability of PEI-P is low in DMEM and, in the latter case, the TMC-F may replace the bound PEI chain in PEI-P to form TMC-P. The transfection results show that both TMC-F and PEI-F can significantly increase the transfection efficiency of TMC-P; however, PEI-F can upregulate the gene expression of TMC-P more efficiently than TMC-F. Further investigations on the endocytosis and intracellular trafficking show that PEI-P/PEI-F, TMC-P/PEI-F, and TMC-P/TMC-F exhibit similar cellular uptake efficiency. However, by shutting down the clathrin-mediated endocytosis or vacuolar proton pump, the transfection efficiency decreases in the order of PEI-P/PEI-F > TMC-P/PEI-F > TMC-P/TMC-F. These findings indicate that PEI-F and TMC-F may promote the transfection efficiency of the polyplex by affecting its cellular uptake pathway and intracellular trafficking.
Keywords: cellular uptake pathway, intracellular trafficking, gene delivery, transfection efficiency, mechanism
Introduction
Numerous polycations have been prepared and used as gene carriers over the last two decades.1,2 Polycations usually involve synthetic polymers, such as polyethylenimine (PEI)3 and polylysine,4 and naturally derived polymers, such as chitosan and its derivatives.5 The positively charged polycations can form complexes (known as polyplexes) with the negatively charged deoxyribonucleic acid (DNA) by electrostatic interaction. Consequently, DNA can be protected from nuclease degradation and delivered to the targets. The positive charge of a polycation is generally derived from amines in its molecular structure. Therefore, the N/P ratio (the ratio of the number of nitrogen atoms in a polycation to the number of phosphorus atoms in DNA) is commonly used to represent the ratio between a polycation and DNA.
Most previous reports have focused on the preparation of polycations with high transfection efficiency. However, the mechanism of polycation gene carriers remains unclear, and the transfection efficiency of polycations is still much lower than that of the recombinant virus.6 Therefore, fundamental understanding of the mechanism is of utmost importance. The N/P ratio can influence the transfection efficiency. Generally, polyplexes can be formed between polycations and DNA at relatively low N/P ratios, whereas high N/P ratios are required to improve the transfection efficiency.7–9 Thus, excess polycationic chains are unbound from polyplexes and remain free in solution10,11 facilitating efficient gene transfection.12,13
Several recent studies investigated the detailed functions of free polycationic chains. Free PEI chains (PEI-F) increase the cellular uptake rate of polyplexes14,15 and possibly affect their intracellular trafficking by preventing the development of late endosomes and by facilitating the subsequent release of polyplexes from the endolysosome.16 Free chitosan chains may mediate enhanced transfection efficiency by promoting the release of polyplexes from the endolysosome.17 Moreover, excess polycationic chains increase the cytotoxicity18 and influence the stability of polyplexes.19,20 With regard to free polycationic chains, two aspects should be considered. One is that most free chains result from unbound chains during polyplex preparation. Some of these chains possibly result from the dissociation of polyplexes during intracellular trafficking, particularly in cases with low stability. The other is that the use of the same polycation and its corresponding polyplex as research models may result in difficulties to reveal the different roles played by free polycationic chain and polyplex. PEI/DNA polyplex (PEI-P) shows low colloidal stability,21 and the DNA in PEI-P can be easily displaced by heparin.22 Chitosan has poor solubility at neutral pH, which translates into colloidally unstable polyplexes5 and triggers the sedimentation of free chitosan chains under physiological conditions. Therefore, a stable polyplex is required to understand the mechanism of polycation gene carriers.
We previously reported that a stable polyplex can be formed by long-chain N,N,N-trimethyl chitosan (TMC) and plasmid DNA (pDNA), which can retain the particle size in Dulbecco’s Modified Eagle’s Medium (DMEM) and protect DNA from substitution by the negatively charged heparin.23 The present study aims to determine the effects of different free chains on the transfection performance of the same polyplex using the polycationic transgene systems of TMC/pDNA polyplex (TMC-P)/PEI-F and TMC-P/free TMC chain (TMC-F), as well as investigate the detailed functions of free polycationic chains on the transfection mechanism.
Materials and methods
Materials
PEI 25 k (branched, with average Mw and Mn of approximately 25 kDa and 10 kDa, respectively), chlorpromazine hydrochloride, methyl-β-cyclodextrin, filipin III obtained from Streptomyces filipinensis, genistein, and nocodazole were purchased from Sigma-Aldrich Co. LLC (St Louis, MO, USA). Bafilomycin A1 and fluorescein isothiocyanate (FITC) were purchased from J&K Scientific Co., Ltd (Beijing, People’s Republic of China) and Aladdine Reagent Co. (Shanghai, People’s Republic of China), respectively. O-Methyl-free TMC (Mw =67 kDa, degree of N,N,N-trimethylation =89%) was synthesized from completely deacetylated chitosan as stated in our previous report.23 Hoechst 33342 and Cell Counting Kit 8 were purchased from Dojindo Laboratories, Tokyo, Japan. Label IT tracker™ intracellular nucleic acid localization kits (Cy3 and Cy5) were from Mirus Bio LLC (Madison, WI, USA). PicoGreen® reagent, LysoTracker® (green DND-26 and red DND-99) Probes labeling kit, ER-Tracker™ dye for live-cell endoplasmic reticulum labeling kit, Gibco® fetal bovine serum (FBS), and Gibco® DMEM were supplied by Invitrogen (Waltham, MA, USA). Hank’s Balanced Salt Solution (with calcium and magnesium) was purchased from Beyotime Institute of Biotechnology (Haimen, Jiangsu, People’s Republic of China). Other reagents were commercially available and used without further purification. Plasmid luciferase and EGFP were amplified in Escherichia coli and purified by Plasmid ezFilter maxi kits (Biomiga, Santiago, California, USA). COS-7 cell was from the cell bank of Chinese Academy of Sciences (Shanghai, People’s Republic of China), and cultured at 37°C, 5% CO2 in DMEM supplemented with 10% fetal bovine serum, 100 U/mL penicillin, and 100 μg/mL streptomycin.
Preparation of FITC-PEI
FITC-labeled PEI (FITC-PEI) was synthesized according to a method reported previously.24 Briefly, 100 mg PEI was dissolved in 20 mL of 0.1 M sodium hydrogen carbonate (pH ~8.2), and then FITC (10 mg in 2 mL water-free DMSO) was added dropwise while stirring. The reaction was carried out for 4 hours in the dark at room temperature. Afterwards, the solution was dialyzed (molecular weight cut off =3500; Viskase Co., Darien, IL, USA) against water for 3 days by changing the water thrice daily. At last, the solution was lyophilized to obtain FITC-PEI.
Preparation of polyplexes
Polyplexes were formed by adding an equal volume (200 μL) of polycations to pDNA solution (50 μg/mL), and then the dispersion was mixed by vortex immediately for 15 seconds. The polyplexes were incubated for at least 30 minutes at room temperature prior to other experiments. The polyplex is expressed as polycation-P (N/P ratio), eg, TMC-P1.5 means TMC/pDNA polyplex prepared at N/P = 1.5, while the free polycationic chain is expression as polycation-F (portion of free chain), eg, PEI-F10 means the portion of free PEI chain is 10.
PicoGreen fluorescence quenching assay
pDNA was labeled with PicoGreen dye according to the protocol. The final DNA concentration is 2 μg/mL. After incubation for 2 minutes at room temperature, polycations with various N/P ratios were added and mixed with pDNA by vortex immediately after, for 15 seconds. After incubation for another 3 minutes, the fluorescence intensity was evaluated using a fluorescence spectrophotometer (RF-5301PC; Shimadz, Kyoto, Japan). The fraction of the uncomplexed DNA was calculated by the following equation: Uncomplexed DNA% = (Fpolyplex−Fblank)/(Finitial DNA−Fblank).
Colloidal stability of polyplexes
The colloidal stability of polyplexes was investigated by the particle size versus time in DMEM. Briefly, 800 μL serum-free DMEM was added to 200 μL polyplexes (containing 5 μg pDNA), and then the particle sizes at various time points were evaluated using a Zetasizer Nano instrument (Malvern Instruments, Malvern, UK) equipped with a dynamic light scattering (DLS) (He-Ne laser, 633 nm wavelength). The particle size was analyzed using the Stokes–Einstein equation.
Gene expression
For EGFP expression, COS-7 cells were seeded on 6-well plates at 2×10⁵ cells/well and transfected the next day at 70%–80% confluency. Prior to transfection, the culture media was removed and cells were washed twice by serum-free DMEM. Afterwards, 2 mL serum-free DMEM containing test polyplexes was added (4 μg pDNA/well). At 4 hours posttransfection, the transfection media were removed, and then the wells were refilled with 2 mL serum-containing media. At 48 hours posttransfection, the cells were imaged using an IX71 fluorescence inverted microscope (Olympus Corporation, Tokyo, Japan).
For luciferase expression, cells were seeded on 24-well plates at 5×10⁴ cells/well and transfected the next day at 70%–80% confluency. Next, the cells were washed twice by 400 μL serum-free DMEM, followed by addition of 400 μL DMEM containing polyplexes (1 μg pDNA/well). At 4 hours post-transfection, the transfection media were replaced by 800 μL serum-containing DMEM. At specific time points posttransfection, the cells were treated with cell lysis buffer after rinsing with PBS twice, followed by evaluation of luciferase expression (Promega Corporation, Fitchburg, WI, USA) and the content of protein (BCA method; Biomega) according to the protocols. For the cells evaluated at time points longer than 48 hours, the cell culture media were replaced by 800 μL fresh serum-containing DMEM at 48 hours. The luciferase expression was expressed as relative light unit per milligram of luciferase protein (RLU/mg).
Cellular uptake efficiency
Plasmid luciferase was labeled using a Cy5 Label kit according to the protocol. The process of transfection was the same as above. COS-7 cells were seeded in 24-well plates and Cy5-pDNA polyplexes were used at 1 μg pDNA/well. At various time points posttransfection, the transfection media were removed, followed by washing twice with PBS containing 0.001% sodium dodecyl sulfate (SDS) to remove the polyplexes remaining outside of the cells.25 Afterwards, the cells were detached using trypsin/EDTA, washed twice by PBS containing 0.001% SDS and then once with only PBS. Lastly, the suspensions of cells were measured on a flow cytometer (FCM; BD FACSCalibur™, BD Biosciences, San Jose, CA, USA), and 10,000 viable cells were evaluated in each experiment.
Colocalization by LSCM
Colocalization between polyplex/free polycationic chains and organelles in COS-7 cells was investigated using a laser scanning confocal microscope (LSCM). Plasmid luciferase was labeled using a Cy3 Label kit according to the protocol. Cells were seeded on a 35-mm glass bottom culture dish (NEST, Shanghai, People’s Republic of China) at 1×10⁵ cells/well. At ~50% cell confluence, the cell culture media were replaced by serum-free DMEM. Afterward, other experiments were carried out in serum-free DMEM. The time point of adding the polyplexes was defined as 0 hours. The cells were washed by PBS containing 0.001% SDS several times before imaging. For colocalization between PEI-F and polyplex, FITC-PEI-F10 was added at −4 hours and removed at 0 hours, while Cy3-pDNA polyplexes (2 μg pDNA/well) were added at 0 hours and removed at 1 hour. For colocalization between PEI-F and lysosome, lysotracker (red) was used to label the lysosome according to the protocol. For colocalization between polyplex and lysosome, 100 μL Hoechst 33342 solution (50 μmol/L) was added at −20 minutes and removed at 0 hours. Then 2 mL serum-free DMEM containing Cy3-pDNA polyplexes (2 μg pDNA/well) was added. At 0.5 hours, lysotracker (green) was added according to the protocol. At 1 hour, the media were removed, and the cells were imaged. For colocalization between polyplex and endoplasmic reticulum (ER), a similar method was used as above. At 40 minutes postaddition of Cy3-pDNA polyplexes, the media were replaced with 2 mL prewarmed Hank’s Balanced Salt Solution (Beyotime Institute of Biotechnology) containing ER-Tracker Green (1 μM) (Invitrogen). At 1 hour, the staining solution was removed, and the cells were imaged.
Transfection efficiency in the presence of various inhibitors
The working concentration of inhibitors, which were reported efficient previously, were as follows: chlorpromazine, 10 μg/mL; methyl-β-cyclodextrin, 5 mM; filipin, 0.7 μg/mL; genistein, 200 μM; and nocodazole, 7.5 μg/mL.26,27 COS-7 cells were seeded in 24-well plates at 5×10⁴ cells/well. At 70%–80% cell confluence, the cells were washed twice with serum-free DMEM, and then replenished with 400 μL serum-free DMEM containing inhibitors (deemed as −1 hour). The cells without addition of inhibitors were used as controls. At 0 hours, polyplexes (1 μg pDNA/well) were added, followed by culture for 2 hours in the presence of inhibitors. At 2 hours, the media were replaced with 400 μL serum-containing DMEM. At 24 hours, the expression of luciferase and the content of protein were measured. The transfection in the presence of various concentrations of bafilomycin was carried out according to a previous report28 in 24-well plates, and the results were evaluated at 48 hours posttransfection.
Results
Properties of polyplexes
The binding affinity between TMC and pDNA was quantitatively evaluated by a PicoGreen fluorescence quenching assay. The fluorescence intensity of PicoGreen can dramatically increase after its binding to DNA. The formation of a polyplex between TMC and DNA excludes the PicoGreen molecules from the DNA double helix; as a result, the fluorescence intensity decreases. Figure 1A shows that more than 95% DNA has been condensed to polyplexes at N/P ≥1.2, indicating that TMC-F chains may exist in solutions with high N/P ratios. The minimum N/P ratio required to completely neutralize the negatively charged DNA can also be estimated. In all, 89% of the amino groups are N,N,N-trimethylated, and the other amino groups are N,N-dimethylated. This indicates that one structural repeating unit of TMC has 0.89 positive charge under weak basic conditions because the N,N-dimethylated amino groups are uncharged. To neutralize one negative charge by one positive charge, at least 1.12 structural repeating units of TMC are required. Thus, the minimum N/P ratio is ~1.12, which agrees with the obtained results.
 | Figure 1 Properties of TMC-Ps. (A) Binding affinity between TMC and pDNA by PicoGreen fluorescence quenching assay. (B) Luciferase expression of TMC-Ps. (C) Stability of TMC-P5, TMC-P1.5/PEI-F10, and PEI-P10 in DMEM. |
The luciferase expression mediated by TMC-Ps was investigated in COS-7 cells (Figure 1B). Generally, the transfection efficiency increases as the N/P ratio increases. The optimal N/P ratios range from approximately 4 to 6, which are higher than the minimum N/P ratio required to completely condense DNA. Thus, a great number of TMC-F chains exist in the solution. For example, TMC-P5 is composed of 1.2 portions of bound TMC to pDNA and 3.8 portions of free TMC chains. At the optimal N/P ratios of TMC-Ps, the transfection efficiency is lower than that of PEI-P10. The specific evaluation of the transfection efficiency at N/P ratios in the range of 1 to 2 shows that the gene expression increases as the N/P ratio increases, except at N/P =1.2, in which the transfection efficiency is lower than that at N/P =1.1 and 1.3. This finding is probably caused by the aggregation of polyplexes with low net charges. Thus, in most subsequent studies, a relatively high N/P ratio for TMC-P (ie, TMC-P1.5) is used rather than TMC-P1.2 to compose a transgene system with PEI-F10 (ie, TMC-P1.5/PEI-F10). For PEI, its minimum N/P ratio to completely condense pDNA into polyplexes is ~3, and the optimal N/P ratio in serum-free DMEM is ~10,14 which indicates that PEI-P10 is composed of three portions of bound PEI to pDNA and seven portions of PEI-F chains.
The particle size of the polyplexes versus time was evaluated in DMEM by DLS. Figure 1C shows that the particle size of TMC-P/TMC-F (ie, TMC-P5) and TMC-P/PEI-F (ie, TMC-P1.5/PEI-F10) remains unchanged with time, indicating a good colloidal stability. In contrast, PEI-P/PEI-F (ie, PEI-P10) exhibits poor colloidal stability because the particle size of PEI-P10 significantly increases with time. This result agrees with those of previous reports.21,23 Moreover, the stability of the polyplexes was tested by heparin displacement (Figure S1). The pDNA in PEI-P3 and PEI-P10 can be displaced by 0.1 and 0.5 U heparin, respectively. However, the pDNA in TMC-P1.5 is stable even in the presence of 50 U heparin, which is in accordance with their colloidal stability in DMEM. In our previous report,23 the incubation of TMC-P5 in DMEM prior to transfection shows a negligible effect on the terminal transfection efficiency. By contrast, the incubation of PEI-P10 in DMEM prior to transfection evidently decreases the transfection efficiency (Figure S2). This result can be attributed to the swelling/aggregation of the polyplexes. Thus, TMC-P has better stability and is more suitable than PEI-P for investigating the development of polycation gene carriers.
Gene expression of polyplexes in the presence of free polycations
To investigate the effect of free polycationic chains on the transfection efficiency of the polyplexes, various portions of PEI-F chains and TMC-P were added simultaneously to the cells. As a result, the luciferase (Figure 2A) and EGFP expression (Figure S3) in COS-7 cells are essentially increased in the presence of PEI-F chains, and the transfection efficiency increases as the portion of PEI-F chains increases. Although the transfection efficiency of TMC-P/PEI-F is lower than that of PEI-P10, the efficiency is higher than that of TMC-P5 when the portion of PEI-F is increased. Given that a polycation gene carrier is regarded as a kind of drug, the transgene systems should be compared at the optimal transfection efficiencies. Thus, these results indicate that PEI-F chains may be more efficient than TMC-F chains. A similar result is also observed in HepG2 cells (Figure S4). Moreover, the addition of PEI-F chains (added at -4 hours and removed at 0 hours) before the addition of TMC-Ps (added at 0 hours and removed at 4 hours) in COS-7 cells shows that transfection efficiency of TMC-P1.2, TMC-P1.5, and TMC-P2 is evidently increased (Figure S5). This finding suggests that the addition of free polycationic chains prior to the polyplexes also increases their transfection efficiency, in good accordance with previous studies.14,23 The transfection efficiency of TMC-P3, TMC-P4, and TMC-P5 has no further increase under the same conditions, which may be attributed to increased cytotoxicity. In addition, the evaluation of the transfection efficiency at various time points after transfection shows that the highest is at 72 hours for TMC-P5 and at 48 hours for TMC-P1.5/PEI-F10 and PEI-P10 (Figure 2B). This result indicates that PEI-F can promote a relatively quick gene expression in comparison with TMC-F.
 | Figure 2 Luciferase expression of TMC-P/PEI-F in COS-7 cells at 48 hours (h) (A) or at various time points post-transfection (B) in COS-7 cell. |
Cellular uptake efficiency and colocalization by LSCM
The cellular uptake efficiency of the polyplexes was evaluated by FCM. After the endocytosis of Cy5-labeled pDNA polyplexes for 2 and 4 hours, the fluorescence intensity was tested. Figure 3 shows similar fluorescence intensities among TMC-P5, TMC-P1.5/PEI-F10, and PEI-P10. This result implies that these transfection systems have similar cellular uptake efficiency and that TMC-F have a similar effect to PEI-F. Moreover, in the presence of chlorpromazine (an inhibitor of clathrin-mediated endocytosis [CME]26), the cellular uptake efficiency decreases in the three cases, and TMC-P5 and TMC-P1.5/PEI-F10 exhibit similarly lower decreases than PEI-P10 (Figure S6).
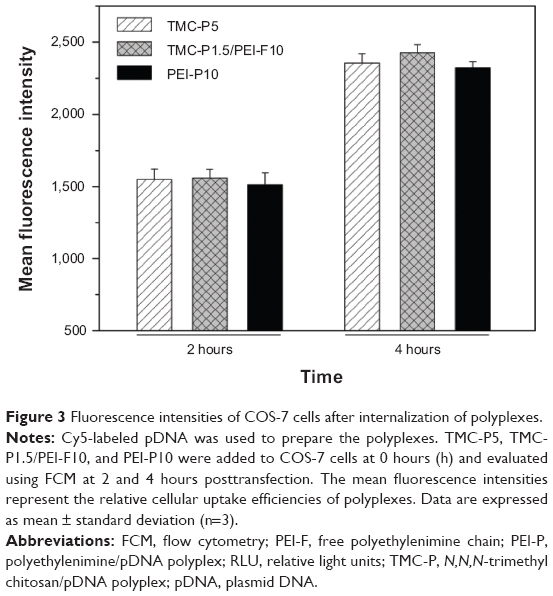 | Figure 3 Fluorescence intensities of COS-7 cells after internalization of polyplexes. |
To further investigate the function of free polycationic chains, free FITC-PEI chains were added to the cells (added at −4 hours and removed at 0 hours) prior to the addition of the Cy3-labeled DNA polyplexes (added at 0 hours and removed at 1 hour). Figure 4 shows that the free FITC-PEI chains can be internalized by and accumulated in cells. After the cellular uptake of the Cy3-pDNA polyplexes, some are colocalized with the PEI-F. Further colocalization between the PEI-F and lysosome shows that a fraction of these chains accumulate in this organelle (Figure 5). Moreover, imaging using LSCM demonstrates that a part of the polyplexes can be colocalized with the lysosome or endoplasmic reticulum (ER) in the case of TMC-P1.5/PEI-F10 (Figure 6). Similar results are also observed in TMC-P5 and PEI-P10 (Figure S7). These results imply that the polyplexes are transported to these organelles regardless of the type of free chains.
 | Figure 4 Colocalization of PEI-F with polyplexes by LSCM. |
 | Figure 5 Colocalization of PEI-F with the lysosome by LSCM. |
 | Figure 6 Colocalization of TMC-P1.5/PEI-F10 with the (A) lysosome or (B) ER by LSCM. |
Transfection efficiency in the presence of various inhibitors
Luciferase expression was evaluated in the presence of various inhibitors to determine the differences among TMC-P/TMC-F, TMC-P/PEI-F, and PEI-P/PEI-F in terms of cellular uptake pathway and intracellular trafficking. The inhibitors of cellular uptake pathways include chlorpromazine, methyl-β-cyclodextrin (an inhibitor of lipid-raft mediated endocytosis [LME]),26 filipin (an inhibitor of caveolae-mediated endocytosis [CvME]),26 and genistein (a CvME inhibitor).27 The inhibitors of intracellular trafficking include bafilomycin (an inhibitor of vacuolar proton pump)28 and nocodazole (an inhibitor of microtubule formation).29 In order to exclude the effect of inhibitors on cytotoxicity, the cell viability in the presence of polyplexes plus inhibitors was evaluated under the same conditions. As a result, similar cytotoxicity is observed among the cases of TMC-P5, TMC-P1.5/PEI-F10, and PEI-P10 (Figure S8), whereas the gene expressions are quite different. Chlorpromazine shows no inhibitory effect on TMC-P5, strong inhibitory effect on PEI-P10 (>90%), and moderate inhibitory effect on TMC-P1.5/PEI-F10 (~45%) (Figure 7). In contrast, other inhibitors of the cellular uptake pathways show strong inhibitory effects. In the presence of nocodazole, the transfection efficiency of the three transfection systems is significantly inhibited to similar degrees. However, in the presence of bafilomycin (Figure 8), the transfection efficiency decreases in the order of PEI-P10 > TMC-P1.5/PEI-F10 > TMC-P5. These results suggest that PEI-F and TMC chains have different effects on the cellular uptake pathway and intracellular trafficking of the polyplexes.
 | Figure 7 Relative luciferase expression in the presence of various inhibitors. |
 | Figure 8 Inhibitory effect of Baf on luciferase expression. |
Discussion
In commonly used polycation gene carriers, only a portion of polycationic chains form polyplexes can condense and protect DNA, whereas others are unbound to DNA and are still free in solution. PEI14–16 and chitosan17 have been used in previous studies to explore the functions of free polycationic chains, and the results have shown that the unbound chains in the solution facilitate efficient gene transfection. However, the polyplexes based on PEI and chitosan usually have poor colloidal stability5,21 and may form large aggregates under physiological conditions.30,31 The free polycationic chains are probably involved in the aggregates because of their influence in the stability of polyplexes; for example, PEI-F chains in the solution produce a long-ranged attractive force between two PEI-coated particles.20 Thus, polyplexes with high colloidal stability are required to better understand the functions of free polycationic chains. In our previous report,23 a polyplex from long-chain TMC shows superior stability in DMEM. Thus, the TMC67k/pDNA polyplex is chosen to investigate the functions of free polycationic chains. As expected, TMC-P/TMC-F and TMC-P/PEI-F show higher colloidal stability than PEI-P/PEI-F in DMEM (Figure 1C). Moreover, TMC-P can resist the replacement of heparin better than PEI-P (Figure S1). Thus, TMC-P is more stable than PEI-P and is more suitable for investigating the intracellular functions of free polycationic chains. In the present study, the three transgene systems used to investigate the function of free chains are TMC-P/TMC-F (ie, TMC-P5), TMC-P/PEI-F, and PEI-P/PEI-F (ie, PEI-P10). PEI-P/TMC-F is not selected because the binding affinity between TMC and pDNA is much stronger than that between PEI and pDNA,23 and, therefore, the bound PEI chain in PEI-P is highly possible to be replaced by free TMC chain in solution to form a more stable TMC-P. In the following discussion, we mainly focus on the differences between TMC-P/TMC-F and TMC-P/PEI-F to explore the different functions between TMC-F and PEI-F.
In the presence of PEI-F, the transfection efficiency of TMC-P is significantly improved for both the expression of EGFP and luciferase (Figures 2A, S3, and S4). At high portions of PEI-F, the transfection efficiency of TMC-P/PEI-F is even better than that of TMC-P/TMC-F at the optimal N/P ratio, indicating that PEI-F functions better than TMC-F. Moreover, PEI-F can accelerate the gene expression rate of TMC-P in comparison with TMC-F (Figure 2B), which also suggests that PEI-F is superior to TMC-F. Because the addition of PEI-Fs to TMC-P does not lead to a change of its particle size (Figure 1C) and zeta-potential (Figure S9), free polycationic chains may not function by affecting these factors. Interestingly, in later studies, the free polycationic chains added prior to the addition of polyplexes were also found to promote their transfection efficiency (Figure S5) and accumulate intracellularly (Figure 5). The differences between PEI-F and TMC-F are possibly due to their different intracellular functions.
Free polycationic chains increase the cellular uptake efficiency of polyplexes.16 In the present study, TMC-P/TMC-F and TMC-P/PEI-F have similar cellular uptake efficiency (Figure 3). Therefore, the cellular uptake efficiency is not a key factor in the difference between TMC-F and PEI-F. Moreover, the cellular uptake pathway and intracellular trafficking are studied. Generally, polyplexes are internalized by cells through pinocytosis in nonphagocytes; this process involves CME and clathrin-independent endocytosis (CvME, macropinocytosis, and caveolae-/clathrin-independent endocytosis).32 In another classification of endocytic pathways based on the membrane regions, CME and CvME occur in nonlipid-raft and lipid-raft membrane domains, respectively.33 Thus, CvME is also a type of LME. In the literature, CME and CvME are commonly investigated for the cellular uptake pathway of polyplexes.34,35 After cellular uptake through CME, clathrin-coated vesicles are formed, which mature into early endosomes (pH 6.1–6.8), then into late endosomes (pH 4.8–6), and finally into lysosomes (pH ~4.5).32,33,36 The vesicles are acidified by proton pumps during the maturation process, and the trapped polyplexes in the lysosome that failed to escape are finally degraded. In previous reports,37,38 PEI and other polycation gene carriers with fine buffering capacity are believed to escape from the endolysosome by the “proton sponge” mechanism. In this mechanism, the buffering capacity of polycations leads to osmotic swelling and rupture of the endolysosome, causing the release of polyplexes into the cytoplasm. However, this hypothesis is challenged in some reports, and free polycationic chains are believed to be important for the escape of polyplexes from the endolysosome.16,17,39 As an alternative cellular uptake pathway, the particles internalized through CvME possibly bypass the lysosome.32,40
In the present study, the polyplexes are similarly colocalized with the lysosome and ER in TMC-P/TMC-F, TMC-P/PEI-F, and PEI-P/PEI-F (Figures 6 and S7), suggesting that both CME and CvME are involved in their internalization. However, this finding does not indicate that the polyplexes are equally utilized after endocytosis because their terminal transfection efficiency rates are different. To explore these differences, the cellular uptake pathways were examined based on luciferase expression in the presence of various inhibitors (Figure 7). The efficient luciferase expression of TMC-P/TMC-F, TMC-P/PEI-F, and PEI-P/PEI-F similarly depends on CvME. By contrast, their dependence on CME is significantly different. PEI-P/PEI-F shows strong dependence on CME, in agreement with previous studies.41,42 Meanwhile, TMC-P/TMC-F shows no dependence, and TMC-P/PEI-F shows moderate dependence. These differences can be explained by the following: 1) that free polycationic chains influence the cellular uptake pathway of TMC-P and more TMC-Ps are internalized through CME for TMC-P/PEI-F than for TMC-P/TMC-F, and/or 2) that PEI-F can promote the release of TMC-P from the endolysosome better than TMC-F. Moreover, the cellular uptake efficiency was evaluated in the presence of chlorpromazine, a CME inhibitor (Figure S6). Compared with PEI-P/PEI-F, TMC-P/TMC-F, and TMC-P/PEI-F show similarly lower dependence on CME, indicating that CME is used for endocytosis in all three cases. The trend of inhibitory effect on the transfection efficiency is different from that on the cellular uptake efficiency because the cellular uptake pathways are possibly interchangeable.41 The transfection efficiency is also related to intracellular trafficking, unlike the cellular uptake efficiency.
To further address the intracellular trafficking of polyplexes, fluorescent labels were used to image the cells by LSCM. As a result, any two of the three items, ie, free polycationic chain, polyplex, and lysosome, can be colocalized (Figures 4–6 and S7). This finding indicates that the internalized free chains possibly influence the intracellular fate of the polyplexes. In addition, the luciferase expression was evaluated in the presence of bafilomycin. Figure 8 shows that the transfection efficiency of PEI-P/PEI-F is apparently inhibited, which is in accordance with previous reports.16,28 Meanwhile, TMC-P/TMC-F is slightly inhibited, and TMC-P/PEI-F is moderately inhibited. Although the proton sponge mechanism can be used to explain these results because the buffering capacity of PEI is considerably higher than that of TMC,23 this mechanism does not predominantly result in the release of polyplexes from the endolysosome because the buffering capacity of PEI has no effect on lysosomal pH.39 The release of polyplexes can be attributed to the fact that the free polycationic chains interact with the negatively charged proteins in the organelle membrane by electrostatic interaction, thereby destabilizing the endolysosome and triggering the release of polyplexes.16,43 This electrostatic interaction is nonspecific. Thus, the free polycationic chains can interact with the proteins in the membrane of the early endosomes, late endosomes, lysosomes, or other organelles. In the presence of bafilomycin, the proton pumps on the endolysosome are inhibited. Therefore, less early endosomes can mature into late endosomes and lysosomes. The decreased number of endolysosomes containing polyplexes may finally reduce the transfection efficiency. Moreover, PEI-F can trigger the escape of the polyplexes from the endolysosome better than TMC-F because in the presence of bafilomycin, the transfection efficiency of TMC-P/PEI-F decreases to a greater extent than that of TMC-P/TMC-F. Interestingly, the transfection efficiency of TMC-P/PEI-F is higher than that of TMC-P/TMC-F but lower in the presence of bafilomycin, indicating that more polyplexes may be trapped in the endosome in the former case. These findings, combined with the results in Figure 7, lead to the conclusion that free polycationic chains affect the cellular uptake pathway and intracellular trafficking of polyplexes.
Polyplexes internalized by cells through CvME may bypass the lysosome and possibly transfer to the ER.40 In this study, the three transgene systems use CvME as a productive cellular uptake pathway. However, the delivery mechanism of the polyplexes from the ER to the nucleus remains unknown. After the escape of the CME-internalized polyplexes from the endolysosome into the cytoplasm, the detailed delivery mechanism to the nucleus remains unclear. A previous report44 revealed that polycations promote gene delivery from the cytoplasm to the nucleus. This study also reported that the complexation between a polycation and DNA does not prevent the gene expression in the nucleus. In the present study, the transfection efficiency in the three cases decreases in the presence of nocodazole (Figure 7), an inhibitor of microtubule formation.29 This indicates that the intracellular migration of polyplexes may be associated with microtubule-based motors. In combination with these results, the intracellular trafficking of polyplexes is possibly composed of a series of energy-dependent processes that are active transports rather than passive transports. Free polycationic chains may also function in the entire process from endocytosis to gene expression in the nucleus.
Conclusion
We investigated the function of free polycationic chains by using the transgene systems of TMC-P/TMC-F, TMC-P/PEI-F, and PEI-P/PEI-F. TMC-P is more stable and is more suitable than PEI-P for investigating the intracellular functions of free polycationic chains. Compared with TMC-F, PEI-F more efficiently improves the transfection efficiency and gene expression rate of TMC-P. The advantages of PEI-F over TMC-F are not based on the cellular uptake efficiency of the polyplexes but on the capability of PEI-F to provide more polyplexes internalized by cells through CME and promote the release of polyplexes from the endolysosome more efficiently than TMC-F. The results of this research elucidate the different functions of free polycationic chains and provide insights into the development of polycation gene carriers.
Acknowledgments
The authors are thankful for the financial support from the National Natural Science Foundation of China (NSFC 21034003) and the Program of Shanghai Subject Chief Scientist (12XD1401000).
Disclosure
The authors report no conflicts of interest in this work.
References
Kang HC, Huh KM, Bae YH. Polymeric nucleic acid carriers: current issues and novel design approaches. J Control Release. 2012; 164(3):256–264. | ||
Samal SK, Dash M, Van Vlierberghe S, et al. Cationic polymers and their therapeutic potential. Chem Soc Rev. 2012;41(21):7147–7194. | ||
Lungwitz U, Breunig M, Blunk T, Göpferich A. Polyethylenimine-based non-viral gene delivery systems. Eur J Pharm Biopharm. 2005;60(2):247–266. | ||
Kadlecova Z, Rajendra Y, Matasci M, et al. DNA delivery with hyperbranched polylysine: A comparative study with linear and dendritic polylysine. J Control Release. 2013;169(3):276–288. | ||
Buschmann MD, Merzouki A, Lavertu M, Thibault M, Jean M, Darras V. Chitosans for delivery of nucleic acids. Adv Drug Deliver Rev. 2013;65(9):1234–1270. | ||
Won Y, Sharma R, Konieczny SF. Missing pieces in understanding the intracellular trafficking of polycation/DNA complexes. J Control Release. 2009;139(2):88–93. | ||
Strand SP, Lelu S, Reitan NK, de Lange Davies C, Artursson P, Vårum KM. Molecular design of chitosan gene delivery systems with an optimized balance between polyplex stability and polyplex unpacking. Biomaterials. 2010;31(5):975–987. | ||
Sun J, Zeng F, Jian H, Wu S. Grafting zwitterionic polymer chains onto PEI as a convenient strategy to enhance gene delivery performance. Polym Chem. 2013;4(24):5810–5818. | ||
Hu Y, Zhou D, Li C, et al. Gene delivery of PEI incorporating with functional block copolymer via non-covalent assembly strategy. Acta Biomaterialia. 2013;9(2):5003–5012. | ||
Ma PL, Buschmann MD, Winnik FM. One-step analysis of DNA/chitosan complexes by field-flow fractionation reveals particle size and free chitosan content. Biomacromolecules. 2010;11(3):549–554. | ||
Perevyazko IY, Bauer M, Pavlov GM, et al. Polyelectrolyte complexes of DNA and linear PEI: formation, composition and properties. Langmuir. 2012;28(46):16167–16176. | ||
Boeckle S, von Gersdorff K, van der Piepen S, et al. Purification of polyethylenimine polyplexes highlights the role of free polycations in gene transfer. J Gene Med. 2004;6(10):1102–1111. | ||
Saul JM, Wang CHK, Ng CP, Pun SH. Multilayer nanocomplexes of polymer and DNA exhibit enhanced gene delivery. Adv Mater. 2008;20(1):19–25. | ||
Yue Y, Jin F, Deng R, et al. Revisit complexation between DNA and polyethylenimine – Effect of uncomplexed chains free in the solution mixture on gene transfection. J Control Release. 2011;155(1):67–76. | ||
Dai Z, Gjetting T, Mattebjerg MA, Wu C, Andresen TL. Elucidating the interplay between DNA-condensing and free polycations in gene transfection through a mechanistic study of linear and branched PEI. Biomaterials. 2011;32(33):8626–8634. | ||
Yue Y, Jin F, Deng R, et al. Revisit complexation between DNA and polyethylenimine – Effect of length of free polycationic chains on gene transfection. J Control Release. 2011;152(1):143–151. | ||
Thibault M, Astolfi M, Tran-Khanh N, et al. Excess polycation mediates efficient chitosan-based gene transfer by promoting lysosomal release of the polyplexes. Biomaterials. 2011;32(20):4639–4646. | ||
Fahrmeir J, Gunther M, Tietze N, Wagner E, Ogris M. Electrophoretic purification of tumor-targeted polyethylenimine-based polyplexes reduces toxic side effects in vivo. J Control Release. 2007;122(3):236–245. | ||
Jones NA, Hill IRC, Stolnik S, Bignotti F, Davis SS, Garnett MC. Polymer chemical structure is a key determinant of physicochemical and colloidal properties of polymer-DNA complexes for gene delivery. Biochim Biophys Acta. 2000;1517(1):1–18. | ||
Gong X, Ngai T. Interactions between solid surfaces with preadsorbed poly(ethylenimine) (PEI) layers: effect of unadsorbed free PEI chains. Langmuir. 2013;29(20):5974–5981. | ||
Zheng M, Zhong Z, Zhou L, Meng F, Peng R, Zhong Z. Poly(ethylene oxide) grafted with short polyethylenimine gives DNA polyplexes with superior colloidal stability, low cytotoxicity, and potent in vitro gene transfection under serum conditions. Biomacromolecules. 2012;13(3):881–888. | ||
Germershaus O, Mao S, Sitterberg J, Bakowsky U, Kissel T. Gene delivery using chitosan, trimethyl chitosan or polyethylenglycol-graft-trimethyl chitosan block copolymers: Establishment of structure-activity relationships in vitro. J Control Release. 2008;125(2):145–154. | ||
Xu T, Wang S, Shao Z. Insight into polycation chain length affecting transfection efficiency by O-methyl-free N,N,N-trimethyl chitosans as gene carriers. Pharm Res. 2014;31(4):895–907. | ||
Mao S, Neu M, Germershaus O, et al. Influence of polyethylene glycol chain length on the physicochemical and biological properties of poly(ethylene imine)-graft-poly(ethylene glycol) block copolymer/SiRNA polyplexes. Bioconjugate Chem. 2006;17(5):1209–1218. | ||
Forrest ML, Pack DW. On the Kinetics of Polyplex Endocytic Trafficking: Implications for Gene Delivery Vector Design. Mol Ther. 2002;6(1):57–66. | ||
Ivanov AI. Pharmacological inhibition of endocytic pathways: is it specific enough to be useful? Methods in Molecular Biology. 2008;440: 15–33. | ||
Akiyama T, Ishida J, Nakagawa S, et al. Genistein, a specific inhibitor of tyrosine-specific protein kinases. J Biol Chem. 1987;262(12): 5592–5595. | ||
Akinc A, Thomas M, Klibanov AM, Langer R. Exploring polyethylenimine-mediated DNA transfection and the proton sponge hypothesis. J Gene Med. 2005;7(5):657–663. | ||
Peterson JR, Mitchison TJ. Small molecules, big impact: a history of chemical inhibitors and the cytoskeleton. chem biol. 2002;9(12): 1275–1285. | ||
Strand SP, Danielsen S, Christensen BE, Vårum KM. Influence of chitosan structure on the formation and stability of DNA-chitosan polyelectrolyte complexes. Biomacromolecules. 2005;6(6):3357–3366. | ||
Wightman L, Kircheis R, Rössler V, et al. Different behavior of branched and linear polyethylenimine for gene delivery in vitro and in vivo. J Gene Med. 2001;3(4):362–372. | ||
Sahay G, Alakhova DY, Kabanov AV. Endocytosis of nanomedicines. J Control Release. 2010;145(3):182–195. | ||
El-Sayed A, Harashima H. Endocytosis of gene delivery vectors: from clathrin-dependent to lipid raft-mediated endocytosis. Mol Ther. 2013;21(6):1118–1130. | ||
Khalil IA, Kogure K, Akita H, Harashima H. Uptake pathways and subsequent intracellular trafficking in nonviral gene delivery. Pharmacol Rev. 2006;58(1):32–45. | ||
Ziello JE, Huang Y, Jovin IS. Cellular endocytosis and gene delivery. Mol Med. 2010;16(5–6):222–229. | ||
Xiang S, Tong H, Shi Q, et al. Uptake mechanisms of non-viral gene delivery. J Control Release. 2012;158(3):371–378. | ||
Behr J. The proton sponge: a trick to enter cells the viruses did not exploit. CHIMIA International Journal for Chemistry. 1997;51(1–2):34–36. | ||
Boussif O, Lezoualc’H F, Zanta MA, et al. A versatile vector for gene and oligonucleotide transfer into cells in culture and in vivo: polyethylenimine. P Natl Acad Sci U S A. 1995;92(16):7297–7301. | ||
Benjaminsen RV, Mattebjerg MA, Henriksen JR, Moghimi SM, Andresen TL. The possible “proton sponge” effect of polyethylenimine (PEI) does not include change in lysosomal pH. Mol Ther. 2012; 21(1): 149–157. | ||
Reilly MJ, Larsen JD, Sullivan MO. Polyplexes traffic through caveolae to the Golgi and endoplasmic reticulum en route to the nucleus. Mol Pharm. 2012;9(5):1280–1290. | ||
Rejman J, Bragonzi A, Conese M. Role of clathrin- and caveolae-mediated endocytosis in gene transfer mediated by lipo- and polyplexes. Mol Med. 2005;12(3):468–474. | ||
von Gersdorff K, Sanders NN, Vandenbroucke R, De Smedt SC, Wagner E, Ogris M. The internalization route resulting in successful gene expression depends on both cell line and polyethylenimine polyplex type. Mol Ther. 2006;14(5):745–753. | ||
Bieber T, Meissner W, Kostin S, Niemann A, Elsasser H. Intracellular route and transcriptional competence of polyethylenimine – DNA complexes. J Control Release. 2002;82(2–3):441–454. | ||
Pollard H, Remy J, Loussouarn G, Demolombe S, Behr JP, Escande D. Polyethylenimine but not cationic lipids promotes transgene delivery to the nucleus in mammalian cells. J Biol Chem. 1998;273(13):7507–7511. |
Supplementary materials
 | Figure S1 Stability of polyplexes in the presence of heparin by gel-shift assay. |
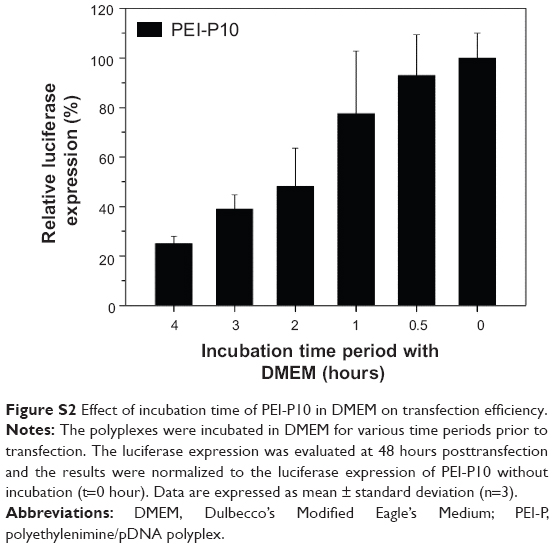 | Figure S2 Effect of incubation time of PEI-P10 in DMEM on transfection efficiency. |
 | Figure S3 EGFP expression of TMC-P/PEI-F in COS-7 cell. |
 | Figure S4 Luciferase expression of TMC-P/PEI-F in HepG2 cell. |
 | Figure S5 Luciferase expression of PEI-F added before TMC-P in COS-7 cell. |
 | Figure S6 Effect of chlorpromazine on the internalization of polyplexes in COS-7 cells. |
 | Figure S7 Colocalization of TMC-P5 and PEI-P10 with the (A) lysosome or (B) ER by LSCM. |
 | Figure S8 Cell viability in the presence of various inhibitors. |
 | Figure S9 Zeta-potentials of TMC-P/PEI-Fs. |
 © 2014 The Author(s). This work is published and licensed by Dove Medical Press Limited. The full terms of this license are available at https://www.dovepress.com/terms.php and incorporate the Creative Commons Attribution - Non Commercial (unported, v3.0) License.
By accessing the work you hereby accept the Terms. Non-commercial uses of the work are permitted without any further permission from Dove Medical Press Limited, provided the work is properly attributed. For permission for commercial use of this work, please see paragraphs 4.2 and 5 of our Terms.
© 2014 The Author(s). This work is published and licensed by Dove Medical Press Limited. The full terms of this license are available at https://www.dovepress.com/terms.php and incorporate the Creative Commons Attribution - Non Commercial (unported, v3.0) License.
By accessing the work you hereby accept the Terms. Non-commercial uses of the work are permitted without any further permission from Dove Medical Press Limited, provided the work is properly attributed. For permission for commercial use of this work, please see paragraphs 4.2 and 5 of our Terms.