")
Back to Journals » International Journal of General Medicine » Volume 14
ELTD1 Promotes Gastric Cancer Cell Proliferation, Invasion and Epithelial–Mesenchymal Transition Through MAPK/ERK Signaling by Regulating CSK
Received 24 June 2021
Accepted for publication 5 August 2021
Published 27 August 2021 Volume 2021:14 Pages 4897—4911
DOI https://doi.org/10.2147/IJGM.S325495
Checked for plagiarism Yes
Review by Single anonymous peer review
Peer reviewer comments 2
Editor who approved publication: Dr Scott Fraser
Bo Sun, Fang-Jing Zhong
Department of Surgery, Xiangya Hospital, Central South University, Changsha, Hunan, People’s Republic of China
Correspondence: Fang-Jing Zhong
Department of Surgery, Xiangya Hospital, Central South University, Changsha, Hunan, People’s Republic of China
Tel/Fax +86 0731 8432 8888
Email [email protected]
Purpose: Patients with gastric cancer (GC) often die from metastasis. However, the exact molecular mechanism underlying GC metastasis is complicated and still remains elusive. Epidermal growth factor, latrophilin and seven-transmembrane domain-containing 1 (ELTD1), has been reported to be involved in cancer metastasis, but its role in GC is still missing.
Patients and Methods: We first analyzed the expression of ELTD1 in GC using public databases (TCGA, Oncomine, and GEO) and our clinical samples. The functions of ELTD1 in GC proliferation, invasion and metastasis were determined by in vitro and in vivo experiments. The functional mechanism of ETLD1 in GC was also investigated. Finally, the association between ELTD1 expression and the overall survival of GC patients was analyzed using public databases.
Results: ELTD1 is significantly upregulated in GC tissues. Knockdown of ELTD1 inhibits GC cell proliferation, migration and invasion in vitro as well as tumor growth and metastasis in vivo, while ELTD1 overexpression obtains opposite results. Moreover, ELTD1 could promote epithelial to mesenchymal transition (EMT) in GC. Mechanistically, ELTD1 exerts its tumor-promoting effect by activating MAPK/ERK signaling. Subsequent studies demonstrated that ELTD1 could interact with C-terminal Src kinase (CSK) and inhibit its expression, which finally lead to MAPK/ERK activation. Data from TGCA and GEO both revealed that GC patients with high ELTD1 expression had poorer prognosis and the combination of ELTD1 with CSK showed better predictive performance.
Conclusion: ELTD1 plays an oncogene role in GC through MAPK/ERK signaling via inhibiting CSK, which may be a useful prognostic predictor and potential therapeutic target for GC.
Keywords: epidermal growth factor, latrophilin and seven-transmembrane domain-containing 1, EMT, C-terminal Src kinase, prognosis
Introduction
Gastric cancer (GC) is the fifth most common cancer and the third leading cause of cancer-related death worldwide.1 Early GC can be cured by endoscopic resection and may have good outcome. However, most GC patients are diagnosed at advanced stages and often develop metastases even after radical surgery.2 GC metastasis is a complex biological process involving multiple sequential steps, including metabolic changes that make chemoresistance, etc.3 Many oncogenes and/or tumor suppressors contribute to GC metastasis, but the exact molecular mechanism is still unclear, leading to no effective treatment for GC metastasis at the present time.4,5 Therefore, it is imperative to investigate the potential metastasis-associated genes, which may serve as treatment targets and prognostic factors for GC patients.
ELTD1, also known as epidermal growth factor, latrophilin and seven-transmembrane domain-containing 1, was discovered when screening genes involved in heart development and belongs to the G-protein-coupled receptor (GPCR) superfamily.6 The structure of ELTD1 protein contains a seven-transmembrane domain and an extracellular domain (including EGF-like domain, Ca2+-binding EGF-like domain, and GAIN Domain).7 Recent studies showed that the physiological role of ELTD1 is related with angiogenesis,8 cellular metabolism,9 cardiac hypertrophyin.10 Pathologically, ELTD1 protein expression is significantly higher in glioma tissues compared with normal brain tissues and anti-ELTD1 therapy can significantly decrease tumor angiogenesis.11 Except for tumor angiogenesis, ELTD1 has also been reported to increase hepatocellular carcinoma cell growth, migration, and invasion directly.12 In addition, ELTD1 could also promote glioma cell proliferation, migration and invasion in vitro and tumor growth in vivo.13 Despite these meaningful results, the role of ELTD1 in GC is still missing. Exploring the clinical significance and functional role of ELTD1 in GC may lay the foundation for targeted therapy.
In this study, we first demonstrated that ELTD1 is significantly upregulated in human GC by analyzing public databases and our own samples. Then, a series of in vitro and in vivo experiments showed that ELTD1 could promote GC cells proliferation, invasion and metastasis. Notably, ELTD1 could also facilitate epithelial to mesenchymal transition (EMT) process in GC. In term of the mechanism, we found ELTD1 could interact with CSK and promote its downregulation, and then activates MAPK/ERK signaling pathway. Moreover, ELTD1 was a potential prognostic marker for GC patients and the combination of ELTD1 with CSK may provide more accurate prognostic prediction.
Materials and Methods
GC Tissues and Cell Lines
Forty GC tissues and adjacent normal tissues (ANTs) were collected from GC patients who received surgical resection at Xiangya Hospital of Central South University (CSU) between 2017 and 2018. All patients without any preoperative treatment were histopathologically confirmed as GC. Informed consent was obtained from each patient and the study was approved by the ethics committee of Xiangya Hospital of Central South University. The study protocol conformed to the ethical guidelines of the Declaration of Helsinki.
Human GC cell lines (SGC-7901, MGC-830, AGS, HGC27 and MKN45) and human gastric epithelial cell line (GES-1) were obtained from the cell center of Chinese Academy of Sciences (Shanghai, China) and were cultured in RPMI1640 medium (BioInd, Beit Haemek, Israel) supplemented with 10% fetal bovine serum (FBS, BioInd, Beit Haemek, Israel) at 37°C with 5% CO2.
RNA Extraction and Quantitative Real-Time PCR (qRT-PCR)
Total RNA was isolated with TRIzol® Reagent (Invitrogen, Carlsbad, CA) and cDNA was synthesized using universal cDNA synthesis kit (Toyobo, Tokyo, JP) following the manufacturer’s protocol. qRT-PCR was conducted on the PRISM 7300 Sequence Detection System (Applied Biosystems, CA). with the SYBR Green PCR Kit (Roche, Basel, Switzerland). GAPDH was used as internal control and the relative expression level of each target mRNA was calculated by 2−ΔCt or 2−ΔΔCT method. Each assay was replicated in three times. The primers were bought from Sangon Biotech (Shanghai, China) and the primer sequences were as follows: ELTD1, 5ʹ- CTCAGTCCTGTGGCGAAAATG −3ʹ (forward) and 5ʹ- GGTTACTGCTGGATCTGAAGC −3ʹ (reverse); E-cadherin, 5ʹ- CGAGAGCTACACGTTCACGG-3ʹ (forward) and 5ʹ- GGGTGTCGAGGGAAAAATAGG-3ʹ (reverse); EPCAM, 5ʹ- AATCGTCAATGCCAGTGTACTT-3ʹ (forward) and 5ʹ- TCTCATCGCAGTCAGGATCATAA −3ʹ (reverse); N-cadherin, 5ʹ- TGCGGTACAGTGTAACTGGG −3ʹ (forward) and 5ʹ- GAAACCGGGCTATCTGCTCG −3ʹ (reverse); Vimentin, 5ʹ- AGTCCACTGAGTACCGGAGAC −3ʹ (forward) and 5ʹ- CATTTCACGCATCTGGCGTTC −3ʹ (reverse); CSK: 5ʹ- CTGTACGCGCCTCATTAAACC-3ʹ (forward) and 5ʹ-CAGCATCACGTCTCCGAACTC-3ʹ (reverse).
Western Blot
Proteins were extracted using RIPA lysis buffer (CWBIO, Beijing, China) supplemented with 1% protease inhibitor cocktail (CWBIO, Beijing, China). Equivalent amount of proteins was separated by 10% SDS-PAGE and then transferred onto PVDF membranes (Millipore, Bedford, MA), which were subsequently blocked in 5% skimmed milk for 1h at room temperature. The membranes were incubated with identical primary antibody overnight at 4°C and then probed with horseradish peroxidase (HRP)-conjugated secondary antibodies (Zhongshan Golden bridge Biotechnology, Beijing, China). The protein bands were treated with chemiluminescence reagent (Thermo Scientific, Waltham, MA) and imaged by ChemiDocTM Touch Imaging System (BIO-RAD, California). Western blot was performed using the antibodies: ELTD1 (LSBio, LS‑B15548, 1:1000), E-cadherin (CST, 14472, 1:1000), EPCAM (CST, 2929, 1:1000), N-cadherin (CST, 13116, 1:1000), Vimentin (CST, 5741, 1:2000), JNK (CST, 9252, 1:500), p-JNK (CST, 9255, 1:500), P38MAPK (CST, 8690, 1:500), p-P38MAPK (CST, 4511, 1:500), ERK (CST, 4695, 1:1000), p-ERK (CST, 4370, 1:1000), ZEB1 (Affinity, DF7414, 1:1000), MMP2 (Affinity, AF0577, 1:1000), CyclinD1 (Abcam, ab40754, 1:1000), CSK (Santa Cruz, sc-166513, 1:500) and β-actin (Affinity, T0022, 1:2000).
Cell Transfection
Lentivirus technique was adopted to stably interfere target gene expression in AGS and MGC-803 cells according to the manufacturer’s instructions. Lentiviruses for ELTD1 knockdown (shELTD-1, shELTD-2, and shELTD-3), ELTD1 overexpression (pCMV-ELTD1), CSK knockdown (shCSK), CSK overexpression (pCMV-CSK) as well as negative control vectors were purchased from GenePharma (Shanghai, China). The target sequence of ELTD1 and CSK were as follows: shELTD-1: 5ʹ-GCTTCAGATCCAGCAGTAACC-3ʹ; shELTD-2: 5ʹ-GGGACAAGTTATCTGTGAATC-3ʹ; shELTD-3: 5ʹ-GGTCCTTTGCTTTCATCATCT-3ʹ. shCSK: 5ʹ-GCGATTACCGAGGGAACAAAG-3ʹ.
CCK-8 and Colony Formation Assay
For cell counting kit-8 (CCK-8) assay, cells were seeded into 96-well microplates (1×10³ per well). A 10 μL of CCK-8 reagent (Dojindo, Kumamoto, Japan) was added to each well at indicated time. After incubation for 2 h, absorbance at 450 nm was measured using spectrophotometer. For colony formation assay, cells were plated into 6-well plates at a density of 500 cells per well and incubated in 5% CO2 at 37°C for 2 weeks. After washing with PBS, methanol was added into each well to fixed the colonies, which were then stained with crystal violet (Biotechnology, Shanghai, China) for 10 minutes. Colonies with diameter >40μm were counted and all assays were triplicated.
EdU Assay
The EdU assay was performed with Cell-Light EdU Apollo567 In Vitro Kit (RiboBio, Guangzhou, China) to evaluate DNA synthesis and cell proliferation. A 100ul single-cell suspension containing 1.0×10⁵ cells was added to a 96-well microplate, followed by incubation with 50μM EdU for 2 hours. Then, Apollo Solution and Hoechst 33342 were applied to stain EdU and nuclei, respectively. Cells were captured and counted under fluorescence microscope and the positive rate of Edu cells were calculated. All assays were done in triplicate.
Cell Migration and Invasion Assay
Transwell assays were conducted to examine the migratory and invasive abilities of transfected cells. About 1×10⁵ cells in 200ul serum-free medium were added into the upper chambers paved with or without matrigel matrix (BD, Franklin Lakes, NJ) for invasion or migration assays. A 500 μL medium with 10% FBS was added to the lower chamber. After culturing for 24 h, cells on the upper side of the membrane were wiped, while the cells on the lower side of the membrane were fixed with methanol and stained with 0.1% crystal violet. The invaded and migrated cells were photographed with inverted microscope and were counted in five randomly selected fields. All experiments were repeated in three times.
Mice Tumor Model
All animal experiments were conducted in the Animal Institute of CSU followed the guidelines approved by the Medical Experimental Animal Care Commission of CSU. Four-week-old male BALB/c nude mice were used to investigate the effect of ELTD1 on tumor growth and metastasis in vivo. For tumor growth assay, ELTD1-interfered cells and control cells (5 × 10⁶, 200 μL) were injected subcutaneously into the back of each mouse side-by-side to establish GC xenograft model. Four weeks later, all mice were sacrificed and the subcutaneous tumors were removed and compared (n = 3 per group). The tumor volume was calculated by the formula: tumor volume (mm3) = (length×width2)/2. For metastasis model, 5×10⁶ cells were injected into mice via tail vein. After 6 weeks, all mice were sacrificed and lung metastases were examined by hematoxylin and eosin (H&E) staining (n = 3 per group).
Bioinformatics Analysis
We analyzed The Cancer Genome Atlas (TCGA) data in UCSC Xena browser (http://xena.ucsc.edu/), Oncomine database (https://www.oncomine.org/), and Gene Expression Omnibus (GEO) datasets (GSE54129, GSE63089, GSE27342, GSE29272) to investigate the expression of ELTD1 in GC. In addition, to identify the potential pathways regulated by ELTD1 in GC, we utilized the gene expression profiles of GC in TCGA to perform Gene Set Enrichment Analysis (GSEA) and KEGG (Kyoto Encyclopedia of Genes and Genomes) pathway analysis by clusterProfiler package of R language. Significance thresholding was defined as false discovery rate (FDR) <0.25 and P <0.05.
Immunofluorescence
About 5×10⁵ cells were seeded on glass coverslip in 6-well plate and cultured overnight. After washing with PBS, cells were fixed with 4% paraformaldehyde for 10 min and permeabilized with 0.1% Triton X-100 for 10 min. The cells were then blocked with 1% BSA for 30 min and incubated with anti-ELTD1 (LSBio, LS‑B15548) and anti-CSK (Santa Cruz, sc-166513) antibody overnight at 4°C, followed by fluorescence labeled secondary antibodies (ThermoFisher Scientific, 35560/35503) and DAPI treatment. For cytoskeleton analysis, F-actin was stained using rhodamine-conjugated phalloidin (Roche, Basel, Switzerland). Fluorescence image was captured under inverted fluorescence microscope DMI4000 B (Leica, Wetzlar, Germany).
Co-Immunoprecipitation (Co-IP)
Proteins were prepared and subjected to incubation with indicated primary antibodies or control IgG for one night at 4°C, followed by incubation with protein G agarose beads (Cell Signaling Technology, Danvers, MA) for 2 h. Then, the beads were collected. The precipitated proteins were washed from the beads and analyzed by Western blot.
Statistical Analysis
SPSS 18 and GraphPad Prism 6 software were applied to statistical analysis. Data were presented as mean ± SD. Student’s t-test was conducted to compare the difference between two groups. The correlation between two genes was determined by Pearson correlation analysis. Kaplan–Meier method was used to plot overall survival (OS) curves and Log rank test was applied to determine the differences. For all analysis, P < 0.05 was considered to be of statistical significance.
Results
ELTD1 is Significantly Upregulated in Human GC Tissues and Cell Lines
To explore the expression of ELTD1 in GC tissues, we first performed analysis of public datasets, including TCGA-TARGET-GTEx database in UCSC Xena browser, Oncomine database and GEO database. The analysis of TCGA-TARGET-GTEx database showed, compared with GTEx and TCGA’s normal gastric tissue, ELTD1 was significantly increased in GC tissue (Figure 1A). In addition, datasets from Oncomine databases showed GC tissues had obviously elevated ELTD1 expression than normal gastric tissues (Figure 1B). Consistently, ELTD1 was also significantly upregulated in GC tissues from GEO database (GSE54129, GSE63089, GSE27342, and GSE29272) (Figure 1C). Then, we examined ELTD1 expression in 40 paired GC tissues and adjacent non-tumor tissues (ANTs). The result of qRT-PCR showed that 72.5% GC tissues had significantly upregulated ELTD1 expression compared with their matched ANTs. Western blot of representative tissues further confirmed that ELTD1 expression was increased in GC tissues at protein level (Figure 1D). Subsequent statistical analysis revealed that GC tissues with lymph node metastasis (LNM) had significantly higher ELTD1 expression than those without LNM (Figure 1E). Furthermore, qRT-PCR and Western blot synergically demonstrated that ELTD1 was markedly elevated in GC cell lines compared with normal gastric epithelial cell-line GES-1 (Figure 1F). Collectively, these results demonstrated that ELTD1 was upregulated in GC tissues and cell lines and it may be associated with GC invasion and metastasis.
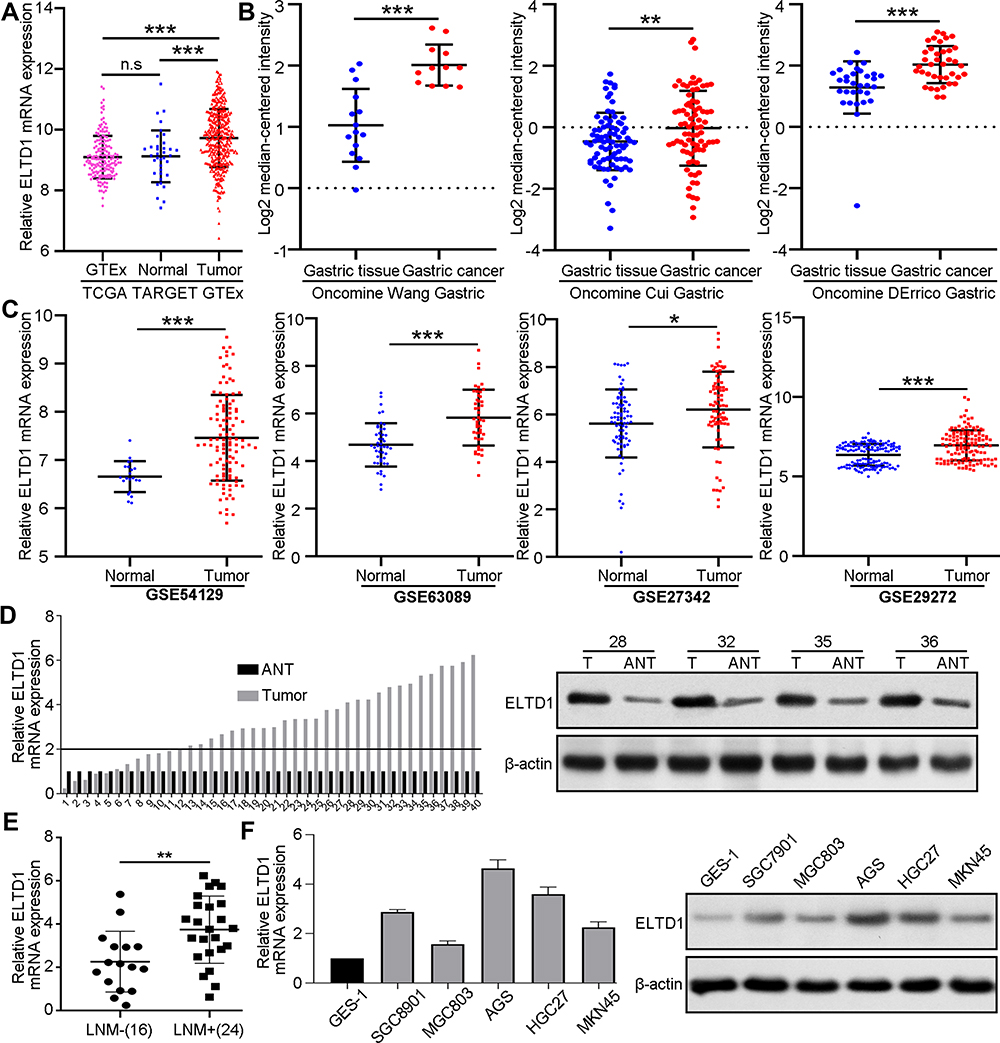 |
Figure 1 ELTD1 is Significantly Upregulated in Human GC Tissues and Cell Lines. (A) Comparing the expression of ELTD1 mRNA between GTEx normal gastric cancer tissues, TCGA normal gastric tissues and TCGA gastric cancer tissues in TCGA-TARGET-GTEx dataset. (B) Comparing the expression of ELTD1 mRNA in gastric cancer tissues and normal gastric tissues in Oncomine database. (C) Comparing the expression of ELTD1 mRNA in gastric cancer tissues and normal gastric tissues in Gene Expression Omnibus (GEO) datasets (GSE54129, GSE63089, GSE27342, GSE29272). (D) The mRNA and protein expression of ELTD1 in GC tissues analyzed by qRT-PCR and Western blot. (E) ELTD1 mRNA expression in GC patients with or without lymph node metastasis (LNM). (F) mRNA and protein expression of ELTD1 in normal gastric cell line GES-1 and GC cell lines analyzed by qRT-PCR and Western blot. Abbreviations: n.s, no significance. Notes: *P<0.05, **P< 0.01, ***P < 0.001. |
ELTD1 Promotes GC Cells Proliferation, Invasion and Metastasis in vitro and in vivo
To further confirm the function of ELTD1 in GC cells, we first transfected AGS and MGC803 cells with lentivirus containing ELTD1 shRNA sequences and lentivirus containing ELTD1 open reading frame (ORF) sequences, respectively, leading to the construction of AGSshELTD1, MGC803ELTD1 cells and their control cells AGSshCtrl and MGC803Ctrl. The knockdown and overexpression efficiency were verified by qRT-PCR and Western blot (Figure 2A). Among the three shRNAs targeting ELTD1 in AGS cells, sh-ELTD1-3 showed the highest knockdown efficiency and was chosen for subsequent experiments. Then, CCK8 assays were conducted and the result showed that the proliferation rate of AGSshELTD1 is significantly slower than AGSshCtrl, while MGC803ELTD1 proliferated more quickly than MGC803Ctrl (Figure 2B). In addition, knockdown of ELTD1 in AGS cells reduced formation of colonies and overexpression of ELTD1 in MGC803 cells could markedly promote colony formation (Figure 2C). Besides, EdU assay also revealed that the percentage of positive EdU was higher in AGSshCtrl than in AGSshELTD1, while MGC803ELTD1 exhibited more positive EdU than MGC803Ctrl (Figure 2D). Moreover, transwell migration and invasion assays both showed knockdown of ELTD1 significantly inhibited migratory and invasive capacity of AGS cells and ELTD1 overexpression in MGC803 cells notably promoted its migration and invasion (Figure 2E). To better understand the role of ELTD1 in GC, we further performed in vivo experiments. Mouse subcutaneous tumor model showed that knockdown of ELTD1 in AGS cells inhibited tumor growth, while overexpression of ELTD1 in MGC803 cells significantly promoted its growth (Figure 2F). What is more, mouse lung metastasis model showed that downregulated expression of ELTD1 in AGS could inhibit lung metastasis, while overexpression of ELTD1 in MGC803 could promote lung metastasis (Figure 2G). In brief, these data confirmed that ELTD1 had a supporting role in promoting GC cell proliferation, invasion in vitro and growth, metastasis in vivo.
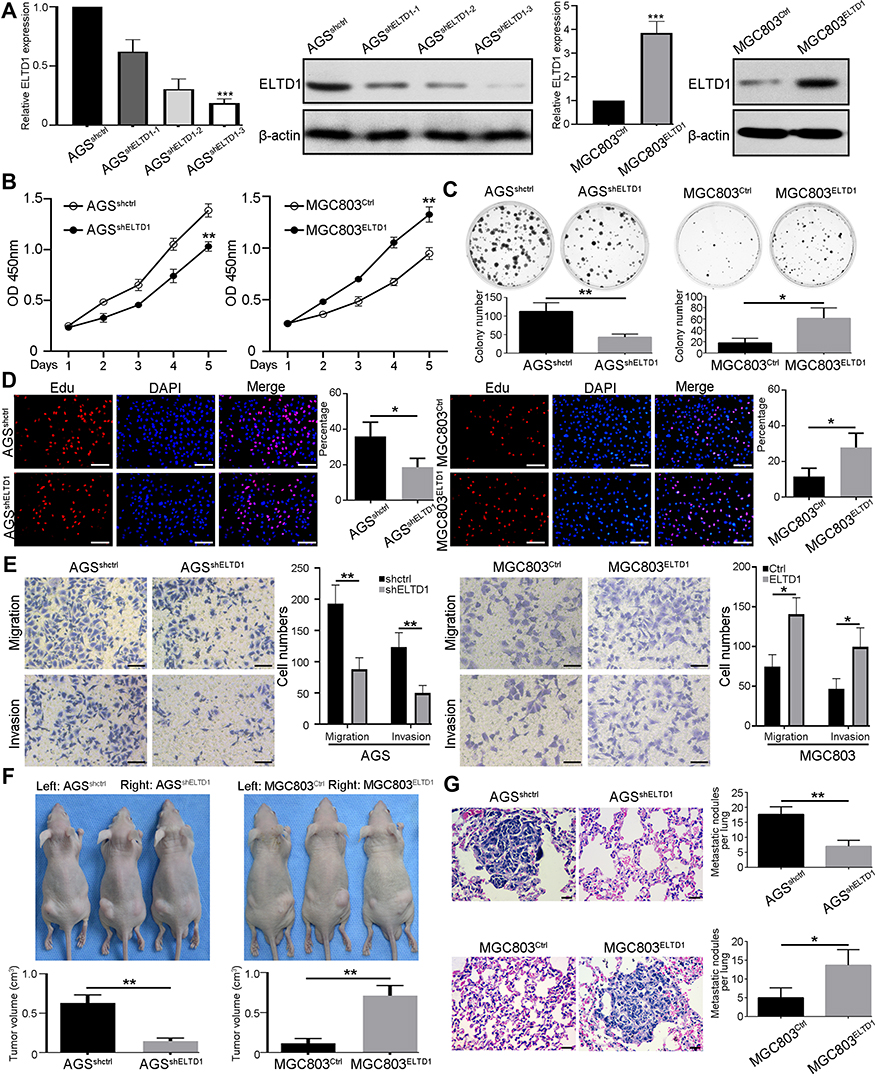 |
Figure 2 ELTD1 Promotes GC Cells Proliferation, Invasion and Metastasis in vitro and in vivo. (A) The knockdown and overexpression efficiency of indicated lentiviruses in AGS and MGC803 cells were detected by qRT-PCR and Western blot. (B and C) CCK8 assay (B) and colony formation assay (C) were used to detect the effect of ELTD1 on GC cells proliferative ability. (D) Edu assay was performed to assess proliferative capacity of indicated GC cells. Nuclei of proliferating cells were labeled by EdU (red) and all nuclei were labeled by Hoechst 33342 (blue). Data are the mean ± SD of three independent experiments. Scale bars, 50 μm. (E) Effects of ELTD1 knockdown and overexpression on cell invasion and migration using transwell invasion/migration assays. Results represented the mean ± SD in triplicate using bar graph. Scale bars, 50 μm. (F) Subcutaneous tumors transplanted with parental and up/down-regulated ELTD1-expressing cells side-by-side were shown. Tumors size of subcutaneous tumors was measured three times and compared in the lower bar graphs with mean ± SD. (G) Representative H&E staining of mice lung after tail vein injection of indicated GC cells. The number of pulmonary metastatic nodules in each group was compared. Scale bars, 50 μm. Notes: *P<0.05, **P< 0.01, ***P < 0.001. |
ELTD1 Facilitates EMT of GC Cells
Epithelial tumor cells often take advantage of EMT to disseminate, a cellular process in which tumor cell loss of the epithelial marker E-cadherin (CDH1), EpCAM and gain of the expression of the mesenchymal marker vimentin, N-cadherin (CDH2).14 The occurrence of EMT is mediated by many key transcription factors, such as SNAIL, ZEB, and TWIST.15 We analyzed the correlation between ELTD1 and EMT markers and transcription factors using TCGA data from UCSC Xena browser. Intriguingly, the results showed that ELTD1 was negatively correlated with CDH1 and EpCAM expression and positively correlated with CDH2 and vimentin expression (Figure 3A). In addition, ELTD1 was also positively correlated with EMT transcription factors, such as ZEB1, ZEB2, SLUG, and TWIST1 (Figure 3B). EMT often accompanies with the transformation of cytoskeleton. Indeed, fusiform morphology and elongated F-actin fibers of AGS cells transformed into subrotund morphology and contracted F-actin fibers after knocking down of ELTD1, while contrary changes could be observed in MGC803 cells after overexpressing ELTD1 (Figure 3C). The above results indicated that ELTD1 may participate in EMT of GC cells. To test this speculation, we analyzed the expression of EMT markers in GC cells by qRT-PCR (Figure 3D). The results showed that knocking down of ELTD1 in AGS cells could significantly increase E-cadherin, EpCAM expression and decrease the expression of vimentin, N-cadherin, while overexpression of ELTD1 in MGC803 could cause opposite changes of EMT markers. In addition, we adopted two shRNAs (sh-ELTD1-2, sh-ELTD1-3) to knockdown ELTD1 expression in AGS cells and Western blot analysis showed that knockdown of ELTD1 significantly increased E-cadherin, EpCAM protein expression and decreased the expression of vimentin, N-cadherin, ZEB1, and MMP2 (Figure 3E and Supplementary Figure 1). ELTD1 overexpression in MGC803 could cause opposite changes of EMT markers (Figure 3E). In a word, analysis of public database and our experimental results together confirmed that ELTD1 promotes EMT process of GC cells.
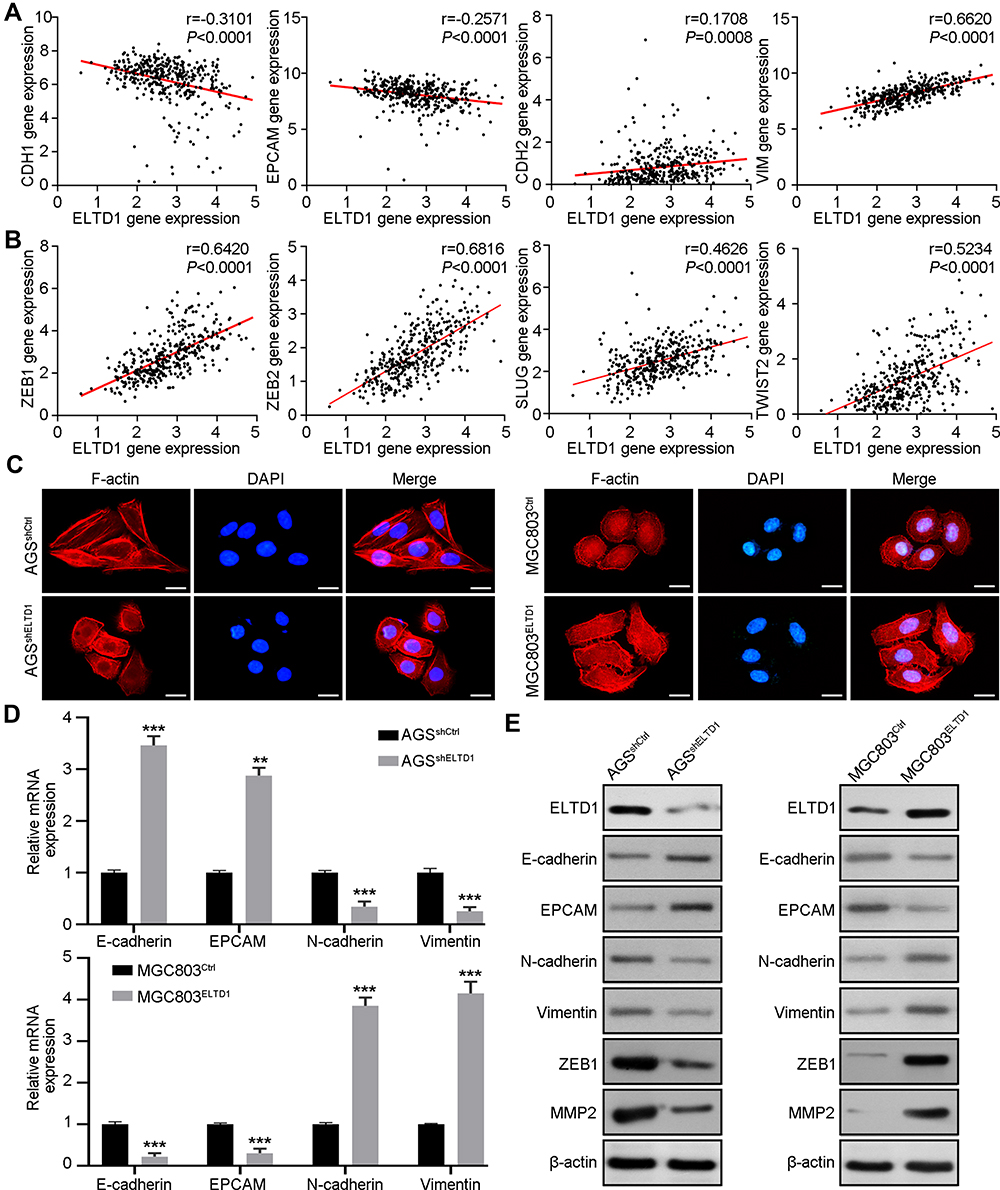 |
Figure 3 ELTD1 Facilitates EMT of GC Cells. (A) The Pearson correlation between ELTD1 and epithelial markers (CDH1, EPCAM), mesenchymal markers (VIM, CDH2) was analyzed using TCGA STAD data. (B) The Pearson correlation between ELTD1 and EMT transcription factors (ZEB1, ZEB2, SLUG, TWIST2) was analyzed using TCGA STAD data. (C) Cytoskeleton of indicated cells is visualized by staining F-actin with rhodamine-phalloidin. Scale bars, 5 μm. (D) qRT-PCR was used to detect the expression of EMT markers in ELTD1-interfered and control cells. (E) Western blot assay was used to detect the expression of EMT markers, ZEB1, and MMP2 in ELTD1-interfered and control cells. Notes: **P< 0.01, ***P < 0.001. |
ELTD1 Promotes Proliferation, Invasion and EMT of GC Cells via Activating MAPK /ERK Signaling
To clarify the molecular mechanism of ELTD1 in promoting GC progression, we first applied Kyoto Encyclopedia of Genes and Genomes (KEGG) analysis using TCGA database to identify associated pathways (Figure 4A). Gene set enrichment analysis (GSEA) further showed that ELTD1 was positively associated with pathways in cancer (NES=1.9402, P < 0.001) and mitogen-activated protein kinase (MAPK) signaling pathway (NES=1.9585, P < 0.001; Figure 4B). MAPK pathways are important signaling responded to many extracellular stimuli and there are three major parallel MAPK pathways, namely MAPK/ERK pathway, p38/MAPK pathway and JNK/MAPK pathway.16 To point out whether and which MAPK signaling is affected by ELTD1, we performed Western blot analysis and the results showed that knockdown of ELTD1 inhibited phosphorylation of ERK (p-ERK) in AGS cells, whereas ELTD1 overexpression could lead to the increase of p-ERK in MGC803 cells. However, phosphorylation status of JNK and p38 and their total protein level were unaffected after manipulating ELTD1 expression in GC cells (Figure 4C and Supplementary Figure 2). Then, we further detected several ERK signaling downstream effectors associated with GC cells EMT, invasion and proliferation. Indeed, knockdown of ELTD1 could inhibit ZEB1, MMP2 and cyclinD1 expression in AGS cells, while ELTD1 overexpression significantly promoted their expression in MGC803 cells (Figure 4D). What is more, U0126, a highly selective ERK inhibitor, could significantly inhibit phosphorylation of ERK and the expression of downstream effectors in AGSshCtrl and MGC803ELTD1, but had no role in AGSshELTD1 and MGC803Ctrl with low ELTD1 expression (Figure 4D). Similarly, CCK8 (Figure 4E) and transwell migration and invasion assays (Figure 4F) both showed that U0126 significantly decreased the proliferative, migratory and invasive capacity of AGSshCtrl and MGC803ELTD1 cells, but generated no significant effects in GC cells with low ELTD1 expression. In summary, these data proved that ELTD1 activated MAPK/ERK signaling and increased the expression of its downstream effectors to promote GC progression.
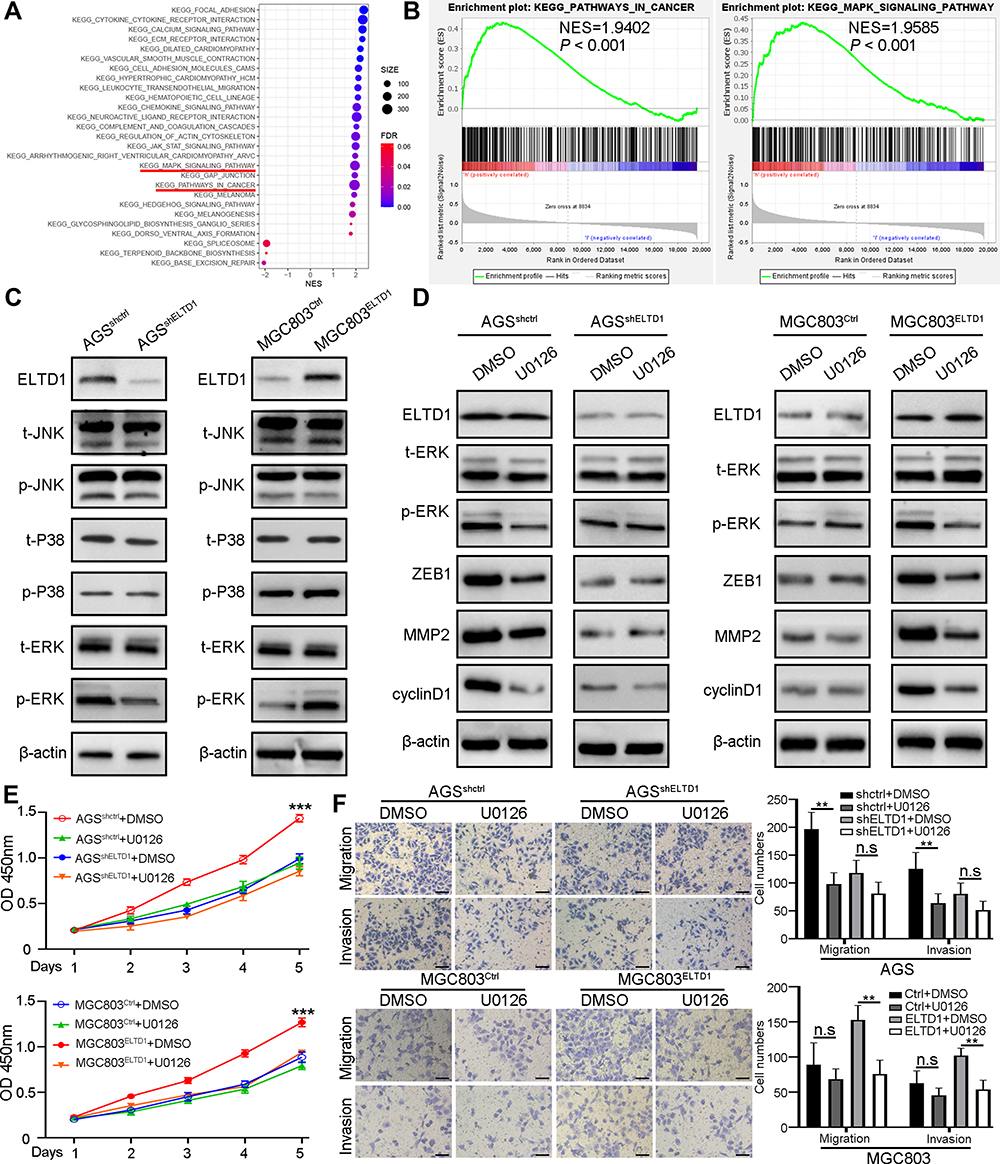 |
Figure 4 ELTD1 Promotes Proliferation, Invasion and EMT of GC cells via Activating MAPK /ERK Signaling. (A) Kyoto Encyclopedia of Genes and Genomes (KEGG) pathway analysis using TCGA STAD database. (B) GSEA-based KEGG pathway analysis for ELTD1 using TCGA STAD database. (C) The expression of total and phosphorylated three core members of MAPK signaling pathway was examined by Western blot in indicated GC cells. (D) The levels of t-ERK, p-ERK, and downstream effectors were determined by Western blot in indicated GC cells treated with MEK inhibitor U0126 (10 μM) or DMSO control. (E) CCK8 assay was used to assess the proliferative ability of indicated GC cells treated with U0126 (10 μM) or DMSO control. (F) Transwell invasion/migration assays were performed to assess the migratory and invasive capacity of indicated GC cells treated with U0126 (10 μM) or DMSO control. Scale bars, 50 μm. Abbreviations: n.s, no significance. Notes: **P< 0.01, ***P < 0.001. |
CSK is Critical for ELTD1-Mediated Activation of MAPK/ERK Signaling and GC Progression
Although the above results had verified that MAPK/ERK signaling was activated in GC cells with elevated ELTD1 expression, how ELTD1 activated MAPK/ERK signaling was another question to be resolved. For this purpose, we therefore retrieved BioGrid 4.4 database (https://thebiogrid.org/) to search the potential interactors of ELTD1 and found that C-terminal Src kinase (CSK) was the only one protein that may interact with ELTD1 in H. sapiens (Figure 5A). To test this finding, we first performed double immunofluorescence staining and found that ELTD1 co-localized with CSK in AGS cells (Figure 5B). Then, co-IP results further confirmed that ELTD1 and CSK could interact with each other in AGS cells (Figure 5C). To learn about whether ELTD1 could affect CSK expression in GC cells, correlation analysis using TCGA data showed that ELTD1 is negatively correlated with CSK expression (Figure 5D). What is more, knockdown of ELTD1 in AGS cells could promote the expression of CSK at both mRNA and protein levels, while ELTD1 overexpression in MGC803 cells significantly reduced CSK expression (Figure 5E). Previous studies had demonstrated that CSK negatively regulates Src family kinases and its depletion could enhance phosphorylation of Erk, but not p38 and JNK.17,18 Moreover, CSK tyrosine kinase activity was significantly reduced in various tumors and its downregulation could drive tumor proliferation and metastasis.19–23 Thus, we speculated that ELTD1 may negatively regulate CSK to activate MAPK/ERK signaling and promote tumor progression. Indeed, ectopic expression of CSK in AGS cells decreased p-ERK level and knocking down of CSK could increase phosphorylation of ERK in MGC803 cells. The reduction of p-ERK in AGS cells with ELTD1 downregulation could be recovered after further knocking down of CSK expression, whereas the promoting effect of ELTD1 on p-ERK expression was significantly abrogated by CSK overexpression in MGC803ELTD1 cells (Figure 5F). To see whether CSK is necessary for ELTD1 mediated GC progression, CCK8 and transwell migration and invasion assays were performed. Knockdown of CSK in AGSshELTD1 cells restored its reduced proliferative, migratory and invasive capacity, whereas ectopic expression of CSK in MGC803ELTD1 cells eliminated the promoting effect of ELTD1 overexpression on proliferation, migration and invasion. Likewise, overexpression of CSK in AGSshCtrl and knockdown of CSK in MGC803Ctrl could also inhibit and promote cell proliferation, migration and invasion, respectively (Figure 5G and H). Together, these results demonstrated that ELTD1 interacted with CSK and negatively regulated its expression, which further resulted in MAPK/ERK signaling activation and GC progression.
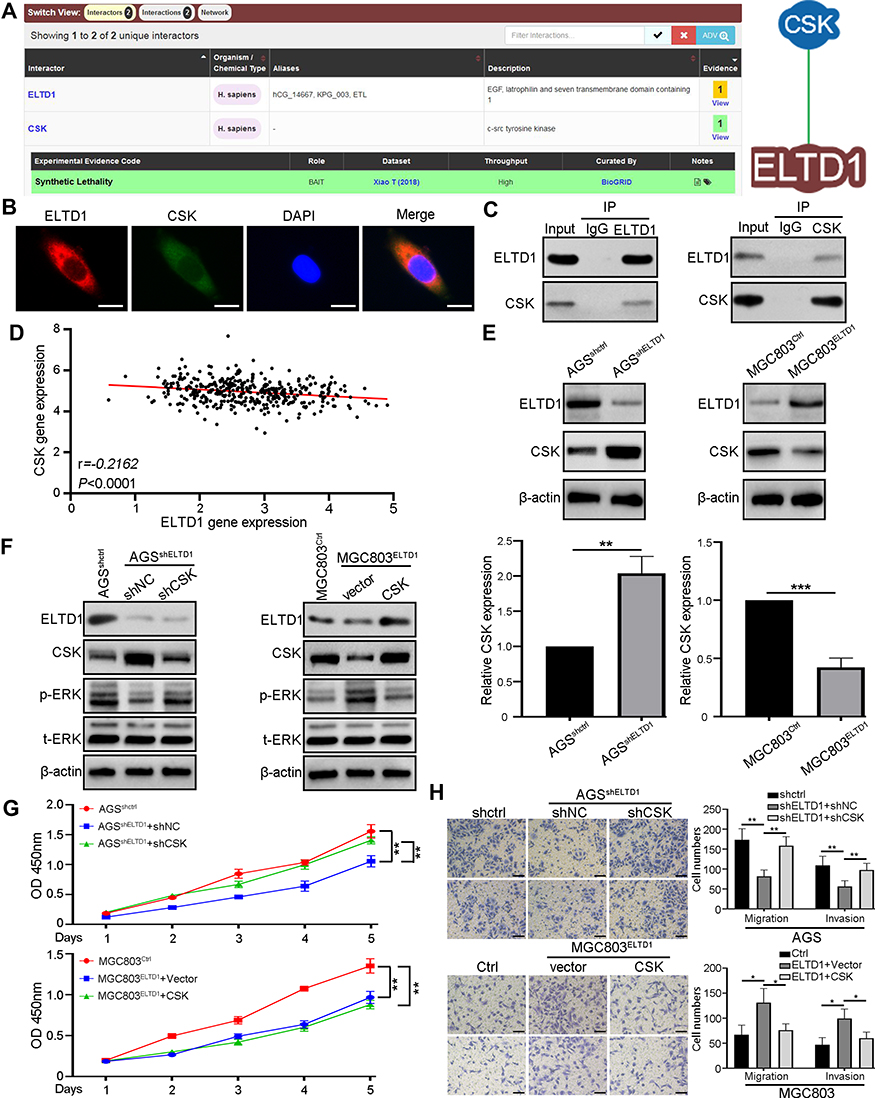 |
Figure 5 CSK is Critical for ELTD1-Mediated Activation of MAPK/ERK signaling and GC Progression. (A) C-terminal Src kinase (CSK) was the only one protein that may interact with ELTD1 in BioGrid 4.4 database (https://thebiogrid.org/). (B) Double immunofluorescence staining showed the colocalization of ELTD1 and CSK in AGS cells. Scale bars, 5 μm. (C) Co-IP analysis of ELTD1 and CSK in AGS cells. (D) The Pearson correlation between ELTD1 and CSK was analyzed using TCGA STAD data. (E) The mRNA and protein expression of CSK in GC cells with ELTD1 knockdown or overexpression detected by qRT-PCR and Western blot respectively. (F) Western blot analysis of ELTD1, CSK, p-ERK, t-ERK expression in ELTD1-interfered GC cells with CSK knockdown or ectopic expression. (G) CCK8 assay was performed to test the influence of CSK on the proliferation of ELTD1-interfered GC cells with CSK knockdown or ectopic expression. (H) Transwell invasion/migration assays were performed to test the effect of CSK on the migration and invasion of ELTD1-interfered GC cells with CSK knockdown or ectopic expression. Scale bars, 50 μm. Notes: *P<0.05, **P< 0.01, ***P < 0.001. |
High ELTD1 and Low CSK Expression are Associated with Poor Prognosis of GC Patients
Considering the important role of ELTD1 and CSK in GC progression, we then try to explore the clinical significance of ELTD1 and CSK expression in GC patients. We retrieved public prognostic data from TCGA and GEO databases in Kaplan–Meier plotter website (http://kmplot.com). Analysis using TCGA data showed that median survival time of GC patients with low ELTD1 expression was 1686 days, while those with high ELTD1 expression was only 801 days (Figure 6A). On the contrary, GC patients with high CSK expression showed favorable prognosis (median survival time: 1407 days) compared with those with low CSK expression (median survival time: 801 days) (Figure 6B). Similarly, analysis from GEO database also demonstrated that GC patients with high ELTD1 expression had significantly worse overall survival than patients with low ELTD1 expression (Figure 6C). Although the P value was greater than 0.05, the prognosis of GC patients with high CSK expression was trend to better than those with low CSK expression in GEO (Figure 6D). Finally, to figure out the combined predictive effect of ELTD1 and CSK, we stratified GC patients into four groups: patients with low ELTD1 and low CSK expression, patients with low ELTD1 and high CSK expression, patients with high ELTD1 and low CSK expression, patients with high ELTD1 and high CSK expression. Further analysis from TCGA (Figure 6E) and GEO (Figure 6F) both showed, among those four groups, GC patients with high ELTD1 and low CSK expression had the worst prognosis, while those with low ELTD1 and high CSK expression presented most favorable prognosis. Taken together, these analyses not only suggested ELTD1 was a potential prognostic marker for GC patients, but also revealed that the combination of ELTD1 and CSK may provide more accurate prognostic prediction.
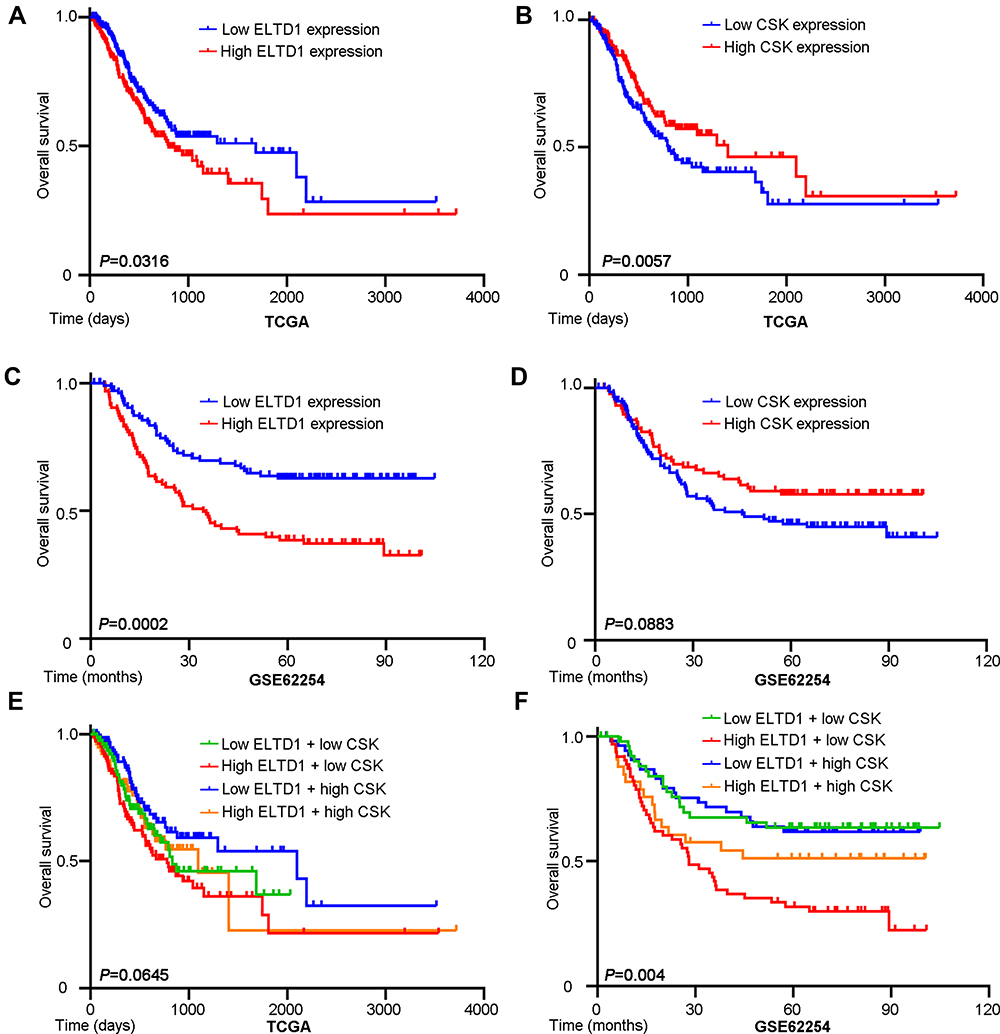 |
Figure 6 High ELTD1 and Low CSK Expression are Associated with Poor Prognosis of GC Patients. (A, B) Kaplan–Meier analysis of survival probability based on ELTD1 or CSK expression using public data from TCGA database. (C, D) Kaplan–Meier analysis of survival probability based on ELTD1 or CSK expression using public data from GSE62254 in Kaplan–Meier plotter website (http://kmplot.com). (E, F) Kaplan–Meier analysis of survival probability stratified according to ELTD1 and CSK expression using public data from TCGA database and GSE62254. |
Discussion
GPCR is divided into five major groups according to the seven-transmembrane domain presented in all members. ELTD1 belongs to “adhesion family” and is one of four members in “latrophilin-like” subfamily.7 Human ELTD1 gene locates on chromosome 1p33–p32 band and encodes a 3527 nucleotides transcript, which further translates into a 690 amino acid protein with molecular mass about 77.8 kDa. Recent studies have showed ELTD1 is implicated in many physiological processes, such as angiogenesis,8 cardiac hypertrophyin,10 cellular metabolism.9 Moreover, the role of ELTD1 in pathological conditions is also explored, especially in malignancies. It has been reported that ELTD1 is upregulated in retinoblastoma,24 glioma,13 hepatocellular carcinoma,12 etc. In spite of this, the role of ELTD1 in gastrointestinal tumors remains unclear. In the present study, we first analyzed the expression of ELTD1 in GC using several public datasets, eg TCGA, Oncomine and GEO, which all indicated ELTD1 is upregulated in GC tissues compared with normal gastric tissues. Subsequent researches in our GC samples and cell lines further verified these findings. Intriguingly, GC with lymph node metastasis exhibited more higher expression of ELTD1 than those without lymph node metastasis, indicating ELTD1 may relate with GC metastasis.
Many previous studies have demonstrated that ELTD1 is an important angiogenic regulator both in physiological and tumor angiogenesis.8 Although there is evidence that ELTD1 could promote tumor angiogenesis, its effect on tumor cells themselves is not well understood. Silencing ELTD1 could significantly reduce migration, but not viability of retinoblastoma cell.24 However, ELTD1 overexpression could promote proliferation, migration and invasion of glioma cells.13 In GC cells, knockdown of ELTD1 could significantly inhibit its proliferative, migratory and invasive capacity, whereas ELTD1 overexpression led to contrary results. More importantly, in vivo subcutaneous tumor model and lung metastasis model by tail vein injection demonstrated that ELTD1 plays critical role in promoting GC growth and metastasis. Epithelial to mesenchymal transition (EMT) is crucial for the invasion-metastasis cascade in various cancers including GC.25,26 Intriguingly, data from TCGA database showed that ELTD1 expression is positively correlated with mesenchymal markers and EMT transcription factors, but negatively correlated with epithelial markers, which indicates that ELTD1 may associate with the EMT of GC cells. We further confirmed this by examining the changes of cell cytoskeleton and EMT markers after intervening ELTD1 expression in GC cells. Based on these data, we concluded that ELTD1 promotes GC metastasis by inducing EMT.
We then explored the molecular mechanism underlying ELTD1 promoting GC progression. The ELTD1 receptor is formed of a large extracellular domain, a seven transmembrane domain coupled with a short cytoplasmic tail. Extracellular domain of ELTD1 contains an epidermal growth factor domain, an EGF Ca2+ binding domain and a GPCR autoproteolysis site. The cytoplasmic domain of ELTD1 composes a tyrosine kinase phosphorylation site, indicating ELTD1 may involve in intracellular signaling.27 Unfortunately, little information is available at present on the potential downstream signaling pathways related to ELTD1.28 In glioma cells, ELTD1 overexpression could promote HIF-1α protein expression by activating JAK/STAT3 signaling pathway.13 By analyzing TCGA data, we found ELTD1 was positively associated with pathways in cancer and MAPK signaling pathway. Further studies showed that MAPK/ERK signaling, but not MAPK/JNK or MAPK/p38 signaling, was activated by ELTD1 in GC cells. Interestingly, U0126, a highly selective ERK inhibitor, could obviously attenuated the promoting effects of ELTD1 on the expression of downstream effectors and the proliferative, migratory and invasive capacity of GC cells. More importantly, we also found ELTD1 could interact with CSK and inhibited its expression, which further leads to the activation of MAPK/ERK signaling. Targeting CSK in ELTD1 overexpressed GC cells could inhibit ELTD1-mediated tumor promoting effect. Recently, Zalles et al had developed a kind of monoclonal anti-ELTD1 antibody and found it is a promising anti-angiogenic therapeutic in glioblastomas.29,30 ELTD1 expression in tumor vessel could be used as a predictive marker for sunitinib-treatment in patients with metastatic renal cell cancer.31 Together, our results provided another possible rationale that could be utilized to inhibit GC progression.
It has been reported ELTD1 overexpression was significantly correlated with poor DFS and OS in glioma patients.13 However, positive ELTD1 expression in tumor cells is related to better prognosis of patients with hepatocellular carcinoma.12 These results indicated ELTD1 may play different roles in various tumors. CSK is often down-regulated in tamoxifen-resistant breast cancer and higher expression of CSK-suppressed genes predicted poorer clinical outcome of patients with breast cancer who were treated with tamoxifen.32 In this study, we found GC patients with high ELTD1 expression have more poorer prognosis than those with low ELTD1 expression. However, CSK exhibited contrary effect on the prognosis of GC patients. To make the analysis more reliable, we further combined ELTD1 and CSK to predict the prognosis of GC patients and the analysis showed that high ELTD1 and low CSK expression GC patients had the worst prognosis, while those with low ELTD1 and high CSK expression presented most favorable prognosis.
Conclusion
Our study revealed that ELTD1 is up-regulated in GC and is associated with poor prognosis of GC patients. ELTD1 could promote GC cell proliferation, migration, invasion and EMT. Moreover, ELTD1 interacts with CSK and negatively regulates its expression, and thus lead to MAPK/ERK signaling activation and GC progression. These findings help us to understand the molecular mechanism underlying GC metastasis, and ELTD1 may serve as a novel prognostic biomarker and therapeutic target for GC patients.
Data Sharing Statement
All data generated or analyzed during this study are available within the article, its supplementary file and from the corresponding author upon reasonable request.
Ethics Approval and Informed Consent
The study was approved by the ethics committee of Xiangya Hospital of Central South University. Written informed consent was obtained from all patients. Animal experiments were approved by the Institutional Animal Care and Use Committee of Central South University.
Disclosure
The authors report no conflicts of interest in this work.
References
1. Bray F, Ferlay J, Soerjomataram I, et al. Global cancer statistics 2018: GLOBOCAN estimates of incidence and mortality worldwide for 36 cancers in 185 countries. CA Cancer J Clin. 2018;68(6):394–424. doi:10.3322/caac.21492
2. Smyth EC, Nilsson M, Grabsch HI, et al. Gastric cancer. Lancet. 2020;396(10251):635–648. doi:10.1016/S0140-6736(20)31288-5
3. Addeo M, Di Paola G, Verma HK, et al. Gastric cancer stem cells: a glimpse on metabolic reprogramming. Front Oncol. 2021;11:698394. doi:10.3389/fonc.2021.698394
4. Kontomanolis EN, Koutras A, Syllaios A, et al. Role of oncogenes and tumor-suppressor genes in carcinogenesis: a review. Anticancer Res. 2020;40(11):6009–6015. doi:10.21873/anticanres.14622
5. Verma HK, Falco G, Bhaskar LV. Molecular signaling pathways involved in gastric cancer chemoresistance. Theranos Approach Gastric Colon Cancer. 2021;4:117–134. doi:10.1155/2021/5519720
6. Nechiporuk T, Urness LD, Keating MT. ETL, a novel seven-transmembrane receptor that is developmentally regulated in the heart. ETL is a member of the secretin family and belongs to the epidermal growth factor-seven-transmembrane subfamily. J Biol Chem. 2001;276(6):4150–4157. doi:10.1074/jbc.M004814200
7. Favara DM, Banham AH, Harris AL. A review of ELTD1, a pro-angiogenic adhesion GPCR. Biochem Soc Trans. 2014;42(6):1658–1664. doi:10.1042/BST20140216
8. Masiero M, Simoes FC, Han HD, et al. A core human primary tumor angiogenesis signature identifies the endothelial orphan receptor ELTD1 as a key regulator of angiogenesis. Cancer Cell. 2013;24(2):229–241. doi:10.1016/j.ccr.2013.06.004
9. Favara DM, Zois CE, Haider S, et al. ADGRL4/ELTD1 silencing in endothelial cells induces ACLY and SLC25A1 and alters the cellular metabolic profile. Metabolites. 2019;9(12):287. doi:10.3390/metabo9120287
10. Xiao J, Jiang H, Zhang R, et al. Augmented cardiac hypertrophy in response to pressure overload in mice lacking ELTD1. PLoS One. 2012;7(5):e35779. doi:10.1371/journal.pone.0035779
11. Ziegler J, Pody R, Coutinho DSP, et al. ELTD1, an effective anti-angiogenic target for gliomas: preclinical assessment in mouse GL261 and human G55 xenograft glioma models. Neuro Oncol. 2017;19(2):175–185. doi:10.1093/neuonc/now147
12. Kan A, Le Y, Zhang YF, et al. ELTD1 function in hepatocellular carcinoma is carcinoma-associated fibroblast-dependent. J Cancer. 2018;9(14):2415–2427. doi:10.7150/jca.24406
13. Li J, Shen J, Wang Z, et al. ELTD1 facilitates glioma proliferation, migration and invasion by activating JAK/STAT3/HIF-1alpha signaling axis. Sci Rep. 2019;9(1):13904. doi:10.1038/s41598-019-50375-x
14. Pastushenko I, Blanpain C. EMT transition states during tumor progression and metastasis. Trends Cell Biol. 2019;29(3):212–226. doi:10.1016/j.tcb.2018.12.001
15. Lamouille S, Xu J, Derynck R. Molecular mechanisms of epithelial-mesenchymal transition. Nat Rev Mol Cell Biol. 2014;15(3):178–196. doi:10.1038/nrm3758
16. Yang M, Huang CZ. Mitogen-activated protein kinase signaling pathway and invasion and metastasis of gastric cancer. World J Gastroenterol. 2015;21(41):11673–11679. doi:10.3748/wjg.v21.i41.11673
17. Kazi JU, Vaapil M, Agarwal S, et al. The tyrosine kinase CSK associates with FLT3 and c-Kit receptors and regulates downstream signaling. Cell Signal. 2013;25(9):1852–1860. doi:10.1016/j.cellsig.2013.05.016
18. Gu J, Nada S, Okada M, et al. Csk regulates integrin-mediated signals: involvement of differential activation of ERK and Akt. Biochem Biophys Res Commun. 2003;303(3):973–977. doi:10.1016/s0006-291x(03)00468-6
19. Masaki T, Okada M, Tokuda M, et al. Reduced C-terminal Src kinase (Csk) activities in hepatocellular carcinoma. Hepatology. 1999;29(2):379–384. doi:10.1002/hep.510290239
20. Liang F, Liang J, Wang WQ, et al. PRL3 promotes cell invasion and proliferation by down-regulation of Csk leading to Src activation. J Biol Chem. 2007;282(8):5413–5419. doi:10.1074/jbc.M608940200
21. Rengifo-Cam W, Konishi A, Morishita N, et al. Csk defines the ability of integrin-mediated cell adhesion and migration in human colon cancer cells: implication for a potential role in cancer metastasis. Oncogene. 2004;23(1):289–297. doi:10.1038/sj.onc.1207041
22. Sirvent A, Benistant C, Pannequin J, et al. Src family tyrosine kinases-driven colon cancer cell invasion is induced by Csk membrane delocalization. Oncogene. 2010;29(9):1303–1315. doi:10.1038/onc.2009.450
23. Kumar S, Lu B, Davra V, et al. Crk tyrosine phosphorylation regulates PDGF-BB-inducible Src activation and breast tumorigenicity and metastasis. Mol Cancer Res. 2018;16(1):173–183. doi:10.1158/1541-7786.MCR-17-0242
24. Guihurt SJ, Burgos-Tirado N, Lafontaine DD, et al. Adhesion G protein-coupled receptor, ELTD1, is a potential therapeutic target for retinoblastoma migration and invasion. BMC Cancer. 2021;21(1):53. doi:10.1186/s12885-020-07768-3
25. Mittal V. Epithelial mesenchymal transition in tumor metastasis. Annu Rev Pathol. 2018;13:395–412. doi:10.1146/annurev-pathol-020117-043854
26. Huang L, Wu RL, Xu AM. Epithelial-mesenchymal transition in gastric cancer. Am J Transl Res. 2015;7(11):2141–2158.
27. Sevastre AS, Buzatu IM, Baloi C, et al. ELTD1-an emerging silent actor in cancer drama play. Int J Mol Sci. 2021;22(10):5151. doi:10.3390/ijms22105151
28. Serban F, Artene SA, Georgescu AM, et al. Epidermal growth factor, latrophilin, and seven transmembrane domain-containing protein 1 marker, a novel angiogenesis marker. Onco Targets Ther. 2015;8:3767–3774. doi:10.2147/OTT.S93843
29. Zalles M, Smith N, Ziegler J, et al. Optimized monoclonal antibody treatment against ELTD1 for GBM in a G55 xenograft mouse model. J Cell Mol Med. 2020;24(2):1738–1749. doi:10.1111/jcmm.14867
30. Zalles M, Smith N, Saunders D, et al. Assessment of an scFv antibody fragment against ELTD1 in a G55 glioblastoma xenograft model. Transl Oncol. 2020;13(3):100737. doi:10.1016/j.tranon.2019.12.009
31. Niinivirta M, Georganaki M, Enblad G, et al. Tumor endothelial ELTD1 as a predictive marker for treatment of renal cancer patients with sunitinib. BMC Cancer. 2020;20(1):339. doi:10.1186/s12885-020-06770-z
32. Xiao T, Li W, Wang X, et al. Estrogen-regulated feedback loop limits the efficacy of estrogen receptor-targeted breast cancer therapy. Proc Natl Acad Sci USA. 2018;115(31):7869–7878. doi:10.1073/pnas.1722617115
 © 2021 The Author(s). This work is published and licensed by Dove Medical Press Limited. The full terms of this license are available at https://www.dovepress.com/terms.php and incorporate the Creative Commons Attribution - Non Commercial (unported, v3.0) License.
By accessing the work you hereby accept the Terms. Non-commercial uses of the work are permitted without any further permission from Dove Medical Press Limited, provided the work is properly attributed. For permission for commercial use of this work, please see paragraphs 4.2 and 5 of our Terms.
© 2021 The Author(s). This work is published and licensed by Dove Medical Press Limited. The full terms of this license are available at https://www.dovepress.com/terms.php and incorporate the Creative Commons Attribution - Non Commercial (unported, v3.0) License.
By accessing the work you hereby accept the Terms. Non-commercial uses of the work are permitted without any further permission from Dove Medical Press Limited, provided the work is properly attributed. For permission for commercial use of this work, please see paragraphs 4.2 and 5 of our Terms.