")
Back to Journals » ClinicoEconomics and Outcomes Research » Volume 15
Elicitation of Health State Utility Values in Retinitis Pigmentosa by Time Trade-off in the United Kingdom
Authors O'Brien P, Enstone A, Bridge D, Wyn R, Banhazi J
Received 16 September 2022
Accepted for publication 22 December 2022
Published 15 January 2023 Volume 2023:15 Pages 29—39
DOI https://doi.org/10.2147/CEOR.S385094
Checked for plagiarism Yes
Review by Single anonymous peer review
Peer reviewer comments 2
Editor who approved publication: Dr Samer Hamidi
Paul O’Brien,1 Ashley Enstone,2 Daisy Bridge,2 Robin Wyn,2 Judit Banhazi3
1Novartis Ireland, Dublin, Ireland; 2Adelphi Values PROVE, Bollington, UK; 3Novartis Pharma AG, Basel, Switzerland
Correspondence: Paul O’Brien, Email [email protected]
Introduction: Retinitis pigmentosa (RP) is an inherited retinal pathology associated with “night blindness” and progressive loss of peripheral vision, in some cases leading to complete blindness. Health state utility values are required for activities such as modelling disease burden or the cost-effectiveness of new interventions. The current study aimed to generate utility values for health states of varying levels of functional vision in RP, with members of the general public in the UK.
Methods: Five health states were defined according to standard clinical measures of visual ability. Health state descriptions were developed following interviews with patients with RP in the UK (n=5). Further interviews were conducted for confirmation with healthcare professionals with specific experience of managing patients with RP in the UK (n=2). Interviews with members of the general public in the UK were conducted to value health states. A time trade-off (TTO) process based on the established Measurement and Valuation of Health (MVH) protocol was used. Due to the ongoing COVID-19 pandemic, all interviews were web-enabled and conducted 1:1 by a trained moderator.
Results: In total, n=110 TTO interviews were conducted with members of the UK general public. Mean TTO utility values followed the logical and expected order, with increasing visual impairment leading to decreased utility. Mean values varied between 0.78 ± 0.20 (“moderate impairment”), and 0.33 ± 0.26 (“hand motion” to “no light perception”). Supplementary visual analogue scale (VAS) scores also followed the logical and expected order: mean VAS values varied between 47.95 ± 15.38 (“moderate impairment”) and 17.22 ± 12.49 in (“hand motion” to “no light perception”).
Discussion: These data suggest that individuals living with RP have substantially impaired quality of life. Utility values for RP have been elicited here using a method and sample that is suitable for economic modelling and health technology assessment purposes.
Keywords: retinitis pigmentosa, inherited retinal disease, health state utility, health-related quality of life, time trade-off, vignette study
Introduction
Retinitis pigmentosa (RP) is an inherited retinal pathology associated with “night blindness” and progressive loss of peripheral vision in some cases leading to complete blindness, with consequent impact on patients’ health-related quality of life (HRQoL).1 Key domains affected by RP include mobility, emotional wellbeing, social functioning, and daily activities relating to vision, especially in dark and/or crowded areas.2 Few treatment options are currently available to prevent or reverse the progression of RP;3 however, targeted gene and cell-based therapies are being explored for the treatment of this condition.4–6
While the visual and functional impairments associated with RP have been shown to lead to reduced HRQoL for patients,7 quantitative data on this aspect are difficult to collect by observational or clinical research due to the relatively low prevalence of this condition (with estimates ranging from 11.09 to 26.43 per 100,000 worldwide, dependent on region and study).8 Quantitative data in the form of health state utility values are required for activities such as modelling the burden of disease on those affected or the cost-effectiveness of new interventions, and therefore potentially contribute to new treatment options being made available to patients.9
As RP is a rare condition, and therefore HRQoL data are difficult to collect from patients, a study was conducted by Lloyd et al to quantify the utility of health states in RPE65-mediated retinal disease through measurement of health states by six retinal specialists using the EQ-5D-5L and HUI3 generic HRQoL measures.10 However, health technology assessment (HTA) bodies, such as the National Institute for Health and Care Excellence (NICE), typically prefer measurement of health by patients (rather than clinicians), followed by valuation by the general public.11–17 Therefore, one potential approach within this preferred framework is the description of health state “vignettes” by patients, followed by valuation by the general public using a method such as time trade-off (TTO).11–17
The current study therefore aimed to generate utility values for health states of varying levels of functional vision in RP, using TTO elicitation with members of the general public in the UK, in order to quantify the burden of this condition and support economic evaluations for novel treatment options in this area.
Materials and Methods
This direct utility elicitation study was conducted between October 2020 and August 2021, and consisted of two phases: a qualitative stage comprising development interviews with patients and confirmation of health state descriptions with healthcare practitioners (HCPs), and a quantitative stage where utility values were elicited with members of the general public in the UK. Ethics exemption for this non-interventional study was sought from Ethical and Independent Review Services (Missouri, United States), and was granted on 23rd September 2020 (study identifier 20,155–01), as per Code of Federal Regulations §46.104(d)2 addressing research comprising only educational tests, surveys, interviews and/or observation, where participants remain anonymous. All study participants provided informed consent prior to their involvement.
Health State Development and Confirmation
Health states were defined according to standard clinical measures of visual ability: visual acuity (VA) and visual field (VF). VA/VF categories were used to define states according to American Medical Association (AMA) guidelines on visual disability, and were consistent with the prior utility elicitation study by Lloyd et al in 2019,10 namely:
“Moderate impairment”, defined as VA better than 20/200 or VF radius of greater than 10°.
“Severe impairment”, defined as VA from 20/200 to 20/500 or VF radius of 6° to 10°.
“Profound impairment”, defined as VA from 20/500 to 20/1250 or VF radius of 2° to 6°.
“Counting fingers”, defined as VA from 20/1250 to 20/20,000 or VF radius of less than 2°.
“Hand motion” to ‘no light perception’, defined as VA worse than 20/20,000.
These VA/VF categories (based on AMA guidelines and research by Lloyd et al) were then used to create new written descriptions for each health state, incorporating new insights from qualitative interviews conducted as part of this research. Draft health state descriptions were developed following interviews with patients with RP in the UK (n=5), conducted between October 2020 and February 2021.
These interviews focused on the functional impairment patients with RP experience, in terms of domains such as social life, family life, education, or employment, both during the daytime and night-time. Patients with clinically confirmed RP were recruited and interviewed for each of the predefined VA/VF categories, and patients living with more-advanced RP were encouraged to discuss the progression of their condition through health states that they had experienced previously. Interviewed patients were adults (mean age 45.4 years, median 40 years), who had been diagnosed an average of 12.0 years prior (median 10 years). Discussion material for these patient interviews was developed using existing qualitative findings from previous interviews with patients with RP (which had been conducted prior to this research).7
Once draft health state descriptions were developed, further qualitative interviews were conducted with HCPs with specific experience of managing patients with RP in the UK (n=2), in April 2021. HCPs confirmed the overall relevance of each health state description to the experience of patients living with each level of visual impairment. Recruited HCPs included one ophthalmologist specializing in inherited retinal diseases and one low-vision rehabilitation specialist.
Confirmed health state descriptions (see Supplementary Material Table 1) were then put forward for use in pilot and then main-phase utility elicitation interviews. Relative to those used by Lloyd et al, the health state descriptions used in the current study had an increased focus on the functional impairment experienced by individuals with RP.
Health State Utility Elicitation
Quantitative interviews with members of the general public in the UK were conducted in order to value health states according to the TTO methodology outlined below, in July and August 2021.
A representative sample of the UK general population was recruited for interview using random sampling, according to predefined quotas based on UK census data. As the prevalence of low vision or blindness in the UK was estimated to be 3.0%,18 the proportion of participants who had low vision or blindness, or who were primary caregiver for a person with these conditions, was capped at 6.0%, to avoid possible bias at the valuation step due to prior personal experience of visual impairment.
Firstly, pilot interviews (n=10) were conducted to validate the methodology, followed by the main phase (n=100). As no substantial changes were made to the health state descriptions following the pilot interviews, data were included in the final calculation of utility values (therefore giving a total sample size of n=110).
A TTO process based on the established Measurement and Valuation of Health (MVH) protocol was used to elicit utilities.19 Due to the ongoing COVID-19 pandemic at the time of fieldwork, all interviews were web-enabled and conducted 1:1 by a trained TTO moderator, who used visual aids to improve respondents’ comprehension of the valuation tasks, as is standard within the MVH and related valuation protocols.19 To avoid biasing participants’ responses, health state descriptions were not labelled in any manner that suggested differences in severity or importance and were presented to respondents in a random order. All respondents received compensation according to fair market value.
Prior to TTO valuation, visual analogue scale (VAS) scoring of the same health state descriptions was used as a “warm-up” exercise to allow participants to become comfortable with examining and valuing health state descriptions, and to collect additional data points for comparison and validation of TTO results. However, all utility values were derived by the TTO method. Prior to VAS valuation of each health state description, each participant was asked to value their own health on that day, using the same VAS scale.
The TTO method was then used to elicit health state utility values.19 This method involves asking the participant to select between a fixed period of life in the health state (followed by death), and a variable shorter period of life in full health (followed by death).19 Each valuation task involved iteratively varying the period of life in full health that is being compared, until a point of indifference was reached: the period of life in full health that is considered equivalent to the fixed period of life in the health state (in this case, ten years).
The standard ten-year time horizon specified by the MVH protocol was applied, and the iteration procedure included a mixture of “ping-pong”, bisection, and titration iteration steps, in order to explore all possible points of indifference between zero and ten years.19 “Ping-pong” iteration involves moving from one maximum possible value on the scale to the other (eg from 10 years to 0 years in full health); bisection involves moving to the halfway point of the remaining possible values on the scale (eg from 0 years to 5 years in full health); titration involves moving incrementally up or down the scale (eg from 5 years to 4 years in full health).19
The second step in the iteration procedure of the standard MVH protocol (which determines whether a health state will be valued above or below 0.0) was not undertaken in the current study. Therefore, the final result of each TTO valuation exercise was a utility value between 0.0 (death) and 1.0 (full health).
Utility Data Analysis
Utility values were calculated from TTO results, giving values between 0.0 and 1.0. Quantitative results (including demographic characteristics, TTO utility values, and VAS scores) were analyzed descriptively, and are here presented as means, medians, standard deviations, and 95% confidence intervals (where appropriate).
Prior to further statistical analysis, the distribution of individual TTO utility values within health states was examined by Shapiro–Wilk test, to determine whether data were normally distributed. A significance threshold of p<0.05 was applied when determining the distribution, and the results were used to determine the type of test that should be used to test for significant differences between states.
Significance of differences in TTO utility values between health states were therefore tested using the Kruskal–Wallis and pairwise Wilcoxon tests (non-parametric tests for skewed, non-normal data). A threshold of p<0.05 was again applied when concluding significance of differences.
Results
Utility Valuation Interview Respondent Characteristics
Characteristics of the n=110 interviewed members of the public are presented in Table 1. The interview sample was generally representative of the wider UK population, in terms of age, gender, region, and other characteristics; the UK general population quotas used for recruitment are also presented in Table 1 for comparison.
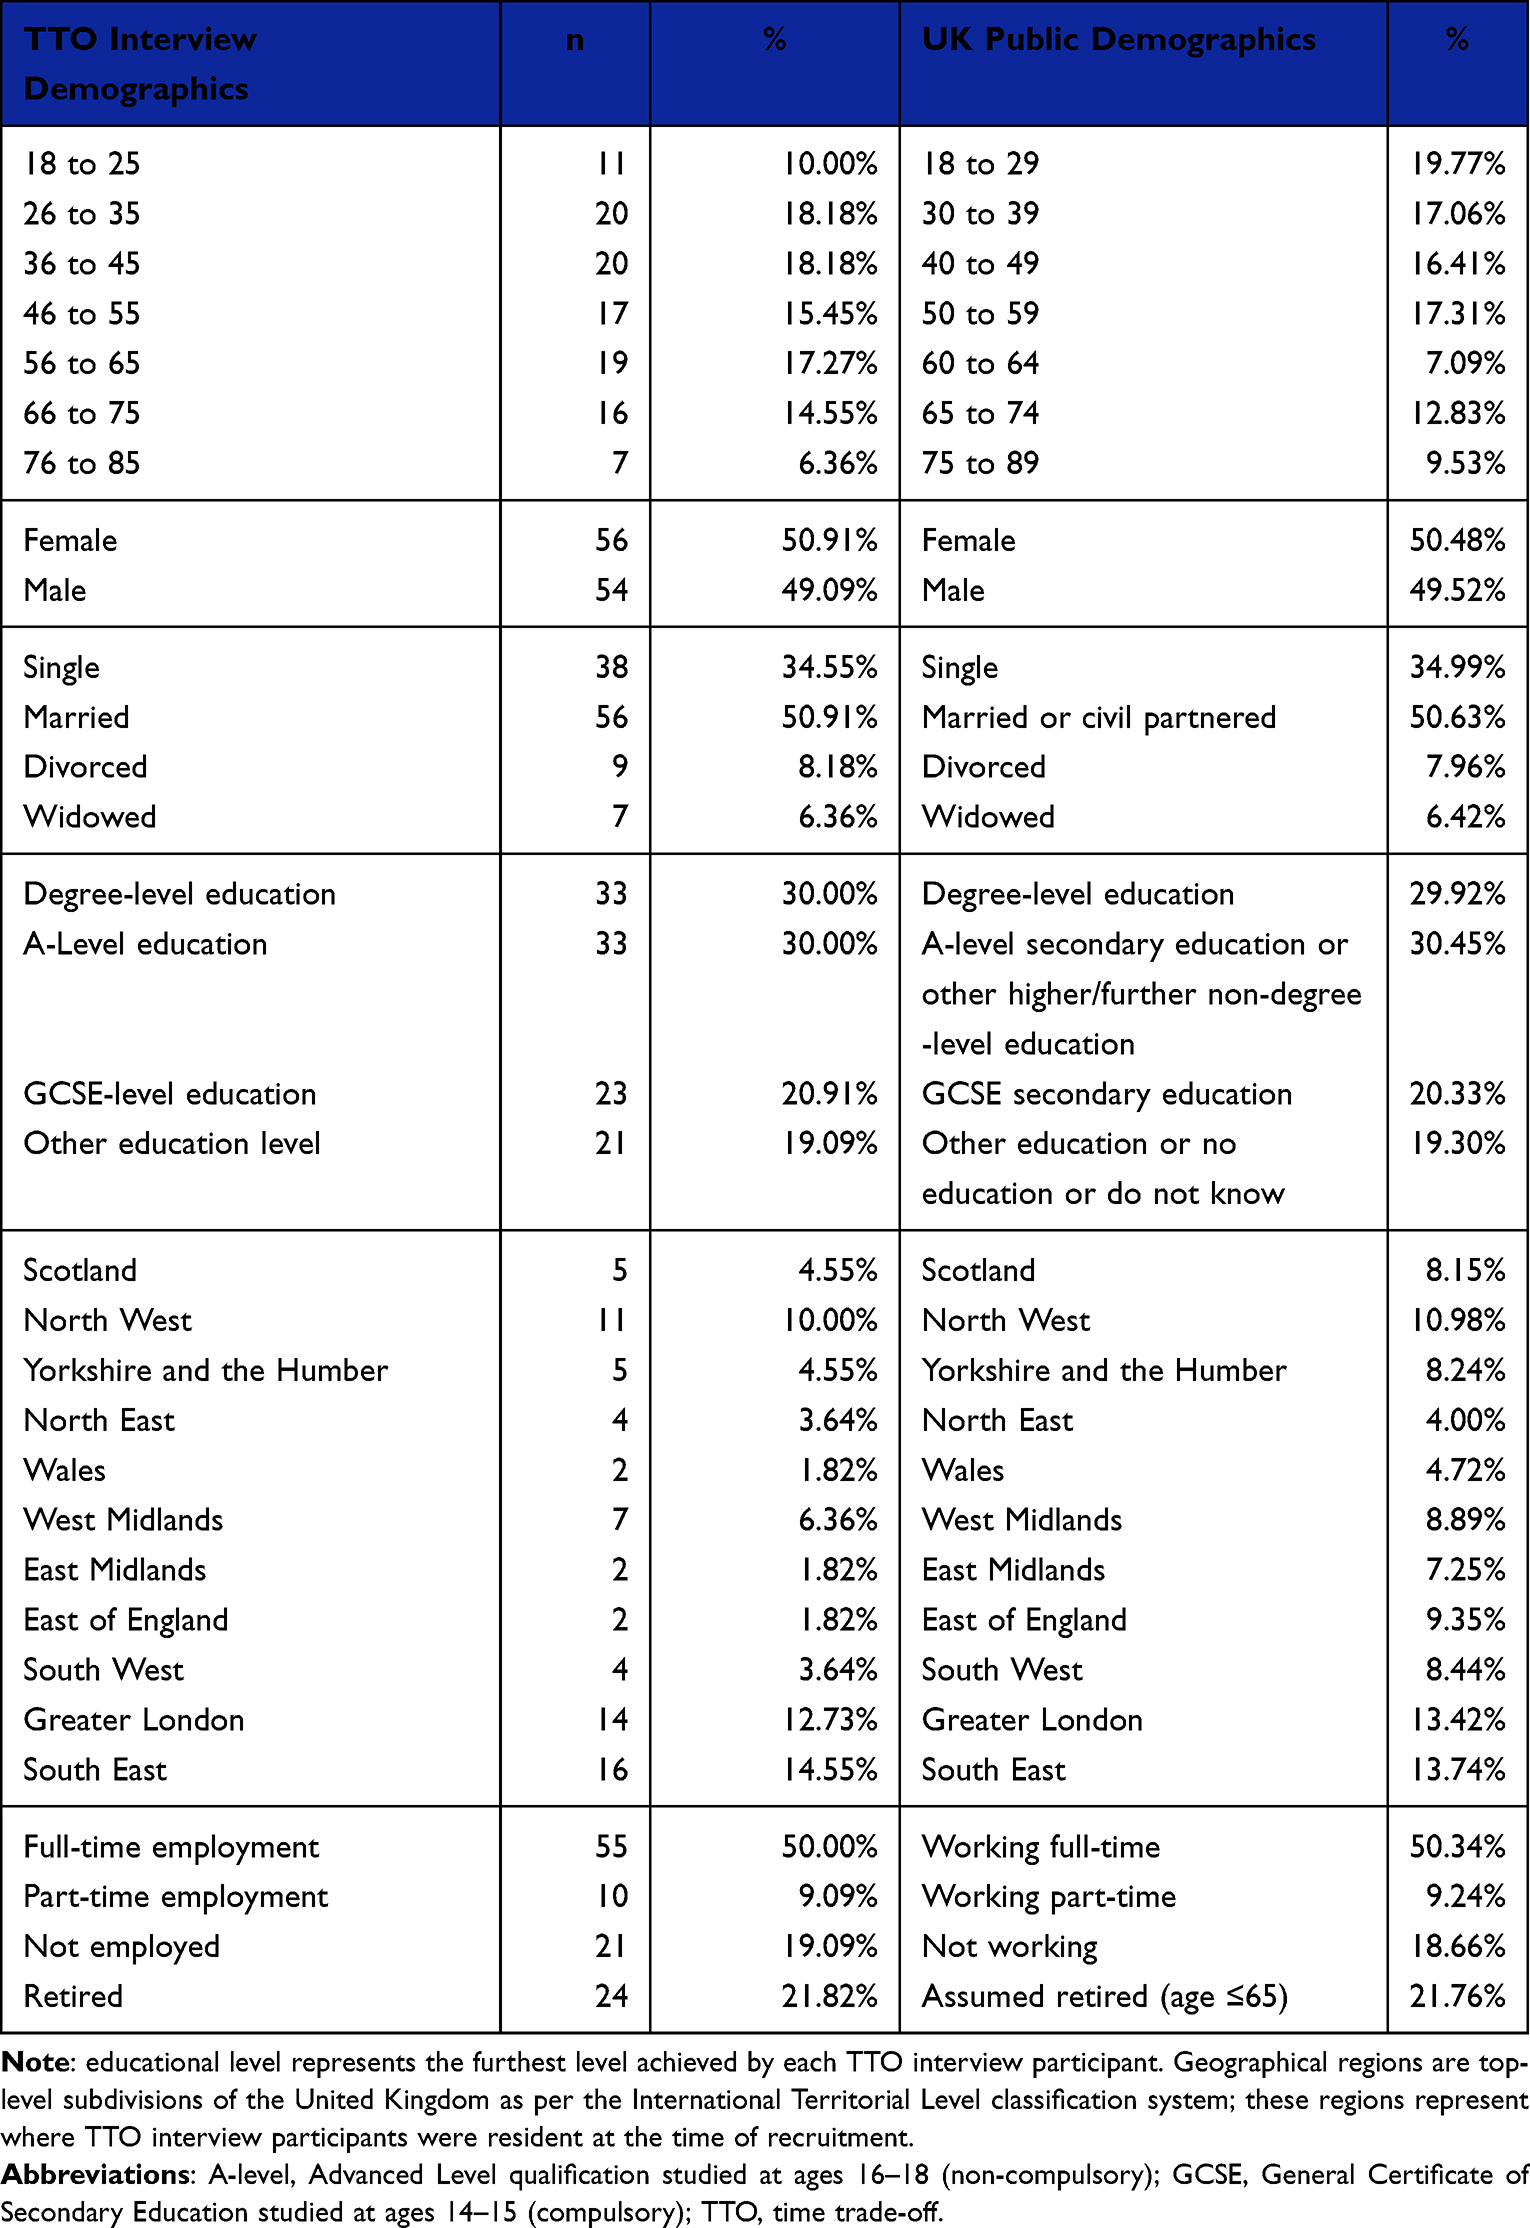 |
Table 1 Demographic Characteristics of Participants in TTO Interviews (n=110) and UK public20–25 |
TTO Utility Results
Utility values by TTO for each health state are presented in Figure 1 and Table 2. Mean values followed the logical and expected order, with increasing visual impairment leading to decreased utility in each case. Mean values varied between 0.78 in “moderate impairment”, and 0.33 in “hand motion” to “no light perception”.
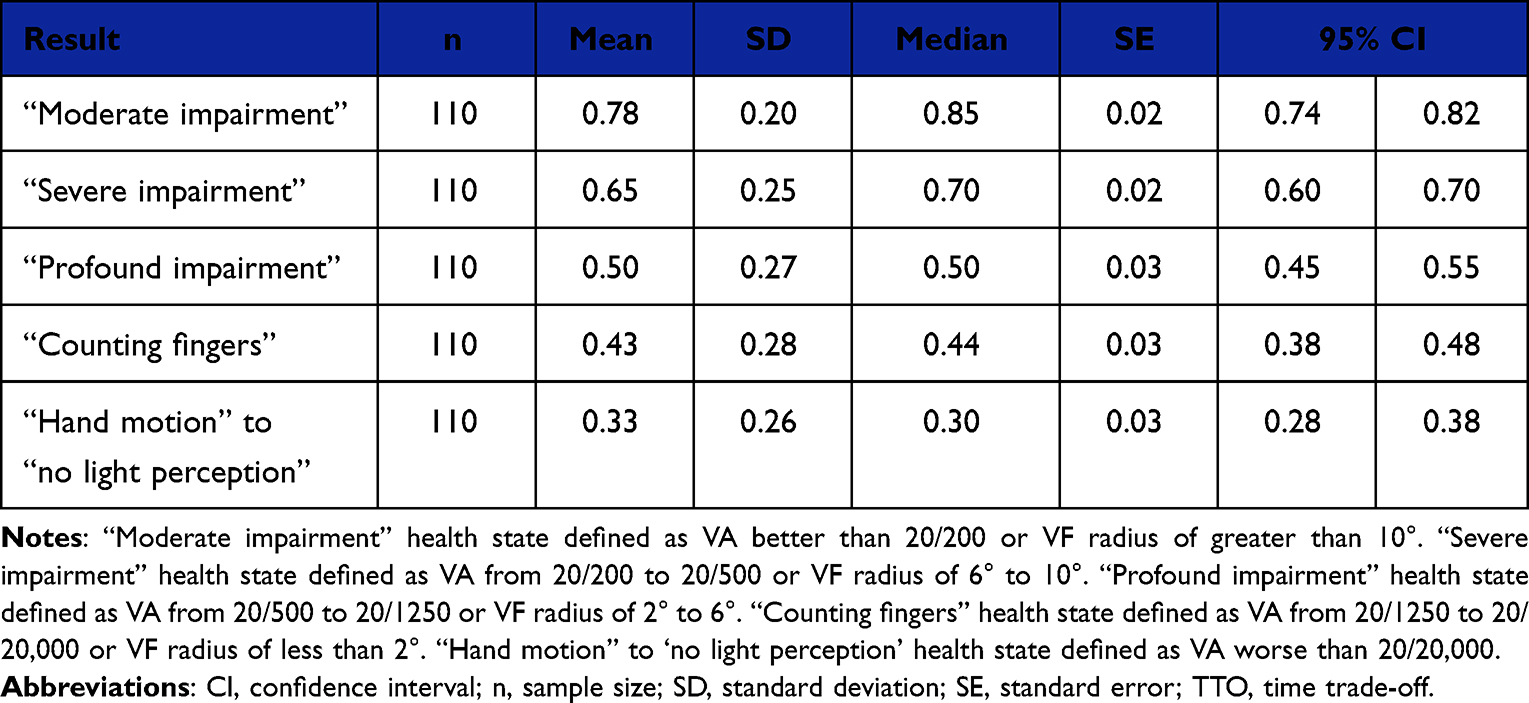 |
Table 2 TTO Utility Value per Health State |
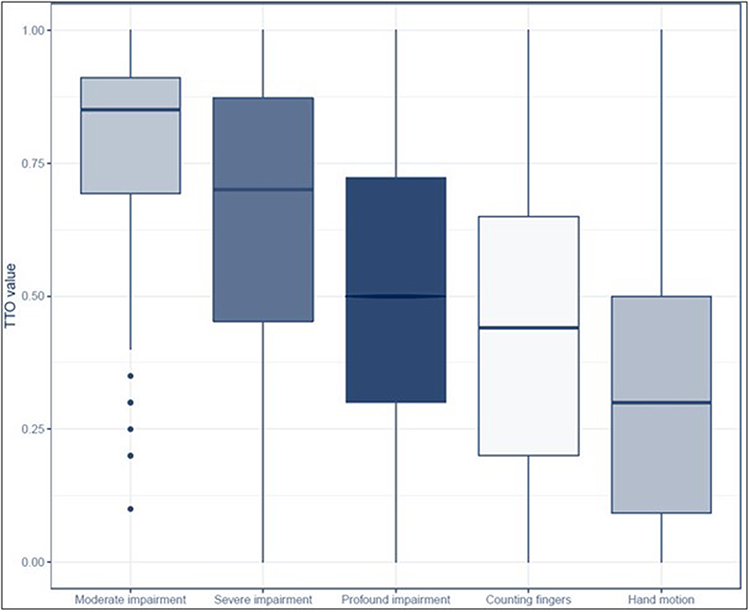 |
Figure 1 TTO utility value per health state (n=110 responses to each). “Moderate impairment” health state defined as VA better than 20/200 or VF radius of greater than 10°. “Severe impairment” health state defined as VA from 20/200 to 20/500 or VF radius of 6° to 10°. “Profound impairment” health state defined as VA from 20/500 to 20/1250 or VF radius of 2° to 6°. “Counting fingers” health state defined as VA from 20/1250 to 20/20,000 or VF radius of less than 2°. “Hand motion” to “no light perception” health state defined as VA worse than 20/20,000. Abbreviations: n, sample size; TTO, time trade-off; VA, visual acuity; VF, visual field. |
The Shapiro–Wilk test was used to determine whether the distribution of utility values in each health state was skewed. At a threshold of p<0.05, the utility values in all health states were skewed.
As TTO values within health states were not normally distributed, non-parametric tests were employed to examine the significance of differences between health states. The Kruskal–Wallis test showed a significant difference in utility values between health states (p<0.05), and a pairwise Wilcoxon test was conducted to determine significant differences between individual states. All pairs of health states showed significant differences in utility values (p<0.05), with the exception of “profound impairment” and “counting fingers” (p=0.05).
Sensitivity and Subgroup Analyses of TTO Utility Results
Two sensitivity analyses were conducted on TTO utility data by removing all values that were two or more standard deviations away from each health state mean, and by removing all extreme values (0.0 and 1.0). These analyses were conducted to show the effect (or lack of effect) of extreme individual answers on mean average health state utility values. Additionally, subgroup analyses were conducted to determine any effect of demographic characteristics on valuation of health states.
With removal of values that were two or more standard deviations away from each health state mean, mean health state utility values continued to be logically ordered (see Supplementary Material Figure 1). The Kruskal–Wallis test showed a significant difference in utility values between health states in this subgroup analysis (p<0.05); the pairwise Wilcoxon test also showed significant differences in utility values between all pairs of health states (p<0.05).
With removal of extreme values (0.0 and 1.0), mean health state utility values were again logically ordered (see Supplementary Material Figure 2). The Kruskal–Wallis test showed a significant difference in utility values between health states in this sensitivity analysis (p<0.05). The pairwise Wilcoxon test also showed significant differences in utility values between all pairs of health states (p<0.05), with the exception of “profound impairment” and “counting fingers” (p=0.069), and “counting fingers” and “hand motion” to “no light perception” (p=0.074). Although described as removing extreme values, this sensitivity analysis will impact the health states with the highest and lowest utility values most, as they have average values closest to the extremes and are more likely to have 0.0 and 1.0 values; therefore, this analysis should be interpreted with caution.
When analyzing the possible effect of patient demographics on TTO valuation, no significant difference was observed within any health state, in terms of results given by subgroups defined by age (younger/middle/older tertiles), gender (male/female), or employment (characteristics as reported in Table 1) (all p>0.10; see Supplementary Material Table 2).
VAS Score Results
VAS scores collected for each health state are presented in Figure 2 and Table 3. As seen in the TTO utility data, mean scores followed the logical and expected order, with increasing visual impairment leading to decreased scores in each case. Mean values varied between 47.95 in “moderate impairment”, and 17.22 in “hand motion” to “no light perception”. Participants’ mean VAS rating for their own health at the time of interview was 73.28, suggesting that the participant sample was broadly healthy.
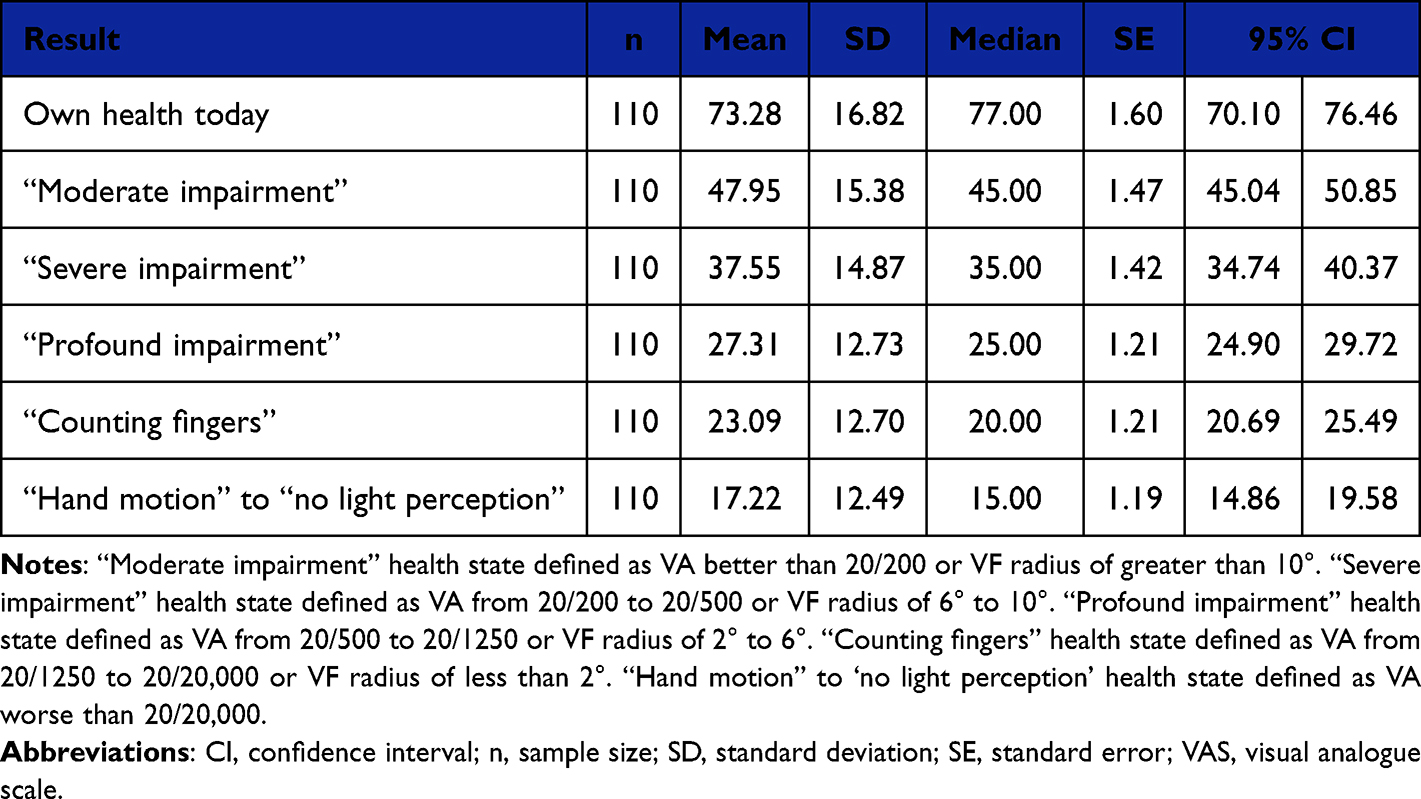 |
Table 3 VAS Score per Health State |
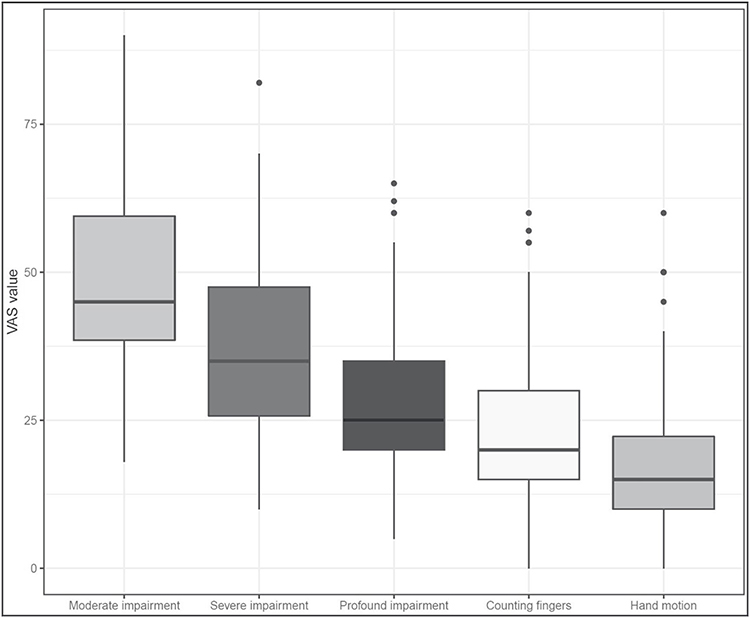 |
Figure 2 VAS score per health state (n=110 responses to each). “Moderate impairment” health state defined as VA better than 20/200 or VF radius of greater than 10°. “Severe impairment” health state defined as VA from 20/200 to 20/500 or VF radius of 6° to 10°. “Profound impairment” health state defined as VA from 20/500 to 20/1,250 or VF radius of 2° to 6°. “Counting fingers” health state defined as VA from 20/1,250 to 20/20,000 or VF radius of less than 2°. “Hand motion” to ‘no light perception’ health state defined as VA worse than 20/20,000. Abbreviations: n, sample size; VAS, visual analogue scale. |
Discussion
This study estimated utility values for five health states of varying visual impairment in RP, incorporating information on the key symptoms and functional impairments associated with this condition and using preference data gathered from the UK general population. Health states were defined according to AMA guidelines, and were consistent with previous research in this area.10 Mean utility values varied from 0.78 in “moderate impairment” to 0.33 in the “hand motion” to “no light perception” health state (the most severe), showing that the UK general population perceive that individuals living with RP face substantial impairment to their HRQoL as a result of this condition. This can be compared to the average utility value reported by the wider UK population for their own health (for whom a normative utility value of 0.86 has been measured, by EQ-5D rather than by direct TTO).26 In the context of previous TTO-based research with the UK general population, the mean utility of the “hand motion” to “no light perception” health state can be compared to that of severe multiple sclerosis (0.27),27 or acute myeloid leukemia treated with chemotherapy (0.36).28
Many key HTA bodies, such as NICE, express a preference for health state utility values derived through generic questionnaires completed by patients, such as the EQ-5D or HUI.11–16 However, utility values collected by alternative methods are typically accepted if reference-case values are not available, and if the alternative method is sufficiently justified and documented.17 Therefore, the values elicited here may form a valuable resource for future HTA submissions.
Utility values elicited in the current study may be compared to those from previous research in RPE65-mediated retinal disease (presented in Table 4 and discussed below).10 Other existing utility values in the area of visual impairment are much less comparable, due to major differences in methodology (such as direct valuation by patients rather than members of the public) or in the conditions that were examined (such as macular degeneration or diabetic retinopathy).29–32
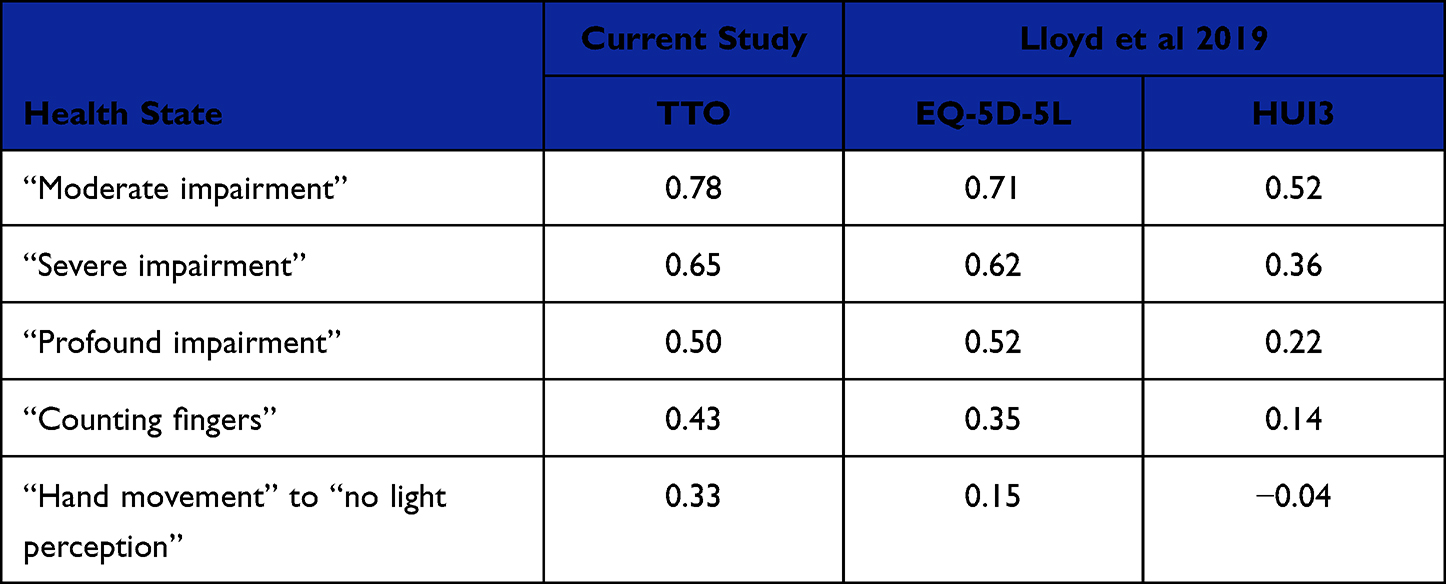 |
Table 4 Comparison of Health State Utility Values from the Current Study and Existing literature10 |
In the study by Lloyd et al in 2019, which involved EQ-5D and HUI valuation of vignettes by clinicians, mean utility values were distributed more widely than in the current study, and were substantially lower in the most severe health state: 0.709 to 0.152 (by EQ-5D), or 0.519 to −0.039 (versus 0.78 to 0.35 in the current study).10 Data from the current study (each above 0.0, and elicited using health state descriptions that focused on functional impairment)33 may provide a useful alternative source of utility values for economic modelling.
Several methodological factors may have influenced the differences in findings between Lloyd et al and the current study. Notably, description of health states by clinicians and valuation of health states by the public (using the EQ-5D and HUI questionnaires and existing value sets), as opposed to description of health states by patients and prospective direct valuation by the public (using detailed written health states and TTO), likely contributed to differences in results.10
In particular, the current study did not allow values below 0.0 to be applied to any health state. While this may be considered beneficial if values below 0.0 are considered unrealistic,33 this approach introduces the potential for a “floor effect” (where the “true” value is too low to be reliably estimated by the system of measurement being used). A small proportion of respondents in the current study (16%) gave a value of 0.0 to the health state describing the greatest level of impairment (“hand motion” to “no light perception”); therefore, it could be hypothesized that a proportion of these respondents may have answered with a value below 0.0, if this were possible – therefore, the mean utility value for this health state may be a conservative estimate.
Existing observational research into risks of stress and suicidality among individuals with RP may also support the adoption of lower utility values for more severe cases of RP, where individuals may have progressed to a state of total blindness with no visual ability.34,35
Although valuation of health states by the general public is preferred by many HTA bodies,11,12,36 certain limitations are inherent to this method, such as the public’s incomplete knowledge of specific health states and the ways in which patients may adapt to their condition over time (thereby improving their functioning and perceived HRQoL).9 However, limitations have also been identified when eliciting utility with patients, whose adaptation over time to their own condition may lead to unrealistically high utility (from the perspective of the general public).9
Notably, in both the current study and the study conducted by Lloyd et al, the definition of the health state with greatest visual impairment encompasses a relatively wide range of impairment levels (from ability to perceive a moving hand, to no ability to perceive any stimulus). For example, the results of previous economic modelling research in retinal pathology have been sensitive to changes in utility inputs at the lowest end of visual ability: scenarios were explored where utility was considered to decrease linearly or non-linearly towards total blindness, and this change was highly influential on the final estimate of the research.37 Hence, the results of the current study should be interpreted with caution, especially in situations where multiple levels of extremely impaired vision are modelled.
The sample size of n=5 patient interviews in this study is consistent with that of previous utility elicitation research in retinal pathology by Lloyd et al, where five patient and caregiver testimonials were used as discussion material for initial development of health state descriptions.10 In addition, the extensive qualitative findings gathered in previous research provided a firm basis for the health state descriptions that were created and valued in the current study.
The sample size of n=110 members of the UK general population for utility elicitation interviews follows existing guidance, which suggests that a sample size of 100 is required to achieve a representative sample.38 This sample size is similar to, or larger than, those of comparable primary research studies: similar to the n=108 members of the general public interviewed by Czoski-Murray et al in age-related macular degeneration,29 and larger than the n=6 specialist clinicians interviewed by Lloyd et al in RPE65-mediated retinal pathology.10 In addition, “own health” VAS values are available for the current study population, suggesting that the participant sample was broadly healthy, and therefore that the current health of participants was unlikely to influence their valuation of the health states.39
Conclusions
In conclusion, UK general population valuation of health state descriptions suggests that individuals living with RP face substantial impairment to their HRQoL as a result of this condition. Utility values for RP health states have been elicited here using a method and sample that may allow these values to be used for economic modelling and HTA purposes. Such activities may include estimating the value of novel therapy options in this area, which may reduce progression of visual impairment in RP.
Abbreviations
AMA, American Medical Association; CI, confidence interval; COVID-19, coronavirus disease 2019; EQ-5D, EuroQol 5-dimensions questionnaire; GCSE, General Certificate of Secondary Education; HCP, healthcare practitioners; HRQoL, health-related quality of life; HTA, health technology assessment; HUI, Health Utilities Index; MVH, Measurement and Valuation of Health; N, sample size; NICE, National Institute for Health and Care Excellence; QALY, quality-adjusted life year; RP, retinitis pigmentosa; RPE65, retinal pigment epithelium-specific 65 kDa protein; SD, standard deviation; SE, standard error; TTO, time trade-off; UK, United Kingdom; VA, visual acuity; VAS, visual analogue scale; VF, visual field.
Data Sharing Statement
The data generated within this research are available from the corresponding author upon reasonable request.
Acknowledgments
The authors wish to thank the individuals who participated in this non-interventional research.
Author Contributions
All authors made a significant contribution to the work reported, whether that is in the conception, study design, execution, acquisition of data, analysis, and interpretation, or in all these areas; took part in drafting, revising or critically reviewing the article; gave final approval of the version to be published; have agreed on the journal to which the article has been submitted; and agree to be accountable for all aspects of the work.
Funding
The conduct and reporting of this research were supported by Novartis.
Disclosure
Paul O’Brien and Judit Banhazi were employees of Novartis at the time of writing. Ashley Enstone, Daisy Bridge, and Robin Wyn are employees of Adelphi Values PROVE, who were contracted by Novartis to conduct this research. The authors report no other conflicts of interest in this work.
References
1. Hartong DT, Berson EL, Dryja TP. Retinitis pigmentosa. Lancet. 2006;368(9549):1795–1809.
2. Lange R, Kumagai A, Weiss S, et al. Vision-related quality of life in adults with severe peripheral vision loss: a qualitative interview study. J Patient-Rep Outcomes. 2021;5(1):1–12. doi:10.1186/s41687-020-00281-y
3. American Academy of Opthalmology. New treatments for retinitis pigmentosa; 2021. Available from: https://www.aao.org/eye-health/tips-prevention/gene-therapy-new-retinitis-pigmentosa-lca-luxturna.
4. Ahmed I, Johnston Jr RJ
5. Nuzbrokh Y, Ragi SD, Tsang SH. Gene therapy for inherited retinal diseases. Ann Transl Med. 2021;9(15):1278. doi:10.21037/atm-20-4726
6. Hinkle JW, Mahmoudzadeh R, Kuriyan AE. Cell-based therapies for retinal diseases: a review of clinical trials and direct to consumer “cell therapy” clinics. Stem Cell Res Ther. 2021;12(1):1–9. doi:10.1186/s13287-021-02546-9
7. Banhazi J, Williamson N, Bradley H, et al. What Do We Know About Patients’ and Caregivers’ Experiences When Living with the Hereditary Retinal Condition Retinitis Pigmentosa? Copenhagen, Denmark: ISPOR EU; 2019.
8. Sallum J, Kaur V, Shaikh J, et al. Epidemiology of mutations in the 65-kDa Retinal Pigment Epithelium (RPE65) gene-mediated inherited retinal dystrophies: a systematic literature review. Adv Ther. 2022;39:1179–1198. doi:10.1007/s12325-021-02036-7
9. Whitehead SJ, Ali S. Health outcomes in economic evaluation: the QALY and utilities. Br Med Bull. 2010;96(1):5–21. doi:10.1093/bmb/ldq033
10. Lloyd A, Piglowska N, Ciulla T, et al. Estimation of impact of RPE65-mediated inherited retinal disease on quality of life and the potential benefits of gene therapy. Br J Ophthalmol. 2019;103(11):1610–1614.
11. National Institute for Health and Care Excellence. Guide to the methods of technology appraisal 2013–5 the reference case; 2013. Available from: https://www.nice.org.uk/process/pmg9/chapter/the-reference-case.
12. Canadian Agency for Drugs and Technologies in Health. Guidelines for the economic evaluation of health technologies. Canada; 2017. Available from: https://www.cadth.ca/sites/default/files/pdf/guidelines_for_the_economic_evaluation_of_health_technologies_canada_4th_ed.pdf.
13. López Bastida J, Oliva J, Antoñanzas F, et al. Proposal for a guide for economic evaluation applied to health technologies. Gac Sanit. 2010;24(2):154–170. doi:10.1016/j.gaceta.2009.07.011
14. Merlin T, Tamblyn D, Schubert C. Guidelines for Preparing a Submission to the Pharmaceutical Benefits Advisory Committee, Version 5.0. Australian Government, Department of health; 2016.
15. China Guidelines for Pharmacoeconomic Evaluations Working Group. China guidelines for pharmacoeconomic evaluations; 2020 Available from: https://tools.ispor.org/PEguidelines/source/China-Guidelines-for-Pharmacoeconomic-Evaluations-2020.pdf.
16. Shiroiwa T, Fukuda T, Ikeda S, Takura T, Moriwaki K. Development of an official guideline for the economic evaluation of drugs/medical devices in Japan. Value Health. 2017;20(3):372–378. doi:10.1016/j.jval.2016.08.726
17. National Institute for Health and Care Excellence. NICE DSU Technical Support Document 11: Alternatives to EQ-5D for Generating Health State Utility Values. National Institute for Health and Care Excellence; 2011.
18. Pezzullo L, Streatfeild J, Simkiss P, Shickle D. The economic impact of sight loss and blindness in the UK adult population. BMC Health Serv Res. 2018;18(1):63. doi:10.1186/s12913-018-2836-0
19. Oppe M, Rand-Hendriksen K, Shah K, Ramos‐Goñi JM, Luo N. EuroQol protocols for time trade-off valuation of health outcomes. Pharmacoeconomics. 2016;34(10):993–1004. doi:10.1007/s40273-016-0404-1
20. Nomis. Population estimates - local authority based by single year of age; 2018. Available from: https://www.nomisweb.co.uk/livelinks/13687.xlsx.
21. Office for National Statistics. 2011 Census; 2011. Available from: https://www.ons.gov.uk/census/2011census.
22. Office for National Statistics. Employment in the UK; 2019. Available from: https://www.ons.gov.uk/employmentandlabourmarket/peopleinwork/employmentandemployeetypes/bulletins/employmentintheuk/december2019.
23. Office for National Statistics. Highest level of qualification achieved by people living in UK regions, 2010 to 2018; 2019. Available from: https://www.ons.gov.uk/peoplepopulationandcommunity/educationandchildcare/adhocs/10516highestlevelofqualificationachievedbypeoplelivinginukregions2010to2018.
24. Office for National Statistics. Population estimates by marital status and living arrangements, England and Wales; 2019. Available from: https://www.ons.gov.uk/peoplepopulationandcommunity/populationandmigration/populationestimates/datasets/populationestimatesbymaritalstatusandlivingarrangements.
25. Office for National Statistics. Population estimates for the UK, England and Wales, Scotland and Northern Ireland: mid-2018; 2019. Available from: https://www.ons.gov.uk/peoplepopulationandcommunity/populationandmigration/populationestimates/bulletins/annualmidyearpopulationestimates/latest.
26. Janssen B, Szende A; Population norms for the EQ-5D. Self-Reported Population Health: An International Perspective Based on EQ-5D. Springer Nature; 2014:19–30.
27. Goodwin E, Green C, Hawton A. What difference does it make? A comparison of health state preferences elicited from the general population and from people with multiple sclerosis. Value Health. 2020;23(2):242–250. doi:10.1016/j.jval.2019.08.009
28. Castejón N, Cappelleri JC, Cuervo J, et al. Social preferences for health states associated with acute myeloid leukemia for patients undergoing treatment in the United Kingdom. Health Qual Life Outcomes. 2018;16(1):1–9. doi:10.1186/s12955-018-0897-8
29. Czoski-Murray C, Carlton J, Brazier J, Young T, Papo NL, Kang HK. Valuing condition-specific health states using simulation contact lenses. Value Health. 2009;12(5):793–799. doi:10.1111/j.1524-4733.2009.00527.x
30. Rentz AM, Kowalski JW, Walt JG, et al. Development of a preference-based index from the national eye institute visual function questionnaire-25. JAMA Ophthalmol. 2014;132(3):310–318. doi:10.1001/jamaophthalmol.2013.7639
31. Brown MM, Brown GC, Sharma S, Shah G. Utility values and diabetic retinopathy. Am J Ophthalmol. 1999;128(3):324–330. doi:10.1016/S0002-9394(99)00146-4
32. Brown MM, Brown GC, Sharma S, Busbee B. Quality of life associated with visual loss: a time tradeoff utility analysis comparison with medical health states. Ophthalmology. 2003;110(6):1076–1081. doi:10.1016/S0161-6420(03)00254-9
33. National Institute for Health and Care Excellence. Voretigene neparvovec for treating inherited retinal dystrophies caused by RPE65 gene mutations; 2019. Available from: https://www.nice.org.uk/guidance/hst11.
34. Na KH, Kim HJ, Kim KH, et al. Prevalence, age at diagnosis, mortality, and cause of death in retinitis pigmentosa in Korea-A nationwide population-based study. Am J Ophthalmol. 2017;176:157–165. doi:10.1016/j.ajo.2017.01.014
35. Prem Senthil M, Khadka J, Pesudovs K. Seeing through their eyes: lived experiences of people with retinitis pigmentosa. Eye. 2017;31(5):741–748. doi:10.1038/eye.2016.315
36. Haute Autorité de Santé. Choices in methods for economic evaluation; 2012. Available from: https://www.has-sante.fr/upload/docs/application/pdf/2012-10/choices_in_methods_for_economic_evaluation.pdf.
37. Institute for Clinical and Economic Review. Voretigene neparvovec for biallelic RPE65-mediated retinal disease: effectiveness and value - final evidence report; 2018. Available from: https://icer.org/wp-content/uploads/2020/10/MWCEPAC_VORETIGENE_FINAL_EVIDENCE_REPORT_02142018.pdf.
38. Tolley K What are health utilities? 2009. Available from: http://www.bandolier.org.uk/painres/download/What%20is%202009/What_are_health_util.pdf.
39. Brazier J, Rowen D, Karimi M, Peasgood T, Tsuchiya A, Ratcliffe J. Experience-based utility and own health state valuation for a health state classification system: why and how to do it. Eur J Health Econ. 2018;19(6):881–891. doi:10.1007/s10198-017-0931-5
 © 2023 The Author(s). This work is published and licensed by Dove Medical Press Limited. The full terms of this license are available at https://www.dovepress.com/terms.php and incorporate the Creative Commons Attribution - Non Commercial (unported, v3.0) License.
By accessing the work you hereby accept the Terms. Non-commercial uses of the work are permitted without any further permission from Dove Medical Press Limited, provided the work is properly attributed. For permission for commercial use of this work, please see paragraphs 4.2 and 5 of our Terms.
© 2023 The Author(s). This work is published and licensed by Dove Medical Press Limited. The full terms of this license are available at https://www.dovepress.com/terms.php and incorporate the Creative Commons Attribution - Non Commercial (unported, v3.0) License.
By accessing the work you hereby accept the Terms. Non-commercial uses of the work are permitted without any further permission from Dove Medical Press Limited, provided the work is properly attributed. For permission for commercial use of this work, please see paragraphs 4.2 and 5 of our Terms.