")
Back to Journals » Clinical Epidemiology » Volume 14
Elevated Uric Acid Mediates the Effect of Obesity on Hypertension Development: A Causal Mediation Analysis in a Prospective Longitudinal Study
Authors Hong C, Zhang Q, Chen Y, Lu Y, Chen L , He Y, Li J, Ma S , Jiang J, Zhang X , Hu J, Ding Y, Zhang M , Peng H
Received 21 February 2022
Accepted for publication 5 April 2022
Published 11 April 2022 Volume 2022:14 Pages 463—473
DOI https://doi.org/10.2147/CLEP.S363429
Checked for plagiarism Yes
Review by Single anonymous peer review
Peer reviewer comments 2
Editor who approved publication: Dr Eyal Cohen
Conglin Hong,1,* Qiu Zhang,2,* Yan Chen,3,* Ying Lu,1 Linan Chen,1 Yan He,1 Jing Li,1 Shengqi Ma,1 Jun Jiang,4 Xiaolong Zhang,4 Jianwei Hu,5 Yi Ding,6 Mingzhi Zhang,1 Hao Peng1,7
1Department of Epidemiology, School of Public Health, Suzhou Medical College of Soochow University, Suzhou, People’s Republic of China; 2Department of Chronic Disease, Gusu Center for Disease Prevention and Control, Suzhou, People’s Republic of China; 3Department of Nephrology, The Affiliated Jiangyin Hospital of Southeast University Medical College, Jiangyin, People’s Republic of China; 4Department of Tuberculosis Control, Suzhou Center for Disease Control and Prevention, Suzhou, People’s Republic of China; 5Department of Central Office, Maternal and Child Health Bureau of Kunshan, Suzhou, People’s Republic of China; 6Department of Preventive Medicine, College of Clinical Medicine, Suzhou Vocational Health College, Suzhou, People’s Republic of China; 7Jiangsu Key Laboratory of Preventive and Translational Medicine for Geriatric Diseases, Suzhou, People’s Republic of China
*These authors contributed equally to this work
Correspondence: Hao Peng; Mingzhi Zhang, Department of Epidemiology, School of Public Health, Medical College of Soochow University, 199 Renai Road, Industrial Park District, Suzhou, 215123, People’s Republic of China, Tel +86 512 6588 0078; 86 512 6588 0079, Email [email protected]; [email protected]
Objective: Although elevated uric acid is associated with obesity and considered a predictor of hypertension, the causal linkage between the three metabolic conditions is not very clear. We aim to examine whether elevated uric acid mediates the effects of obesity on hypertension development.
Methods: A total of 1984 participants (mean aged 53 years, 62.10% female) with repeated measurements of obesity, blood pressure, and uric acid 4 years apart in the Gusu cohort were included. We first applied cross-lagged panel analysis and bidirectional association analysis to delineate the temporal association between obesity and hyperuricemia. Then, a causal mediation model was constructed to further examine the causal role of hyperuricemia in the linkage between obesity and hypertension. Age, sex, education, cigarette smoking, alcohol consumption, fasting blood glucose, and lipids were adjusted.
Results: The cross-lagged panel analysis demonstrated that the relationship from baseline obesity to follow-up hyperuricemia was stronger than that from baseline hyperuricemia to follow-up obesity (β: 0.09 vs 0.06, P< 0.01 for BMI, β: 0.13 vs 0.07, P< 0.01 for WC). Bidirectional association analysis found that baseline obesity predicted the risk of incident hyperuricemia (OR = 1.09, P< 0.01 for BMI, OR = 1.05, P< 0.01 for WC), but the other directional association was not statistically significant (all P> 0.05). The causal mediation analysis found that hyperuricemia partially mediated the association of baseline BMI (mediate proportion: 3.09%, 95% CI: 0.97%∼ 6.00% for SBP, 3.74%, 95% CI: 1.55%∼ 7.00% for DBP) and baseline WC (mediate proportion: 5.56%, 95% CI: 2.01%∼ 11.00% for SBP, 5.81%, 95% CI: 2.59%∼ 10.00% for DBP) with follow-up blood pressures.
Conclusion: Obesity preceded hyperuricemia and the latter partially mediated the relationship between obesity and hypertension, independent of behavioral and other metabolic factors.
Keywords: bidirectional association analysis, causal mediation analysis, cross-lagged panel analysis, blood pressures, temporal relationship, uric acid, obesity
Introduction
Attributable risk estimates from large epidemiological studies suggest that obesity may be responsible for at least 40% of the risk of hypertension,1 but clinical trials found a much smaller effect size – only about 10–15% of hypertensive incidents could be prevented by weight loss interventions, eg, bariatric surgery.2 A better understanding of the underlying mechanisms would improve the prevention and control of hypertension for individuals with obesity. It is widely believed that purine metabolism has been associated with both obesity and hypertension, and may thereby participate in the causal effect of obesity on blood pressure regulation.3–5 As the final enzyme product of purine metabolism, uric acid (UA) levels in serum have been associated with many diseases,6 including metabolic syndrome,7 diabetes mellitus,8 dyslipidemia,9 chronic kidney disease,10 and liver dysfunctions.11 Recent studies have demonstrated that serum UA levels are also associated with obesity6,12 and are considered a predictor of cardiovascular disorders13 including hypertension.14,15 However, the causal linkages between the three metabolic conditions are not very clear. For example, some observational studies, including our previous Mendelian Randomization study,16 found that obesity proceeded with elevation of serum UA, whereas some others found that uric acid levels can predict subsequent weight gain.17,18 Although numerous trials have found that weight loss interventions can result in a decrease in UA for participants with obesity,19–21 whether strategies for lowering uric acid can reduce weight for participants with hyperuricemia is unknown. These findings may suggest a bidirectional effect between obesity and elevated UA but lack epidemiological evidence. On the other hand, although trials did not find a consistent result,22,23 almost all observational studies suggest that elevation of UA proceeded with the incidence of hypertension.15,24–26 All these findings indicate that elevated UA may cross-talk with obesity during hypertension. Mediation analysis is typically used to interpret molecular mechanisms and potential causal associations in epidemiological studies27 and therefore could be applicable to delineate the causal associations amongst obesity, hyperuricemia, and hypertension. While this mediation has not yet been studied in humans, it is critical for precision medicine of hypertension. Therefore, leveraging a prospective longitudinal study of Chinese adults in the Gusu cohort, we aimed to examine (1) the temporal and bidirectional association between obesity and hyperuricemia and (2) the mediating effect of uric acid on the association between obesity and hypertension or the mediating effect of obesity on the association between hyperuricemia and hypertension.
Methods
Study Participants
The Gusu cohort is a community-based, prospective longitudinal study that aimed to identify new risk factors for cardiovascular disease (CVD) in Chinese adults. The study design and participants’ recruitment have been detailed previously.28 In brief, a total of 2,498 community members over 30 years old and free of overt CVD were included from eight randomly selected communities in the baseline examination in 2010 (phase 1). Of them, all surviving participants were invited to participate in the follow-up examination in 2014 (Phase 2) where some behavior and metabolic factors were repeatedly measured. The protocols of the Gusu cohort were approved by the Soochow University Ethics Committee. Written informed consent was obtained from all study participants. This research was conducted ethically following the World Medical Association Declaration of Helsinki.
Figure 1 shows the selection of study participants in the current study. After excluding participants who died (N = 24), had missing data on obesity measurements or serum UA (N = 3), and were denied to participate in the follow-up examination (N = 487), 1984 participants with repeated measurements of obesity and serum UA 4 years apart were finally included in the current study.
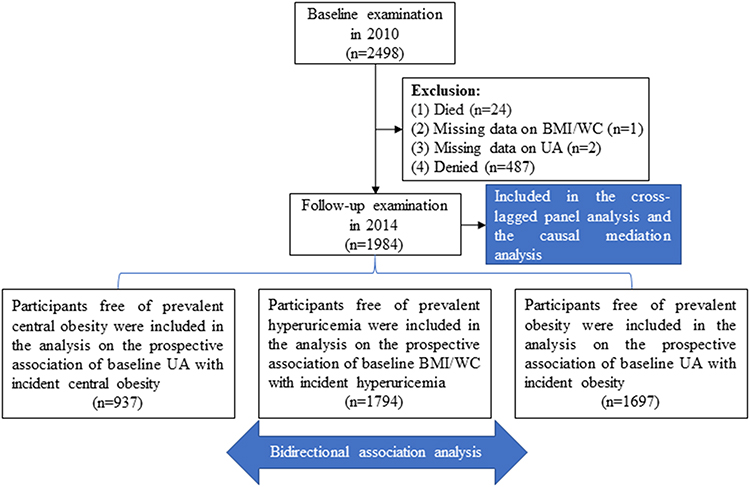 |
Figure 1 A flowchart illustrating the selection of study participants and the statistical plan. |
Measurement of BMI/WC and Definition of Obesity/Central Obesity
Anthropometry was provided for all participants at baseline and follow-up examinations. Body weight and height were measured using a regularly calibrated stadiometer and balance-beam scale with participants wearing light clothing and no shoes. Body mass index (BMI) was calculated as weight in kilograms divided by height in meters squared. Waist circumference (WC) was measured at 1 cm above the umbilicus. Hip circumference was measured around the widest portion of the buttocks, with the tape parallel to the floor. Obesity was defined as BMI ≥28 kg/m2 and central obesity was defined as WC >85 cm for men and as WC >80 cm for women, based on the recommendations of the Working Group on Obesity in China.29
Measurement of Serum Uric Acid and Definition of Hyperuricemia
At both examinations, blood samples were obtained from venipuncture after fasting for at least 8 hours. UA in serum was measured enzymatically on Hitachi 7020 Automatic Biochemical Analyzer using a commercial reagent (FUJIFILM, Japan). Hyperuricemia was commonly defined as serum UA >420μmol/L for men and >360μmol/L for women. This definition has been commonly used in prior studies.30
Measurement of Blood Pressure and Definition of Hypertension
Blood pressure is measured using a mercury sphygmomanometer based on the international standard measurement method. Three consecutive blood pressure measurements with an interval of about 30 seconds were performed for participants in a sitting position.31 The average of the three measurements was calculated as the systolic blood pressure (SBP) and diastolic blood pressure (DBP) of participants. Hypertension has been defined as SBP ≥140 mmHg and/or DBP ≥90 mmHg or use of antihypertensive medication in the past 2 weeks.31
Assessment of Risk Factors of Hypertension
Sociodemographic data, including age, sex and education level, were obtained by questionnaires administered by trained staff. Cigarette smoking was classified as current smoking or not. Current smoking was defined as having smoked at least 100 cigarettes in one’s life, smoking frequently, and smoking currently. Alcohol consumption was classified as current drinkers or not. Current drinkers are those who have been drinking in the past year. Fasting blood glucose and lipids, including total cholesterol, triglyceride, high-density lipoprotein cholesterol (HDL-C), and low-density lipoprotein cholesterol (LDL-C), were analyzed enzymatically on a Hitachi 7020 automatic biochemical analyzer using commercial reagents (FUJIFILM, Japan) using standard laboratory methods.28
Statistical Analysis
To delineate the causal role of hyperuricemia in the link between obesity and hypertension, as illustrated in Figure 1, we first applied cross-lagged panel analysis and bidirectional association analysis to examine the temporal association between obesity and hyperuricemia. Then, we applied causal mediation analysis to further help causal inference for the role of hyperuricemia in the association between obesity and hypertension. All statistical analyses were performed using R version 4.0.5. A 2-tailed P value less than 0.05 is considered statistically significant.
Cross-Lagged Panel Analysis
To examine the temporal association between obesity and hyperuricemia, the repeated measurements of BMI/WC and serum UA were first standardized with Z-transformation (mean = 0, SD = 1) and the generated values were then used to construct a cross-lagged panel analysis model. In this model, Pearson correlation coefficients and cross-lagged path coefficients were examined, adjusting for age, sex, education level, cigarette smoking, alcohol consumption, fasting glucose, LDL-C, and HDL-C. The validity of model fitting was represented by the root mean square residual (RMSR) and comparative fit index (CFI). The cross-lagged panel analysis was performed by the “lavaan” R package.32 The rationale for using the cross-lagged panel analysis model here is that this model can simultaneously examine reciprocal and longitudinal relationships among a series of interrelated variables.
Bidirectional Association Analysis
To further examine whether hyperuricemia at baseline predicts the risk of obesity during follow-up, we constructed a logistic regression model in a subsample of participants free of obesity at baseline, in which incident obesity during follow-up was the dependent variable and baseline hyperuricemia (continuous UA or categorized as normal versus hyperuricemia) was the independent variable, adjusting for the confounding factors listed above as well as baseline BMI. The association between hyperuricemia at baseline and incident central obesity during follow-up was similarly examined in participants free of central obesity at baseline. To examine other directional associations between baseline obesity/central obesity and incident hyperuricemia during follow-up, a similar logistic regression model was constructed for participants free of hyperuricemia at baseline.
Causal Mediation Analysis
Once the temporal relationship between obesity and hyperuricemia was established, a causal mediation model was applied to infer the causation of obesity and hyperuricemia in hypertension development. To examine whether hyperuricemia linked obesity with hypertension, we constructed a causal mediation model with baseline BMI/WC (after Z-transformation) as the predictor, serum UA (after Z-transformation) at follow-up examine as the mediator, and SBP/DBP at follow-up examination as the outcome. The causal mediation analysis was performed using the R package “mediation”,33 adjusting for covariates listed above.
Results
Baseline Characteristics of Study Participants
Our analysis included 1984 participants (mean aged 53 years, 62.10% female), including 190 (9.58%), 287 (14.47%), and 1047 (52.77%) participants with hyperuricemia, obesity, and central obesity at baseline. Their clinical characteristics at baseline and follow-up examinations are shown in Table 1. The levels of serum UA were significantly increased after an average of 4 years of follow-up (mean: 276.12 vs 315.62 mmol/L, P<0.01). The levels of other biochemical parameters such as fasting glucose, triglyceride and LDL-C were also significantly increased after an average of 4 years of follow-up (all P<0.05). We did not find significant changes in BMI or WC between the baseline and follow-up examinations.
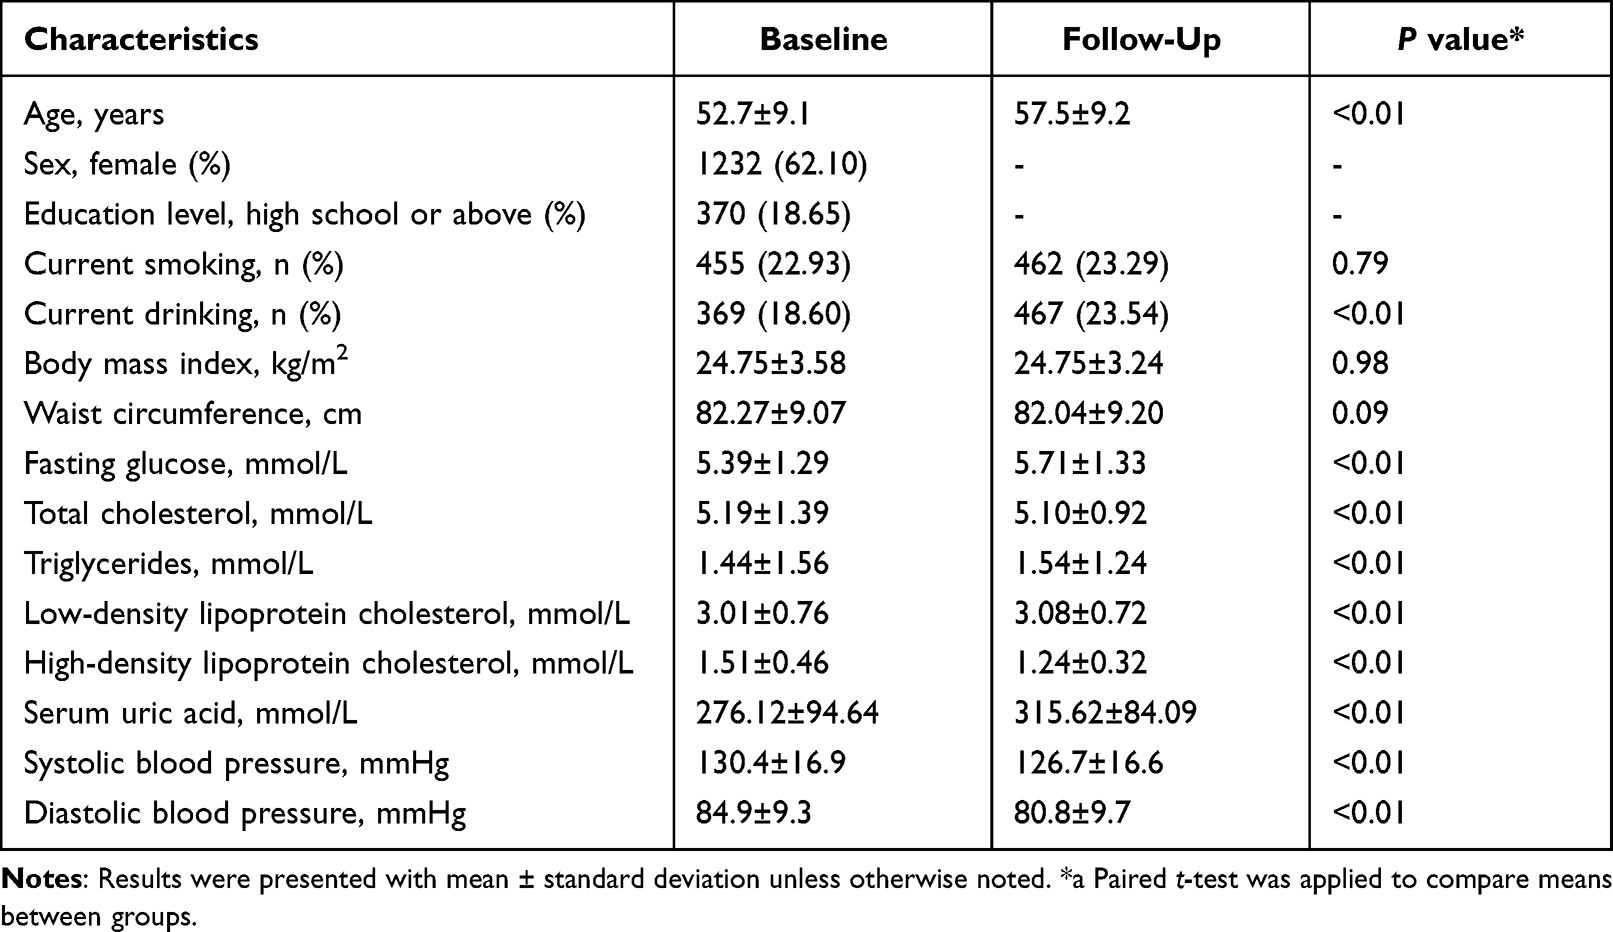 |
Table 1 Baseline Characteristics of Study Participants in the Gusu Cohort (n = 1984) |
Temporal Relationship Between Obesity/Central Obesity and Hyperuricemia
As illustrated in Figure 2A, there was a significant correlation between BMI and serum UA at baseline (r=0.25, P<0.05). After adjusting for age, sex, education level, cigarette smoking, alcohol consumption, LDL-C, HDL-C, and fasting glucose, the cross-lagged path coefficients from baseline serum UA to follow-up BMI (β1=0.06, P<0.01) and from baseline BMI to follow-up serum UA (β2=0.09, P<0.01) were all significant, but the later seemed to be larger. This model was fitted well in our sample, as indicated by the RMSR and CFI of 0.009 and 0.978, respectively. This result may indicate that obesity precedes hyperuricemia. The cross-lagged panel analysis regarding WC and serum UA also found a similar phenomenon (Figure 2B). After adjusting for the above confounding variables, the cross-lagged path coefficient from baseline WC to follow-up serum UA (β2=0.13, P<0.01) was also significantly larger than that from baseline serum UA to follow-up WC (β1=0.07, P<0.01). This model was also well fitted as indicated by the RMSRand CFI of 0.007 and 0.987.
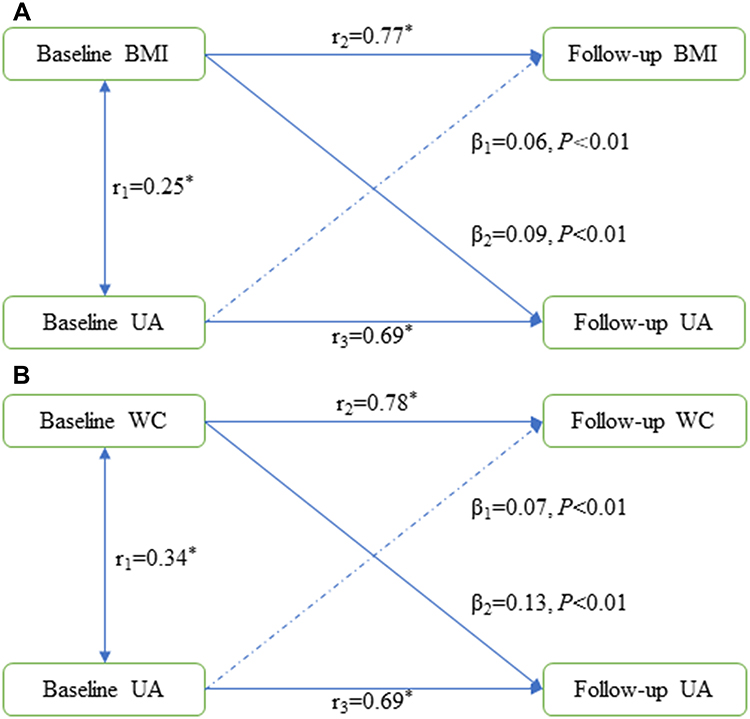 |
Figure 2 An illustration of the cross-lagged panel analysis models for the temporal associations of BMI (A) and WC (B) with serum UA, adjusting for age, sex, education level, cigarette smoking, alcohol consumption, low-density lipoprotein, high-density lipoprotein, and fasting glucose. All values were standardized with Z-transformation. The goodness of fit test: RMSR=0.009 and CFI=0.978 for BMI and RMSR=0.007 and CFI=0.987 for WC. β1 and β2 indicate cross-lagged path coefficients. r1 indicates a synchronous correlation. r2 and r3 indicate tracking correlations. *P < 0.05. Abbreviations: UA, uric acid; BMI, body mass index; WC, waist circumference; RMSR, root mean square residual; CFI, comparative fit index. |
Baseline Obesity/Central Obesity Predicted Incident Hyperuricemia
Of the 1794 participants free of hyperuricemia at baseline, 218 participants developed new hyperuricemia after an average of 4 years of follow-up. They had a significantly higher level of BMI (25.87 vs 24.33, P<0.01) and WC (86.83 vs 81.03, P<0.01) at baseline than those who remained free of hyperuricemia during follow-up. As shown in Table 2, participants with a higher level of BMI at baseline were more likely to develop hyperuricemia during follow-up (OR = 1.09, P<0.01). Compared to participants with a normal BMI at baseline, those with obesity at baseline had a 106% higher risk of developing hyperuricemia (OR = 2.06, P<0.01). A higher level of WC at baseline was also significantly associated with a higher risk of hyperuricemia development during follow-up (OR = 1.05, P<0.01). Participants with central obesity at baseline had a 51% higher risk of hyperuricemia (OR = 1.51, P<0.01) than those with a normal WC at baseline.
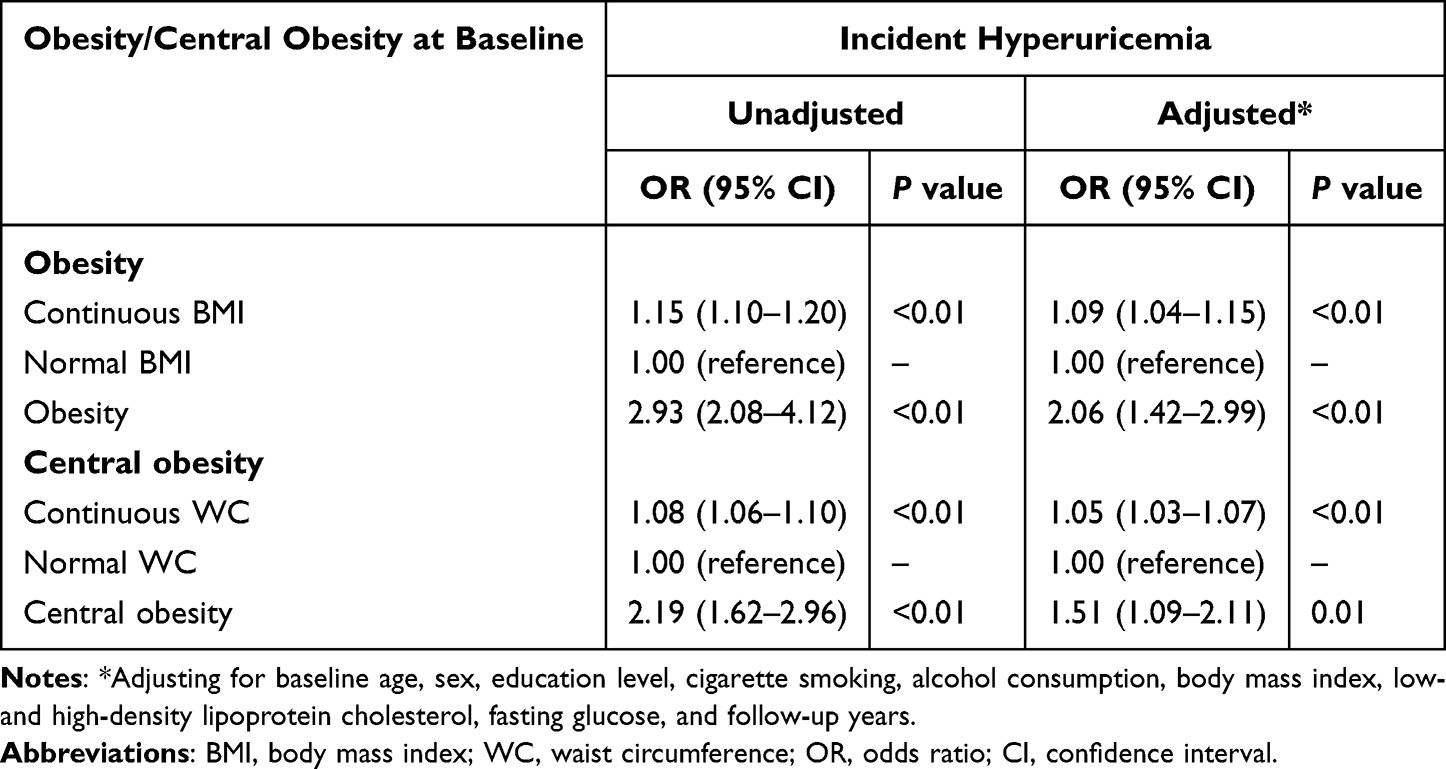 |
Table 2 Prospective Associations of Obesity and Central Obesity at Baseline with Hyperuricemia Development During Follow-Up (n = 1794) |
Baseline Hyperuricemia Did Not Predict Incident Obesity or Central Obesity
Of the 1697 participants with a normal BMI at baseline, 96 participants developed new obesity at the follow-up examination. There was a significant difference in serum UA at baseline between participants who developed obesity and those who did not (307.39 vs 266.62, P<0.01). Nevertheless, we did not find a significant association between baseline serum UA and obesity (Table 3, P>0.05). Similarly, 96 of the 937 participants with a normal WC at baseline developed new central obesity at the follow-up examination. We failed to find a significant association between serum UA at baseline and central obesity at follow-up (P>0.05).
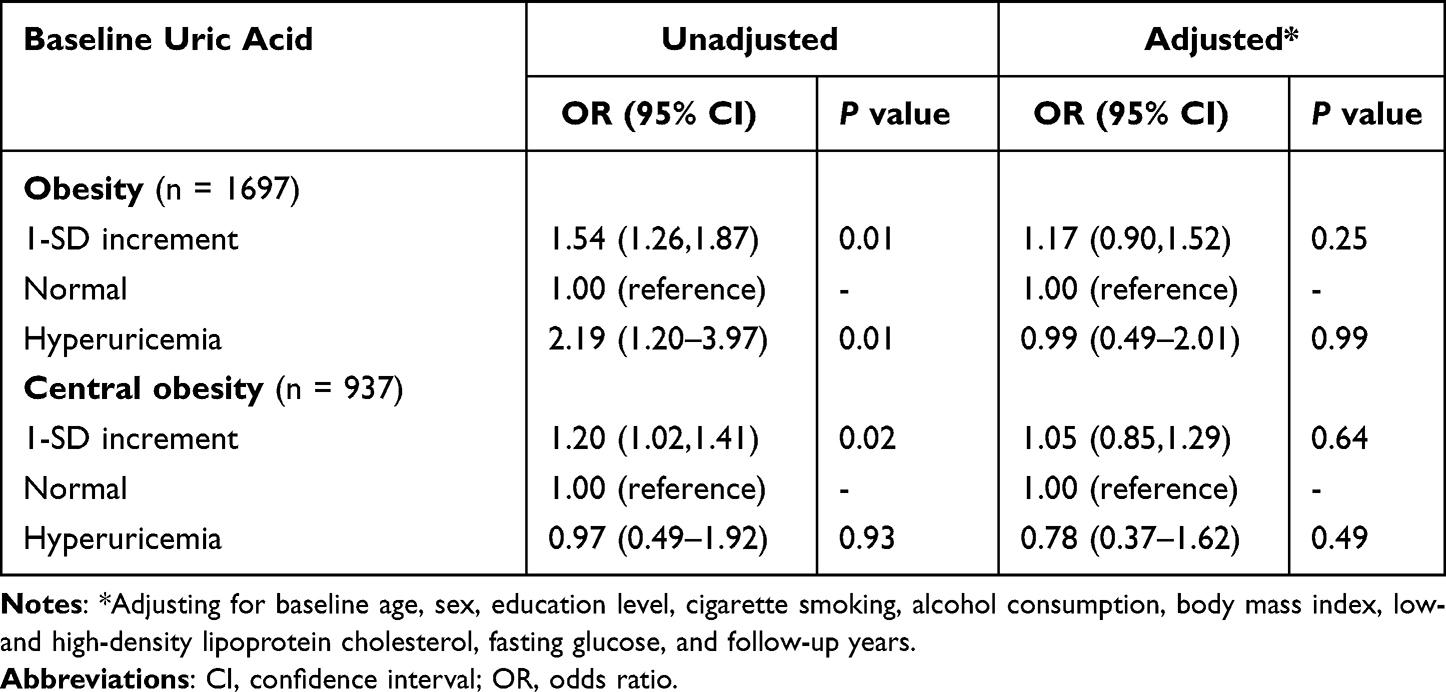 |
Table 3 Prospective Associations of Hyperuricemia with Obesity and Central Obesity Development During Follow-Up |
Results of Causal Mediation Analysis
Results from cross-lagged panel analysis and bidirectional association analysis showed that hyperuricemia may be a consequence caused by obesity and central obesity. Here, we further examined whether hyperuricemia mediated the association between obesity/central obesity and hypertension. As shown in Figure 3, after adjusting for confounding variables including age, sex, education level, cigarette smoking, alcohol consumption, fasting glucose, LDL-C, and HDL-C, about 3.09% (95% CI: 0.97–6.00%) of the total effect of baseline BMI on the follow-up SBP (βtot=3.26, 95% CI: 2.56–3.96) was mediated by follow-up UA (βmed=0.10, 95% CI: 0.03–0.19). Approximately 3.74% (95% CI: 1.55–7.00%) of the relationship between baseline BMI and follow-up DBP (βtot=2.05, 95% CI: 1.62–2.48) was mediated by follow-up UA (βmed=0.08, 95% CI: 0.03–0.14).
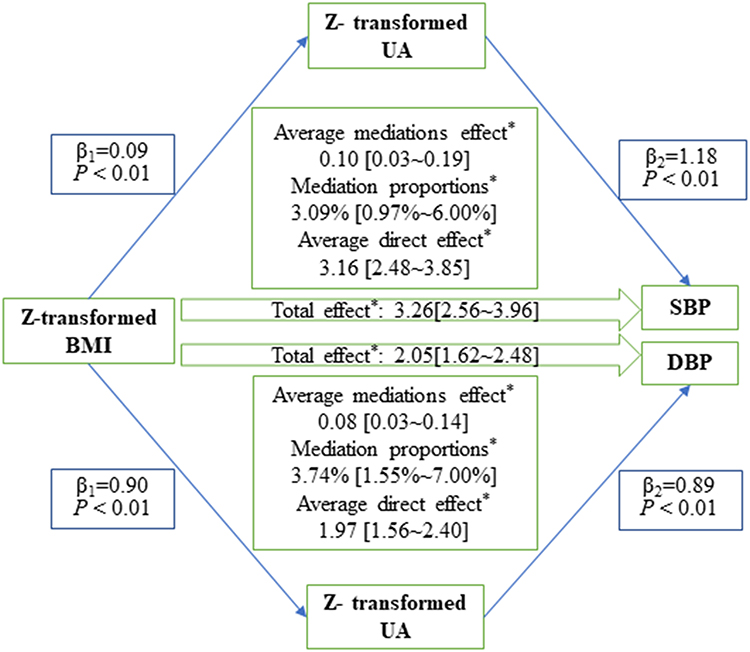 |
Figure 3 A schematic illustration of the causal mediating effect of serum uric acid on the association between baseline BMI and follow-up blood pressures, adjusting for age, sex, education level, cigarette smoking, alcohol consumption, fasting glucose, high-density lipoprotein, and low-density lipoprotein. *P<0.05. Abbreviations: BMI, body mass index; SBP, systolic blood pressure; DBP, diastolic blood pressure. |
Similarly, as shown in Figure 4, serum UA at follow-up mediated about 5.56% (95% CI: 2.01–11.00%) and 5.81% (95% CI: 2.59–10.00%) of the total effect of baseline WC on the follow-up SBP and DBP, respectively.
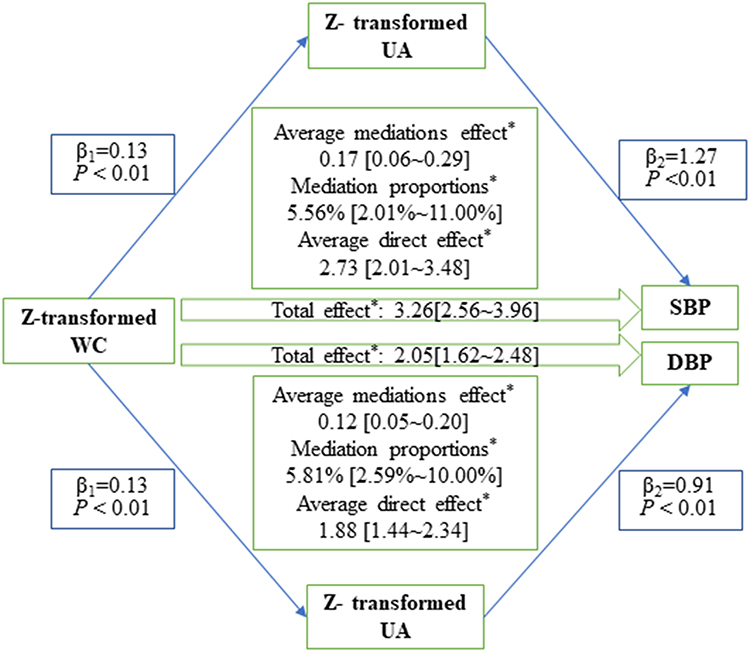 |
Figure 4 A schematic illustration of the causal mediating effect of serum uric acid on the association between baseline WC and follow-up blood pressures, adjusting for age, sex, education level, cigarette smoking, alcohol consumption, fasting glucose, high-density lipoprotein, and low-density lipoprotein. *P<0.05. Abbreviations: WC, waist circumference; SBP, systolic blood pressure; DBP, diastolic blood pressure. |
Discussion
For a large sample of participants who had repeated measurements of obesity, UA, and blood pressure 4 years apart participating in a prospective longitudinal study, we systematically examined for the first time the temporal consequence between obesity and hyperuricemia, as well as their causal roles in hypertension. Specifically, we first applied cross-lagged panel analysis and bidirectional association analysis to delineate the temporal association between obesity and hyperuricemia. The results suggested that obesity and central obesity preceded the development of hyperuricemia. Then, we further examined the causal role of hyperuricemia in the linkage between obesity and hypertension using causal mediation analysis. The results showed that the causal effects of obesity and central obesity on elevated blood pressure were partially mediated through the elevation of serum UA. In light of these findings, obesity may deliver its cardiovascular effect, at least in part, by affecting purine metabolism. Strategies against hyperuricemia may be of usefulness in improving the prevention and control of cardiovascular disease for participants with obesity or central obesity, but further evidence is still needed.
Although the cross-sectional association between UA and obesity has been widely reported in various pulsations,34 the temporal relationship between obesity and hyperuricemia has not been studied very well. In line with our study, the observed temporal relationship between obesity and hyperuricemia was also demonstrated in previous studies. For example, a prospective cohort study including 2,611 young adults found that a higher level of BMI and WC at baseline significantly predicted an elevation of UA during 10 years of follow-up in both blacks and whites.35 A pilot trial including 60 patients with type 2 diabetes and morbid obesity (BMI ≥35 kg/m2) found that the prevalence of hyperuricemia reduced from 83% to 33% 1 year after laparoscopic sleeve gastrectomy.36 Another pilot trial, which included thirteen white men with acute intermittent gout, found that 16 weeks of low-calorie diet intervention resulted in a significant weight loss and serum UA reduction.37 A real-world study including 4,047 obese participants further demonstrated the effect of weight loss on hyperuricemia, where the incidence of hyperuricemia was significantly lower in the bariatric surgery group than that in the conventional treatment group after 2 (surgery vs control, 4% vs 16%, P<0.01) and 10 (surgery vs control, 17% vs 28%, P<0.01) years of post-treatment follow-up.2 Although some prospective cohort studies found that UA levels at baseline could predict the future risk of obesity,17,24 our study suggested that obesity was more likely to precede the elevation of UA. Also, our group previously demonstrated the causal effect of obesity on hyperuricemia by using a Mendelian Randomization analysis based on summary data.16 Our results, together with findings of previous studies, increased the probability of the causal effect of obesity on hyperuricemia.
In line with our study, a prospective association between increased levels of UA and hypertension has also been found in many populations.38 Considering the causal role of increased UA or hyperuricemia in the development of hypertension as demonstrated by randomized clinical trials,22,39 we speculated that hyperuricemia may mediate, at least in part, the contribution of obesity to hypertension. However, the mediation effect of hyperuricemia or elevation of UA on the relationship between obesity and hypertension remains largely unknown. Our study is the first to examine the mediation of hyperuricemia in the causal association between obesity and hypertension, leveraging a prospective longitudinal study design. Results of the causal mediation analysis showed that elevation of serum uric acid partially mediated the association between increased BMI/WC level at baseline and elevation of blood pressure during follow-up. These results may suggest that obesity and central obesity cause the development of hypertension partially through dysregulating the metabolism of uric acid. As expected, the elevation of UA preceded the elevation of blood pressure in our study participants (Supplementary Figure S1). In light of these findings, dysregulation of uric acid metabolism may already occur in individuals with obesity and central obesity, before the development of hypertension. Serum UA levels may therefore need to be monitored and controlled in individuals with obesity or central obesity, to improve the prevention and control of hypertension.
The mechanisms underlying the mediation observed in our study merit discussion and a better understanding of them would definitely improve the management and prevention of hypertension, especially for individuals with obesity. Obese individuals are usually complicated with other metabolic disorders, which can also increase UA concentrations.40,41 Upon the elevation of serum uric acid develops into hyperuricemia, uric acid crystals can deposit on vascular endothelial cells and directly induce the injury of vascular endothelial cells, which can lead to the deposition of lipids in blood under the damaged endothelial cells and induce atherosclerosis.42 In addition, obesity is often caused by excessive caloric intake and sufficient energy supply for purine synthesis, resulting in increased uric acid production. After abnormal UA metabolism, uric acid crystals can damage the intima of arterioles and lead to arteriosclerosis, reducing renal blood flow, and then induce the activation of the renin-angiotensin-aldosterone system (RAAS), causing vascular smooth muscle proliferation and leading to hypertension.43 Admittedly, elevated uric acid only mediated a very small proportion (around 5%) of the contributing effect of obesity and central obesity on the risk of hypertension. Other mechanisms beyond uric acid metabolism may be involved in the causality between obesity and hypertension. For example, visceral adiposity plays a central role in hypertension through a greater release of free fatty acid in systemic circulation and a consequent increase in insulin resistance and hyperinsulinemia.44 These changes are firmly related to augmented arterial stiffness and a decrease in vasodilation.45
The strengths of this study include the prospective longitudinal study design, comprehensive measurement and adjustment of potential confounding factors, and systemic analyses to delineate the temporal and causal relationships amongst obesity, hyperuricemia, and hypertension. Specifically, we first applied the cross-lagged panel analysis in combination with bidirectional association analysis to examine the temporal consequence between obesity and hyperuricemia, followed by a causal mediation analysis to delineate their causal effect on hypertension. In addition, there are also some limitations in our study. First, we only included Chinese adults in our study. The generalizability of our results in populations with other ethnic backgrounds and younger ages is uncertain. Second, as with all observational studies, residual confounding may exist in our study. Although causal mediation analysis revealed a probable causal relationship between obesity and hyperuricemia, whether obesity is a risk factor for hyperuricemia still needs evidence from clinical trials.
Conclusions
Our study found that obesity and central obesity preceded the elevation of serum uric acid, and the latter partially mediated the relationship between obesity/central obesity and hypertension, independent of behavioral and other metabolic factors. In light of these findings, dysregulated uric acid metabolism may already occur in participants with obesity or central obesity, before the development of hypertension. Serum uric acid may need to be monitored and controlled for individuals with obesity, to prevent the development of hypertension. Nevertheless, the effectiveness of strategies against hyperuricemia in hypertension warranted further investigation.
Acknowledgments
We gratefully acknowledge the cooperation and participation of the members of the Gusu cohort. We especially thank the clinical staff at all participating hospitals for their support and contribution to this project. Without their contribution, this research would not have been possible. The datasets used during the current study are available from the corresponding author on a reasonable request.
Funding
This study was supported by the National Natural Science Foundation of China (NO. 82173596, 81903384, and 81872690), the Suzhou Municipal Science and Technology Bureau (NO. SKJY2021040 and SYS2020091), the Youth Program of Science and Technology for Invigorating Health through Science and Education in Suzhou (NO. KJXW2020084, KJXW2019067, and KJXW2018078), Suzhou Key Technologies for Prevention and Control of Major Diseases and Infectious Diseases (NO. GWZX202001), the Maternal and Child Health Project of Jiangsu Province (NO. F201721), Scientific Research Project of Jiangsu Health Committee (NO. M2020051), Natural Science Research Projects of Colleges and Universities in Jiangsu Province (NO. 20KJB330004), Key Natural Science Projects of Suzhou Vocational Health College (NO. SZWZY202002), and a Project of the Priority Academic Program Development of Jiangsu Higher Education Institutions.
Disclosure
The authors report no conflicts of interest in this work.
References
1. Garrison RJ, Kannel WB, Stokes J, Castelli WP. Incidence and precursors of hypertension in young adults: the Framingham Offspring Study. Prev Med. 1987;16:235–251. doi:10.1016/0091-7435(87)90087-9
2. Sjostrom L, Lindroos AK, Peltonen M, et al.; Swedish Obese Subjects Study Scientific G. Lifestyle, diabetes, and cardiovascular risk factors 10 years after bariatric surgery. N Engl J Med. 2004;351(26):2683–2693. doi:10.1056/NEJMoa035622
3. Furuhashi M, Matsumoto M, Murase T, et al. Independent links between plasma xanthine oxidoreductase activity and levels of adipokines. J Diabetes Investig. 2019;10(4):1059–1067. doi:10.1111/jdi.12982
4. Furuhashi M, Matsumoto M, Tanaka M, et al. Plasma xanthine oxidoreductase activity as a novel biomarker of metabolic disorders in a general population. Circ J. 2018;82(7):1892–1899. doi:10.1253/circj.CJ-18-0082
5. Washio KW, Kusunoki Y, Murase T, et al. Xanthine oxidoreductase activity is correlated with insulin resistance and subclinical inflammation in young humans. Metabolism. 2017;70:51–56. doi:10.1016/j.metabol.2017.01.031
6. Russo E, Leoncini G, Esposito P, Garibotto G, Pontremoli R, Viazzi F. Fructose and uric acid: major mediators of cardiovascular disease risk starting at pediatric age. Int J Mol Sci. 2020;21:4479.
7. Ali N, Miah R, Hasan M, et al. Association between serum uric acid and metabolic syndrome: a cross-sectional study in Bangladeshi adults. Sci Rep. 2020;10(1):7841. doi:10.1038/s41598-020-64884-7
8. Haque T, Rahman S, Islam S, Molla NH, Ali N. Assessment of the relationship between serum uric acid and glucose levels in healthy, prediabetic and diabetic individuals. Diabetol Metab Syndr. 2019;11(1):49. doi:10.1186/s13098-019-0446-6
9. Ali N, Rahman S, Islam S, et al. The relationship between serum uric acid and lipid profile in Bangladeshi adults. BMC Cardiovasc Disord. 2019;19(1):42. doi:10.1186/s12872-019-1026-2
10. Costa TEM, Lauar JC, Innecchi MLR, Coelho VA, Moyses RMA, Elias RM. Hyperuricemia is associated with secondary hyperparathyroidism in patients with chronic kidney disease. Int Urol Nephrol. 2022. doi:10.1007/s11255-022-03116-5
11. Molla NH, Kathak RR, Sumon AH, et al. Assessment of the relationship between serum uric acid levels and liver enzymes activity in Bangladeshi adults. Sci Rep. 2021;11(1):20114. doi:10.1038/s41598-021-99623-z
12. Duan Y, Liang W, Zhu L, et al. Association between serum uric acid levels and obesity among university students (China). Nutr Hosp. 2015;31(6):2407–2411. doi:10.3305/nh.2015.31.6.8734
13. Kang T, Hu Y, Huang X, Amoah AN, Lyu Q. Serum uric acid level and all-cause and cardiovascular mortality in peritoneal dialysis patients: a systematic review and dose-response meta-analysis of cohort studies. PLoS One. 2022;17(2):e0264340. doi:10.1371/journal.pone.0264340
14. Ndrepepa G. Uric acid and cardiovascular disease. Clin Chim Acta. 2018;484:150–163. doi:10.1016/j.cca.2018.05.046
15. Wei F, Sun N, Cai C, et al. Associations between serum uric acid and the incidence of hypertension: a Chinese senior dynamic cohort study. J Transl Med. 2016;14(1):110. doi:10.1186/s12967-016-0866-0
16. Yu J, Sun H, Zhu J, et al. Asymptomatic hyperuricemia and metabolically unhealthy obesity: a cross-sectional analysis in the tianning cohort. Diabetes Metab Syndr Obes. 2021;14:1367–1374. doi:10.2147/DMSO.S301363
17. Masuo K, Kawaguchi H, Mikami H, Ogihara T, Tuck ML. Serum uric acid and plasma norepinephrine concentrations predict subsequent weight gain and blood pressure elevation. Hypertension. 2003;42(4):474–480. doi:10.1161/01.HYP.0000091371.53502.D3
18. Han T, Meng X, Shan R, et al. Temporal relationship between hyperuricemia and obesity, and its association with future risk of type 2 diabetes. Int J Obes. 2018;42(7):1336–1344. doi:10.1038/s41366-018-0074-5
19. Zhu Y, Zhang Y, Choi HK. The serum urate-lowering impact of weight loss among men with a high cardiovascular risk profile: the multiple risk factor intervention trial. Rheumatology. 2010;49(12):2391–2399. doi:10.1093/rheumatology/keq256
20. Nicholls A, Scott JT. Effect of weight-loss on plasma and urinary levels of uric acid. Lancet. 1972;300(7789):1223–1224. doi:10.1016/S0140-6736(72)92271-4
21. Yamashita S, Matsuzawa Y, Tokunaga K, Fujioka S, Tarui S. Studies on the impaired metabolism of uric acid in obese subjects: marked reduction of renal urate excretion and its improvement by a low-calorie diet. Int J Obes. 1986;10(4):255–264.
22. Feig DI, Soletsky B, Johnson RJ. Effect of allopurinol on blood pressure of adolescents with newly diagnosed essential hypertension: a randomized trial. JAMA. 2008;300(8):924–932. doi:10.1001/jama.300.8.924
23. Borgi L, McMullan C, Wohlhueter A, Curhan GC, Fisher ND, Forman JP. Effect of uric acid-lowering agents on endothelial function: a randomized, double-blind, placebo-controlled trial. Hypertension. 2017;69(2):243–248. doi:10.1161/HYPERTENSIONAHA.116.08488
24. Kuwabara M, Niwa K, Hisatome I, et al. Asymptomatic hyperuricemia without comorbidities predicts cardiometabolic diseases: five-year Japanese cohort study. Hypertension. 2017;69(6):1036–1044. doi:10.1161/HYPERTENSIONAHA.116.08998
25. Jiang Y, Yu J, Zhang Q, et al. Microalbuminuria mediates the association between serum uric acid and elevation of blood pressure: a longitudinal analysis in the Gusu cohort. J Hypertens. 2020;38(4):625–632. doi:10.1097/HJH.0000000000002316
26. Feig DI, Madero M, Jalal DI, Sanchez-Lozada LG, Johnson RJ. Uric acid and the origins of hypertension. J Pediatr. 2013;162(5):896–902. doi:10.1016/j.jpeds.2012.12.078
27. Richiardi L, Bellocco R, Zugna D. Mediation analysis in epidemiology: methods, interpretation and bias. Int J Epidemiol. 2013;42(5):1511–1519. doi:10.1093/ije/dyt127
28. Liu Y, Peng H, Zhang Q, et al. Association between serum soluble corin and hyperglycaemia: a cross-sectional study among Chinese adults. BMJ Open. 2015;5:e009085.
29. Zhou BF; Cooperative Meta-Analysis Group of the Working Group on Obesity in C. Predictive values of body mass index and waist circumference for risk factors of certain related diseases in Chinese adults–study on optimal cut-off points of body mass index and waist circumference in Chinese adults. Biomed Environ Sci. 2002;15(1):83–96.
30. Zhang ML, Gao YX, Wang X, Chang H, Huang GW. Serum uric acid and appropriate cutoff value for prediction of metabolic syndrome among Chinese adults. J Clin Biochem Nutr. 2013;52(1):38–42. doi:10.3164/jcbn.12-65
31. Lenfant C, Chobanian AV, Jones DW, Roccella EJ. Seventh report of the Joint National Committee on the prevention, detection, evaluation, and treatment of high blood pressure (JNC 7) resetting the hypertension sails. Hypertension. 2003;41(6):1178–1179. doi:10.1161/01.HYP.0000075790.33892.AE
32. Rosseel Y. lavaan: an R package for structural equation modeling. J Stat Softw. 2012;48(2):1–36. doi:10.18637/jss.v048.i02
33. Tingley D, Yamamoto T, Hirose K, Keele L, Imai K. mediation: r Package for Causal Mediation Analysis. J Stat Softw. 2014;59. doi: 10.18637/jss.v059.i05
34. Ali N, Perveen R, Rahman S, et al. Prevalence of hyperuricemia and the relationship between serum uric acid and obesity: a study on Bangladeshi adults. PLoS One. 2018;13(11):e0206850. doi:10.1371/journal.pone.0206850
35. Rathmann W, Haastert B, Icks A, Giani G, Roseman JM. Ten-year change in serum uric acid and its relation to changes in other metabolic risk factors in young black and white adults: the CARDIA study. Eur J Epidemiol. 2007;22(7):439–445. doi:10.1007/s10654-007-9132-3
36. Dalbeth N, Chen P, White M, et al. Impact of bariatric surgery on serum urate targets in people with morbid obesity and diabetes: a prospective longitudinal study. Ann Rheum Dis. 2014;73(5):797–802. doi:10.1136/annrheumdis-2013-203970
37. Dessein PH, Shipton EA, Stanwix AE, Joffe BI, Ramokgadi J. Beneficial effects of weight loss associated with moderate calorie/carbohydrate restriction, and increased proportional intake of protein and unsaturated fat on serum urate and lipoprotein levels in gout: a pilot study. Ann Rheum Dis. 2000;59(7):539–543. doi:10.1136/ard.59.7.539
38. Ali N, Mahmood S, Islam F, et al. Relationship between serum uric acid and hypertension: a cross-sectional study in Bangladeshi adults. Sci Rep. 2019;9(1):9061. doi:10.1038/s41598-019-45680-4
39. Gunawardhana L, McLean L, Punzi HA, Hunt B, Palmer RN. Whelton A, Feig DI. effect of febuxostat on ambulatory blood pressure in subjects with hyperuricemia and hypertension: a phase 2 randomized placebo-controlled study. J Am Heart Assoc. 2017;6:e006683.
40. de Oliveira EP, Burini RC. High plasma uric acid concentration: causes and consequences. Diabetol Metab Syndr. 2012;4(1):12. doi:10.1186/1758-5996-4-12
41. Li C, Hsieh MC, Chang SJ. Metabolic syndrome, diabetes, and hyperuricemia. Curr Opin Rheumatol. 2013;25(2):210–216. doi:10.1097/BOR.0b013e32835d951e
42. Bagheri B, Zargari M, Meshkini F, et al. Uric acid and coronary artery disease, two sides of a single coin: a determinant of antioxidant system or a factor in metabolic syndrome. J Clin Diagn Res. 2016;10(2):OC27–OC31. doi:10.7860/JCDR/2016/16335.7281
43. Corry DB, Eslami P, Yamamoto K, Nyby MD, Makino H, Tuck ML. Uric acid stimulates vascular smooth muscle cell proliferation and oxidative stress via the vascular renin-angiotensin system. J Hypertens. 2008;26(2):269–275. doi:10.1097/HJH.0b013e3282f240bf
44. Fantin F, Giani A, Zoico E, Rossi AP, Mazzali G, Zamboni M. Weight loss and hypertension in obese subjects. Nutrients. 2019;11:1667.
45. Bosello O, Zamboni M. Visceral obesity and metabolic syndrome. Obes Rev. 2000;1(1):47–56. doi:10.1046/j.1467-789x.2000.00008.x
 © 2022 The Author(s). This work is published and licensed by Dove Medical Press Limited. The full terms of this license are available at https://www.dovepress.com/terms.php and incorporate the Creative Commons Attribution - Non Commercial (unported, v3.0) License.
By accessing the work you hereby accept the Terms. Non-commercial uses of the work are permitted without any further permission from Dove Medical Press Limited, provided the work is properly attributed. For permission for commercial use of this work, please see paragraphs 4.2 and 5 of our Terms.
© 2022 The Author(s). This work is published and licensed by Dove Medical Press Limited. The full terms of this license are available at https://www.dovepress.com/terms.php and incorporate the Creative Commons Attribution - Non Commercial (unported, v3.0) License.
By accessing the work you hereby accept the Terms. Non-commercial uses of the work are permitted without any further permission from Dove Medical Press Limited, provided the work is properly attributed. For permission for commercial use of this work, please see paragraphs 4.2 and 5 of our Terms.