")
Back to Journals » International Journal of General Medicine » Volume 13
Elevated Serum Uric Acid is Associated with Rapid Decline in Kidney Function: A 10-Year Follow-Up Study
Authors Kritmetapak K , Charoensri S , Thaopanya R, Pongchaiyakul C
Received 20 August 2020
Accepted for publication 7 October 2020
Published 23 October 2020 Volume 2020:13 Pages 945—953
DOI https://doi.org/10.2147/IJGM.S277957
Checked for plagiarism Yes
Review by Single anonymous peer review
Peer reviewer comments 3
Editor who approved publication: Dr Scott Fraser
Kittrawee Kritmetapak,1 Suranut Charoensri,2 Rattrai Thaopanya,3 Chatlert Pongchaiyakul2
1Division of Nephrology, Department of Medicine, Faculty of Medicine, Khon Kaen University, Khon Kaen, Thailand; 2Division of Endocrinology and Metabolism, Department of Medicine, Faculty of Medicine, Khon Kaen University, Khon Kaen, Thailand; 3Department of Medicine, Faculty of Medicine, Khon Kaen University, Khon Kaen, Thailand
Correspondence: Chatlert Pongchaiyakul
Division of Endocrinology and Metabolism, Department of Medicine, Faculty of Medicine, Khon Kaen University, Khon Kaen 40002, Thailand
Tel +66-43-363664
Email [email protected]
Purpose: The long-term impact of changes in serum uric acid (SUA) concentration on the estimated glomerular filtration rate (eGFR) among the general population remains unclear. We investigated the longitudinal associations between changes in SUA and eGFR over 10 years in 1222 participants with baseline eGFR ≥ 60 mL/min/1.73 m2.
Methods: This was a 10-year retrospective cohort study conducted from 2007 to 2017. Rapid eGFR decline (defined as the highest quartile of change in eGFR between 2007 and 2017) and new-onset kidney disease (defined as an eGFR < 60 mL/min/1.73 m2 at a 10-year follow-up) were examined using multiple logistic regression analysis, adjusted for sex, age, body mass index, systolic blood pressure, SUA, fasting plasma glucose, serum total cholesterol, and triglyceride at baseline.
Results: SUA was inversely correlated with eGFR, and the slopes of the SUA-eGFR regression lines were consistently steeper in females than males. A significant inverse correlation was also observed between 10-year changes in SUA and eGFR in both sexes. Multivariate analysis showed that every 1 mg/dL increase in SUA from baseline was associated with higher risk of rapid eGFR decline and new-onset kidney disease (OR 1.25; 95% CI 1.14– 1.33 and OR 1.40; 95% CI 1.26– 1.49, respectively). Furthermore, the subjects in the highest SUA quartile (> 6.0 mg/dL) had a 2.45 times higher risk of rapid eGFR decline (95% CI 1.51– 3.42) compared to those in the lowest SUA quartile (< 3.9 mg/dL).
Conclusion: Elevated baseline SUA is an independent risk factor for rapid eGFR decline and new-onset kidney disease in the general population.
Keywords: chronic kidney disease, epidemiology, glomerular filtration rate, risk factors, uric acid
Introduction
Elevated serum uric acid (SUA) concentration is associated with cardiovascular diseases and hypertension.1,2 Additionally, epidemiologic studies suggest that elevated SUA is associated with increased risk of kidney disease onset and progression3,4 and that SUA is a predictor of diabetic kidney disease in both type 1 and type 2 diabetes.5,6 Uric acid may mediate aspects of the relationship between hypertension and kidney disease via a reduction in endothelial nitric oxide (NO) availability and activation of renin-angiotensin-aldosterone system (RAAS), leading to renal vasoconstriction and systemic hypertension.7,8 Chronic kidney disease (CKD) is associated with high morbidity and mortality, even in its earlier stages; therefore, reducing the incidence of CKD is widely recognized as a major public health goal.
Generally, estimated glomerular filtration rate (eGFR) declines with age (by 0.5–1.0 mL/min/1.73 m2 annually).9–11 However, some individuals experience rapid and progressive decline in eGFR, the mechanism of which is unclear, increasing their risk of mortality.10 SUA increases linearly as eGFR decreases due to reduced renal excretion. Hence, it is unknown whether elevated SUA results in kidney disease progression, is an indirect marker of reduced kidney function, or both. In addition to baseline SUA, longitudinal changes in SUA may be a determinant of those in eGFR. However, little is known of the precise relationship between longitudinal change in SUA and natural history of kidney function. We determined that a cohort study design would be the most suitable for examining this relationship, as these studies tend to be better at reducing recall and ascertainment biases and establishing temporal sequence than cross-sectional or case–control study designs.
This study aimed to explore the association between baseline SUA and longitudinal change in SUA and eGFR over 10 years in subjects with normal kidney function at baseline. Risk factors for developing rapid eGFR decline and new-onset kidney disease were also determined. Identification of independent risk factors that predict the development of rapid kidney function decline and new-onset kidney disease could help improve risk stratification and facilitate more focused preventive efforts among higher-risk subgroups.
Materials and Methods
This was a retrospective cohort study in adult subjects who received health examinations at Srinagarind Hospital in Thailand between 2007 and 2017. Inclusion criteria were having undergone 10 years of follow-up examination and had eGFR ≥60 mL/min/1.73 m2 at baseline (2007). The clinical and biochemical data, including sex, age, body weight, height, body mass index (BMI), systolic and diastolic blood pressure, serum creatinine, SUA, fasting plasma glucose, serum total cholesterol, and serum triglyceride, were reviewed and analyzed retrospectively. Serum creatinine concentration was determined using an enzymatic method. The eGFR was calculated using the Chronic Kidney Disease-Epidemiology Collaboration (CKD-EPI) equation. In this study, we analyzed the data from subjects who had measurements of aforementioned variables at two time points (2007 and 2017). Changes in SUA and eGFR were defined as the absolute difference between 2017 and 2007 measurements. We examined the correlation between longitudinal SUA and eGFR changes over 10 years, and classified the study subjects into quartiles based on eGFR change, as well as baseline SUA. The study was performed in accordance with the principles of the Declaration of Helsinki and was approved by the Khon Kaen University Ethics Committee in Human Research. Because the study was a secondary analysis of existing data, the need for obtaining informed consent was waived. Non-identified information was used in order to protect the patient data confidentiality.
Definition of Terms
“Hyperuricemia” was defined as SUA ≥7 mg/dL in males and ≥6 mg/dL in females. “Rapid eGFR decline” was defined as the highest (4th) quartile of change in eGFR observed over the 10 years covered by this study. “New-onset (incident) kidney disease” was defined as the occurrence of eGFR <60 mL/min/1.73 m2 at a 10-year follow-up (2017).
Statistical Analysis
Statistical analysis included computing the percentage frequencies for categorical variables and means (standard deviation, SD) or medians (interquartile ranges, IQR) for continuous variables. Comparisons of categorical variables were made using the chi-squared or Fisher’s exact test, as appropriate. Continuous variables were tested for normality using a Shapiro–Wilk test and were compared using Student’s t-test or Kruskal–Wallis test. Medians with IQR were used for non-normally distributed variables. Relationships between SUA, systolic and diastolic blood pressure, and eGFR were assessed by using Pearson’s correlation. The statistical difference between regression lines was tested by analysis of covariance. Univariate and multiple logistic regression analyses were used to determine the relevant risk factors for rapid eGFR decline and new-onset kidney disease. We determined the minimum sample size required to help ensure that the prediction model will have a small mean absolute error in the estimated outcome probabilities in the target population (Box 1).12 Only risk factors that had univariate associations of P-values <0.20 were further considered in subsequent multivariate models. Lack of collinearity was confirmed by testing variance inflation factors. P-values <0.05 were considered statistically significant. All statistical analysis was performed using STATA version 14.0.
 |
Box 1 Sample Size Determination in the Present Study |
Results
Demographic Characteristics
Of the 1842 subjects who received baseline health examinations in 2007, 62 with eGFR <60 mL/min/1.73 m2 at baseline and 558 with missing data were excluded. Clinical characteristics of the remaining 1222 subjects at baseline (2007) and at a 10-year follow-up (2017) are shown in Table 1. Median (IQR) age at baseline was 46 years (41–53), and 445 (36.4%) of the participants were male. Median (IQR) eGFR and SUA at baseline were 94.5 mL/min/1.73 m2 (80.9–106.5) and 4.8 mg/dL (3.9–6.1), respectively. The prevalence of hyperuricemia in males decreased slightly from 30.3% in 2007 to 26.3% in 2017. Conversely, the prevalence of hyperuricemia in females increased significantly from 9.9% in 2007 to 16.7% in 2017.
 |
Table 1 Clinical Characteristics of the Study Population |
Relationship Between SUA and eGFR
The relationship between SUA and eGFR by sex is shown in Figure 1. SUA was negatively correlated with eGFR in both males (r = –0.18 in 2007 and r = –0.16 in 2017, all P <0.01) and females (r = –0.32 in 2007 and r = –0.36 in 2017, all P <0.01), but the regression line slopes were significantly steeper in females than in males at both time points: eGFR = –4.69xSUA + 116.7 versus eGFR = –2.11xSUA + 101.3 (P <0.01) in 2007 and eGFR = –5.28xSUA + 114.6 versus eGFR = –2.06xSUA + 91.3 (P <0.01) in 2017. Figure 2 shows a significant inverse correlation between changes in SUA and eGFR from 2007 to 2017 in both males (r = –0.17, P <0.01) and females (r = –0.22, P <0.01).
 |
Figure 1 Correlations between serum uric acid levels and estimated GFR. Data for males and females in 2007 (A and B) and 2017 (C and D) are shown. |
 |
Figure 2 Correlations between changes in serum uric acid levels from 2007 to 2017 and changes in eGFR during the same period in males (A) and females (B). |
Relationship Between SUA and Blood Pressure
In females, there was a significant positive correlation between SUA and systolic and diastolic blood pressure in both 2007 (r = 0.25, P <0.01 and r = 0.24, P <0.01, respectively) and 2017 (r = 0.20, P <0.01 and r = 0.19, P <0.01, respectively). However, the correlation between SUA and systolic and diastolic blood pressure in males was significant only in 2007 (r = 0.10, P <0.01 and r = 0.12, P <0.01, respectively; Figures 3 and 4).
 |
Figure 3 Correlations between serum uric acid levels and systolic blood pressure (SBP). Data for males and females in 2007 (A and B) and in 2017 (C and D) are shown. |
 |
Figure 4 Correlations between serum uric acid levels and diastolic blood pressure (DBP). Data for males and females in 2007 (A and B) and in 2017 (C and D) are shown. |
Predictors of Rapid eGFR Decline and New-Onset Kidney Disease
Our study population had a median 10-year decrease in eGFR of 6.8 mL/min/1.73 m2, or approximately 0.7 mL/min/1.73 m2 annually. In terms of 10-year longitudinal eGFR change, 305 subjects were in the 1st quartile (eGFR change <1.2 mL/min/1.73 m2), 305 were in the 2nd quartile (1.2≤ eGFR change <6.8 mL/min/1.73 m2), 306 were in the 3rd quartile (6.8≤ eGFR change <16.8 mL/min/1.73 m2), and 306 were in the 4th (eGFR change ≥16.8 mL/min/1.73 m2). Ninety-two (7.5%) subjects had developed new-onset kidney disease by their 10-year follow-up.
Univariate analysis revealed that rapid eGFR decline was significantly associated with male sex (OR, 1.39; 95% CI, 1.07–1.81), age (OR, 1.02; 95% CI, 1.01–1.03), and fasting plasma glucose (OR, 1.01; 95% CI, 1.01–1.02) at baseline. New-onset kidney disease was associated with male sex (OR, 2.56; 95% CI, 1.66–3.94), age (OR, 1.15; 95% CI, 1.12–1.18), BMI (OR, 1.12; 95% CI, 1.06–1.18), systolic blood pressure (OR, 1.04; 95% CI, 1.03–1.05), SUA (OR, 1.60; 95% CI, 1.41–1.81), fasting plasma glucose (OR, 1.02; 95% CI, 1.01–1.02), and serum triglyceride (OR, 1.01; 95% CI, 1.01–1.02) at baseline.
In the multiple logistic regression analysis, factors were adjusted for sex, age, body mass index, systolic blood pressure, SUA, fasting plasma glucose, serum total cholesterol, and triglycerides at baseline. According to this model, male sex, advanced age, and elevated baseline SUA were significantly associated with rapid eGFR decline (Table 2). Additionally, subjects in the highest (4th) SUA quartile had significantly greater likelihood of rapid eGFR decline than those in the lowest (1st) quartile (OR, 2.45; 95% CI, 1.51–3.42; Table 3). Furthermore, advanced age, low baseline eGFR, high fasting plasma glucose, and elevated baseline SUA independently predicted the development of new-onset kidney disease (Table 4).
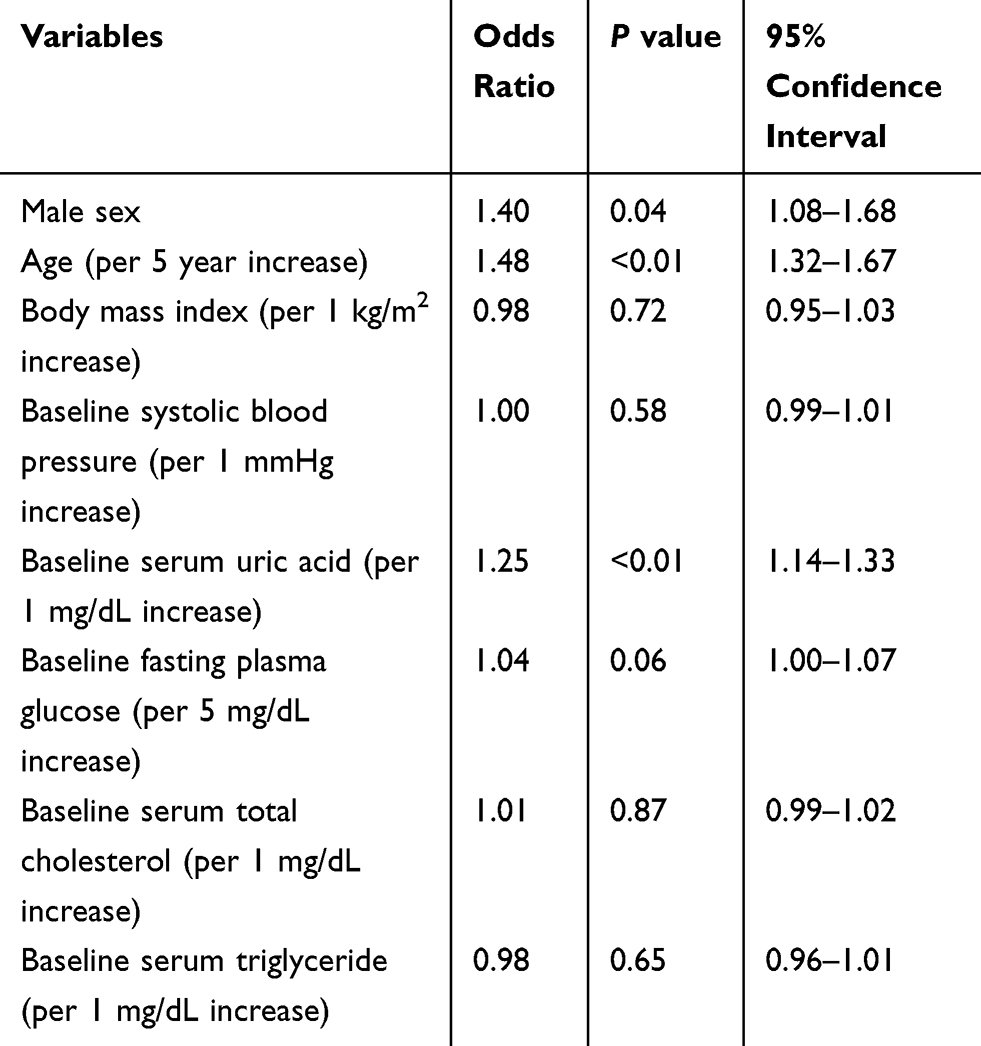 |
Table 2 Risk Factors Associated with Rapid eGFR Decline by Multivariate Analysis |
 |
Table 3 Odds Ratio of Rapid eGFR Decline by Baseline Serum Uric Acid Quartile |
 |
Table 4 Risk Factors Associated with New-Onset Kidney Disease by Multivariate Analysis |
Discussion
In this study, we demonstrated that advanced age and elevated baseline SUA were independent risk factors for both rapid eGFR decline and incident kidney disease in the general population with preserved baseline kidney function over a 10-year follow-up period. Additionally, we observed a stronger inverse correlation between SUA and eGFR in females than in males. Moreover, SUA was positively correlated with systolic and diastolic blood pressure, but these correlations decreased over time (especially in males).
The main finding in this study was that an elevated baseline SUA was independently associated with greater risk of rapid eGFR decline and incident kidney disease. Consistent with our report, Kuwabara et al13 found that healthy individuals in the highest (4th) SUA quartile (>6.3 mg/dL) had an almost a 2.5 times higher risk of rapid eGFR decline than those in the lowest (1st) quartile (<4.2 mg/dL). Although this and previous studies have shown elevated baseline SUA to be an independent risk factor for incident CKD (defined by eGFR <60 mL/min/1.73 m2 at final examination),4,14–16 the association between increased SUA and progressive kidney failure in patients with established CKD has not been supported by some studies.17 Interestingly, a recent study showed that uric acid-lowering treatment with allopurinol in patients with stage 3–4 CKD (mean eGFR, 31.7 mL/min/1.73 m2; mean SUA, 8.2 mg/dL) did not result in a slower eGFR decline when compared with placebo.18 This finding might be explained by the fact that the enrollment of patients with moderately advanced CKD could have limited the ability of allopurinol to prevent further eGFR decline.
Although there have been many epidemiologic studies that have examined the association between elevated baseline SUA and incident CKD in the general population, several limitations should be considered. First, most investigators calculated eGFR by using the Modification of Diet in Renal Disease (MDRD) Study equation, which could lead to systematic underestimation of eGFR >60 mL/min/1.73 m2 and overestimation of CKD prevalence.19 Second, given the heterogeneity of kidney function in older adults whose serum creatinine and eGFR appear relatively normal, defining incident kidney disease as final eGFR <60 mL/min/1.73 m2 without requiring sufficient eGFR reduction may lead to imprecise results.20 Third, few studies have explored the association between longitudinal changes in SUA and eGFR among general population. Fourth, some studies arbitrarily defined rapid eGFR decline as ≥3 mL/min/1.73 m2 annually, which may have led to misestimation of the true prevalence of rapid eGFR decline in some populations, given that the natural history of eGFR decline varies by race and ethnicity.9–11
Uric acid is an end-product of purine metabolism that is produced primarily by the liver and the intestines. Under normal conditions, approximately two-thirds of uric acid excretion occur via the kidneys and the other third via the intestines. Hyperuricemia develops due to uric acid overproduction, underexcretion, or both and may lead to rapid eGFR decline via multiple mechanisms. In vitro studies have shown that uric acid decreases NO production, thereby causing endothelial dysfunction, impaired renal autoregulation, and increased preglomerular resistance.7 Uric acid has also been found to cause preglomerular arteriopathy and renal tubulointerstitial fibrosis by activating RAAS.8 Moreover, it promotes oxidative stress and inflammation of renal tubular cells, vascular smooth muscle cells, and endothelial cells.21
This study found that correlation coefficients between SUA and eGFR were larger and the regression line slopes were consistently steeper in females than in males. This suggests that females are more susceptible to uric acid-mediated reductions in eGFR. Although the exact reason for this remains unclear, sex differences in uric acid handling mechanisms and alteration of renal response to injury by sex hormones have been reported.22,23 Endothelial NO deficiency contributes to increased cardiovascular risk, and intrarenal NO deficiency is related to CKD progression in animal models. Endothelial dysfunction develops with age but is delayed in females, suggesting that estrogen exhibits renoprotective effects by promoting NO synthesis.23 By contrast, one previous study found that estrogen accelerated progression of CKD in obese female Zucker rats24 and another that it promoted renal microangiopathy in stroke-prone spontaneously hypertensive rats.25 Thus, the precise mechanism by which sex hormones modulate SUA-eGFR requires further study.
Hyperuricemia is not uncommon in patients with primary or malignant hypertension.26 Nonetheless, the association between increased SUA and hypertension remains debatable. This study showed that SUA was significantly and positively correlated with systolic and diastolic blood pressure but to a lesser degree at a 10-year follow-up, especially in males. A systematic review and meta-analysis reported that elevated SUA was significantly associated with an increased risk of incident hypertension in younger individuals and that this effect tended to be larger in females (P = 0.059).27 Furthermore, elevated SUA has been shown to be a strong risk factor for developing hypertension from prehypertension.28 Notably, the relationship between SUA and blood pressure was less prominent in older adults or patients with pre-existing kidney disease. This may be due to the higher background rate of hypertension from other causes associated with advanced age. Uric acid-mediated hypertension could result from the activation of RAAS-induced renal vasoconstriction, ischemia, and oxidative stress followed by the activation of immune mechanisms in the kidney.29 It should be noted that uric acid may primarily stimulate local RAAS rather than systemic RAAS, which would preclude any independent association between SUA and plasma renin activity or plasma aldosterone concentration in hypertensive patients.30
This study has several limitations. First, as it was a retrospective single-center study, there may have been selection bias. Nevertheless, the fact that it was a single-center study minimized any chance of inter-laboratory variability. Second, we lacked data on baseline and longitudinal change in proteinuria, which is not only a predictor of kidney disease but also a marker of kidney damage. However, hyperuricemia generally results in nonproteinuric or minimally proteinuric kidney disease, as uric acid promotes kidney damage mainly via preglomerular vasoconstriction.31
Conclusions
Elevated baseline SUA is an independent risk factor for rapid eGFR decline and new-onset kidney disease over 10 years in the general population. Further studies are needed to determine whether treatment of hyperuricemia in subjects with normal kidney function may slow the rate of eGFR decline.
Abbreviations
CKD, chronic kidney disease; eGFR, estimated glomerular filtration rate; IQR, interquartile range; MDRD, Modification of Diet in Renal Disease; NO, nitric oxide; RAAS, renin-angiotensin-aldosterone system; SD, standard deviation; SUA, serum uric acid.
Funding
This research was supported by the Khon Kaen University Faculty of Medicine Research Affairs Division (HE611278).
Disclosure
All authors listed on the title page report no conflicts of interest in this work.
References
1. Nagahama K, Inoue T, Iseki K, et al. Hyperuricemia as a predictor of hypertension in a screened cohort in Okinawa, Japan. Hypertens Res. 2004;27:835–841.
2. Wu AH, Gladden JD, Ahmed M, Ahmed A, Filippatos G. Relation of serum uric acid to cardiovascular disease. Int J Cardiol. 2016;213:4–7.
3. Hsu C, Iribarren C, McCulloch CE, Darbinian J, Go AS. Risk factors for end-stage renal disease: 25-year follow-up. Arch Intern Med. 2009;169(4):342–350. doi:10.1001/archinternmed.2008.605
4. Weiner DE, Tighiouart H, Elsayed EF, Griffith JL, Salem DN, Levey AS. Uric acid and incident kidney disease in the community. J Am Soc Nephrol. 2008;19(6):1204–1211. doi:10.1681/ASN.2007101075
5. De Cosmo S, Viazzi F, Pacilli A, et al. Serum uric acid and risk of CKD in type 2 diabetes. Clin J Am Soc Nephrol. 2015;10(11):1921–1929. doi:10.2215/CJN.03140315
6. Hovind P, Rossing P, Tarnow L, Johnson RJ, Parving -H-H. Serum uric acid as a predictor for development of diabetic nephropathy in type 1 diabetes: an inception cohort study. Diabetes. 2009;58(7):1668–1671. doi:10.2337/db09-0014
7. Zharikov S, Krotova K, Hu H, et al. Uric acid decreases NO production and increases arginase activity in cultured pulmonary artery endothelial cells. Am J Physiol Cell Physiol. 2008;295(5):C1183–1190. doi:10.1152/ajpcell.00075.2008
8. Mazzali M, Kanellis J, Han L, et al. Hyperuricemia induces a primary renal arteriolopathy in rats by a blood pressure-independent mechanism. Am J Physiol Renal Physiol. 2002;282(6):F991–997. doi:10.1152/ajprenal.00283.2001
9. Lindeman RD, Tobin J, Shock NW. Longitudinal studies on the rate of decline in renal function with age. J Am Geriatr Soc. 1985;33(4):278–285. doi:10.1111/j.1532-5415.1985.tb07117.x
10. Rifkin DE, Shlipak MG, Katz R, et al. Rapid kidney function decline and mortality risk in older adults. Arch Intern Med. 2008;168(20):2212–2218. doi:10.1001/archinte.168.20.2212
11. Imai E, Horio M, Yamagata K, et al. Slower decline of glomerular filtration rate in the Japanese general population: a longitudinal 10-year follow-up study. Hypertens Res. 2008;31(3):433–441. doi:10.1291/hypres.31.433
12. Riley RD, Ensor J, Snell KIE, et al. Calculating the sample size required for developing a clinical prediction model. BMJ. 2020;368:m441. doi:10.1136/bmj.m441
13. Kuwabara M, Bjornstad P, Hisatome I, et al. Elevated serum uric acid level predicts rapid decline in kidney function. Am J Nephrol. 2017;45(4):330–337. doi:10.1159/000464260
14. Domrongkitchaiporn S, Sritara P, Kitiyakara C, et al. Risk factors for development of decreased kidney function in a southeast Asian population: a 12-year cohort study. J Am Soc Nephrol. 2005;16(3):791–799. doi:10.1681/ASN.2004030208
15. Obermayr RP, Temml C, Gutjahr G, Knechtelsdorfer M, Oberbauer R, Klauser-Braun R. Elevated uric acid increases the risk for kidney disease. J Am Soc Nephrol. 2008;19(12):2407–2413. doi:10.1681/ASN.2008010080
16. Sonoda H, Takase H, Dohi Y, Kimura G. Uric acid levels predict future development of chronic kidney disease. Am J Nephrol. 2011;33:352–357.
17. Madero M, Sarnak MJ, Wang X, et al. Uric acid and long-term outcomes in CKD. Am J Kidney Dis. 2009;53:796–803.
18. Badve SV, Pascoe EM, Tiku A, et al. Effects of allopurinol on the progression of chronic kidney disease. N Engl J Med. 2020;382:2504–2513.
19. Delanaye P, Pottel H, Botev R, Inker LA, Levey AS. Con: should we abandon the use of the MDRD equation in favour of the CKD-EPI equation? Nephrol Dial Transplant. 2013;28:1396–1403.
20. Chonchol M, Shlipak MG, Katz R, et al. Relationship of uric acid with progression of kidney disease. Am J Kidney Dis. 2007;50:239–247.
21. Han HJ, Lim MJ, Lee YJ, Lee JH, Yang IS, Taub M. Uric acid inhibits renal proximal tubule cell proliferation via at least two signaling pathways involving PKC, MAPK, cPLA2, and NF-κB. Am J Physiol Renal Physiol. 2007;292(1):F373–381. doi:10.1152/ajprenal.00104.2006
22. Preitner F, Bonny O, Laverrière A, et al. Glut9 is a major regulator of urate homeostasis and its genetic inactivation induces hyperuricosuria and urate nephropathy. Proc Natl Acad Sci U S A. 2009;106(36):15501–15506. doi:10.1073/pnas.0904411106
23. Baylis C. Sexual dimorphism in the aging kidney: differences in the nitric oxide system. Nat Rev Nephrol. 2009;5(7):384–396. doi:10.1038/nrneph.2009.90
24. Gades MD, Stern JS, van Goor H, Nguyen D, Johnson PR, Kaysen GA. Estrogen accelerates the development of renal disease in female obese Zucker rats. Kidney Int. 1998;53(1):130–135. doi:10.1046/j.1523-1755.1998.00746.x
25. Stier CT, Chander PN, Rosenfeld L, Powers CA. Estrogen promotes microvascular pathology in female stroke-prone spontaneously hypertensive rats. Am J Physiol Endocrinol Metab. 2003;285(1):E232–239. doi:10.1152/ajpendo.00029.2003
26. Cannon PJ, Stason WB, Demartini FE, Sommers SC, Laragh JH. Hyperuricemia in primary and renal hypertension. N Engl J Med. 1966;275(9):457–464. doi:10.1056/NEJM196609012750902
27. Grayson PC, Kim SY, LaValley M, Choi HK. Hyperuricemia and incident hypertension: a systematic review and meta-analysis. Arthritis Care Res. 2011;63(1):102–110. doi:10.1002/acr.20344
28. Kuwabara M, Hisatome I, Niwa K, et al. Uric acid is a strong risk marker for developing hypertension from prehypertension: a 5-year Japanese cohort study. Hypertens. 2018;71:78–86.
29. Pons H, Ferrebuz A, Quiroz Y, et al. Immune reactivity to heat shock protein 70 expressed in the kidney is cause of salt-sensitive hypertension. Am J Physiol Renal Physiol. 2013;304(3):F289–299. doi:10.1152/ajprenal.00517.2012
30. Mulè G, Castiglia A, Morreale M, et al. Serum uric acid is not independently associated with plasma renin activity and plasma aldosterone in hypertensive adults. Nutr Metab Cardiovasc Dis. 2017;27(4):350–359. doi:10.1016/j.numecd.2016.12.008
31. Feig DI, Rodriguez-Iturbe B, Nakagawa T, Johnson RJ. Nephron number, uric acid, and renal microvascular disease in the pathogenesis of essential hypertension. Hypertens. 2006;48:25–26.
 © 2020 The Author(s). This work is published and licensed by Dove Medical Press Limited. The full terms of this license are available at https://www.dovepress.com/terms.php and incorporate the Creative Commons Attribution - Non Commercial (unported, v3.0) License.
By accessing the work you hereby accept the Terms. Non-commercial uses of the work are permitted without any further permission from Dove Medical Press Limited, provided the work is properly attributed. For permission for commercial use of this work, please see paragraphs 4.2 and 5 of our Terms.
© 2020 The Author(s). This work is published and licensed by Dove Medical Press Limited. The full terms of this license are available at https://www.dovepress.com/terms.php and incorporate the Creative Commons Attribution - Non Commercial (unported, v3.0) License.
By accessing the work you hereby accept the Terms. Non-commercial uses of the work are permitted without any further permission from Dove Medical Press Limited, provided the work is properly attributed. For permission for commercial use of this work, please see paragraphs 4.2 and 5 of our Terms.