")
Back to Journals » OncoTargets and Therapy » Volume 12
Elevated nuclear auto-antigenic sperm protein promotes melanoma progression by inducing cell proliferation
Authors Li JX, Wei CY, Cao SG, Xia MW
Received 11 December 2018
Accepted for publication 14 February 2019
Published 21 March 2019 Volume 2019:12 Pages 2105—2113
DOI https://doi.org/10.2147/OTT.S197813
Checked for plagiarism Yes
Review by Single anonymous peer review
Peer reviewer comments 2
Editor who approved publication: Dr Sanjay Singh
Jia-Xia Li,1,* Chuan-Yuan Wei,2,* Shu-Gang Cao,1 Ming-Wu Xia1
1Department of Neurology, Hefei Affiliated Hospital of Anhui Medical University, Hefei, Anhui 230000, People’s Republic of China; 2Department of Plastic Surgery, Fudan University, Shanghai 200032, People’s Republic of China
*These authors contributed equally to this work
Background: Nuclear auto-antigenic sperm protein (NASP) has been implicated in tumorigenesis. However, its role in melanoma is still unclear.
Materials and methods: In the present study, we detected the mRNA and protein level of NASP in melanoma cell lines and tissues. Then the role of NASP was investigated by transfecting with NASP siRNAs. Finally, the prognosis of NASP was analyzed in 100 melanoma patients through Cox regression and Kaplan–Meier analyses.
Results: We showed that NASP was significantly overexpressed in melanoma tissues, and unregulated NASP promoted melanoma cell proliferation via promoting cell cycle G1/S phase transition. Additionally, the expression of NASP was closely related to proliferating cell nuclear antigen, a widely accepted biomarker for cell proliferation. Clinically, we found that a high level of NASP predicated poor overall survival and high cumulative recurrence rates. Multivariate analysis revealed that NASP was a risk biomarker for predicting the prognosis of melanoma patients.
Conclusion: Elevated NASP plays an important role in melanoma cell proliferation and tumor progression, and it can be used as an independent prognostic biomarker for melanoma patients.
Keywords: NASP, melanoma, proliferation, prognosis
Introduction
The incidence of melanoma is increasing globally, with approximately 200 thousands of new cases and 65 thousands of melanoma-related deaths every year.1 Although accounting for 4% of all skin cancers, melanoma causes the greatest number of skin cancer-related deaths worldwide.2 Despite the fact that a great number of studies attempted to reveal the molecular mechanism of melanoma progression, the underlying mechanism has not been fully elucidated. Hence, a further understanding of the molecular mechanism promoting melanoma progression is still needed.
Nuclear auto-antigenic sperm protein (NASP) encodes a H1 histone binding protein that is known to transport histones into nucleus of the dividing cells.3,4 NASP has two splice variants: sNASP (somatic type), which is found in embryonic and somatic cells, and tNASP (testis type), which is found in testis, malignant tumors, stem cells, and embryonic tissues.4 Both of them were associated with DNA replication, cell proliferation, and cell cycle transition through binding to histones H1, H3, and H4, and affecting chromatin assembly.5 Recently, NASP has been reported to play important roles in the progression of tumors. For instance, Richardson et al6 reported that NASP is present in a variety of malignancies, and NASP knockdown causes disruption in the cell cycle. Additionally, the null mutation of NASP is embryonically lethal in mice. Furthermore, downregulated NASP inhibits cell proliferation through regulating cell cycle-related proteins in renal cell carcinoma cells.7 To analyze the crucial role of NASP in tumor progression, we tried to detect the relationship between NASP and melanoma progression, which remains unknown.
In this study, we analyzed the expression level of NASP in melanoma and tried to uncover the role of NASP in melanoma. Finally, the clinical implication of NASP in melanoma patients was further detected.
Materials and methods
Microarray data
NASP expression levels in different cancers were obtained from the public database of Oncomine (https://www.oncomine.org/resource/login.html). GSEA analysis was performed using GSEA 2.2.1 (http://www.broadinstitute.org/gsea), and the data were obtained from The Cancer Genome Atlas database.
Patients and follow-up
Twenty-two pairs of fresh tumor and matched peritumor tissues were collected from the Department of Plastic surgery of Zhongshan Hospital, Fudan University (Shanghai, China) and were analyzed by Western blotting and quantitative real-time reverse transcription PCR (qRT-PCR). A total of 100 paraffin-embedded melanoma and matched peritumor tissues were collected to construct the tissue microarray. No patient had received radiotherapy or chemotherapy before the surgery, and detailed clinicopathological features and follow-up data had been obtained from each of them. Ethical approval for the study was obtained from the Ethics Committee of Hefei Affiliated Hospital of Anhui Medical University Biomedical Research Department, and written informed consent was obtained from each of these patients. The research was conducted in accordance with the Declaration of Helsinki.
Cell culture and transfection
The human melanoma cell lines A375 and A2058 were obtained from the Cell Bank of the Chinese Academy of Sciences (Shanghai, China) and were cultured in DMEM medium with 10% FBS. Small interference RNA targeting NASP was designed and purchased from Genomeditech (Shanghai, China) and the sequences were as follows: siRNA1 (GGAAAUCACUUCUGGAGUU) and siRNA2 (GGAAGCAGCUAGUCUUUUA). qRT-PCR and Western blotting were performed to verify the efficiency of transfection.
Immunohistochemical staining (IHC)
The procedure of IHC was similar to that performed by a previous study.15 Briefly, the slide was deparaffinized, rehydrated, antigen-retrieved, and incubated in 0.3% H2O2 following the manufacturer’s instructions. Subsequently, the section was incubated with the primary antibody at 4°C overnight, and then stained with horse radish peroxidase (HRP)-labeled IgG (Gene Tech, Shanghai, China). After that, the section was stained with diaminobenzidine and counterstained with hematoxylin. The density of positive staining was measured as previously described.16 Briefly, photographs of four representative fields were captured under high-power magnification (×200), and the same identical settings were used for all the photographs. The integrated absorbance and the area in a photograph were determined using Image-Pro Plus v6.0 software (Media Cybernetics Inc, Bethesda, MD, USA) and a uniform setting to all slides was applied. The average density was calculated as the product of the integrated absorbance/total area, and the sections were classified as either high or low expression.
qRT-PCR and Western blot analysis
Western blotting was performed as in a previous study.17 Briefly, cells were lysed with RIPA buffer (Beyotime, Shanghai, China) containing phosphatase inhibitor cocktail. The lysates were analyzed by SDS-PAGE and transferred to PVDF membranes (EMD Millipore Corp., Billerica, MA, USA). They were incubated with the primary antibodies of NASP (Abcam, Cambridge, UK), GAPDH (Beyotime), and proliferating cell nuclear antigen (PCNA; Abcam) overnight, and then incubated with suitable secondary antibodies for 1 hour. The target bands were presented by chemiluminescence (EMD Millipore Corp.).
Total RNA was extracted from cell lines and frozen tissues by TRIzol reagent (Thermo Fisher Scientific, Waltham, MA, USA), and reverse-transcribed to cDNA with a PrimeScript RT Reagent Kit (TaKaRa, Shiga, Japan). The qRT-PCR primer for NASP was as follows: F, 5′-GGAGGCTCCAGTTCTCCCTA-3′; R, 5′-AGCTTTGCCCTGACCTTCTC-3′. The qRT-PCR primer for GAPDH was as follows: F, 5′-CCTGCACCACCAACTGCTTA-3′; R, 5′-GGCCATCCACAGTCTTCTGG-3′.
The Cell Counting Kit-8 (CCK-8) and colony formation assays
CCK-8 assay was performed as in a previous study.18 Cells were plated in 96-well culture plates in triplicate (1,000 cells/well). For every 24 hours, the number of viable cells was quantified by adding 10 μL of CCK-8 solution to each pore, and then incubated for another 2 hours. The absorbance values at 450 nm were measured using a microplate reader. The colony formation assay was performed as described previously.19 Cells were seeded in a six-well plate (1,000 cells/well) with the medium refreshed every 3 days. After a period of 14 days, the cells were fixed with 4% formaldehyde, and then stained with 0.4% crystal violet for 15 minutes. Colonies containing more than ten cells were counted under a microscope.
Flow cytometric analysis and immunofluorescence staining
Flow cytometric analysis was performed as described previously and was used to determine the cell cycle phase and to evaluate cell proliferation ability.20 The cells were fixed in 70% ethanol overnight at 4°C, and then were stained with propidium iodide (BD Biosciences, San Jose, CA, USA) for 30 minutes and then detected by a flow cytometer.
Immunofluorescence was used to detect NASP and PCNA expression in melanoma cells as described previously.21 Briefly, after treatment with 0.1% Triton X-100 for 30 minutes, the cells were blocked with 5% BSA and incubated with the primary antibodies overnight. Then the cells were incubated with secondary antibodies for 2 hours. Finally, cell nuclei were stained with DAPI and observed under a fluorescence microscope (Olympus, Tokyo, Japan).
In vivo assay
The animal experiments met the requirements of the Animal Ethics Committee of Anhui Medical University. Five-week-old male BALB/c nude mice were maintained and handled in accordance with the stated guidelines of 3Rs (replacement, reduction, and refinement). These mice were randomly divided into two subgroups (n=6/each group): a control group (si-NC) and a treatment group (si-RNA2). A total of 106 cells were injected into the back of the mice to generate subcutaneous tumors. Tumor volume was measured every 5 days until the 30th day and was calculated using the formula: length × width2 × 0.5.
Statistical analysis
All experiments were repeated at least three times, and data in this study were expressed as mean ± SD and analyzed using IBM SPSS Statistics 20 (IBM Corporation, Armonk, NY, USA). Student’s t-test was used for comparison between groups and the chi-squared test was performed to analyze the categorical data. Correlation between two groups was determined by analysis of Pearson’s correlation coefficient. The overall survival (OS) and recurrence rates were analyzed using the Kaplan–Meier method and the log-rank test. Cox’s proportional hazards regression model was used to analyze the independent prognostic factors. A P-value <0.05 was considered to indicate statistical significance.
Results
The expression of NASP is significantly upregulated in melanoma
To elucidate the potential role of NASP, we first used Oncomine database to investigate the mRNA level of NASP in skin-related cancers. Representative results detected that NASP mRNA levels were frequently upregulated in squamous cell carcinoma and basal cell carcinoma (Figure 1A and B). Then we tried to detect the expression of NASP in our melanoma tissues. Through qRT-PCR, we found that the NASP mRNA was overexpressed in 16/21 (76.2%) melanoma tissues compared with the matched normal tissues (P<0.001, Figure 1C). Then the Western blot indicated that the protein level of NASP was upregulated in melanoma tissues compared with paired normal tissues (P<0.001, Figure 1D). Histochemically, we found the positive staining of NASP was mainly localized at the cell nucleus (Figure 1E). Through semi-quantitation by Image-pro plus 6.0 (IPP 6.0), we further confirmed that the expression of NASP was overexpressed in melanoma tissues (P<0.001, Figure 1F). The results demonstrated that the mRNA and protein levels of NASP are consistently upregulated in melanoma.
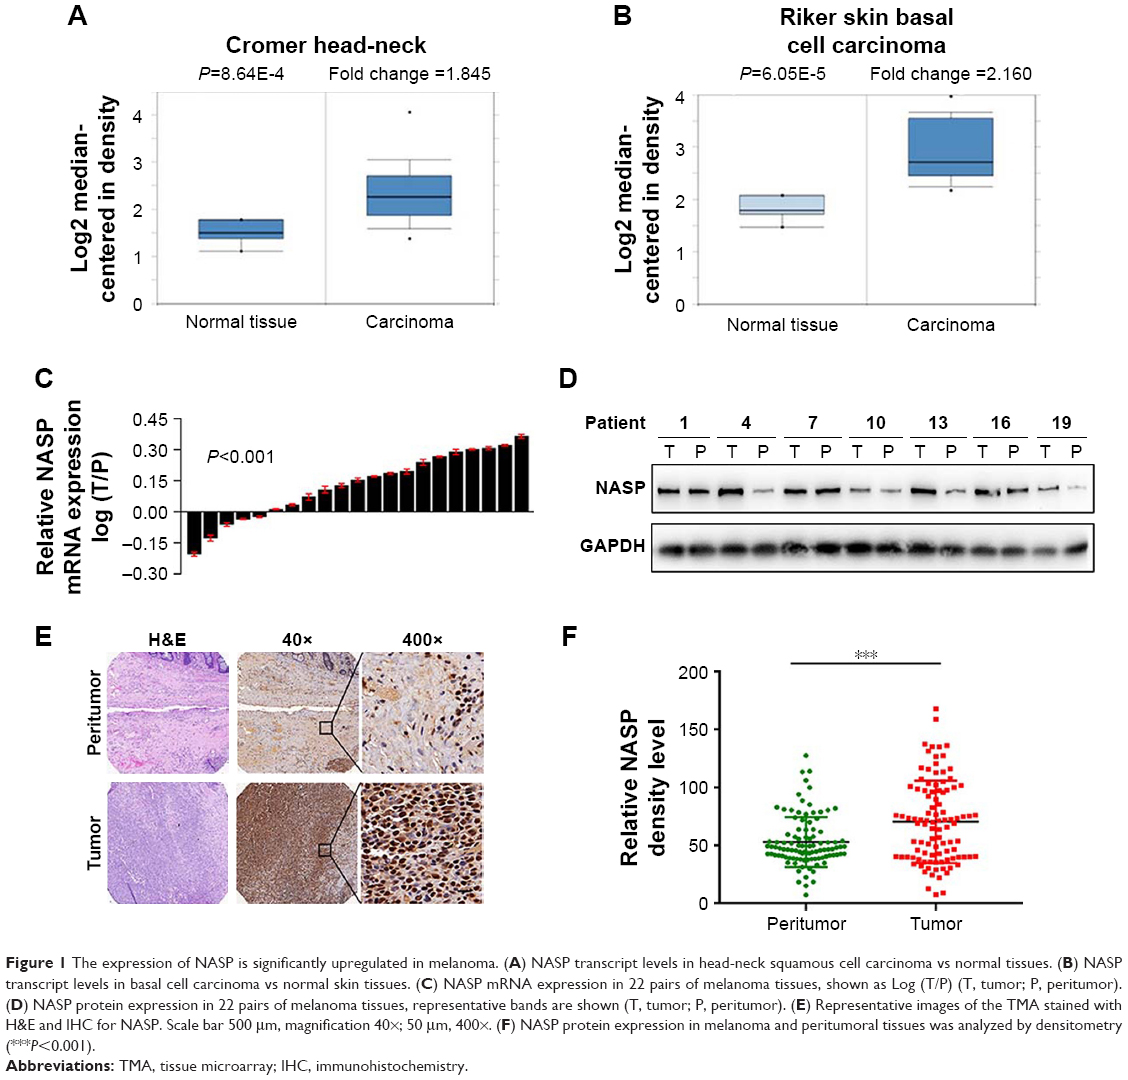 | Figure 1 The expression of NASP is significantly upregulated in melanoma. (A) NASP transcript levels in head-neck squamous cell carcinoma vs normal tissues. (B) NASP transcript levels in basal cell carcinoma vs normal skin tissues. (C) NASP mRNA expression in 22 pairs of melanoma tissues, shown as Log (T/P) (T, tumor; P, peritumor). (D) NASP protein expression in 22 pairs of melanoma tissues, representative bands are shown (T, tumor; P, peritumor). (E) Representative images of the TMA stained with H&E and IHC for NASP. Scale bar 500 μm, magnification 40×; 50 μm, 400×. (F) NASP protein expression in melanoma and peritumoral tissues was analyzed by densitometry (***P<0.001). |
NASP promotes melanoma cell proliferation in vivo and in vitro
We attempted to explore the function of NASP in melanoma. We chose two melanoma cell lines and transfected with NASP siRNA. The efficiency of knockdown was verified by qRT-PCR and Western blot (Figure 2A). We found that downregulated NASP remarkably inhibited the proliferation ability of A375 and A2058 cells, as shown by CCK-8 and colony formation assays (Figure 2B and C). Then a subcutaneous xenograft model was constructed to detect the role of NASP in vivo. We found that the proliferation ability was attenuated in the knockdown group compared with the negative control group (Figure 2D and E). Collectively, these results indicated that NASP knockdown inhibited the proliferation ability of melanoma cells.
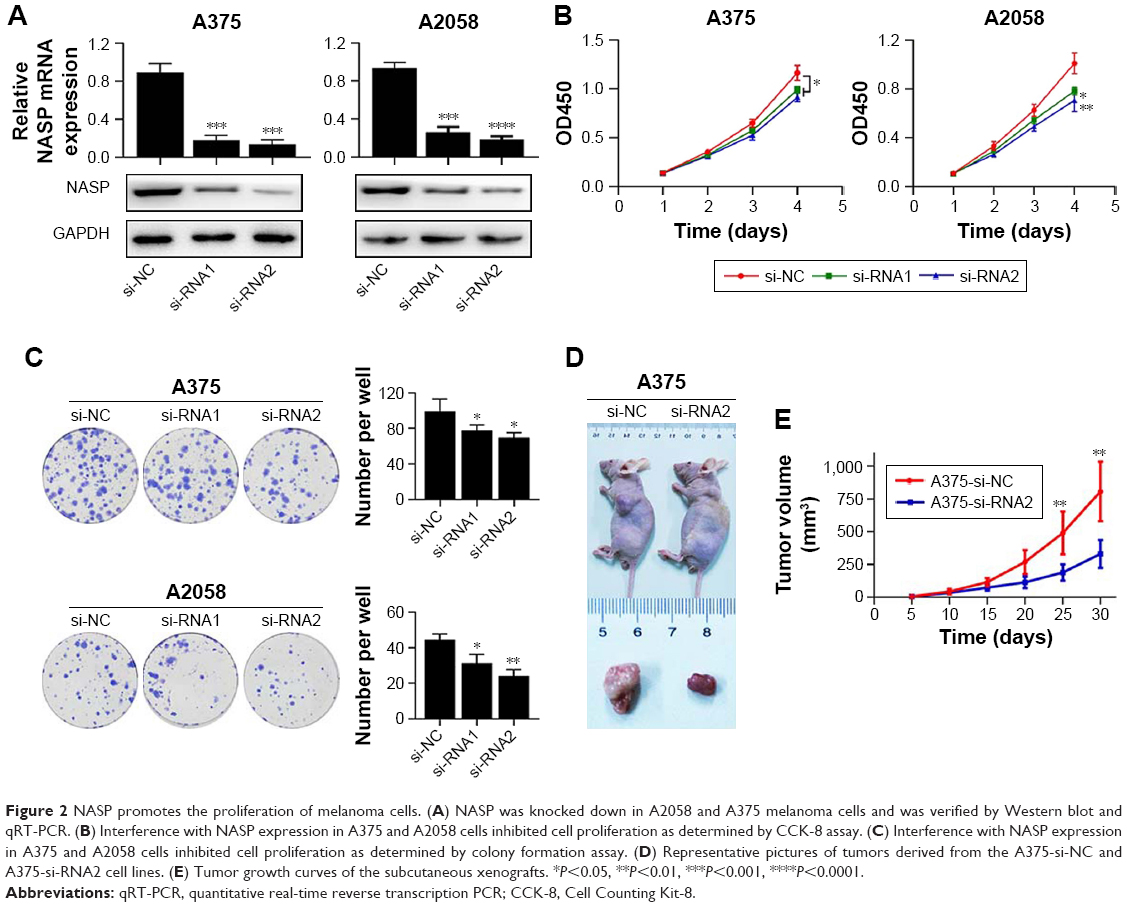 | Figure 2 NASP promotes the proliferation of melanoma cells. (A) NASP was knocked down in A2058 and A375 melanoma cells and was verified by Western blot and qRT-PCR. (B) Interference with NASP expression in A375 and A2058 cells inhibited cell proliferation as determined by CCK-8 assay. (C) Interference with NASP expression in A375 and A2058 cells inhibited cell proliferation as determined by colony formation assay. (D) Representative pictures of tumors derived from the A375-si-NC and A375-si-RNA2 cell lines. (E) Tumor growth curves of the subcutaneous xenografts. *P<0.05, **P<0.01, ***P<0.001, ****P<0.0001. |
NASP promotes melanoma cell proliferation via cell cycle G1/S phase transition
We performed GSEA analysis to detect the role of NASP played in melanoma and found that the NASP level was positively correlated with cell cycle G1/S transition-related gene signatures (Figure 3A). Then we detected the levels of cyclin D1 and p21, which were closely related to cell cycle G1/S phase transition. We found that downregulated NASP decreased the level of cyclin D1, while upregulated the level of p21 (Figure 3B). Through the flow cytometry analysis, we confirmed that siNASP increased the percentage of cells in G1 phase, while decreased the percentage of cells in S phase (Figure 3C). Collectively, these results indicated that NASP knockdown inhibited the proliferation ability of melanoma cells via attenuating the transition of cell cycle G1/S phase.
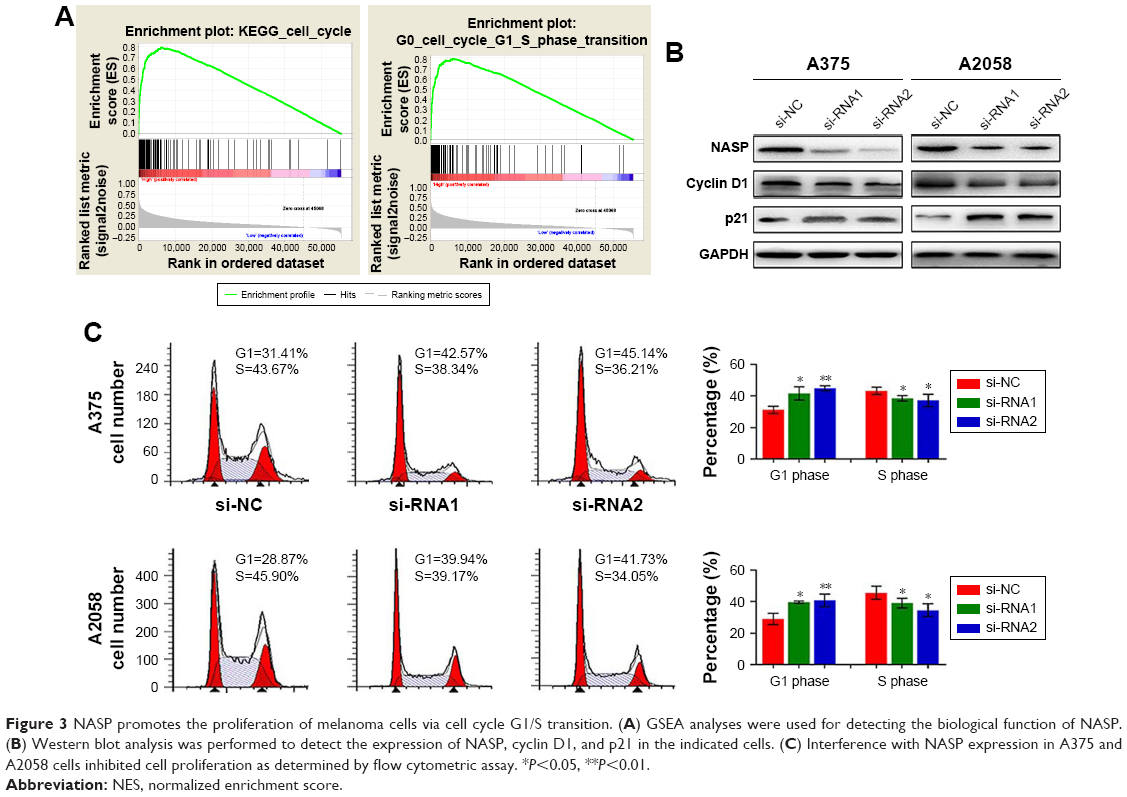 | Figure 3 NASP promotes the proliferation of melanoma cells via cell cycle G1/S transition. (A) GSEA analyses were used for detecting the biological function of NASP. (B) Western blot analysis was performed to detect the expression of NASP, cyclin D1, and p21 in the indicated cells. (C) Interference with NASP expression in A375 and A2058 cells inhibited cell proliferation as determined by flow cytometric assay. *P<0.05, **P<0.01. |
The expression of NASP is positively correlated with PCNA
Then we tried to detect the relationship between NASP and PCNA expression. We found an obviously positive relationship between NASP and PCNA analyzed by the bioinformatics tool GEPIA (Figure 4A). Histochemically, we demonstrated a positive correlation between NASP and PCNA which was in line with the above-mentioned results (Figure 4B). Then Western blot and immunofluorescence staining showed that knocking down the expression of NASP significantly decreased the expression of PCNA (Figure 4C–E). These results showed that the expression of NASP is positively correlated with PCNA.
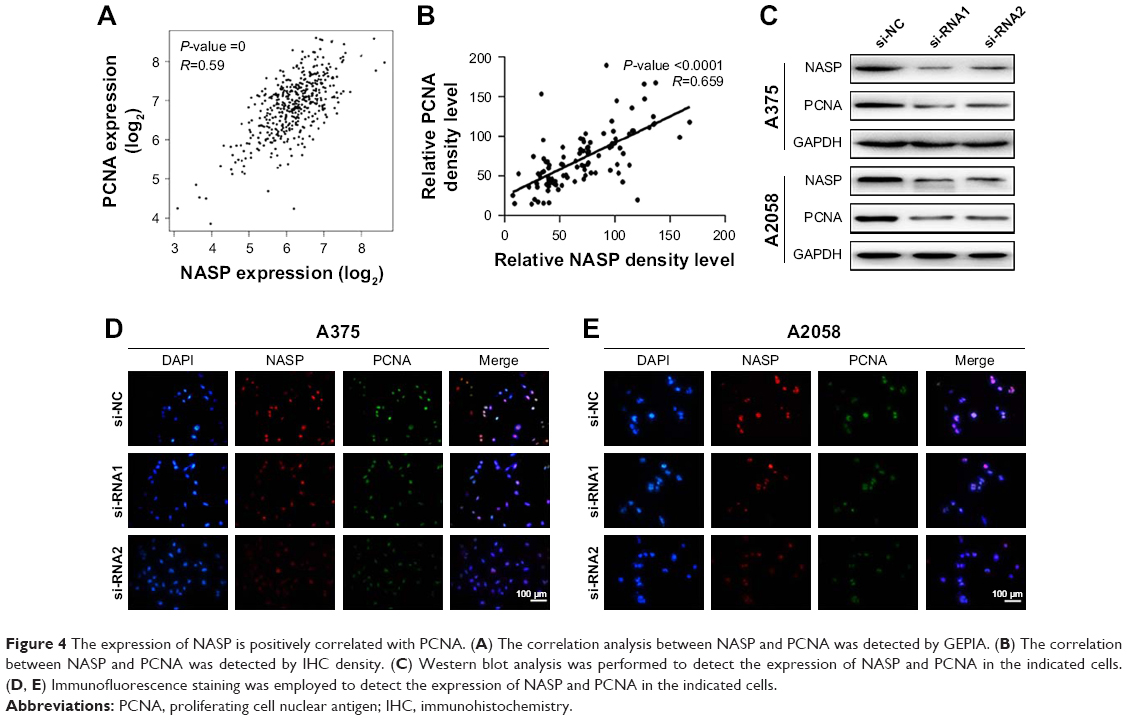 | Figure 4 The expression of NASP is positively correlated with PCNA. (A) The correlation analysis between NASP and PCNA was detected by GEPIA. (B) The correlation between NASP and PCNA was detected by IHC density. (C) Western blot analysis was performed to detect the expression of NASP and PCNA in the indicated cells. (D, E) Immunofluorescence staining was employed to detect the expression of NASP and PCNA in the indicated cells. |
High level of NASP is correlated with poor prognosis in melanoma patients
By the end of follow-up, 48 (48%) patients died. Through Kaplan–Meier analysis, we found that patients with high NASP expression had poor overall survival and high recurrence rates compared to patients with low NASP expression (Figure 5A and B). Then the correlation analysis was performed between the NASP expression and clinical parameters of melanoma patients. The results showed that NASP expression was positively correlated with Breslow depth (P=0.016), distant metastasis (P=0.002), and clinical stage (P=0.016), while NASP expression did not correlate with age, gender, and other clinical parameters (Table 1). The univariate analysis showed that Breslow depth, Clark level, distant metastasis, clinical stage, as well as NASP staining were correlated with the OS and cumulative recurrence rates of melanoma patients. Next, multivariate analysis showed that a high NASP level represents a promising and independent prognostic variable for the prediction of melanoma pathogenesis (Table 2).
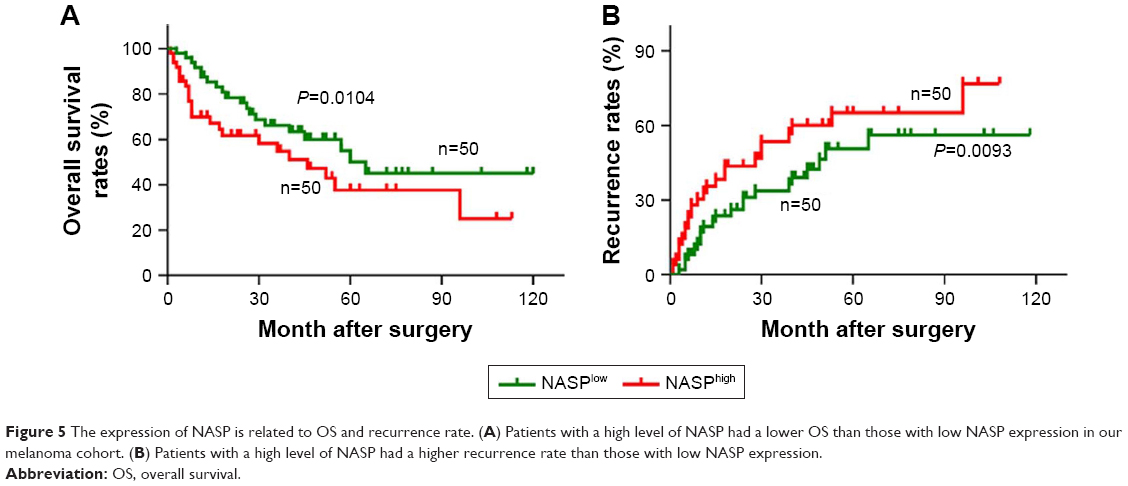 | Figure 5 The expression of NASP is related to OS and recurrence rate. (A) Patients with a high level of NASP had a lower OS than those with low NASP expression in our melanoma cohort. (B) Patients with a high level of NASP had a higher recurrence rate than those with low NASP expression. |
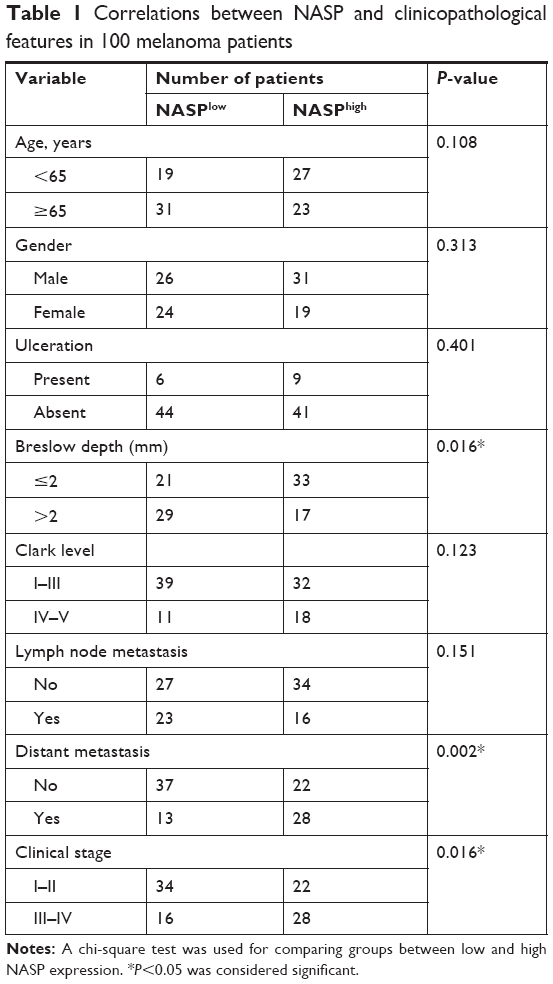 | Table 1 Correlations between NASP and clinicopathological features in 100 melanoma patients |
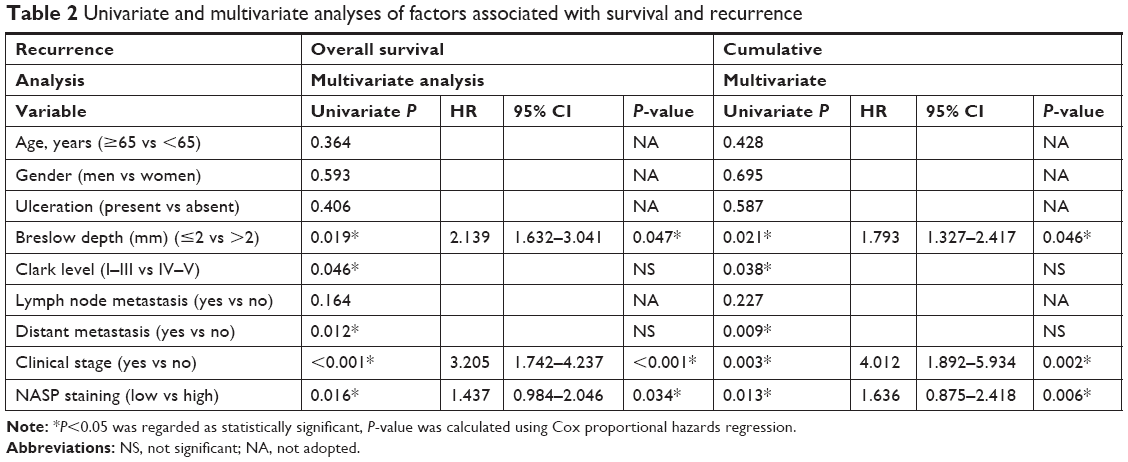 | Table 2 Univariate and multivariate analyses of factors associated with survival and recurrence |
Discussion
In the present study, we showed that NASP expression was upregulated in melanoma tissues compared with matched normal tissues, and downregulated NASP suppressed melanoma cell proliferation via regulating cell cycle transition. NASP was significantly correlated with PCNA, a widely accepted biomarker for actively proliferating cells. Clinically, overexpressed NASP was closely related to Breslow depth, distant metastasis, and clinical stage, and a high level of NASP was associated with poor overall survival and high recurrence rates in melanoma patients. NASP was an independent risk factor for the prognosis of melanoma patients. Importantly, we were the first to explore the expression and function of NASP in melanoma.
NASP knockdown has been reported to disrupt the cell cycle in Hela cells, and the null mutation of NASP is embryonically lethal in mice, which sufficiently confirmed the important role of NASP.8 In our research, we found that NASP knockdown significantly inhibited the proliferation ability of melanoma cells which was presented by CCK-8 and colony formation assays. What is more, we found that cells in G1 phase was obviously increased after they were transfected with NASP interference. The cell cycle consists of S, M, G1, and G2 phases, and ordered cell cycle regulates the proliferation of eukaryotic cells.9 Among them, G1/S transition is quite important for its role in initiation and completion of DNA replication.10 Being in the same conditions, cells with decreased percentage of G1 phase indicate a relatively high level of proliferation ability.11 Additionally, we found that the NASP expression was positively related to PCNA, a widely accepted biomarker for indicating the ability of cell proliferation.12 All the above-mentioned results powerfully confirmed the fact that NASP plays a crucial role in the proliferation of melanoma cells.
Conclusion
Effects have been made to find a reliable biomarker in the diagnosis, treatment, and prediction of prognosis in melanoma, while it is quite difficult to predict the dynamic tumor heterogeneity of melanoma.13 In the present research, we found that the expression of NASP was significantly correlated with that of conventional and reliable tissue biomarkers, such as Clark level and Breslow thickness.14 Patients with high level of NASP had shorter overall survival and higher cumulative rate of recurrence than patients with low level of NASP. However, a number of considerations should be considered, such as the limited numbers of samples, limited follow-up, and lack of an objective comparison with other biomarkers. All these factors need to be considered before it is applied in clinical practice.
Disclosure
The authors report no conflicts of interest in this work.
References
Garbe C, Peris K, Hauschild A, et al. Diagnosis and treatment of melanoma: European consensus-based interdisciplinary guideline. Eur J Cancer. 2010;46:270–283. doi:10.1016/j.ejca.2009.10.032 | ||
Jemal A, Siegel R, Ward E, et al. Cancer statistics, 2006. CA Cancer J Clin. 2006;56:106–130. | ||
Richardson RT, Batova IN, Widgren EE, et al. Characterization of the histone H1-binding protein, NASP, as a cell cycle-regulated somatic protein. J Biol Chem. 2000;275:30378–30386. doi:10.1074/jbc.M003781200 | ||
Wang H, Walsh ST, Parthun MR. Expanded binding specificity of the human histone chaperone NASP. Nucleic Acids Res. 2008;36:5763–5772. doi:10.1093/nar/gkn574 | ||
Ma W, Xie S, Ni M, et al. MicroRNA-29a inhibited epididymal epithelial cell proliferation by targeting nuclear autoantigenic sperm protein (NASP). J Biol Chem. 2012;287:10189–10199. doi:10.1074/jbc.M111.303636 | ||
Richardson RT, Alekseev OM, Grossman G, et al. Nuclear autoantigenic sperm protein (NASP), a linker histone chaperone that is required for cell proliferation. J Biol Chem. 2006;281:21526–21534. doi:10.1074/jbc.M603816200 | ||
Fang J, Wang H, Xi W, et al. Downregulation of tNASP inhibits proliferation through regulating cell cycle-related proteins and inactive ERK/MAPK signal pathway in renal cell carcinoma cells. Tumour Biol. 2015;36:5209–5214. doi:10.1007/s13277-015-3177-9 | ||
Alekseev OM, Richardson RT, Alekseev O, O’Rand MG. Analysis of gene expression profiles in HeLa cells in response to overexpression or siRNA-mediated depletion of NASP. Reprod Biol Endocrinol. 2009;7:45. doi:10.1186/1477-7827-7-45 | ||
Panis G, Murray SR, Viollier PH. Versatility of global transcriptional regulators in alpha-Proteobacteria: from essential cell cycle control to ancillary functions. FEMS Microbiol Rev. 2015;39:120–133. | ||
Ghule PN, Seward DJ, Fritz AJ, et al. Higher order genomic organization and regulatory compartmentalization for cell cycle control at the G1/S-phase transition. J Cell Physiol. 2018;233:6406–6413. doi:10.1002/jcp.26741 | ||
Massague J. G1 cell-cycle control and cancer. Nature. 2004;432:298–306. doi:10.1038/nature03094 | ||
Wang SC. PCNA: a silent housekeeper or a potential therapeutic target? Trends Pharmacol Sci. 2014;35:178–186. doi:10.1016/j.tips.2014.02.004 | ||
Mandala M, Massi D. Tissue prognostic biomarkers in primary cutaneous melanoma. Virchows Arch. 2014;464:265–281. doi:10.1007/s00428-013-1526-x | ||
Balch CM, Gershenwald JE, Soong SJ, et al. Final version of 2009 AJCC melanoma staging and classification. J Clin Oncol. 2009;27:6199–6206. doi:10.1200/JCO.2009.23.4799 | ||
Huang XY, Ke AW, Shi GM, et al. AlphaB-crystallin complexes with 14-3-3zeta to induce epithelial-mesenchymal transition and resistance to sorafenib in hepatocellular carcinoma. Hepatology. 2013;57:2235–2247. doi:10.1002/hep.26255 | ||
Ke AW, Shi GM, Zhou J, et al. CD151 amplifies signaling by integrin alpha6beta1 to PI3K and induces the epithelial-mesenchymal transition in HCC cells. Gastroenterology. 2011;140:1629–1641. doi:10.1053/j.gastro.2011.02.008 | ||
Wei C, Lu N, Wang L, et al. Upregulation of UHRF1 promotes the progression of melanoma by inducing cell proliferation. Oncol Rep. 2018;39:2553–2562. doi:10.3892/or.2018.6356 | ||
Cai JB, Shi GM, Dong ZR, et al. Ubiquitin-specific protease 7 accelerates p14 (ARF) degradation by deubiquitinating thyroid hormone receptor-interacting protein 12 and promotes hepatocellular carcinoma progression. Hepatology. 2015;61:1603–1614. doi:10.1002/hep.27682 | ||
Yanru W, Zhenyu B, Zhengchuan N, Qi Q, Chunmin L, Weiqiang Y. Transcriptomic analyses of chemokines reveal that down-regulation of XCR1 is associated with advanced hepatocellular carcinoma. Biochem Biophys Res Commun. 2018;496:1314–1321. doi:10.1016/j.bbrc.2018.02.008 | ||
Dogan T, Gnad F, Chan J, et al. Role of the E3 ubiquitin ligase RNF157 as a novel downstream effector linking PI3K and MAPK signaling pathways to the cell cycle. J Biol Chem. 2017;292:14311–14324. doi:10.1074/jbc.M117.792754 | ||
Lv YF, Dai H, Yan GN, Meng G, Zhang X, Guo QN. Downregulation of tumor suppressing STF cDNA 3 promotes epithelial-mesenchymal transition and tumor metastasis of osteosarcoma by the Wnt/GSK-3beta/beta-catenin/Snail signaling pathway. Cancer Lett. 2016;373:164–173. doi:10.1016/j.canlet.2016.01.046 |
 © 2019 The Author(s). This work is published and licensed by Dove Medical Press Limited. The full terms of this license are available at https://www.dovepress.com/terms.php and incorporate the Creative Commons Attribution - Non Commercial (unported, v3.0) License.
By accessing the work you hereby accept the Terms. Non-commercial uses of the work are permitted without any further permission from Dove Medical Press Limited, provided the work is properly attributed. For permission for commercial use of this work, please see paragraphs 4.2 and 5 of our Terms.
© 2019 The Author(s). This work is published and licensed by Dove Medical Press Limited. The full terms of this license are available at https://www.dovepress.com/terms.php and incorporate the Creative Commons Attribution - Non Commercial (unported, v3.0) License.
By accessing the work you hereby accept the Terms. Non-commercial uses of the work are permitted without any further permission from Dove Medical Press Limited, provided the work is properly attributed. For permission for commercial use of this work, please see paragraphs 4.2 and 5 of our Terms.