")
Back to Journals » Cancer Management and Research » Volume 13
Elevated mRNA Level of Y-Box Binding Protein 1 Indicates Unfavorable Prognosis Correlated with Macrophage Infiltration and T Cell Exhaustion in Luminal Breast Cancer
Authors Lv Z, Xue C, Zhang L, Sun J, Bo C
Received 21 March 2021
Accepted for publication 22 July 2021
Published 14 August 2021 Volume 2021:13 Pages 6411—6428
DOI https://doi.org/10.2147/CMAR.S311650
Checked for plagiarism Yes
Review by Single anonymous peer review
Peer reviewer comments 2
Editor who approved publication: Dr Ahmet Emre Eşkazan
Zhenhuan Lv,1 Chunli Xue,2 Lei Zhang,3 Jujie Sun,4 Cong Bo4
1Department of Clinical Pharmacy, Shandong Cancer Hospital and Institute, Shandong First Medical University and Shandong Academy of Medical Sciences, Jinan, People’s Republic of China; 2Department of Radiotherapy, Yantai Affiliated Hospital of Binzhou Medical University, Yantai, People’s Republic of China; 3Physical Examination Center, the Affiliated Hospital of Jining Medical College, Jining, People’s Republic of China; 4Department of Radiation Oncology, Shandong Cancer Hospital and Institute, Shandong First Medical University and Shandong Academy of Medical Sciences, Jinan, People’s Republic of China
Correspondence: Cong Bo
Department of Radiation Oncology, Shandong Cancer Hospital and Institute, Shandong First Medical University and Shandong Academy of Medical Sciences, Jinan, People’s Republic of China
Tel +86 151-5418-0386
Fax +86 31 6762 6624
Email [email protected]
Purpose: The Y-box binding protein 1 (YBX1) gene encodes the multifunctional protein YB1 that is associated with the dysregulation of numerous cancer-related genes. However, the prognostic value of YBX1 and its correlation with immune cell infiltration in breast cancer (BRCA) remain unclear.
Methods: YBX1 expression data in various malignancies were obtained from Oncomine, Tumor Immune Estimation Resource (TIMER), Cancer Cell Line Encyclopedia, UALCAN and cBio Cancer Genomics Portal databases. Survival data were analyzed with Kaplan–Meier plotter. Immune cell infiltration and its association with YBX1 expression level were assessed with TIMER and LinkedOmics. YB1 expression was evaluated by immunohistochemistry and Western blotting, and changes in cancer cell viability and T cell activity following YBX1 knockdown were assessed with an immunocyte–tumor cell co-culture assay.
Results: YBX1 was downregulated in the BRCA cohort, which was closely associated with worse prognosis in the luminal A subtype (overall survival [OS]: hazard ratio [HR] 1.93, 95% confidence interval [CI] 1.22– 3.05, P = 0.0042; recurrence-free survival [RFS]: HR 1.85, 95% CI 1.51– 2.28, P = 3.1e-9) and luminal B subtype (OS: HR 1.08, 95% CI 0.68– 1.70, P = 0.75; RFS: HR 1.29, 95% CI 1.02– 1.62, P = 0.03). YBX1 expression was positively correlated with the M2 macrophage infiltration and expression of T cell exhaustion markers such as indoleamine 2,3-dioxygenase 1 (IDO1) (rs = 0.388, P = 4.93e-37) and cytotoxic T-lymphocyte-associated protein 4 (CTLA4) (rs = 0.321, P = 2.54e-25) in luminal BRCA. Kaplan–Meier analysis revealed a correlation between YBX1 expression, M2 infiltration and survival outcome. Co-culture with macrophages or T cells enhanced the decrease in luminal BRCA cell viability induced by YBX1 knockdown.
Conclusion: High YBX1 mRNA levels predict a poor prognosis in luminal BRCA, which is correlated with M2 macrophage infiltration and T cell exhaustion in the tumor microenvironment. Combining classic therapeutics with immune checkpoint inhibitors and M1 polarization agents may be an effective treatment strategy for luminal BRCA with YBX1 overexpression.
Keywords: Y-box binding protein 1, breast cancer, prognosis, immune cell infiltration, macrophages, immunosuppression, 3D co-culture
Introduction
Breast cancer (BRCA) is the leading cause of new cancer diagnoses and the second leading cause of cancer-related deaths among women worldwide.1 In China, BRCA accounts for 12.2% of all new diagnoses and 9.6% of all deaths of tumor patients, respectively.2 With early screening and improvements in treatment, the 5-year survival rate of BRCA is now over 85%.3,4 However, there are still some subtypes, such as triple negative BRCA (TNBC) and metastatic BRCA, carrying poor prognosis.5,6 To further improve treatment efficacy especially for the refractory subtypes above, one major step is to elucidating the genomic and molecular signatures of BRCA, which can help to identify high-risk patients thereby administering optimal therapies.4,7 Currently, public databases offer large amounts of data that can facilitate this endeavor.
Located at 1p34.2, the gene Y-box binding protein 1 (YBX1) encodes a 36kDa DNA/RNA binding protein, namely YB1, containing a highly conserved cold shock domain.8 More than 90% of YB1 distributes in the cytoplasm,9 where it regulates translation by directly binding to messenger RNA (mRNA);10 while in response to noxious stimuli including radiation and DNA damaging agents (eg, cisplatin and mitomycin C),11 cytoplasmic YB1 translocates into the nucleus, binding the target promoters with the so-called Y-box sequence (ie, an inverted CCAAT box) and regulating transcription.12 Clinically, YBX1 overexpression was shown to be an independent prognostic biomarker in BRCA,13,14 and it has been experimentally explained by the enhancement of epithelial-to-mesenchymal transition (EMT)15,16 and the induction of chemoresistance17,18 in cancer cells. However, little is known about the impact of YBX1 on immune infiltrates in tumor microenvironment. Recent studies have demonstrated an association between YBX1 and immunologic processes such as inflammation and activation of innate immunity in non-neoplastic disorders.19,20 Therefore, we speculate that changes in YBX1 expression modulate the tumor microenvironment in BRCA.
To test this hypothesis, in the present study we evaluated the expression pattern of YBX1 and its relationship to prognosis and immune cell infiltration in BRCA through analysis of public datasets and in vitro experiments. Firstly, we observed the significantly distinct expression of YBX1 in different BRCA subtypes by mRNA level evaluation in the UALCAN database, the immunohistochemical staining in breast samples and the protein assays in multiple breast cell lines. Then, the Kaplan–Meier plotters showed the significantly poorer survival outcomes in YBX1 high-expressing groups compared with the low ones in BRCA especially with luminal subtypes. Furthermore, we evaluated the infiltration levels of various immune cells with increasing expression of YBX1 via the databases such as LinkedOmics and Tumor Immune Estimation Resource (TIMER), finding the significant positive correlation of YBX1 with macrophage (M2) infiltration and T cell exhaustion markers such as IDO1 (indoleamine 2,3-dioxygenase 1), CTLA4 (cytotoxic T-lymphocyte associated protein 4), in luminal BRCA, which was verified by the tumor inhibition after YBX1 knockdown in the co-culture system of cancer cells and immunocytes. The findings in this report pioneered the explanation for the poorer prognosis of BRCA with high YBX1 expression from the point of view of tumor microenvironment, and shed light on the better treatment outcomes of IDO1/CTLA4 inhibitors in YBX1 high-expressing luminal BRCA patients.
Materials and Methods
Oncomine Database Analysis
The mRNA expression of YBX1 in various cancer types was identified via the Oncomine database (https://www.oncomine.org).21 Oncomine is the largest oncogene database covering 715 datasets and 86,733 samples.21 We focused on the comparison of YBX1 expression between BRCA and normal tissues and set the thresholds as follows: P-value: 0.01; fold change: 1.5; gene rank: 10%.
Cancer Cell Line Encyclopedia (CCLE) Analysis
CCLE is a large genomic and proteomic database of human cancer cell lines generated by the Broad Institute and Novartis.22 To verify the findings from the Oncomine database, the protein expression of YB1 in cell lines of various cancer types was identified by CCLE.
UALCAN Analysis
The relative expression of YBX1 across diverse BRCA subgroups was evaluated via UALCAN database (http://ualcan.path.uab.edu), a comprehensive interactive web-portal for analyzing tumor subgroup gene expression.23 The gene expression and clinical data of UALCAN are derived from The Cancer Genome Atlas (TCGA).
The cBio Cancer Genomics Portal (cBioPortal) Database Analysis
The cBioPortal database (https://www.cbioportal.org) is an open-access web-based platform for interactive exploration of multidimensional cancer genomics data.24,25 We selected the largest dataset of BRCA in cBioPortal, Breast Cancer (METABRIC, Nature 2012 and Nat Commun 2016) with 2509 primary BRCA samples, for the following analysis. The module of “Oncoprint” shows the overview of YBX1 alterations in BRCA cases, which we used to investigate the changes of clinical parameters including age, histologic grade, tumor stage etc with the increase of YBX1 expression in BRCA. The module of “Co-expression” evaluates the correlation between different genes in BRCA and we used it to verify the significant correlation of YBX1 with immunosuppression-associated genes including IDO1, PDCD1, CTLA4 and LAG3.
Kaplan–Meier Plotter Database Analysis
Aggregating data from Gene Expression Omnibus (GEO), European Genome-phenome Archive (EGA), and TCGA, the Kaplan–Meier plotter database can assess the effect of more than 54,000 genes (mRNA, miRNA, protein) on survival especially in BRCA (n=6234).26 The correlation of YBX1 expression with survival in BRCA as well as in BRCA subgroups divided by various clinicopathological characteristics was analyzed by Kaplan–Meier plotter (http://kmplot.com/analysis). Kaplan–Meier plots of overall survival (OS) and relapse-free survival (RFS) were drawn, respectively, and the hazard ratio (HR) with 95% confidence intervals (95% CI) and log-rank P-value were also calculated.
TIMER Database Analysis
TIMER is a comprehensive web-portal for analyzing immune infiltration systemically across various cancer types (http://timer.cistrome.org).27–29 We applied multiple modules in the TIMER database for the following evaluation: (a) the “Exploration-Gene_DE” module for evaluating the differential expression of YBX1 between tumor and adjacent normal tissues across all TCGA tumors; (b) the “Gene_Outcome” module for verifying the independent prognostic role of YBX1 expression in BRCA after adjusting potential confounding factors; (c) the “Immune-Gene” module for evaluating the correlation of YBX1 expression with the abundance of immune infiltrates, including B cells, CD4+ T cells, CD8+ T cells, macrophages, and myeloid-derived suppressor cells; (d) the “Exploration-Gene_Corr” module for evaluating the correlation between YBX1 and gene markers of tumor-infiltrating immune cells; (e) the “Immune-Outcome” module for evaluating the clinical relevance of macrophage subsets, M1 and M2, along with different expression of YBX1 in BRCA;30 (f) the “Estimation” module for evaluating the relative infiltration levels of macrophage subsets from GSE1456_GPL96, a representative dataset for BRCA patients.31,32 The data of GSE1456_GPL96 were obtained from https://www.ncbi.nlm.nih.gov/geo.
LinkedOmics Analysis
LinkedOmics database (http://www.linkedomics.org/login.php) is an open-access tool containing multi-omics data from all 32 TCGA cancer types.33 The module of “LinkFinder” in this database can be applied to searching for attributes associated with a query attribute including mRNA expression signatures of genomic alterations etc. We used it to find the immunosuppression-associated genes that have a significant positive correlation with YBX1 via the dataset of TCGA_BRCA (HiSeq RNA).
Cell Lines and Antibodies
Human breast epithelial MCF-10A cells and human BRCA cells (MCF-7, BT-474, SK-BR-3, MDA-MB-231) were purchased from the Cell Bank of the Chinese Academy of Science (Shanghai, China), and human BRCA cells namely HCC1428, HCC1569 and HCC1143 were purchased from the American Type Culture Collection (ATCC, Manassas, VA, USA). All the cells were cultured at 37°C in Dulbecco’s modified Eagle’s medium (DMEM) (Gibco, Thermo Fisher Scientific, Inc., Waltham, MA, USA) supplemented with 10% fetal bovine serum (FBS; Gibco, Thermo Fisher Scientific, Inc.), 100U/mL penicillin, and 100µg/mL streptomycin in a humidified atmosphere of 5% CO2.
The antibodies used in this study include: YB1 (#ab76149; Abcam, Cambridge, MA, USA), IDO1 (#13268-1-AP; Proteintech, Chicago, USA), CTLA4 (#ab237712; Abcam, Cambridge, MA, USA), and β-actin (#ab8226; Abcam, Cambridge, MA, USA).
Immunohistochemistry
YB1, IDO1 and CTLA4 staining were conducted with formalin-fixed, paraffin-embedded breast samples. Pathological sectioning was performed by Jujie Sun, Department of Pathology, Shandong Cancer Hospital and Institute, Shandong First Medical University and Shandong Academy of Medical Sciences. Five-micrometer-thick sections were deparaffinized within xylene, rehydrated in graded ethanol, and washed thrice with threefold-distilled water. For antigen retrieval, sections were incubated within Tris-EDTA buffer (pH 9.0), heated at 120°C for 10 min, and cooled down to room temperature (RT). After incubation with primary antibodies (1:100 dilution for anti-IDO1 and anti-YB1 antibodies, 1:150 dilution for anti-CTLA4 antibody) overnight at 4°C, the samples were then rinsed with phosphate buffered saline (PBS) thrice, incubated with goat anti-rabbit IgG secondary antibodies (A0208, 1:50 dilution; Beyotime Institute of Biotechnology, China) for 50 minutes at RT. After washed with PBS again and stained with diaminobenzidine (DAB), the sections were then counterstained with Mayer’s hematoxylin, dehydrated, and mounted. The pathological images were obtained with a high-resolution scanner. The number of immunohistochemical positive cells and total cells were counted in three non-overlapping fields per section by two pathologists independently and percentage of positive cells was calculated. All the manipulations were approved by the Ethic Committee of Shandong Cancer Hospital and Institute.
Protein Extraction and Western Blotting
Protein extraction and Western blotting assay were performed as previously described.34 Breast cells after different treatments were washed with ice-cold PBS thrice. RIPA lysis buffer (P0013B, Beyotime Institute of Biotechnology, China) with 1mM phenylmethanesulfonyl fluoride solution (PMSF) was used for cell lysis and total protein extraction. Protein extracts were boiled at 100°C for 15 minutes, followed by separated with 10% sodium dodecyl sulfate polyacrylamide gel electrophoresis (SDS-PAGE) and then transferred into the nitrocellulose (NC) membrane (Millipore, Billerica, MA, USA). Membrane was blocked by 5% skimmed milk at RT for one hour. After the incubation with primary antibodies overnight at 4°C, the blots were then incubated with corresponding goat anti-rabbit (A0208, 1:2000; Beyotime Institute of Biotechnology, China) or goat anti-mouse (A0216, 1:2000; Beyotime Institute of Biotechnology, China) IgG horseradish peroxidase-conjugated secondary antibodies for 45 minutes at RT. Then, the membrane was washed using Tris-buffered saline with Tween-20 buffer (TBST) thrice for 7 minutes at each time. The signals were detected using electrochemiluminescence substrates (Millipore, Billerica, MA, USA).
Isolation of Macrophages
Murine peritoneal macrophage cells were isolated from eight-week old female BALB/C mice (the Institute of Zoology, Chinese Academy of Sciences, Beijing, China). Briefly, 3% Brewer thioglycollate medium (1mL per mouse daily, for 3 days) was injected into the peritoneal cavity 4 days before euthanization of the mice. After euthanized by rapid cervical dislocation, the mice were subjected to laparotomy by making an incision along the midline. Intraperitoneal injection with ice-cold PBS was performed by 10-mL syringe, and then the fluid was collected into a 50-mL centrifuge tube for further centrifugation at 400×g, for 10 minutes, at 4°C. The cell pellet was resuspended gently by ice-cold DMEM/F12 with 10% FBS and seeded into a 6-well cell culture plate (2×10⁶ cells per well). After 24 hours, the non-adherent cells were removed by gently washing with PBS. The adherent macrophages were subjected to 3D co-culture assay.
3D Co-Culture of BRCA Cells and Macrophages
To establish a 3D co-culture system, 50% Matrigel (Matrigel: DMEM=1:1) was added into 96-well plates (45μL per well) and incubated for 100 minutes at 37°C in a humidified atmosphere of 5% CO2. MCF-7 (7000 cells per well), BT-474 (11,000 cells per well) or MDA-MB-231 (7000 cells per well) after transfected with YBX1 small interfering RNA (siRNA) or scrambled siRNA for 24 hours were mixed with peritoneal macrophage cells (7000 cells per well) in the pre-coated 96-well plate, and co-cultured using DMEM with 10% FBS and 2% matrigel for another 48 hours.
CCK-8 Assay
A cell counting kit-8 (CCK-8; CK04-500T, Dojindo Laboratories Co. Ltd, Kumamoto, Japan) was applied to assess cell viability. 5% CCK-8 solution (CCK-8: DMEM=5:95) was added into 96-well plates (100mL per well), and the absorbance at 450nm was assessed by a multi-label counter after 15–60 minutes of incubation in dark at 37°C.
Isolation of CD8+ T Cells
Firstly, mononuclear cells were isolated from peripheral blood samples of healthy adult donors by Ficoll-Paque PLUS (Cytiva, Marlborough, MA, USA) density gradient centrifugation. Cell extracts were incubated with anti-CD8 antibody-coated magnetic microbeads (#130-045-201, Miltenyi Biotec, Bergisch Gladbach, Germany) for 15 min at 4°C, and then loaded onto a magnetic activated cell sorter (MACS) column that was placed in the magnetic field of the OctoMACS separator (#130-024-109, Miltenyi Biotec, Bergisch Gladbach, Germany). After washes with PBS, the column was removed from the magnetic field and CD8+ T cells were eluted.
Enzyme-Linked Immunosorbent Assay (ELISA) for Co-Culture Cytokines
To evaluate the interaction between BRCA cells and CD8+ T cells, the co-culture systems were established. Firstly, the CD8+ T cells were stimulated with 3ng/mL of phorbol 12-myristate 13-acetate (PMA) and 1μg/mL of ionomycin, and the cancer cells were transfected by siRNA. Then, the activated CD8+ T cells and the transfected cancer cells were co-cultured in 35mm cell culture dishes at a ratio of 5: 1 for 48 hours. The culture medium was collected after centrifugation at 2500 rpm for 20 minutes, and the secreted interleukin-2 (IL-2) and interferon-gamma (IFN-γ) in the medium were measured by ELISA kits (Mlbio, Shanghai, China) according to the manufacturer’s instructions.
Assay for CD8+ T Cell Cytotoxicity to BRCA Cells
MCF-7, BT-474, or MDA-MB-231 cells after siRNA transfection were co-cultured with activated CD8+ T cells for 48 hours (cancer cells:T cells = 5:1). The cytotoxicity of CD8+ T cells was determined by measuring lactate dehydrogenase (LDH) release from damaged cells using LDH Cytotoxicity Assay Kit (C0016; Beyotime Institute of Biotechnology, Shanghai, China). According to the manufacturer’s protocol. Briefly, the co-culture plate was centrifuged at 400×g for 5 minutes, and 120μL of supernatant from each well was aspirated and transferred to a new well and mixed with 60μL of LDH detection reagent. After incubation at RT for 30 minutes, the absorbance at 490nm and 600nm was measured with a multi-label counter and the amount of released LDH was calculated.
siRNA Interference and Transfections
YBX1-siRNA was purchased from GenePharma (Shanghai, China). The targeting sequences were as follows (gene: sense, antisense). YBX1 (#1): 5ʹ-CGUAACCAUUAUAGACGCUTT-3ʹ, 5ʹ-AGCGUCUAUAAUGGUUACGTT-3ʹ; YBX1 (#2): 5ʹ-GGAUAUGGUUUCAUCAACATT-3ʹ, 5ʹ-UGUUGAUGAAACCAUAUCCTT-3ʹ; negative control: 5ʹ-UUCUCCGAACGUGUCACGUTT-3ʹ, 5ʹ-ACGUGACACGUUCGGAGAATT-3ʹ. BRCA cells were seeded into six-well plates generally with a confluence of 30%. Transfections without serum were conducted with 80nM YBX1 siRNA or scrambled siRNAs using Lipofectamine 2000 reagent (Invitrogen, Carlsbad, CA) for 6 hours. After additional 24-hour culture with serum, the cells were subjected to the above-mentioned assays.
Statistical Analysis
The results generated in Oncomine are displayed with P-values and median rank. The Kaplan–Meier survival curves are displayed with HR and P-values from a Log rank test. The correlation between different genes was evaluated by the Spearman correlation test. In cellular experiments, data in bar graphs are expressed as the mean ± standard deviation (SD) from at least three independent experiments. Statistical analysis was conducted with the Student’s unpaired t-test or one-way analysis of variance (ANOVA). A P-values <0.05 were considered statistically significant.
Results
Decreased Expression of YBX1 in BRCA
We examined YBX1 mRNA levels in various cancers in the Oncomine database. The mRNA expression of YBX1 was lower in bladder, esophageal, and lung cancers, leukemia, myeloma, sarcoma, and especially in BRCA compared with the corresponding normal tissues; while higher expression of YBX1 was observed in bladder, brain, cervical, esophageal, head and neck, kidney, and ovarian cancers, myeloma, sarcoma and lymphoma (Figure 1A and B). RNA sequencing data from TIMER verified the findings by showing the significantly lower levels of YBX1 in BRCA, and the significantly higher ones in ESCA (esophageal carcinoma), HNSC (head and neck squamous cell carcinoma), KICH (kidney chromophobe cell carcinoma), LIHC (liver hepatocellular carcinoma), and STAD (stomach adenocarcinoma) (Figure 1C). Additionally, the protein array from CCLE database revealed a mean YB1 protein level below the baseline in BRCA cells, which also indicated the decreased expression of YBX1 in BRCA (Figure 1D).
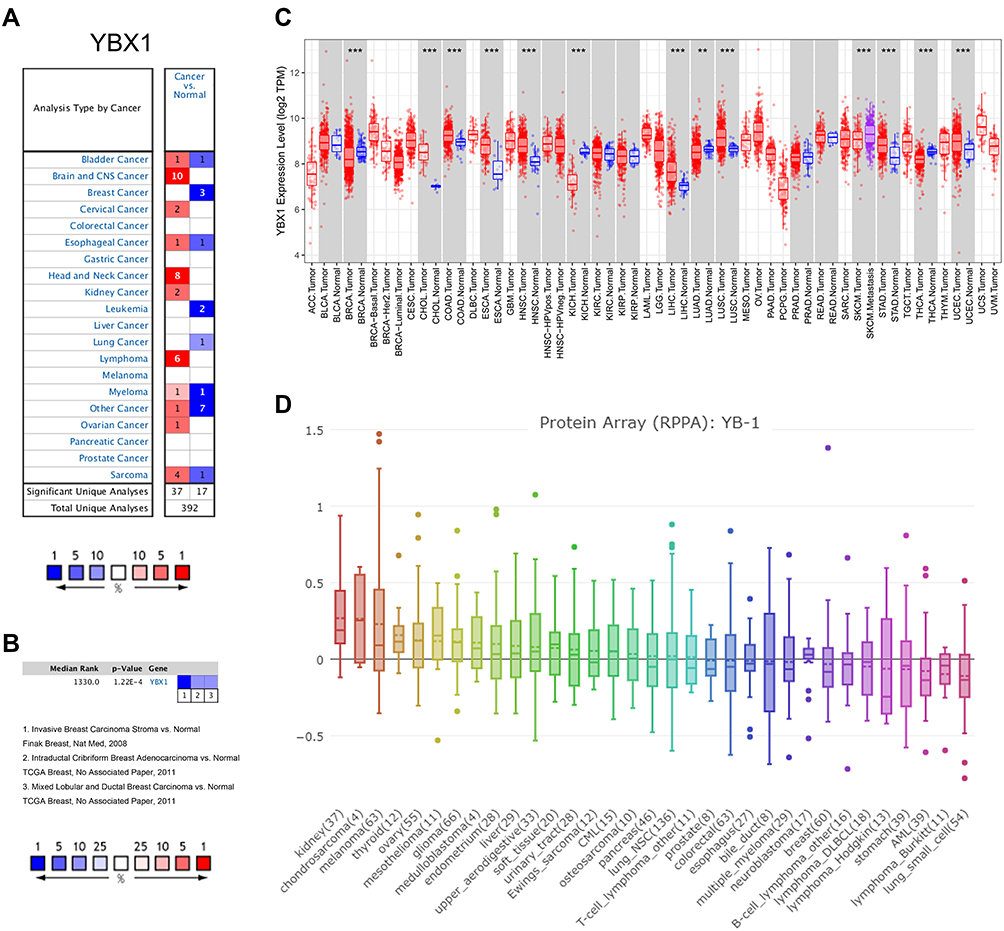 |
Figure 1 The YBX1 expression profiles in different type of human cancers. Abbreviations: BRCA, breast cancer; RPPA, reverse phase protein arrays; TIMER, the Tumor Immune Estimation Resource database; YBX1, Y-box binding protein 1. Notes: (A) Increased or decreased mRNA levels of YBX1 in datasets of various cancers compared with normal tissues via Oncomine database. (B) Representative datasets of BRCA with decreased YBX1 expression compared with normal tissues in Oncomine. (C) The expression levels of YBX1 in different tumor types analyzed by TIMER database. (D) The protein levels of YBX1in different type of cancer cell lines. **P<0.01, ***P< 0.001 compared with corresponding normal tissues. |
YBX1 Level is Higher in BRCA Subtypes with Worse Prognosis
To further understand the expression pattern of YBX1, BRCA samples were divided into subgroups according to clinicopathological features (Figure 2A–H). The UALCAN analysis showed that YBX1 expression decreased along with patient age (Figure 2B). Moreover, despite the decreased levels in the overall BRCA patient population, YBX1 was overexpressed particularly in the genomic subtype of TP53-mutant BRCA (Figure 2E), and in the molecular subtype of TNBC (Figure 2F and G) which were known to carrying worse prognosis.35 However, there was no exact relationship between YBX1 expression and tumor stage or nodal metastasis status (Figure 2D and H). To verify these findings, the clustering of several clinicopathological parameters was performed according to the YBX1 mRNA level using cBioPortal database, and the BRCA with high histologic grade, as well as the TNBC, were clustered to the side of high YBX1 expression (Figure 3A). Besides, immunohistochemical and Western blot analyses of YB1 in different molecular subtypes of BRCA also revealed that YB1 expression was highest in TNBC (Figure 3B and C).
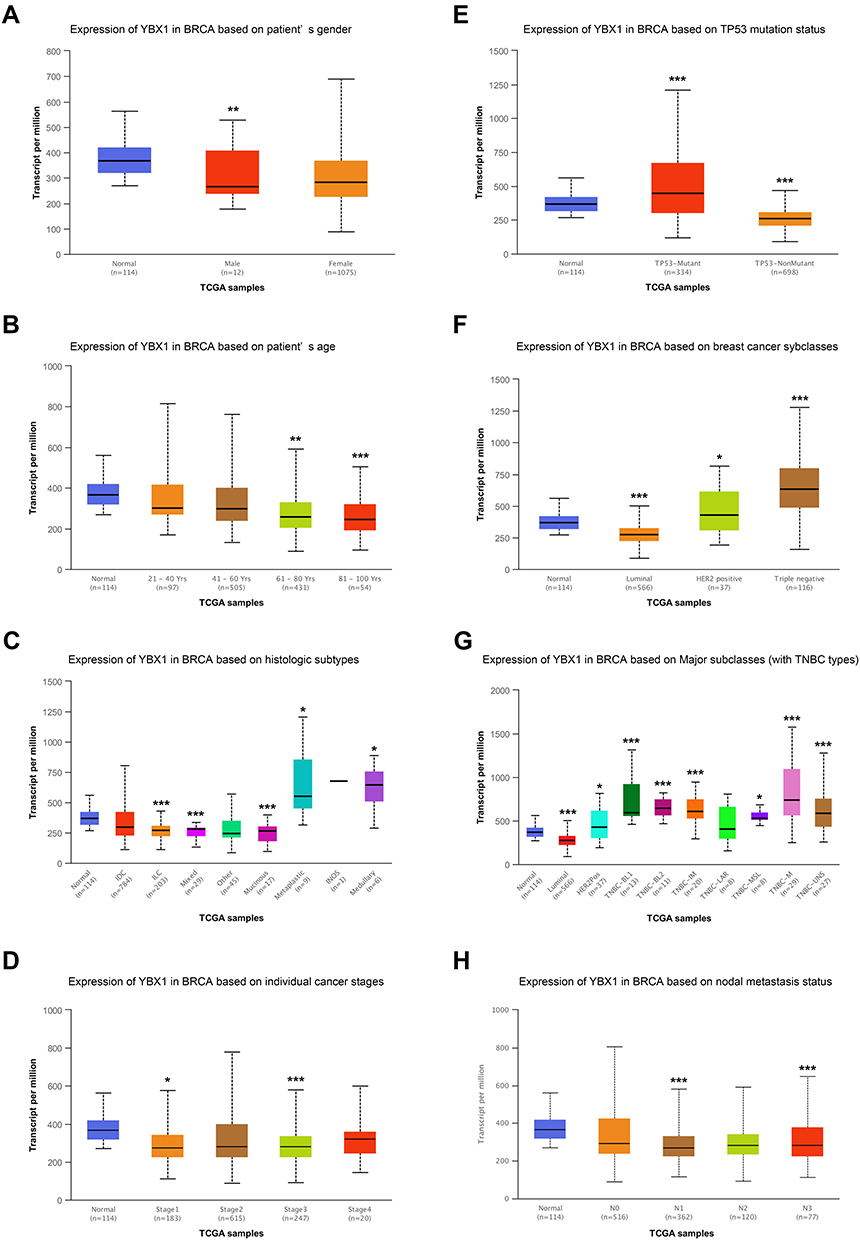 |
Figure 2 Subgroup analysis of YBX1 mRNA level in BRCA by UALCAN database. Abbreviations: BRCA, breast cancer; IDC, invasive ductal carcinoma; ILC, invasive lobular carcinoma; INOS, infiltrating– not otherwise specified; TCGA, The Cancer Genome Atlas; TP53, tumor protein 53; YBX1, Y-box binding protein 1. Notes: Boxplot for relative mRNA levels of YBX1 in normal tissues and BRCA samples with different (A) genders; (B) age stages; (C) histologic subtypes; (D) cancer stages; (E) TP53 mutation status; (F) molecular subtypes; (G) triple-negative BRCA subtypes; (H) nodal metastasis status. *P< 0.05, **P<0.01, ***P< 0.001 compared with normal tissues. |
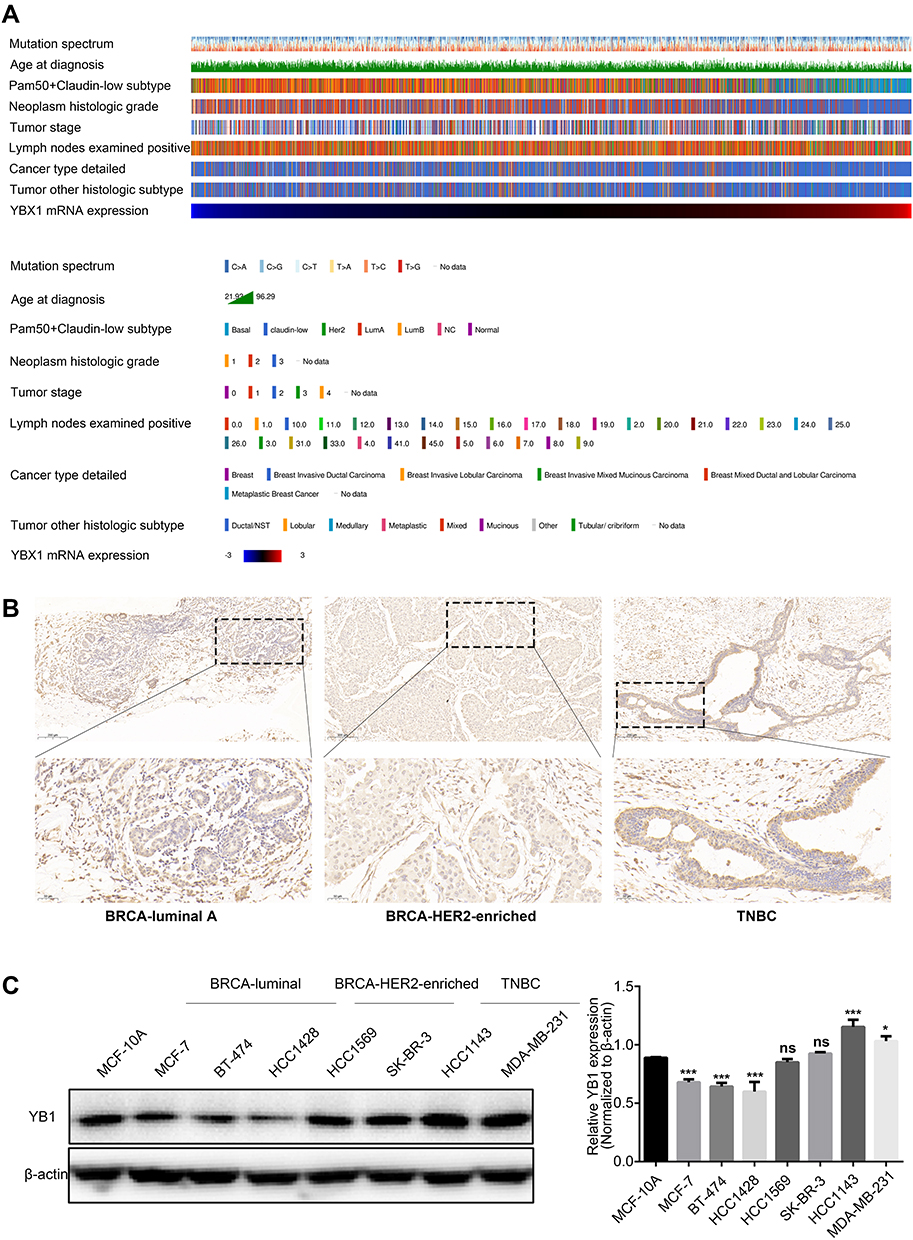 |
Figure 3 The correlation between YBX1 expression and clinicopathological parameters in BRCA. Abbreviations: BRCA, breast cancer; cBioPortal, the cBio Cancer Genomics Portal database; ns, not significant; TNBC, triple-negative breast cancer; YBX1, Y-box binding protein 1. Notes: (A) The clustering of clinicopathological parameters according to the YBX1 mRNA level using cBioPeortal database. (B) Immunohistochemical staining of YB1 in BRCA samples with different molecular subtypes. (C) The different protein expression of YB1 in human breast epithelial cells and aseries of BRCA cell lines. *P<0.05 and ***P<0.001 vs control group. |
High Expression of YBX1 Predicts Shorter Survival in BRCA Patients
Survival data of BRCA from GEO, EGA, and TCGA were meta-analyzed using the Kaplan–Meier plotter. For the entire BRCA population, the OS and RFS in YBX1 high-expressing group were significantly lower than those in YBX1 low-expressing one (OS: HR 1.67, 95% CI 1.27–2.18, P=0.00017; RFS: HR 1.83, 95% CI 1.61–2.09, P=1e-16; Figure 4A and B). The difference in survival outcomes remained significant after adjustment for potential confounds including patient age, sex, ethnicity and tumor stage using the TIMER tool (Supplementary Figure 1). To determine whether the worse outcomes of the YBX1 high-expressing group was due to the poorer prognosis of the TNBC subtype, we evaluated the OS and RFS in the four molecular subtypes of BRCA (luminal A, luminal B, TNBC, and human epidermal growth factor receptor 2 [HER2]-enriched). Interestingly, the significantly lower survival rates of YBX1 high-expressing groups were demonstrated not in the HER2-enriched or TNBC subtypes, but in the two luminal subtypes (luminal A: OS: HR 1.93, 95% CI 1.22–3.05, P=0.0042; RFS: HR 1.85, 95% CI 1.51–2.28, P=3.1e-9; luminal B: OS: HR 1.08, 95% CI 0.68–1.70, P=0.75; RFS: HR 1.29, 95% CI 1.02–1.62, P=0.03; HER2-enriched: OS: HR 0.90, 95% CI 0.43–1.86, P=0.77; RFS: HR 0.90, 95% CI 0.57–1.43, P=0.65; TNBC: OS: HR 1.44, 95% CI 0.80–2.58, P=0.22; RFS: HR 1.10, 95% CI 0.81–1.50, P=0.53; Table 1, Figure 4A and B). Taken together, these results suggest the independent prognostic value of YBX1 in BRCA rather than the impact of confounding factors or the overexpression of YBX1 in TNBC.
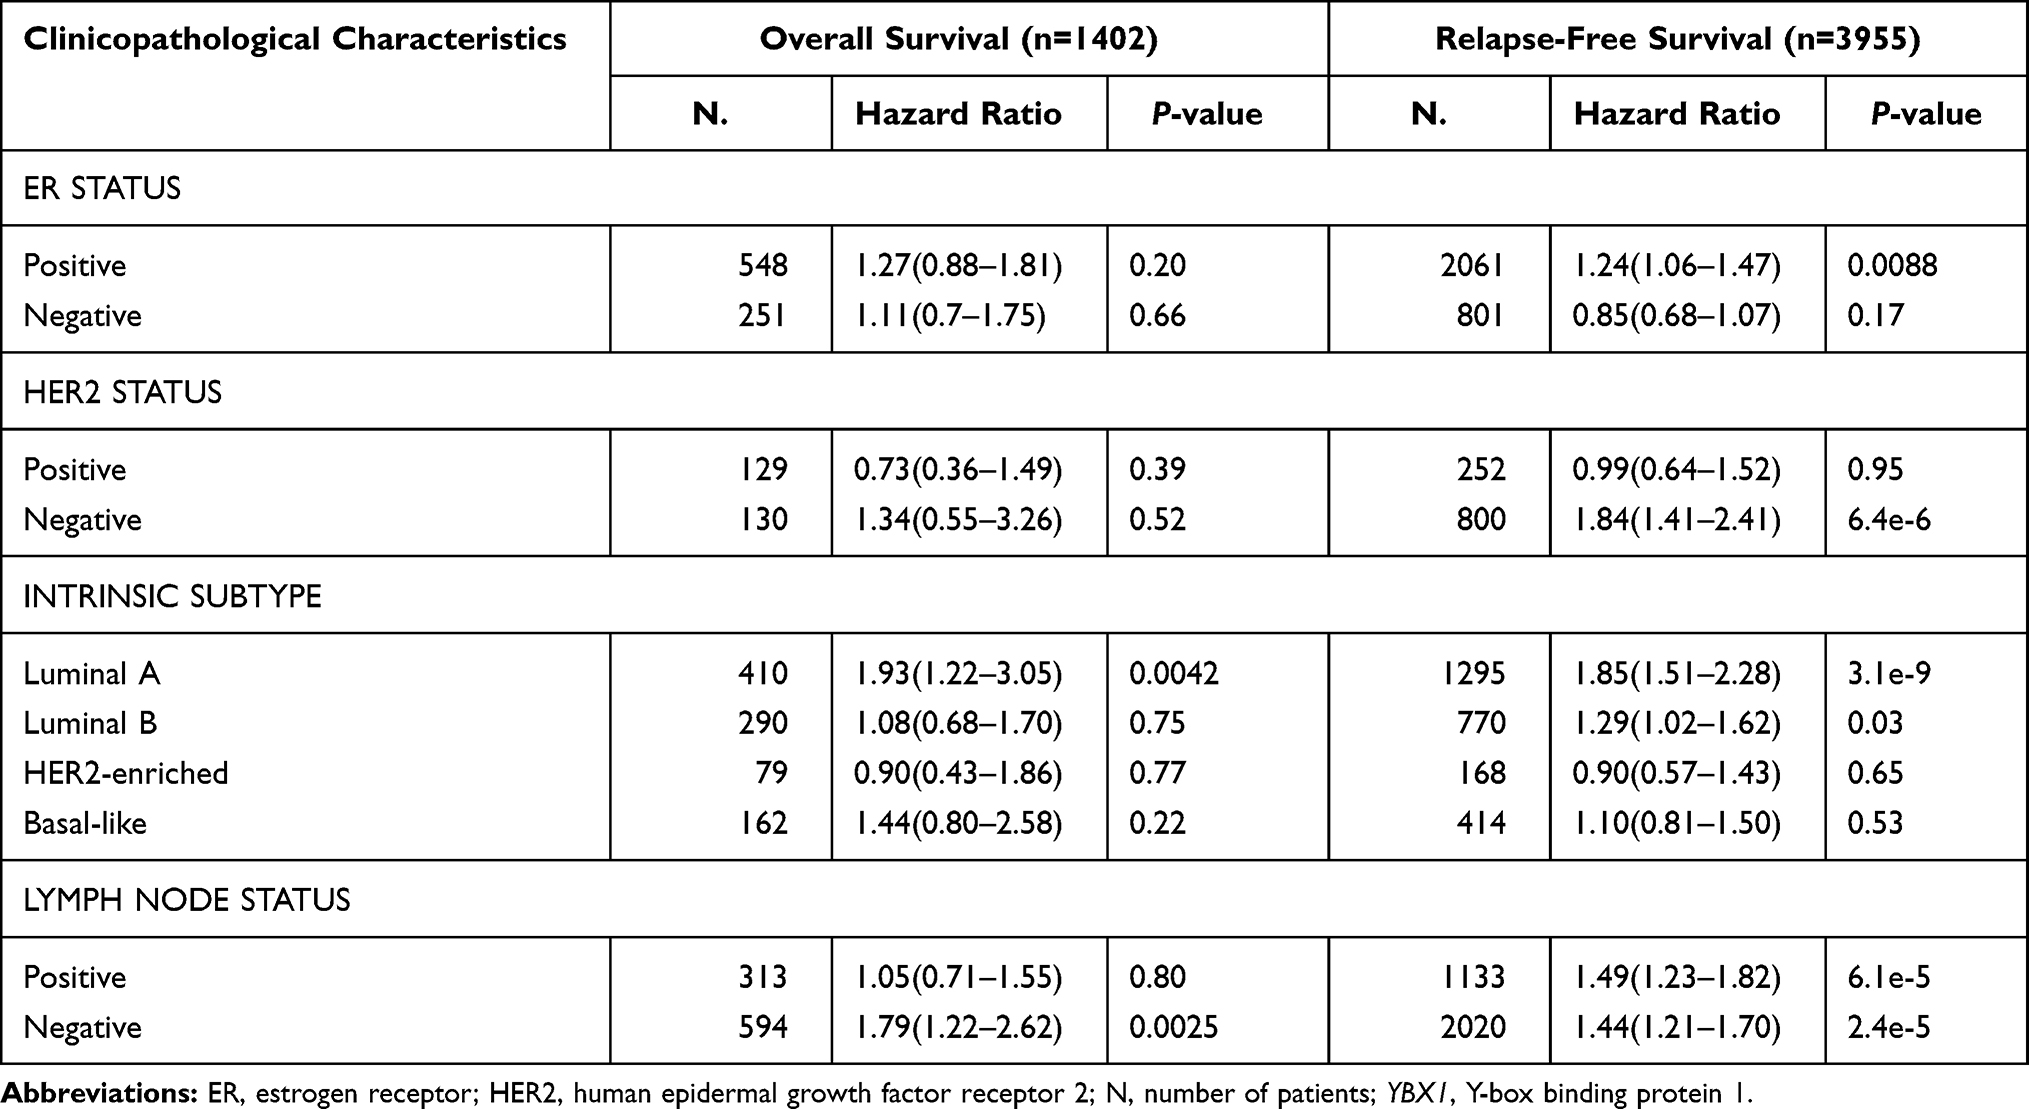 |
Table 1 Correlation of YBX1 Expression and Clinical Prognosis in Breast Cancer with Different Clinicopathological Parameters by Kaplan–Meier Plotter |
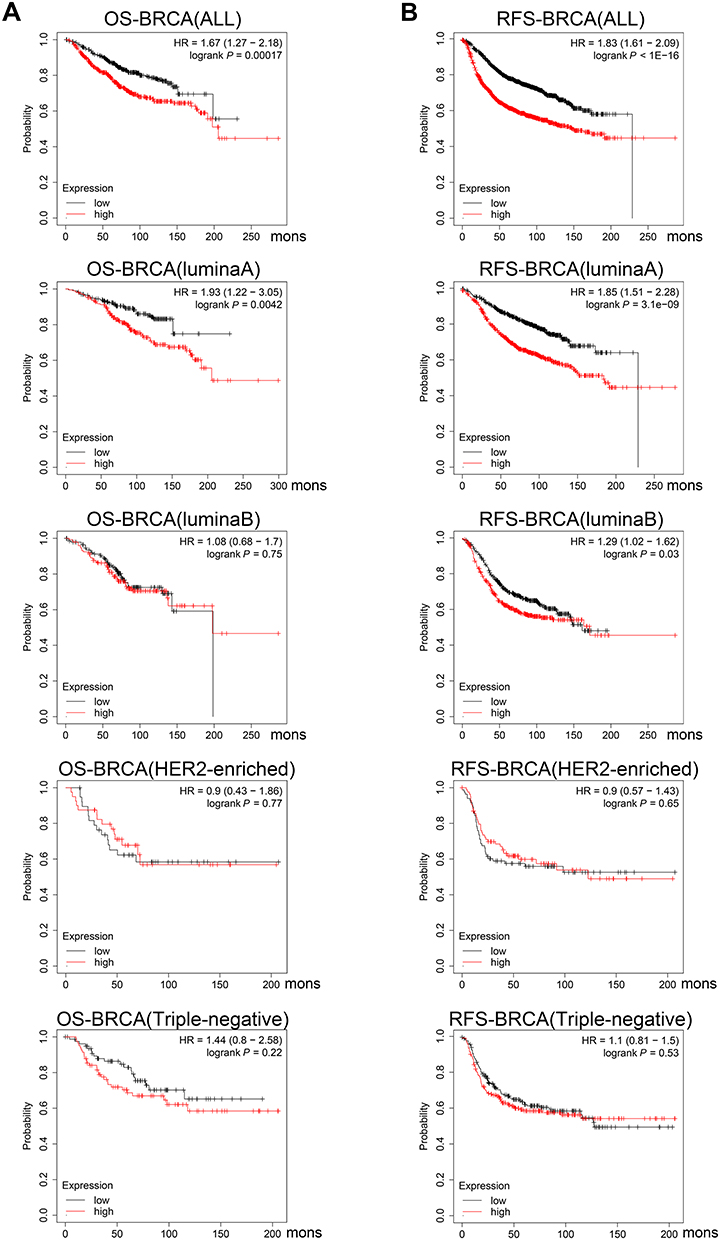 |
Figure 4 Survival curves comparing the high and low expression of YBX1 in BRCA by Kaplan–Meier plotter database. Abbreviations: BRCA, breast cancer; HR, hazard ratio; OS, overall survival; RFS, relapse-free survival; YBX1, Y-box binding protein 1. Notes: (A) Survival curves of OS in the entire BRCA cohort and different subtypes; (B) Survival curves of RFS in the entire BRCA cohort and different subtypes. |
To better understand potential mechanisms of the poorer prognosis in YBX1 high-expressing BRCA, we analyzed the correlation between YBX1 level and patients’ clinicopathologic characteristics based on data in the Kaplan–Meier plotter database. High expression of YBX1 was associated with shorter RFS in estrogen receptor (ER)-positive patients (HR 1.24, 95% CI 1.06–1.47, P=0.0088) as well as HER2-negative patients (HR 1.84, 95% CI 1.41–2.41, P= 6.4e-6; Table 1), justifying the worse prognosis of luminal BRCA with high YBX1 expression. In particular, a stronger correlation was observed between YBX1 overexpression and negative lymph node status (OS: HR=1.79, 95% CI: 1.22–2.62, P=0.0025) as compared to positive lymph node status (OS: HR 1.05, 95% CI 0.71–1.55, P=0.80; Table 1). This finding suggests that YBX1 expression level has a greater impact on the prognosis of BRCA patients without lymph node metastasis.
YBX1 is Correlated with Macrophage Polarization from M1 to M2 in BRCA
Immune infiltrates play an important role in predicting clinical outcomes in various cancers including BRCA.36,37 Here, we evaluated the association between YBX1 and immune cell infiltration in BRCA via the TIMER database. For the entire BRCA population as well as the four molecular subtypes except for TNBC, YBX1 was significantly negative correlated with tumor purity (BRCA: rs=−0.155, P=8.27e-7; BRCA-luminal A: rs=−0.225, P=3.85e-9; BRCA-luminall B: rs=−0.195, P=6.48e-3; BRCA-HER2: rs=−0.241, P=3.98e-2; BRCA-TNBC: rs=0.167, P=2.69e-2; Figure 5A–E), suggesting the increasing immune cell infiltration along with increasing expression of YBX1. When we examined individual infiltrating cell types, we found a significant positive correlation between YBX1 and macrophages in the entire BRCA population and in patients with the luminal subtypes but not in HER2-enriched and TNBC patients (BRCA: rs=0.222, P=1.50e-12; BRCA-luminal A: rs=0.224, P=2.81e-7; BRCA-luminal B: rs=0.257, P=3.29e-4; BRCA-HER2: rs=−0.040, P=7.36e-1; BRCA-TNBC: rs=0.024, P=7.56e-1). As macrophages in the tumor microenvironment can differentiate into M1 and M2 which possess opposite effects on tumor progression, we examined the relationship between the expression of M1 and M2 macrophage markers and YBX1 in the TIMER database. The results showed that the gene markers of M2 macrophages, namely CD163 (rs=0.289, P=1.54e-20), VSIG4 (rs=0.184, P=4.69e-9), and MS4A4A (rs=0.220, P=2.54e-12) had stronger positive correlations with YBX1 expression than the M1 macrophage markers (iNOS: rs=0.198, P=2.75e-10; IRF5: rs=0.061, P=5.62e-2; COX2: rs=0.243, P=8.91e-15) in BRCA (Table 2). Moreover, the tendency was more obvious in BRCA with luminal subtypes (luminal A: CD163: rs=0.271, P=1.45e-4; VSIG4: rs=0.159, P=2.78e-2; MS4A4A: rs=0.189, P=8.82e-3; iNOS: rs=0.060, P=1.74e-1; IRF5: rs=0.046, P=2.93e-1; COX2: rs=−0.060, P=4.10e-1; luminal B: CD163: rs=0.271, P=1.45e-4; VSIG4: rs=0.159, P=2.78e-2; MS4A4A: rs= 0.189, P=8.82e-3; iNOS: rs=0.084, P=2.47e-1; IRF5: rs=−0.039, P=5.90e-1; COX2: rs=−0.060, P=4.10e-1; Table 2).
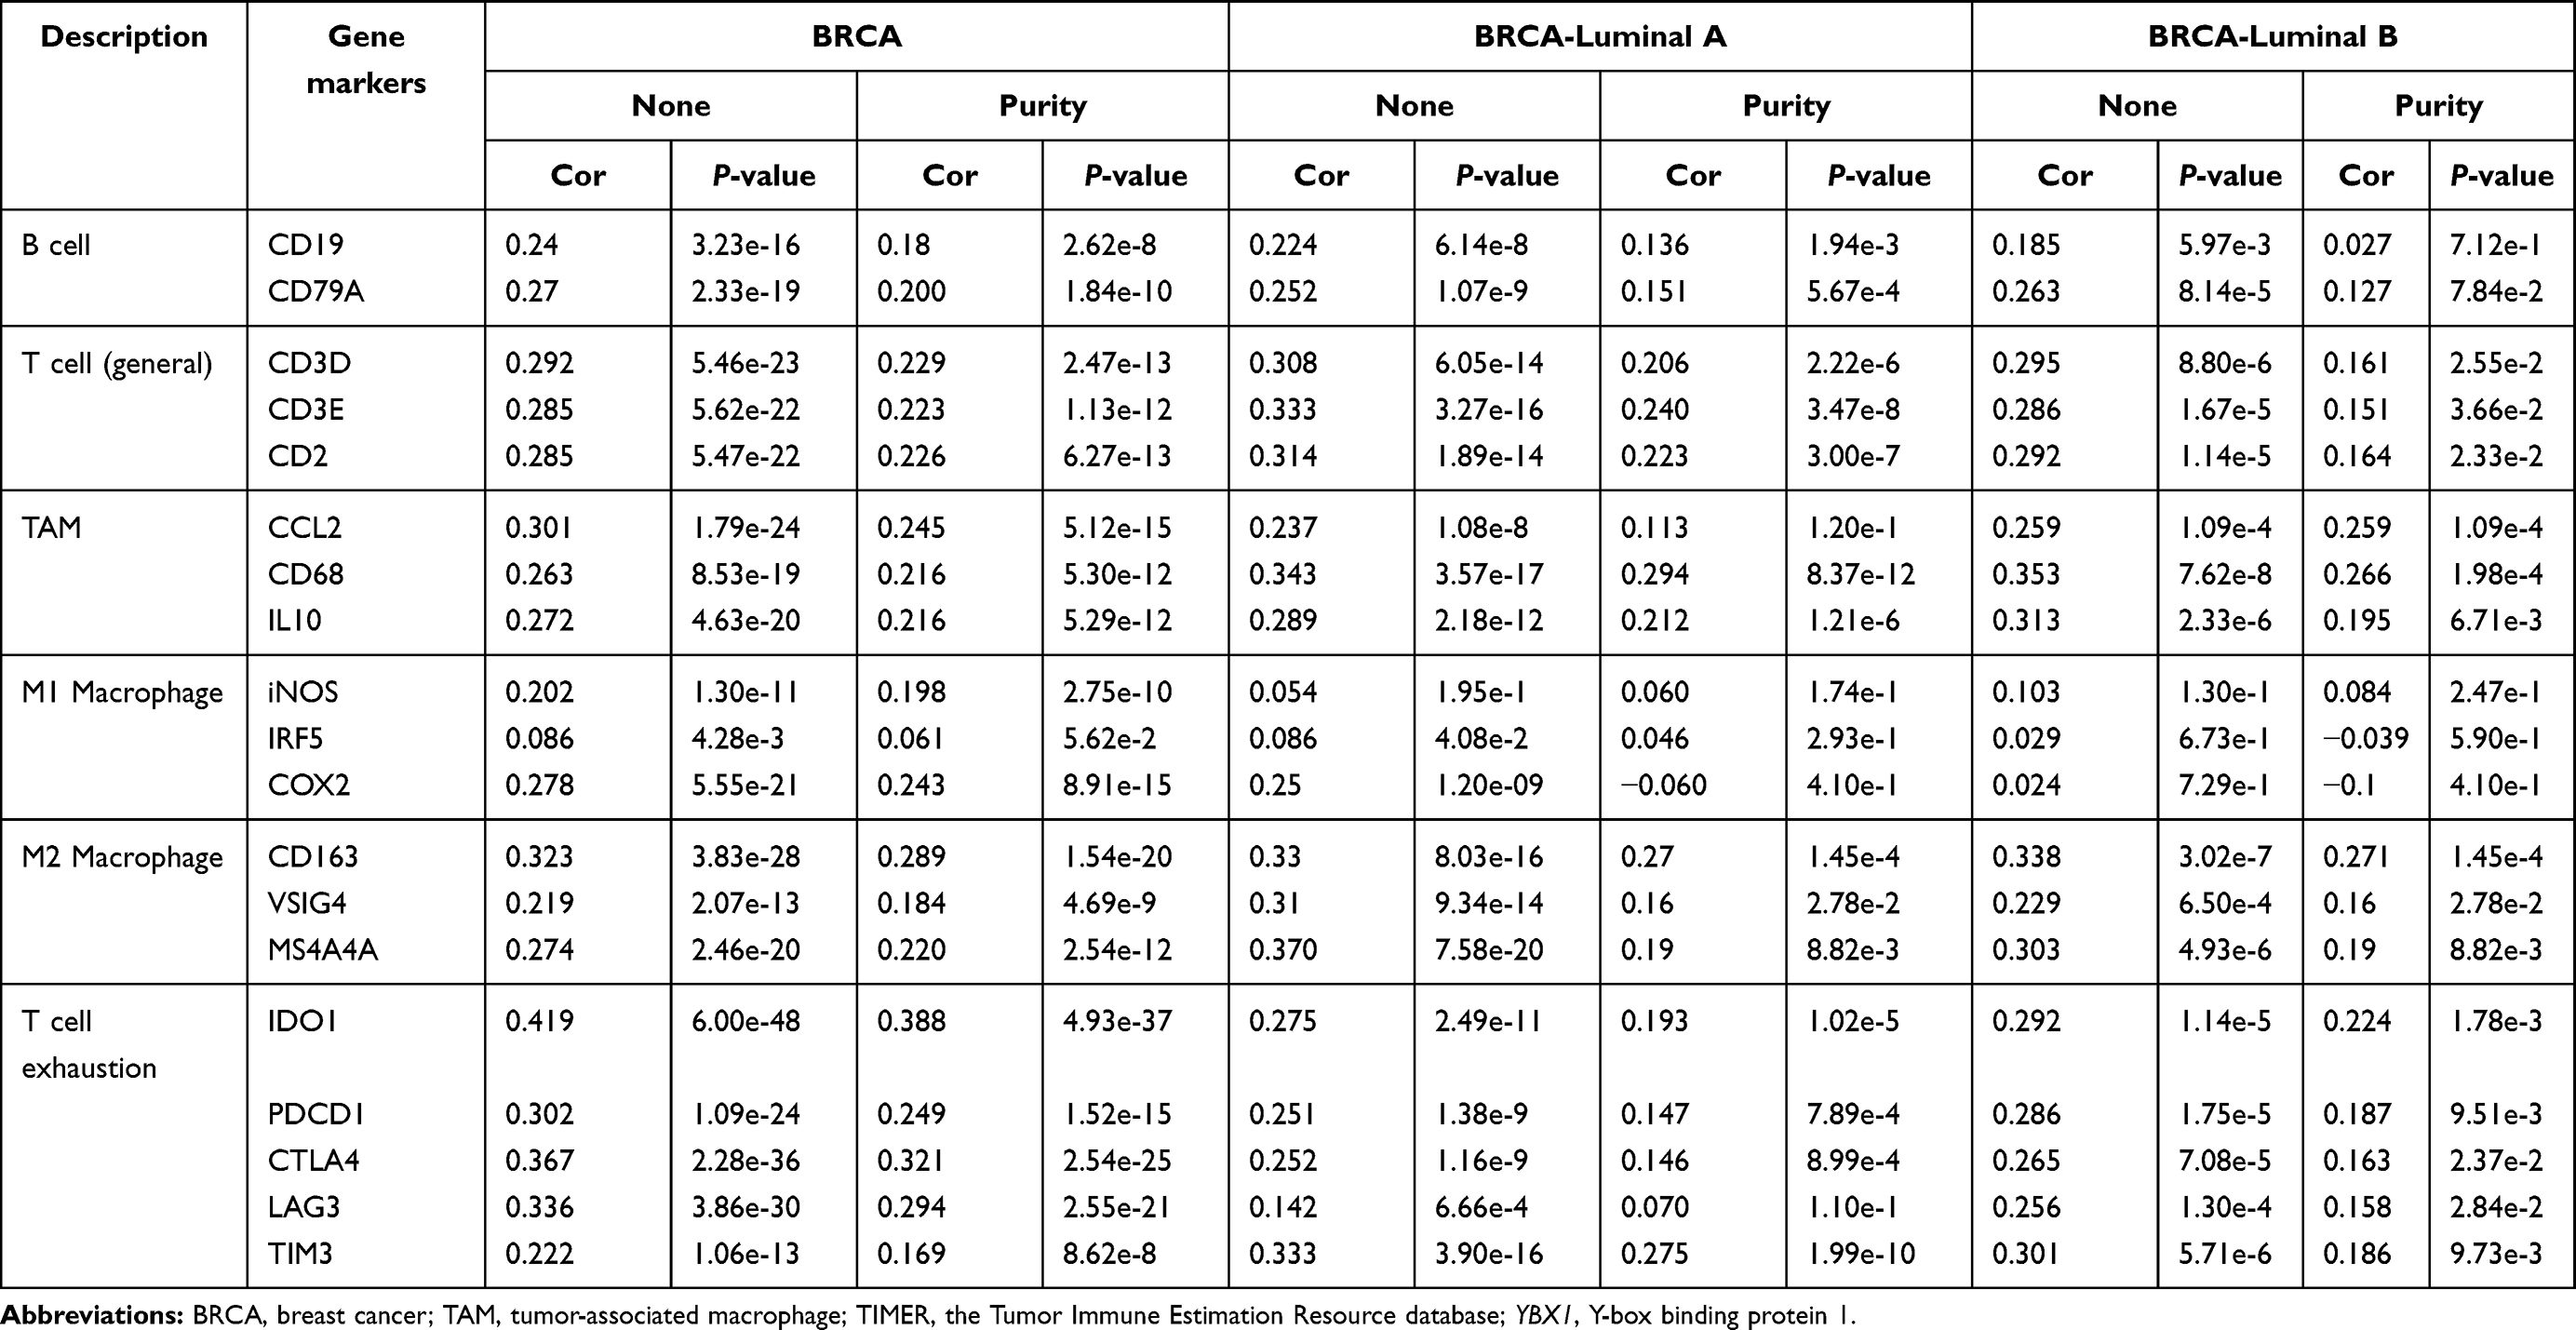 |
Table 2 Correlation Analysis Between YBX1 and Markers of Immune Infiltrates via TIMER |
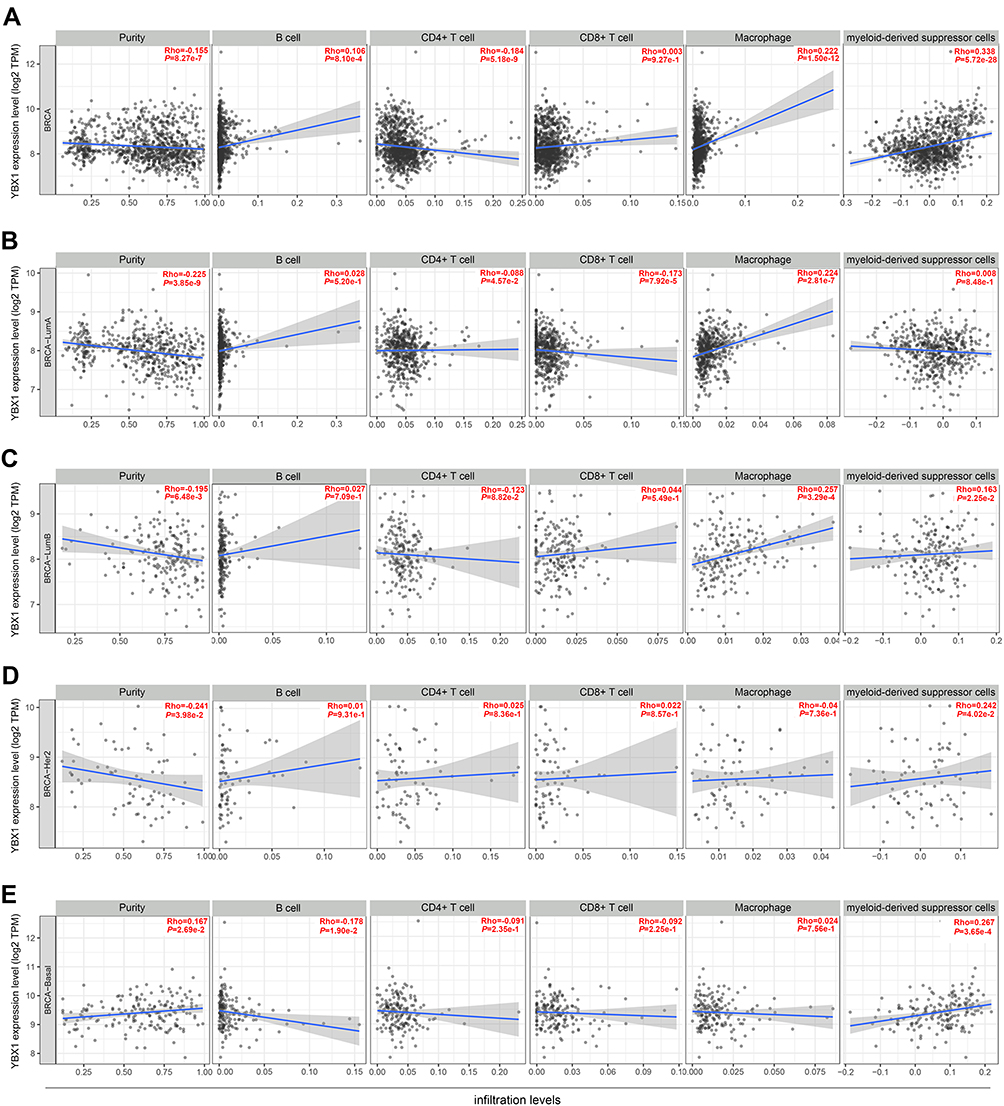 |
Figure 5 Correlation of YBX1 expression with immune cell infiltration level in (A) the entire BRCA cohort; (B) the luminal A subtype; (C) the luminal B subtype; (D) the HER2-enriched subtype; and (E) the triple-negative subtype by TIMER database. Abbreviations: BRCA, breast cancer; TIMER, the Tumor Immune Estimation Resource database; YBX1, Y-box binding protein 1. |
To validate the above findings, we analyzed data in the TIMER database and performed a macrophage-tumor cell co-culture assay. In the TIMER analysis, the immune infiltration estimation with GSE1456 dataset reviewed remarkable increases of M0 and M2, rather than M1, macrophage infiltration in YBX1 high-expressing group (Figure 6A). Moreover, when analyzing survival outcomes in relation to macrophage infiltration and YBX1 expression in BRCA patients, we found a synergy of high YBX1 expression with high M2 infiltration which yielded the lowest survival outcome (Figure 6B). In the 3D macrophage-tumor cell co-culture system, although YBX1 knockdown could cause the inhibition of cell viability when BRCA cells were cultured alone, the addition of macrophages remarkably aggravated the inhibitory effect (Figure 7A and B). However, the phenomenon exist only in the luminal BRCA cells MCF-7 and BT-474, but not in TNBC cells MDA-MB-231 (Figure 7B). All these results indicate that YBX1 overexpression accelerates the luminal BRCA progression by promoting macrophage polarization from M1 to M2.
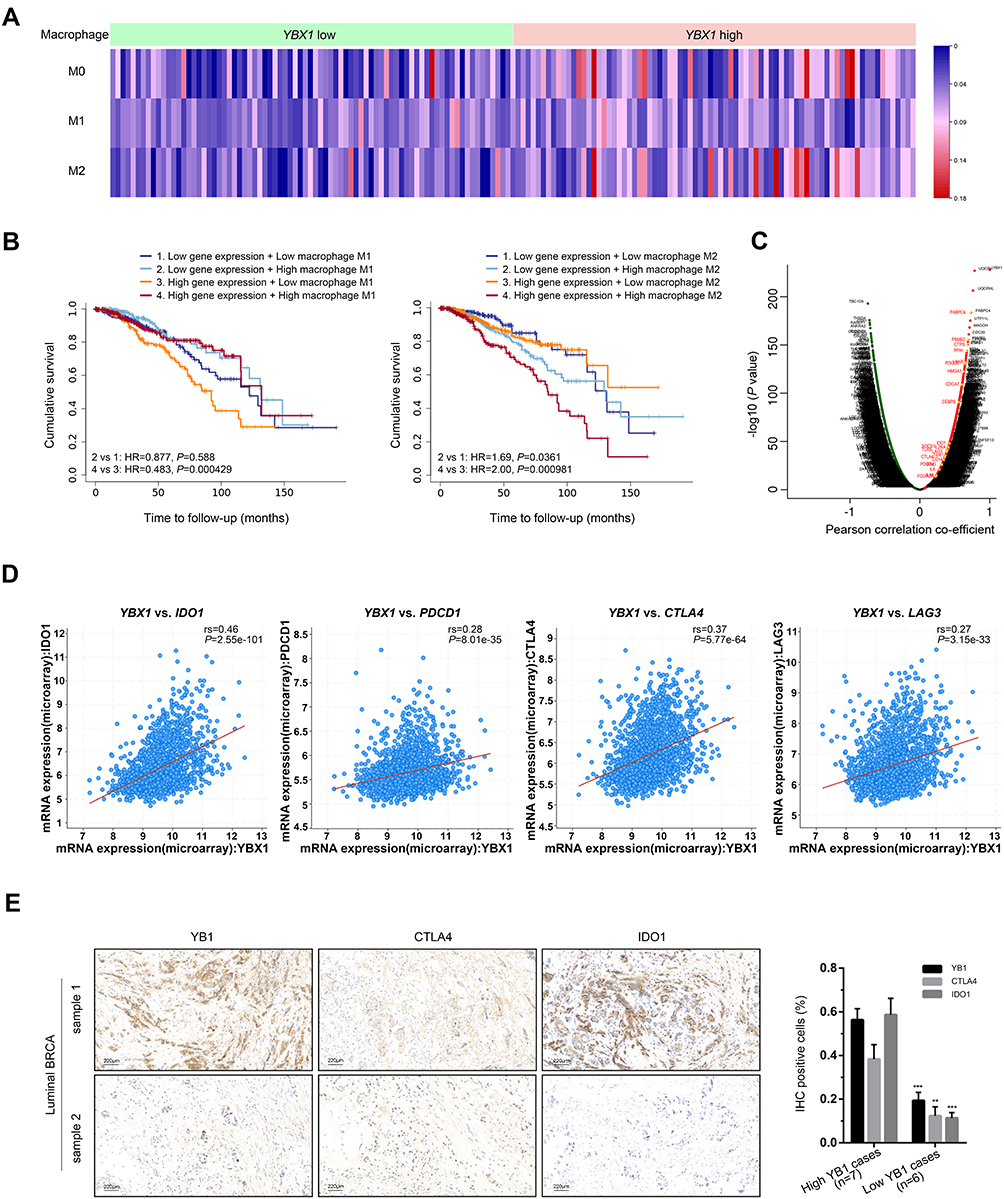 |
Figure 6 Verification of the correlation between YBX1 and immune cell infiltration in BRCA. Abbreviations: BRCA, breast cancer; cBioPortal, the cBio Cancer Genomics Portal database; CTLA4, cytotoxic T-lymphocyte associated protein 4; IDO1, indoleamine 2,3-dioxygenase 1; LAG3, lymphocyte activating 3; NES, normalized enrichment score; HR, hazard ratio; PDCD1 programmed cell death 1; TIMER, Tumor Immune Estimation Resource; TCGA, The Cancer Genome Atlas; YBX1, Y-box binding protein 1. Notes: (A) Infiltration levels of different type of macrophages in samples from GSE1456 dataset with different YBX1 expression level. (B) Kaplan–Meier curves from the TIMER database showing the impacts of YBX1 expression and M1/M2 infiltration on survival of BRCA patients. (C) Ascatter plot of correlation between YBX1 and various genes especially those associated with immunosuppression (annotated in red) in BRCA. (D) Correlation of YBX1 with IDO1, PDCD1, CTLA4 and LAG3 in BRCA verified by cBioPortal database. (E) Immunohistochemical staining of IDO1 and CTLA4 in luminal BRCA samples with different YB1 expression levels. **P<0.01 and ***P<0.001 vs corresponding YB1 high-expressing groups. |
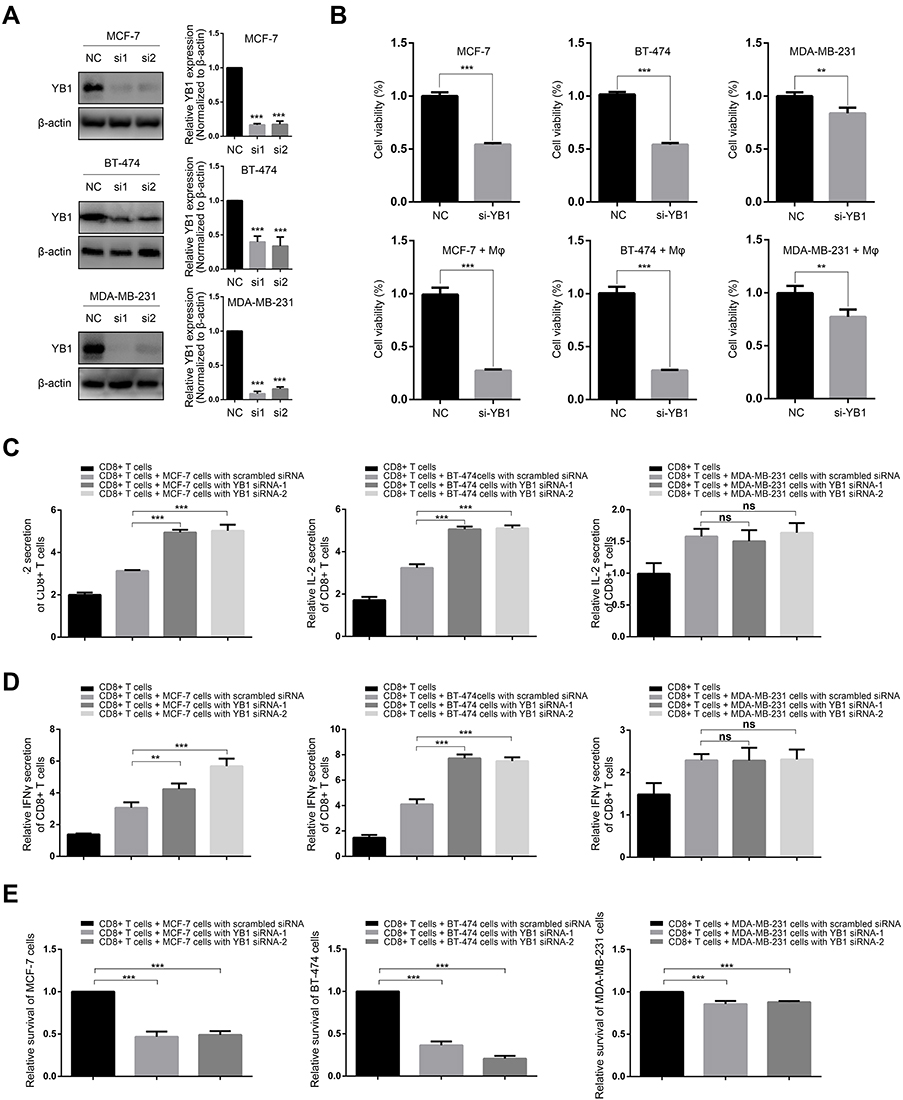 |
Figure 7 Effect of YBX1 knockdown on the cytotoxicity of macrophages and CD8+ T cells in co-culture system of BRCA cells and immunocytes. Abbreviations: BRCA, breast cancer; IFN-γ, interferon-γ; IL-2, interleukin-2; LDH, lactate dehydrogenase; NC, negative control; YBX1, Y-box binding protein 1. Notes: (A) YBX1 was effectively knocked down by siRNAs in MCF-7, BT-474, and MDA-MB-231 cells. (B) BRCA cells with or without knockdown of YBX1 were cultured alone or co-cultured with peritoneal macrophages, and cell viability was evaluated. For luminal BRCA cells, namely MCF-7 and BT-474, the decrease of cell viability after YBX1 knockdown were more dramatic in co-cultures compared with the single culture system. However, no difference was observed for MDA-MB-231 TNBC cells. (C) IL-2 production by activated CD8+ Tcells co-cultured with BRCA cells transfected with YBX1 siRNA or scrambled negative control siRNA. YBX1 knockdown significantly increased IL-2 secretion in co-cultures of CD8+ Tcells with MCF-7 or BT-474 cells but not in the co-culture with MDA-MB-231 cells. (D) IFN-γ production by activated CD8+ Tcells co-cultured with BRCA cells transfected with YBX1 or scrambled negative control siRNA. YBX1 knockdown significantly increased IFN-γ secretion in the co-cultures of CD8+ Tcells and MCF-7 or BT-474 cells but not in the co-culture with MDA-MB-231 cells. (E) The relative survival of BRCA cells represented by the release of LDH in co-cultures of CD8+ Tcells and BRCA cells with or without YBX1 knockdown. YBX1 depletion markedly reduced the survival of MCF-7 and BT-474 cells but not MDA-MB-231 cells. **P<0.01, ***P<0.001 compared with corresponding negative control groups. |
The Positive Correlation Between YBX1 and T Cell Exhaustion in BRCA
In addition to markers of tumor associated macrophages, gene markers of T cell exhaustion were demonstrated to correlate significantly with YBX1 expression as well (BRCA: IDO1: rs=0.388, P=4.93e-37; PDCD1: rs=0.249, P=1.52e-15; CTLA4: rs=0.321, P=2.54e-25; LAG3: rs=0.294, P=2.55e-21; TIM3: rs=0.169, P=8.62e-8; luminal A subtype: IDO1: rs=0.193, P=1.02e-5; PDCD1: rs=0.147, P=7.89e-4; CTLA4: rs=0.146, P=8.99e-4; LAG3: rs=0.070, P=1.10e-1; TIM3: rs=0.275, P=1.99e-10; luminal B subtype: IDO1: rs=0.224, P=1.78e-3; PDCD1: rs=0.187, P=9.51e-3; CTLA4: rs=0.163, P=2.37e-2; LAG3: rs=0.158, P=2.84e-2; TIM3: rs=0.186, P=9.73e-3; Table 2). Analysis from cBioPortal gave the similar correlation of YBX1 with IDO1, PDCD1, CTLA4 and LAG3 (Figure 6D). Since IDO1 and CTLA4 showed the strongest correlations with YBX1, immunohistochemical staining of IDO1, CTLA4 and YB1 was performed in luminal BRCA samples, and significant decreases of IDO1 and CTLA4 expression were demonstrated along with the downregulation of YB1 expression (Figure 6E). Additionally, scatter plot from LinkedOmics showed the significant positive association between YBX1 and some other immunosuppression-related genes such as CTPS, LYAR etc (Figure 6C).38,39
To confirm the positive correlation between YBX1 and T cell suppression, a co-culture system was used to test the effect of YBX1 knockdown in BRCA cells on the functions of activated CD8+ T cells. YBX1 depletion resulted in significant increases in LDH release and secretion of IL-2 and IFN-γ in co-cultures of T cells with MCF-7 or BT-474 luminal BRCA cells but not MDA-MB-231 TNBC cells (Figure 7C–E). These results indicate that YBX1 overexpression in luminal BRCA induces T cell exhaustion thereby accelerating tumor progression.
Discussion
YBX1 is known as an oncogene that facilitates malignant progression and induces chemoresistance in many cancers.40 In this study, on the basis of studying the expression pattern of YBX1 in different BRCA subtypes, we further investigated the impact of immune cell infiltration along with YBX1 overexpression on the prognosis of BRCA. We found that high YBX1 expression predicted significantly shorter survival in BRCA, especially the luminal subtypes. Moreover, this correlation was demonstrated to be associated with M2 macrophage infiltration and T cell exhaustion.
Several studies have reported an overall decrease in YBX1 expression in BRCA.41–43 Our study confirms it and further reveals the differential expression of YBX1 in the four molecular subtypes. YBX1 was downregulated in the luminal BRCA subtypes but upregulated in TNBC compared to normal tissues. A possible explanation for the opposite patterns is that YBX1 is negatively correlated with ER and progesterone receptor (PR) levels.8,44–47 Kuwano et al summarized seventy independent studies involving YBX1 expression in cancers and demonstrated positive correlation of YBX1 with common oncogenes such as epidermal growth factor receptor (EGFR), androgen receptor (AR), and ATP binding cassette subfamily B member 1 (ABCB1), but a strong negative correlation with ERα in BRCA.8 Bansal et al assessed the expression of ER, PR and YB1 by immunohistochemistry in the specimens of seventy-four BRCA patients, finding significantly negative correlation of YB1 with ER and PR expression.46 Since hormone receptors, ER and PR, signify luminal BRCA rather than TNBC, YBX1 is more prone to be expressed highly in TNBC rather than luminal BRCA.
As for prognosis, the present study found that high expression of YBX1 predicted worse clinical outcomes in BRCA in general but especially in the luminal subtypes. However, a retrospective study that analyzed the clinicopathologic characteristics of 4049 BRCA cases showed that YBX1 overexpression was linked to shorter RFS and disease-specific survival across all BRCA subtypes including HER2-positive BRCA and TNBC.48 This inconsistency may be explained by methodological differences in the detection of YBX1 expression. Our study detected the mRNA level of YBX1 from GEO, EGA, and TCGA using the JetSet best probe set 208628_s_at, whereas the previous study assessed the protein level of YBX1 from a large tumor tissue microarray by immunohistochemistry. The incomplete correlation between the expression profiles of YBX1 mRNA and protein could underlie the observed discrepancy in clinical outcomes.49,50 Nonetheless, the conclusion can be drawn that, for luminal BRCA, the subtypes with positive expression of hormone receptors and less frequency of YBX1 expression, high YBX1 expression can be identified as a predictive biomarker of poor survival.
Given the downregulation and the prognostic value of YBX1 expression in luminal BRCA, we can infer that even if not participating in tumorigenesis, YBX1 overexpression is involved in the progression of luminal BRCA. As tumor microenvironment alteration is a vital factor in tumor progression,51 we explored whether the worse prognosis of YBX1 high-expressing groups resulted from immune cell infiltration into the tumor microenvironment. Our analysis of public datasets along with results from the immunocyte–tumor cell co-culture assay revealed the positive correlation between YBX1 and M2 macrophage infiltration and T cell exhaustion in BRCA. M2 macrophages exhibit a protumoral phenotype and T cell exhaustion leads to immune escape of cancer cells, which together facilitate tumor progression including relapse in situ and distant metastasis.52,53 Interestingly, consistent with the prognostic results, the significant correlation of YBX1 with M2 infiltration and T cell exhaustion was only observed in luminal BRCA rather than other subtypes, implying that these immune mechanisms contributed to the reduced survival of patients with high YBX1 expression. Recent investigations have provided some potential mechanisms about the impact of YBX1 on macrophage activities.54,55 For example, Hessman et al evaluated the effect of YB1 on the tumor necrosis factor alpha (TNFα)-TNF receptor interaction in macrophages with the flow cytometric TNFα binding assay, demonstrating that YB1 competed with TNFα for receptor binding and thereby inhibited the TNFα signaling cascade that induces macrophage polarization from M2 to M1;54 this was supported by our finding that YBX1 promoted macrophage polarization from M1 to M2. For another thing since luminal BRCA with high YBX1 expression suffered from greater T cell exhaustion and presented higher levels of IDO1 and CTLA4, IDO1/CTLA4 inhibitors, namely ipilimumab and indoximod, may bring more clinical benefits for this subgroup. Moreover, the addition of M1 polarization agents, namely IFN-γ and lipopolysaccharide, was suggested to augment the treatment efficacy. Thus, a promising therapeutic strategy for YBX1 high-expressing luminal BRCA may be hidden in the combination of surgery, chemotherapy drugs, antiestrogens, IDO1/CTLA4 inhibitors and M1 polarization agents, which warrants evaluation in clinical trials.
Our study has several limitations. Firstly, most of the data analyzed in this study were obtained from the online databases. As for our own clinical cases, the lack of systematic follow-up made it difficult to accurately infer prognosis. Secondly, although statistically significant, the correlation between YBX1 and the markers of T cell exhaustion were not strong; therefore, large-sample studies with the expression data for YBX1, IDO1 and CTLA4 are needed to verify the practical significance of this finding. Finally, our study lacked in vivo experimental data. Even a 3D co-culture system with immunocytes cannot replace animal models, which should be included in any future investigations.
In conclusion, high mRNA level of YBX1 predicts worse prognosis in BRCA especially with luminal subtypes, which may be associated with M2 macrophage infiltration and T cell exhaustion. These findings enlighten the combination of classic therapeutics with immune checkpoint inhibitors and M1 polarization agents for YBX1 high-expressing luminal BRCA patients in the future trials.
Acknowledgment
The authors thank the members of the Department of Pathology, Shandong Cancer Hospital and Institute for the helpful pathological sectioning.
Disclosure
The authors declare no conflicts of interest for this work.
References
1. Siegel RL, Miller KD, Jemal A. Cancer statistics, 2019. CA Cancer J Clin. 2019;69(1):7–34.
2. Wu CY, Du SL, Zhang J, Liang AL, Liu YJ. Exosomes and breast cancer: a comprehensive review of novel therapeutic strategies from diagnosis to treatment. Cancer Gene Ther. 2017;24(1):6–12. doi:10.1038/cgt.2016.69
3. Engstrom MJ, Opdahl S, Hagen AI, et al. Molecular subtypes, histopathological grade and survival in a historic cohort of breast cancer patients. Breast Cancer Res Treat. 2013;140(3):463–473. doi:10.1007/s10549-013-2647-2
4. Gouri A, Dekaken A, El Bairi K, et al. Plasminogen activator system and breast cancer: potential role in therapy decision making and precision medicine. Biomark Insights. 2016;11:105–111. doi:10.4137/BMI.S33372
5. Li X, Yang J, Peng L, et al. Triple-negative breast cancer has worse overall survival and cause-specific survival than non-triple-negative breast cancer. Breast Cancer Res Treat. 2017;161(2):279–287. doi:10.1007/s10549-016-4059-6
6. Smerage JB, Barlow WE, Hortobagyi GN, et al. Circulating tumor cells and response to chemotherapy in metastatic breast cancer: SWOG S0500. J clin oncol. 2014;32(31):3483–3489. doi:10.1200/JCO.2014.56.2561
7. Chen B, Lai J, Dai D, Chen R, Li X, Liao N. JAK1 as a prognostic marker and its correlation with immune infiltrates in breast cancer. Aging. 2019;11(23):11124–11135. doi:10.18632/aging.102514
8. Kuwano M, Shibata T, Watari K, Ono M. Oncogenic Y-box binding protein-1 as an effective therapeutic target in drug-resistant cancer. Cancer Sci. 2019;110(5):1536–1543. doi:10.1111/cas.14006
9. Kohno K, Izumi H, Uchiumi T, Ashizuka M, Kuwano M. The pleiotropic functions of the Y-box-binding protein, YB-1. BioEssays. 2003;25(7):691–698. doi:10.1002/bies.10300
10. Kretov DA, Clement MJ, Lambert G, et al. YB-1, an abundant core mRNA-binding protein, has the capacity to form an RNA nucleoprotein filament: a structural analysis. Nucleic Acids Res. 2019;47(6):3127–3141. doi:10.1093/nar/gky1303
11. Woolley AG, Algie M, Samuel W, et al. Prognostic association of YB-1 expression in breast cancers: a matter of antibody. PLoS One. 2011;6(6):e20603. doi:10.1371/journal.pone.0020603
12. Cohen SB, Ma W, Valova VA, et al. Genotoxic stress-induced nuclear localization of oncoprotein YB-1 in the absence of proteolytic processing. Oncogene. 2010;29(3):403–410. doi:10.1038/onc.2009.321
13. Lim JP, Shyamasundar S, Gunaratne J, Scully OJ, Matsumoto K, Bay BH. YBX1 gene silencing inhibits migratory and invasive potential via CORO1C in breast cancer in vitro. BMC Cancer. 2017;17(1):201. doi:10.1186/s12885-017-3187-7
14. Maciejczyk A, Szelachowska J, Ekiert M, et al. Elevated nuclear YB1 expression is associated with poor survival of patients with early breast cancer. Anticancer Res. 2012;32(8):3177–3184.
15. Cho KH, Jeong BY, Park CG, Lee HY. The YB-1/EZH2/amphiregulin signaling axis mediates LPA-induced breast cancer cell invasion. Arch Pharm Res. 2019;42(6):519–530. doi:10.1007/s12272-019-01149-6
16. Evdokimova V, Tognon C, Ng T, et al. Translational activation of snail1 and other developmentally regulated transcription factors by YB-1 promotes an epithelial-mesenchymal transition. Cancer Cell. 2009;15(5):402–415. doi:10.1016/j.ccr.2009.03.017
17. Inoue I, Matsumoto K, Yu Y, Bay BH. Surmounting chemoresistance by targeting the Y-box binding protein-1. Anatomical Record. 2012;295(2):215–222. doi:10.1002/ar.22401
18. Liu SL, Sui YF, Lin MZ. MiR-375 is epigenetically downregulated due to promoter methylation and modulates multi-drug resistance in breast cancer cells via targeting YBX1. Eur Rev Med Pharmacol Sci. 2016;20(15):3223–3229.
19. Wang J, Djudjaj S, Gibbert L, et al. YB-1 orchestrates onset and resolution of renal inflammation via IL10 gene regulation. J Cell Mol Med. 2017;21(12):3494–3505. doi:10.1111/jcmm.13260
20. Laman AG, Lathe R, Shepelyakovskaya AO, et al. Muramyl peptides activate innate immunity conjointly via YB1 and NOD2. Innate Immun. 2016;22(8):666–673. doi:10.1177/1753425916668982
21. Rhodes DR, Kalyana-Sundaram S, Mahavisno V, et al. Oncomine 3.0: genes, pathways, and networks in a collection of 18,000 cancer gene expression profiles. Neoplasia. 2007;9(2):166–180. doi:10.1593/neo.07112
22. Barretina J, Caponigro G, Stransky N, et al. The cancer cell line encyclopedia enables predictive modelling of anticancer drug sensitivity. Nature. 2012;483(7391):603–607. doi:10.1038/nature11003
23. Chandrashekar DS, Bashel B, Balasubramanya SAH, et al. UALCAN: a portal for facilitating tumor subgroup gene expression and survival analyses. Neoplasia. 2017;19(8):649–658. doi:10.1016/j.neo.2017.05.002
24. Cerami E, Gao J, Dogrusoz U, et al. The cBio cancer genomics portal: an open platform for exploring multidimensional cancer genomics data. Cancer Discov. 2012;2(5):401–404. doi:10.1158/2159-8290.CD-12-0095
25. Gao J, Aksoy BA, Dogrusoz U, et al. Integrative analysis of complex cancer genomics and clinical profiles using the cBioPortal. Sci Signal. 2013;6(269):pl1. doi:10.1126/scisignal.2004088
26. Gyorffy B, Lanczky A, Eklund AC, et al. An online survival analysis tool to rapidly assess the effect of 22,277 genes on breast cancer prognosis using microarray data of 1809 patients. Breast Cancer Res Treat. 2010;123(3):725–731. doi:10.1007/s10549-009-0674-9
27. Li T, Fu J, Zeng Z, et al. TIMER2.0 for analysis of tumor-infiltrating immune cells. Nucleic Acids Res. 2020;48(W1):W509–W514. doi:10.1093/nar/gkaa407
28. Li B, Severson E, Pignon JC, et al. Comprehensive analyses of tumor immunity: implications for cancer immunotherapy. Genome Biol. 2016;17(1):174. doi:10.1186/s13059-016-1028-7
29. Li T, Fan J, Wang B, et al. TIMER: a web server for comprehensive analysis of tumor-infiltrating immune cells. Cancer Res. 2017;77(21):e108–e110. doi:10.1158/0008-5472.CAN-17-0307
30. Newman AM, Liu CL, Green MR, et al. Robust enumeration of cell subsets from tissue expression profiles. Nat Methods. 2015;12(5):453–457. doi:10.1038/nmeth.3337
31. Hall P, Ploner A, Bjohle J, et al. Hormone-replacement therapy influences gene expression profiles and is associated with breast-cancer prognosis: a cohort study. BMC Med. 2006;4:16. doi:10.1186/1741-7015-4-16
32. Pawitan Y, Bjohle J, Amler L, et al. Gene expression profiling spares early breast cancer patients from adjuvant therapy: derived and validated in two population-based cohorts. Breast Cancer Res. 2005;7(6):R953–964. doi:10.1186/bcr1325
33. Vasaikar SV, Straub P, Wang J, Zhang B. LinkedOmics: analyzing multi-omics data within and across 32 cancer types. Nucleic Acids Res. 2018;46(D1):D956–D963. doi:10.1093/nar/gkx1090
34. Bo C, Wu Q, Zhao H, Li X, Zhou Q. Thymosin alpha1 suppresses migration and invasion of PD-L1 high-expressing non-small-cell lung cancer cells via inhibition of STAT3-MMP2 signaling. Onco Targets Ther. 2018;11:7255–7270. doi:10.2147/OTT.S177943
35. Donehower LA, Soussi T, Korkut A, et al. Integrated analysis of TP53 gene and pathway alterations in the cancer genome atlas. Cell Rep. 2019;28(5):1370–1384 e1375. doi:10.1016/j.celrep.2019.07.001
36. Stanton SE, Disis ML. Clinical significance of tumor-infiltrating lymphocytes in breast cancer. J Immunother Cancer. 2016;4:59. doi:10.1186/s40425-016-0165-6
37. Azimi F, Scolyer RA, Rumcheva P, et al. Tumor-infiltrating lymphocyte grade is an independent predictor of sentinel lymph node status and survival in patients with cutaneous melanoma. J clin oncol. 2012;30(21):2678–2683. doi:10.1200/JCO.2011.37.8539
38. Boschat AC, Minet N, Martin E, Barouki R, Latour S, Sanquer S. CTP synthetase activity assay by liquid chromatography tandem mass spectrometry in the multiple reaction monitoring mode. JMS. 2019;54(11):885–893. doi:10.1002/jms.4442
39. Yang C, Liu X, Cheng T, et al. LYAR suppresses beta interferon induction by targeting phosphorylated interferon regulatory factor 3. J Virol. 2019;93(21). doi:10.1128/JVI.00769-19.
40. Prabhu L, Hartley AV, Martin M, Warsame F, Sun E, Lu T. Role of post-translational modification of the Y box binding protein 1 in human cancers. Genes Dis. 2015;2(3):240–246. doi:10.1016/j.gendis.2015.05.001
41. Finak G, Bertos N, Pepin F, et al. Stromal gene expression predicts clinical outcome in breast cancer. Nat Med. 2008;14(5):518–527. doi:10.1038/nm1764
42. Radvanyi L, Singh-Sandhu D, Gallichan S, et al. The gene associated with trichorhinophalangeal syndrome in humans is overexpressed in breast cancer. Proc Natl Acad Sci USA. 2005;102(31):11005–11010. doi:10.1073/pnas.0500904102
43. Curtis C, Shah SP, Chin SF, et al. The genomic and transcriptomic architecture of 2000 breast tumours reveals novel subgroups. Nature. 2012;486(7403):346–352. doi:10.1038/nature10983
44. Campbell TM, Castro MAA, de Oliveira KG, Ponder BAJ, Meyer KB. ERalpha binding by transcription factors NFIB and YBX1 enables FGFR2 signaling to modulate estrogen responsiveness in breast cancer. Cancer Res. 2018;78(2):410–421. doi:10.1158/0008-5472.CAN-17-1153
45. Fujii T, Kawahara A, Basaki Y, et al. Expression of HER2 and estrogen receptor alpha depends upon nuclear localization of Y-box binding protein-1 in human breast cancers. Cancer Res. 2008;68(5):1504–1512. doi:10.1158/0008-5472.CAN-07-2362
46. Bansal T, Tanveer N, Singh UR, Sharma S, Kaur N. Y-Box binding protein 1 expression in breast cancer and its correlation with hormone receptors and other prognostic markers. J Lab Physicians. 2018;10(4):420–425. doi:10.4103/JLP.JLP_58_18
47. Ito T, Kamijo S, Izumi H, Kohno K, Amano J, Ito K. Alteration of Y-box binding protein-1 expression modifies the response to endocrine therapy in estrogen receptor-positive breast cancer. Breast Cancer Res Treat. 2012;133(1):145–159. doi:10.1007/s10549-011-1731-8
48. Habibi G, Leung S, Law JH, et al. Redefining prognostic factors for breast cancer: YB-1 is a stronger predictor of relapse and disease-specific survival than estrogen receptor or HER-2 across all tumor subtypes. Breast Cancer Res. 2008;10(5):R86. doi:10.1186/bcr2156
49. Dong S, Nie H, Li D, et al. Molecular cloning and characterization of Y-box gene (Rpybx) from Manila clam and its expression analysis in different strains under low-temperature stress. Anim Genet. 2020;51(3):430–438. doi:10.1111/age.12919
50. Lyabin DN, Eliseeva IA, Ovchinnikov LP. YB-1 protein: functions and regulation. Wiley Interdiscip Rev RNA. 2014;5(1):95–110. doi:10.1002/wrna.1200
51. Mittal S, Brown NJ, Holen I. The breast tumor microenvironment: role in cancer development, progression and response to therapy. Expert Rev Mol Diagn. 2018;18(3):227–243.
52. McKinney EF, Smith KG. T cell exhaustion and immune-mediated disease-the potential for therapeutic exhaustion. Curr Opin Immunol. 2016;43:74–80. doi:10.1016/j.coi.2016.09.005
53. Sica A, Schioppa T, Mantovani A, Allavena P. Tumour-associated macrophages are a distinct M2 polarised population promoting tumour progression: potential targets of anti-cancer therapy. Eur J Cancer. 2006;42(6):717–727. doi:10.1016/j.ejca.2006.01.003
54. Hessman CL, Hildebrandt J, Shah A, et al. YB-1 interferes with TNFalpha-TNFR binding and modulates progranulin-mediated inhibition of TNFalpha signaling. Int J Mol Sci. 2020;21(19):7076. doi:10.3390/ijms21197076
55. Cao X, Zhu N, Li L, et al. Y-box binding protein 1 regulates ox-LDL mediated inflammatory responses and lipid uptake in macrophages. Free Radic Biol Med. 2019;141:10–20. doi:10.1016/j.freeradbiomed.2019.05.032
 © 2021 The Author(s). This work is published and licensed by Dove Medical Press Limited. The full terms of this license are available at https://www.dovepress.com/terms.php and incorporate the Creative Commons Attribution - Non Commercial (unported, v3.0) License.
By accessing the work you hereby accept the Terms. Non-commercial uses of the work are permitted without any further permission from Dove Medical Press Limited, provided the work is properly attributed. For permission for commercial use of this work, please see paragraphs 4.2 and 5 of our Terms.
© 2021 The Author(s). This work is published and licensed by Dove Medical Press Limited. The full terms of this license are available at https://www.dovepress.com/terms.php and incorporate the Creative Commons Attribution - Non Commercial (unported, v3.0) License.
By accessing the work you hereby accept the Terms. Non-commercial uses of the work are permitted without any further permission from Dove Medical Press Limited, provided the work is properly attributed. For permission for commercial use of this work, please see paragraphs 4.2 and 5 of our Terms.