")
Back to Journals » Cancer Management and Research » Volume 12
Elevated mRNA Expression Levels of NCAPG are Associated with Poor Prognosis in Ovarian Cancer
Authors Xu T, Dong M, Wang Z, Li H, Li X
Received 10 March 2020
Accepted for publication 27 June 2020
Published 14 July 2020 Volume 2020:12 Pages 5773—5786
DOI https://doi.org/10.2147/CMAR.S253349
Checked for plagiarism Yes
Review by Single anonymous peer review
Peer reviewer comments 2
Editor who approved publication: Dr Ahmet Emre Eşkazan
Tao Xu,1,2,* Menglu Dong,1,* Zhi Wang,2 Hanning Li,1 Xingrui Li1
1Department of Thyroid and Breast Surgery, Tongji Hospital, Tongji Medical College of HUST, Wuhan, Hubei 430030, People’s Republic of China; 2Department of Obstetrics and Gynecology, Cancer Biology Research Center, Tongji Hospital, Tongji Medical College of HUST, Wuhan, Hubei 430030, People’s Republic of China
*These authors contributed equally to this work
Correspondence: Xingrui Li
Department of Thyroid and Breast Surgery, Tongji Hospital, Tongji Medical College of Huazhong University of Science and Technology, Wuhan, Hubei 430030, People’s Republic of China
Tel +86-27-8366 5317
Email [email protected]
Background: Ovarian cancer is a major gynecologic malignancy that is often detected at a late stage due to the lack of detailed studies on its pathogenesis and reliable biomarkers for predicting its prognosis.
Materials and Methods: Four ovarian cancer data sets GSE18520, GSE27651, GSE40595, and GSE52037 were downloaded from the Gene Expression Omnibus (GEO) database and the robust rank aggregation approach was used to find common differentially expressed genes (DEGs). Cytoscape software was used to construct and detect key models of protein–protein interaction (PPI) network. While the expression, prognostic value and potential mechanism of the hub gene non-SMC condensin I complex subunit G (NCAPG) was carried out through Gene Expression Profiling Interactive Analysis, Kaplan–Meier plotter online dataset and gene set enrichment analysis. To further investigate the role of NCAPG in ovarian cancer, in vitro experiments were carried out.
Results: A total of 232 DEGs were identified in the four GEO datasets; and we detected 32 hub genes from the PPI network and 21 of these genes were associated with ovarian cancer prognosis, one of which was NCAPG. NCAPG was significantly upregulated in most of the ovarian cancer samples. High NCAPG expression was mainly involved in homologous recombination, DNA replication, proteasome, and more correlated pathways. NCAPG knockdown arrested the cell cycle, inhibited the proliferation, and attenuated the migration ability of A2780 cells. Meanwhile, silencing of NCAPG significantly promoted cisplatin-induced apoptosis thus increased the sensitivity to cisplatin.
Conclusion: NCAPG together with the other 31 hub genes play a vital role in the tumorigenesis of ovarian, meanwhile, the cell cycle pathway may be a potential pathway contributing to progression in OC; and NCAPG expression can be used as a promising target for the treatment of OC.
Keywords: ovarian cancer, bioinformatics analysis, GEO database, NCAPG
Introduction
Ovarian cancer is one of three major gynecologic malignancies, with an estimated 295,414 new cases and an estimated 184,799 ovarian cancer-related deaths in 2018 worldwide.1 Due to the relatively asymptomatic nature of ovarian cancer and the lack of reliable diagnostic tests, 59% of new cases have been reported metastatic spread, leading to a sharp decline in the 5-year survival rate from 92.4% (for localized tumors) to 29.2%.2 Therefore, it is critical to identify new reliable biomarkers to detect ovarian cancer at an early stage and to understand the cellular changes that trigger metastatic spread.
Due to the heterogeneity of samples in each independent experiment, different detection platforms and different data processing methods, the identification of differentially expressed genes (DEGs) across multiple studies yields inconsistent results, indicating that integration of various sequenced gene lists is necessary.3 In this study, four ovarian cancer datasets, namely GSE18520,4 GSE27651,5 GSE405956 and GSE52037,7 were downloaded from the Gene Expression Omnibus (GEO) database to identify DEGs between ovarian cancer specimens and matched controls by applying the robust rank aggregation (RRA) method. In total, 232 DEGs were identified and 32 hub genes were distinguished, including the gene encoding non-SMC condensin I complex subunit G (NCAPG).
NCAPG, a subunit of the condensin I complex, locates on chromosome 4p15.31. Its overexpression has been reported in many cancer types, and elevated NCAPG expression has been found to correlate with poor prognosis, revealing that NCAPG plays an important role in carcinogenesis. Song et al reported that NCAPG was up-regulated in gastric cancer and promoted gastric cancer cell proliferation. In addition, NCAPG is a target of miR-193b-3p, a tumor suppressor.8 Goto et al showed that NCAPG, which is also regulated by miR-145-3p, was overexpressed in castration-resistant prostate cancer and elevated NCAPG expression was a predictor of poor disease-free survival. In another study, NCAPG appeared to be a potential therapeutic target in castration-resistant prostate cancer.9 We also detected the hub gene NCAPG, using data from Oncomine, TCGA and GTEx projects, and then verified in The Human Protein Atlas (THPA). Gene set enrichment analysis (GSEA) was used to obtain an in-depth understanding of the roles of NCAPG in ovarian cancer cells.
This study aimed to integrate these independent experiments in order to identify the key genes associating with the pathogenesis and prognosis of ovarian cancer and also to determine if NCAPG might be a potential biomarker and therapeutic target for ovarian cancer.
Materials and Methods
Identification of DEGs from the GEO Database
Four ovarian cancer datasets, namely GSE18520, GSE27651, GSE40595 and GSE52037, based on the GPL570 Affymetrix Human Genome U133 Plus 2.0 Array were downloaded from the GEO database (Table 1). GSE18520 contained 53 advanced, high-grade primary ovarian tumor specimens and 10 normal ovarian surface epithelial (OSE) specimens. GSE27651 contained 13 low-grade, and 22 high-grade serous ovarian tumor specimens, and 6 normal OSE specimens. GSE40595 contained 32 high-grade serous ovarian tumor specimens and 6 normal OSE specimens. GSE52037 contained 10 ovarian tumor specimens and 10 normal OSE specimens. The downloaded files were processed and standardized with R and log2 converted, if needed. To identify DEGs, the limma package in R was used.10 The cut-off criteria were log2 fold-change (FC) >1 and P <0.05.
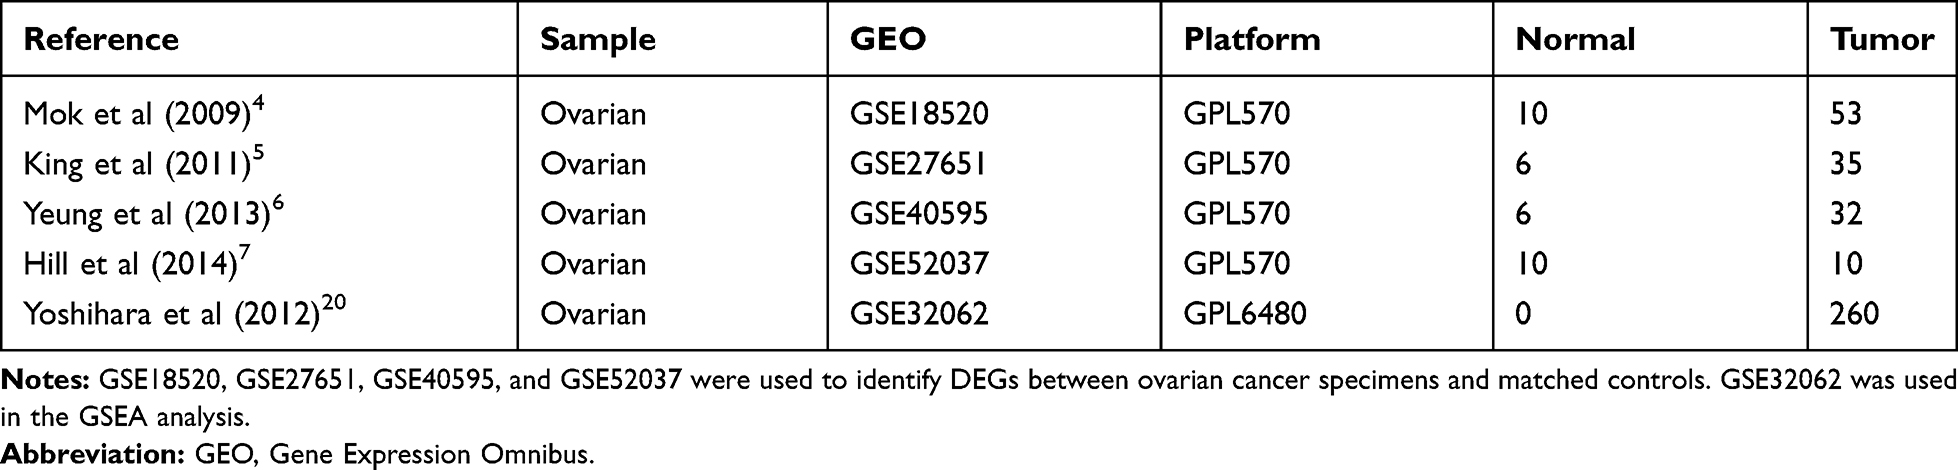 |
Table 1 Details for GEO Ovarian Cancer Datasets |
Integration of Microarray Data
To identify robust DEGs and to understand their molecular mechanisms, we applied the RRA method in R.11 This method can identify genes, which were ranked consistently and robustly to eliminate noise and errors.12
Gene Ontology and KEGG Pathway Analysis
To identify the biological functions of the DEGs, Gene Ontology (GO) term enrichment and Kyoto Encyclopedia of Genes and Genomes (KEGG) pathway analyses were performed using DAVID software (ver. 6.8). P-values <0.05 were considered statistically significant.
Establishment of PPI Network
STRING (https://string-db.org/) is an online tool that assigns protein–protein interactions (PPIs) across 9,643,763 proteins from 2031 organisms.13 We used STRING to analyze common DEGs from different datasets and to generate the PPI network with a high confidence score of >0.7.
Survival Analysis
The Kaplan–Meier plotter (http://kmplot.com/), as a powerful tool, assesses the effects of target genes on the survival outcomes of several types of tumors, including lung cancer, gastric cancer and liver cancer as well as ovarian cancer with relapse-free and overall survival data.14
Online Database Extraction
To evaluate NCAPG expression in a larger cohort of specimens, we used Oncomine, TCGA, and GTEx projects. Oncomine (http://www.oncomine.org), an online human cancer microarray database, contains various expression datasets, including 43 ovarian datasets and 3606 ovarian samples.15 We also compared the levels of up- or down-regulated genes in ovarian cancer compared with those in normal specimens using data extracted from TCGA and GTEx projects. GEPIA (http://gepia.cancer-pku.cn/index.html) was used to analyze these data,16,17 whereas the cBioPortal tool (http://www.cbioportal.org/) was utilized to identify DNA copy number alterations in TCGA ovarian cancers.18
Gene Set Enrichment Analysis (GSEA)
GSEA19 was applied to identify correlations between high and low NCAPG expression in the GSE32062 dataset,20 a new dataset containing 260 advanced-stage high-grade serous ovarian cancer specimens. The gene matrix c2.cp.kegg.v6.2.symbols.gmt tool was used to identify cancer-related pathways influenced by NCAPG. The statistically significant gene set was defined by a P-value <0.05 and false discovery rate (FDR) <0.25 after 1000 permutations.
Immunohistochemistry
NCAPG immunohistochemistry results were downloaded from THPA.21 NCAPG expression in ovarian cancer specimens was compared with that in normal specimens and defined as high, medium or low.
Cell Culture and Transfection
The human ovarian cancer cell line A2780 was obtained from the Chinese Academy of Sciences (Wuhan, China) and cultured in RPMI-1640 medium (HyClone, Logan, UT, USA) supplemented with 1% penicillin/streptomycin (Invitrogen) and 10% fetal bovine serum (Gibco) at 37°C. The NCAPG siRNA (si-NCAPG-1 and −2) and negative control (si-NC) were purchased from RiboBio (Guangzhou, China). Lipofectamine 3000 (Invitrogen) was used for transfection according to the manufacturer’s instructions. The knockdown efficiency of NCAPG siRNA was assessed by reverse transcription-quantitative polymerase chain reaction (RT-qPCR).
Verify the Role of NCAPG in Ovarian Cancer Through in vitro Experiments
The Cell Counting Kit-8 (CCK-8) assay (Dojindo Kumamoto, Tokyo, Japan) and transwell migration assay were performed as previously described.22,23 For the cell cycle assay, cells were harvested at 48 h after transfection and fixed with pre-cooled 70% ethanol at 4°C overnight. PI/RNase Staining Buffer (BD Biosciences) was added to the cells, and the cell cycle was analyzed with the FACS Calibur System (Beckman Coulter). For apoptosis analysis, A2780 cells were transfected with NCAPG siRNA (si-NCAPG-1 and −2) and negative control (si-NC) for 48h, then treated with cisplatin at 8 μM (about 0.5 times of IC50) for 24 hours.24–26 Cells were stained with FITC Annexin V staining kit (BD Biosciences, USA) to evaluate apoptosis by flow cytometry. FlowJo software (ver. 7.6) and CytExpert (ver. 2.0) were used for the analysis of cell cycle and apoptosis separately. Each experiment was performed more than twice.
Statistical Analysis
GSE18520 and GSE27651 datasets were selected for analyses because they include a larger number of specimens. Student’s t-test was used to analyze the difference between the two groups and one-way ANOVA was used for more than two groups. Receiver operating characteristic (ROC) curves were used to establish the diagnostic value of NCAPG in ovarian cancer. The area under the curve (AUC) and P-values were calculated. Statistical analyses were performed using the SPSS software (ver. 22.0, IBM Corp., Armonk, NY, USA) and GraphPad Prism 8 Software (GraphPad Software Inc., USA).
Results
Identification of DEGs in Ovarian Cancer
The ovarian cancer expression datasets GSE18520, GSE27651, GSE40595 and GSE52037 were standardized (Figure S1A–D). Compared with the corresponding control specimens, a total of 1037 up-regulated and 1585 down-regulated genes were screened from GSE18520; 1908 up-regulated and 2493 down-regulated genes from GSE27651; 1075 up-regulated and 1366 down-regulated genes from GSE40595; and 699 up-regulated and 1002 down-regulated genes from GSE52037 by the limma package using adjusted P <0.05 and |logFC| >1 as cut-off criteria. The volcano map for the up- and down-regulated genes in each of the four microarrays is displayed (Figure S2A–D), and the heatmaps for the top 100 genes in each dataset are presented (Figure S3A–D).
Identification of DEGs in Ovarian Cancer Using Integrated Bioinformatics
The four ovarian cancer expression datasets were screened by the limma package and analyzed by the RRA method (P <0.05 after corrected, |logFC| >1). The RRA method is based on the assumption that each gene is randomly ordered in each dataset. The higher the gene ranks in all experiments, the smaller the P-value is after correction, and the greater the possibility of identifying a DEG. Using this approach, we identified 232 DEGs, with 105 up-regulated genes and 127 down-regulated genes (Table S1). The heatmap package was used to illustrate the top 25 up- and down-regulated genes (Figure 1).
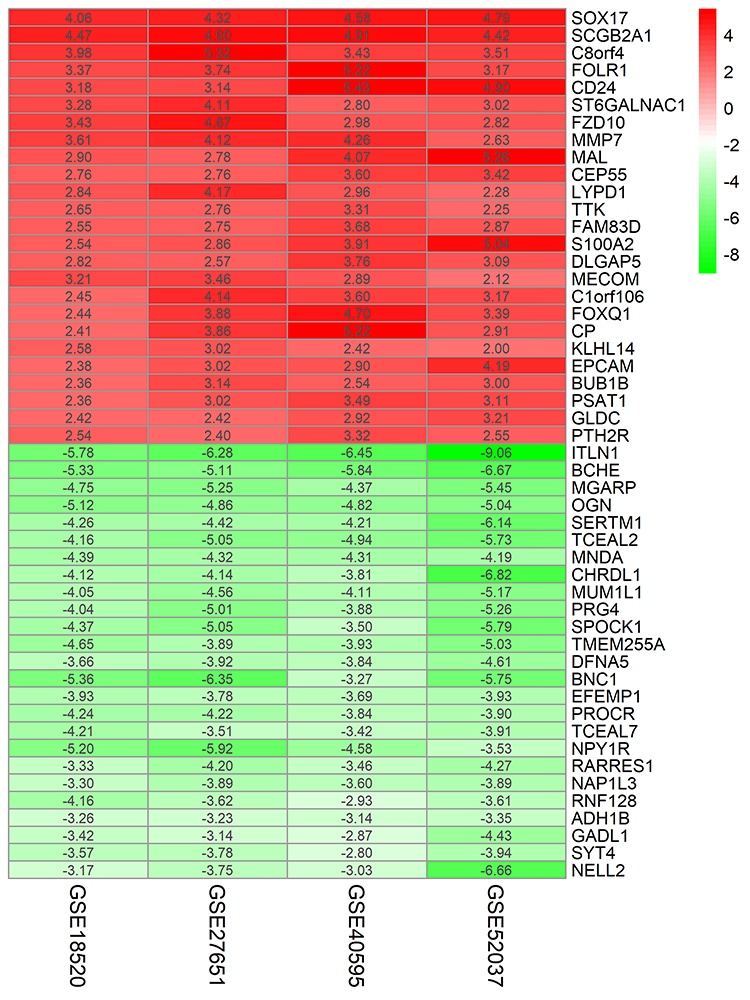 |
Figure 1 LogFC heatmap of the top 25 up- and down-regulated genes from four cancer expression arrays. Notes: Red and green indicate up- and down-regulated genes, respectively. The values in the table represent the logFC value of each gene.Abbreviation: FC, fold change. |
GO Term Enrichment and KEGG Pathway Analysis
To obtain an in-depth understanding of these DEGs, GO term enrichment and KEGG pathway analysis were performed using the DAVID software. In the biological process group, the up-regulated genes were mainly enriched in cell division, mitotic spindle organization and mitotic nuclear division, whereas the down-regulated genes were mainly enriched in blood coagulation, negative regulation of synaptic transmission and ethanol oxidation (Figure 2A, Tables S2 and S3). DEGs associated with seven KEGG pathways (Figure 2B, Tables S2 and S3). The up-regulated genes were particularly enriched in the cell cycle, whereas the down-regulated genes were particularly enriched in retinol metabolism, Wnt signaling, tyrosine metabolism, melanogenesis, proteoglycans in cancer and basal cell carcinoma.
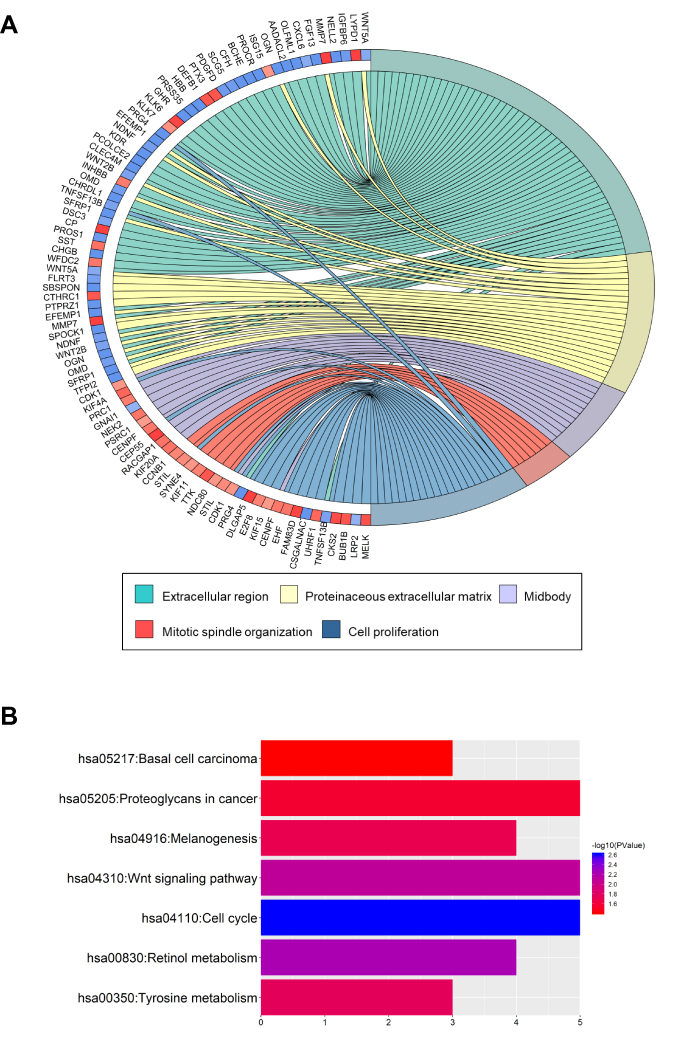 |
Figure 2 GO term enrichment and KEGG pathway analyses of DEGs in ovarian cancer. Notes: (A) GO terms of the enriched DEGs in ovarian cancer. (B) KEGG pathways of the enriched DEGs.Abbreviations: GO, Gene Ontology; KEGG, Kyoto Encyclopedia of Genes and Genomes; DEGs, differentially expressed genes. |
Analyzing DEGs in Ovarian Cancer Using a PPI Network
To construct the PPI network of the DEGs (105 up-regulated and 127 down-regulated) in ovarian cancer, the STRING database (http://string-db.org) was used, and the results were analyzed by the Cytoscape software. After setting the cut-off criterion to >10, we found 32 hub genes, and the top ten genes were CDK1, NCAPG, BUB1B, TOP2A, CENPF, NEK2, TTK, CCNB1, KIF11 and KIF20A. In addition, three important functional modules were screened with the MCODE software (Figure 3A–C). KEGG pathway analysis of all the genes in the three modules was performed using the DAVID software (Table 2). The results showed that genes in module 1 were mainly enriched in the cell cycle. The genes in module 2 were mainly enriched in cancer-related signaling, melanogenesis, Wnt signaling, basal cell carcinoma, signaling regulated to stem cell pluripotency, Hippo signaling, proteoglycans in cancer, HTLV-I infection and chemokine signaling. The genes in module 3 were mainly enriched in retinol metabolism, tyrosine metabolism, drug metabolism involving cytochrome P450, tight junction dynamics, leukocyte transendothelial migration, hepatitis C infection, cell adhesion and fatty acid degradation.
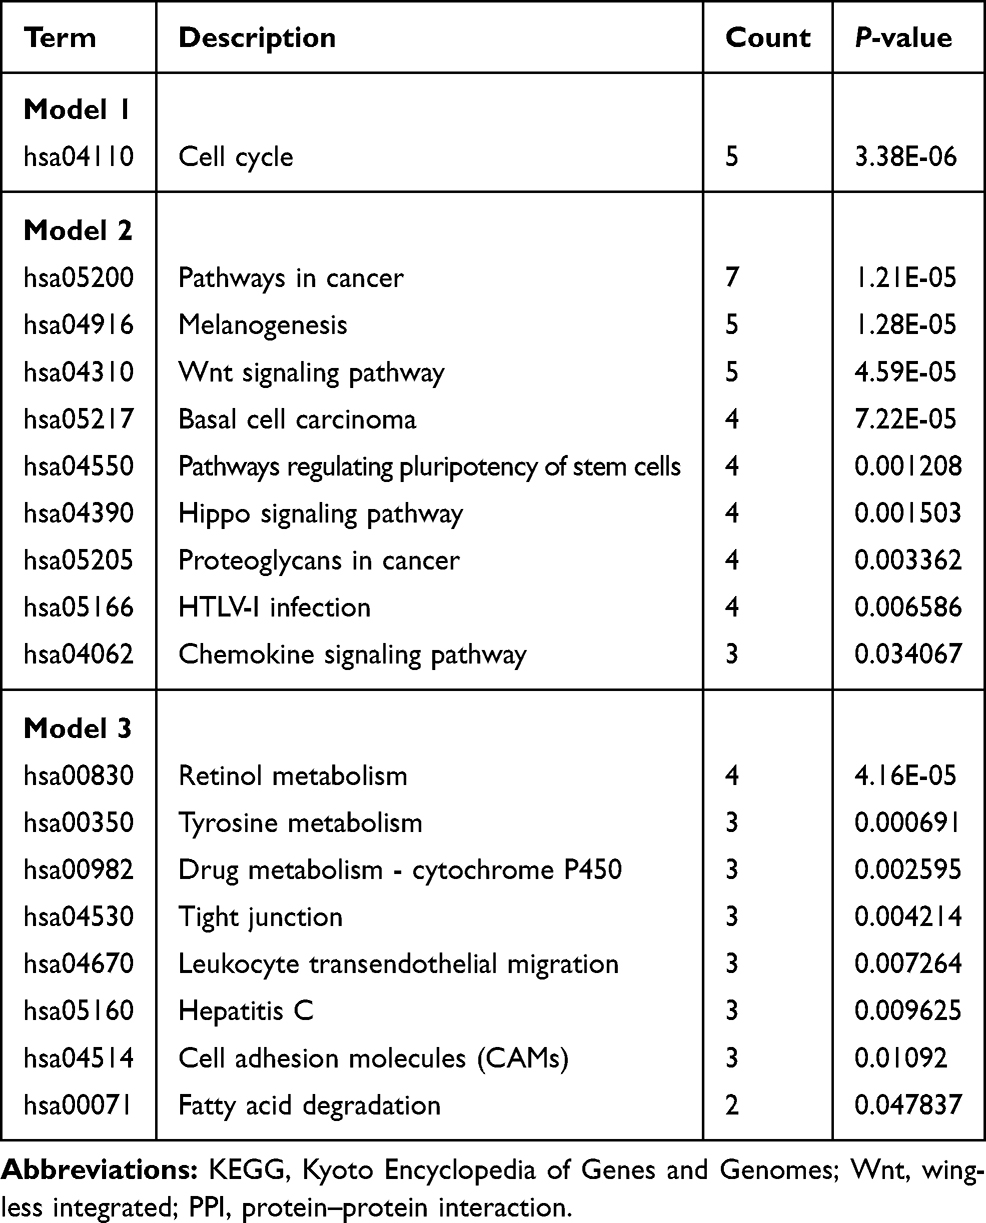 |
Table 2 KEGG Pathways Analysis of Three Key Models Selected from the PPI Network |
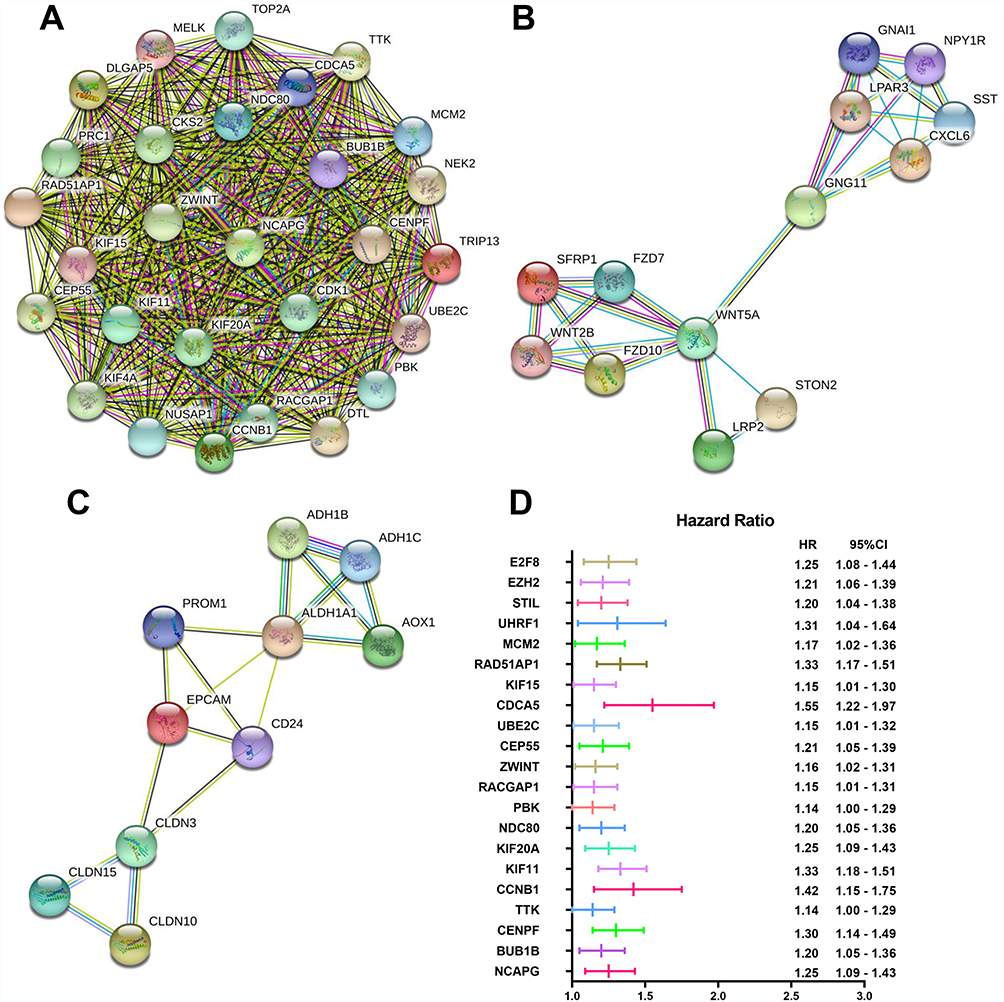 |
Figure 3 Three significant PPI modules and the forest plot of the 21 hub genes associating with the prognosis of ovarian cancer. Notes: (A-C) Three key modules are depicted from the PPI network. Nodes correspond to genes, and line thicknesses correspond to the evidence of the relationships. (D) Lines indicate the 95% CIs, and middle bars indicate the HRs.Abbreviations: PPI, protein–protein interactions; OC, ovarian cancer. |
Kaplan–Meier Plotter
Information on the 32 hub genes is available in the KMplot database. Of these, 21 genes were associated with the prognosis of ovarian cancer. The forest plot shows the association of the 21 hub genes with the prognosis of ovarian cancer (Figure 3D).
Analysis of NCAPG Using the Online Database
Among these hub genes, NCAPG had the second highest degree of protein‑protein connectivity. Jian et al demonstrated that the genes with higher degrees of protein‑protein connectivity in the PPI network might play a vital role in the network.27 While the role of NCAPG in ovarian cancer was not well studied. We then examined its expression in ovarian cancer cases from GSE18520 and GSE27651 datasets. The results indicated that NCAPG expression was significantly up-regulated in ovarian tumor specimens compared with matched controls (Figure 4A). Furthermore, ROC curve analysis established the high prognostic value of NCAPG in the classification of ovarian cancer specimens (Figure 4B). High NCAPG expression was a predictor of poor overall survival and progression-free survival (Figure 4C and D).
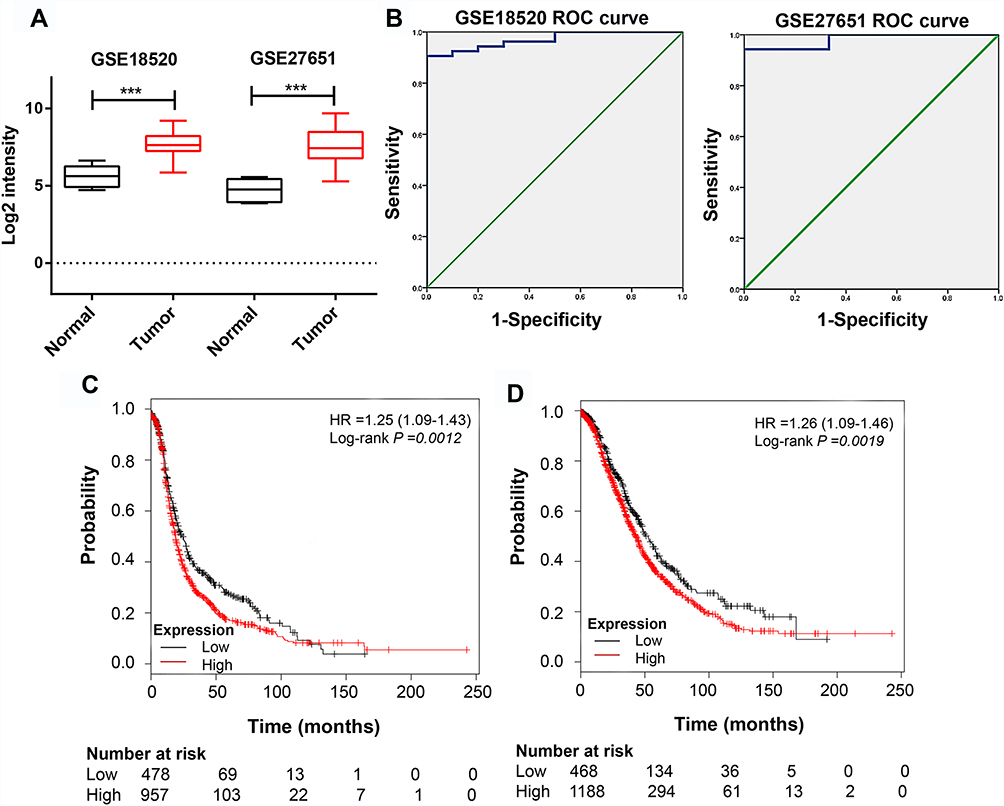 |
Figure 4 NCAPG is highly expressed in ovarian tissues. Notes: (A) NCAPG expression is elevated in ovarian cancer specimens compared with that in the matched controls (data from GSE18520 and GSE27651 datasets). (B) ROC curve based on NCAPG expression in GSE18520 and GSE27651 datasets to predict the prognosis of ovarian cancer. (C) Progression-free survival and (D) overall survival analysis of ovarian cancer cases with low and high NCAPG expression using the Kaplan–Meier plotter. ***P <0.001. |
Thereafter, NCAPG expression was examined in other human cancers in the Oncomine database. A total of 349 unique genes were identified, with 61 up-regulated and four down-regulated genes (Figure 5A). NCAPG expression was increased in nearly all types of tumors, except leukemia. We combined the results of two ovarian cancer studies (TCGA Ovarian Statistics [218662-s-at] and Yoshihara Ovarian Statistics [A-23-P155815]) (Figure 5B and C) that included 629 ovarian cancer specimens and 18 normal ovarian specimens. NCAPG expression was significantly up-regulated in most ovarian cancer specimens compared with matched controls.
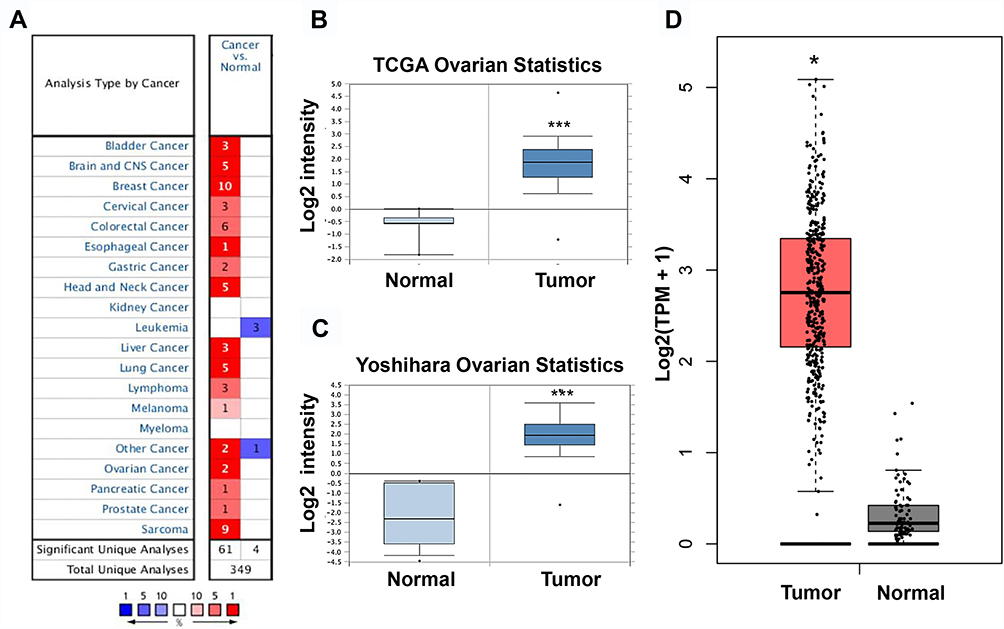 |
Figure 5 NCAPG expression in ovarian cancer cases included in the Oncomine and GEPIA datasets. Notes: (A) NCAPG expression in all cancer cases included in the Oncomine database. (B, C) NCAPG expression from four cancer expression arrays in the Oncomine database. (D) NCAPG expression in all cancer cases included in the GEPIA database. *P<0.05, ***P<0.001. |
The results were then verified by GEPIA. We found that NCAPG expression was increased in nearly all ovarian tumor specimens compared with control specimens (Figure 5D). Specifically, the NCAPG level was higher in 426 ovarian cancer samples than that in 88 normal ovarian specimens. The results of immunohistochemistry, obtained from THPA, showed that the NCAPG level was upregulated in ovarian cancer (Figure 6A), consistent with our findings.
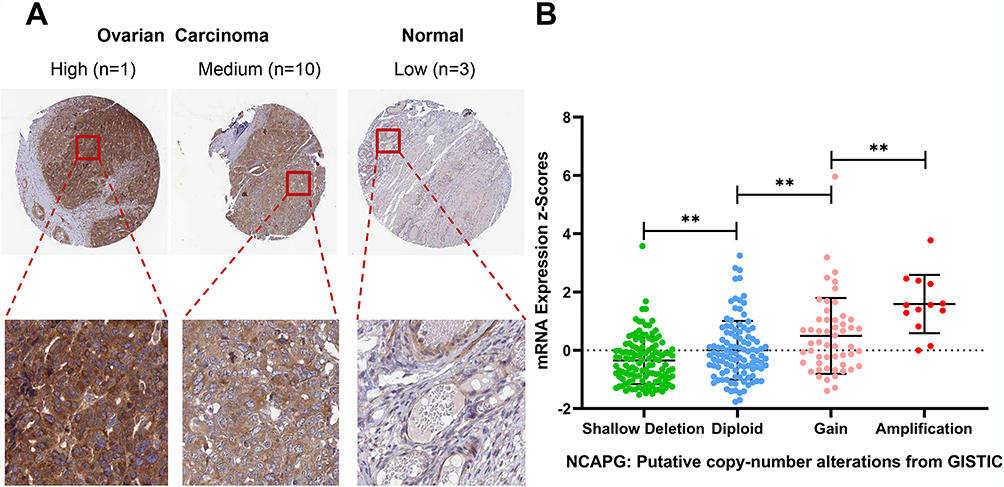 |
Figure 6 Expression and DNA amplification of NCAPG in THPA and cBioPortal datasets. Notes: (A) Results of NCAPG immunohistochemistry in THPA. (B) Box plots of NCAPG mRNA expression in ovarian cancer specimens from patients with different genetic features. **P<0.01.Abbreviations: THPA, The Human Protein Atlas. |
Data on DNA copy number alterations in ovarian cancer were downloaded from cBioPortal, and the samples were divided into four groups according to the DNA copy number, namely shallow deletion, diploid, gain and amplification. We found that copy number amplification significantly associated with increased NCAPG expression (Figure 6B).
GSEA Analysis of the GSE32062 Dataset
To further understand the cellular roles of NCAPG in ovarian cancer, GSEA was performed. The top four normalized enriched scores (NES) of the groups with high NCAPG expression were KEGG homologous recombination (NES = 2.08), KEGG DNA replication, (NES = 2.05), KEGG proteasome (NES = 2.02) and KEGG mismatch repair (NES = 2.02) (Figure 7A–D).
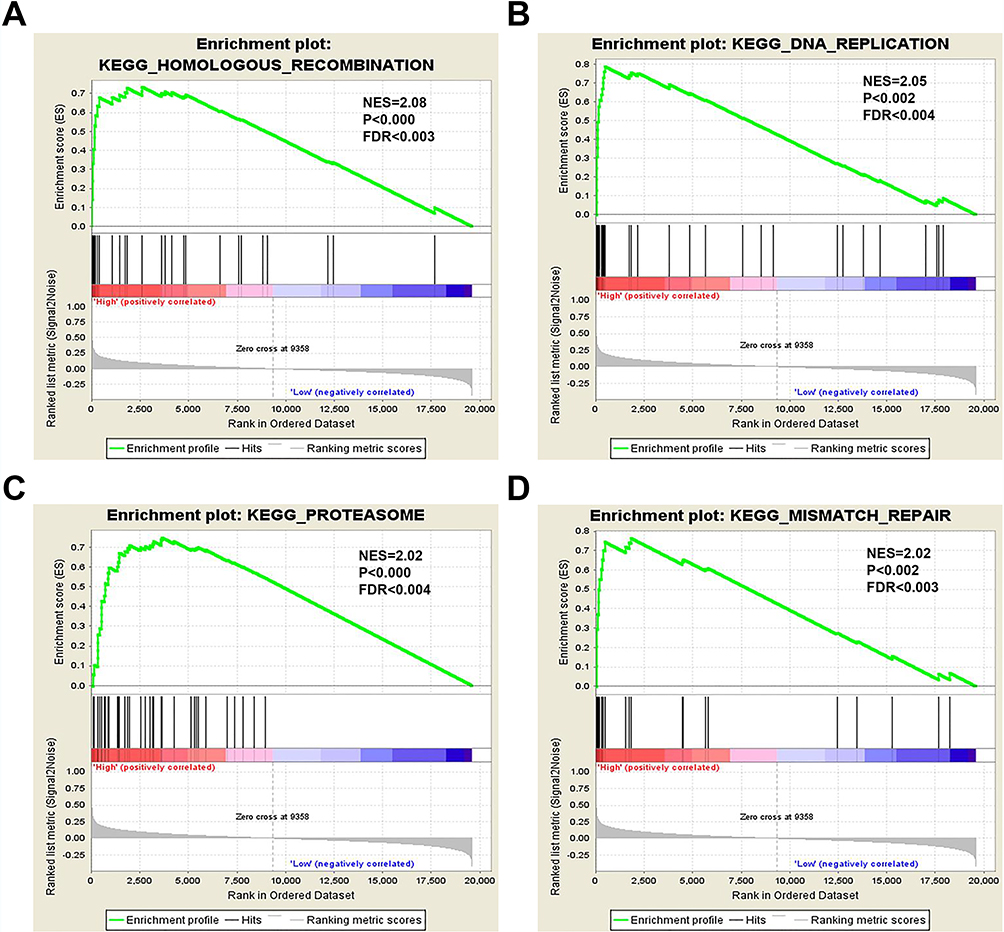 |
Figure 7 GSEA of the TCGA dataset. Notes: NCAPG overexpression significantly correlates with (A) homologous recombination, (B) DNA replication, (C) proteasomal degradation, and (D) mismatch repair. |
Effect of NCAPG Expression on A2780 Cell Proliferation, Migration, and Sensitivity to Cisplatin
To further confirm the biological roles of NCAPG in ovarian cancer, the A2780 cell line was used. We used siRNA transfection to knockdown NCAPG. At 48 h after transfection, the NCAPG level was decreased by >50% for si-NCAPG-1 and −2 compared with si-NC (Figure 8A). The results of the CCK-8 assay showed that the decreased NCAPG expression in the silenced group could repress A2780 cell proliferation compared with the control group (Figure 8B). The results of transwell migration assay showed that cell migration ability of A2780 was dramatically suppressed following NCAPG knockdown (Figure 8C and D). The results of cell cycle assays showed that the percentages of si-NCAPG-1- and si-NCAPG-2-silenced cells in the G2/M phase (21.2% and 20.4%, respectively) were significantly higher than that of si-NC-silenced cells at the same phase (12.2%) (Figure 8E). To further investigate the effect of NCAPG in sensitivity of ovarian cancer cells to cisplatin, A2780 cells were transfected with si-NCAPG-1 and si-NCAPG-2, and treated with cisplatin at 8 μM for 24 hours, followed by Annexin V-FITC/PI staining. As shown in Figure 9, silencing of NCAPG significantly promoted cisplatin-induced apoptosis thus increased the sensitivity to cisplatin.
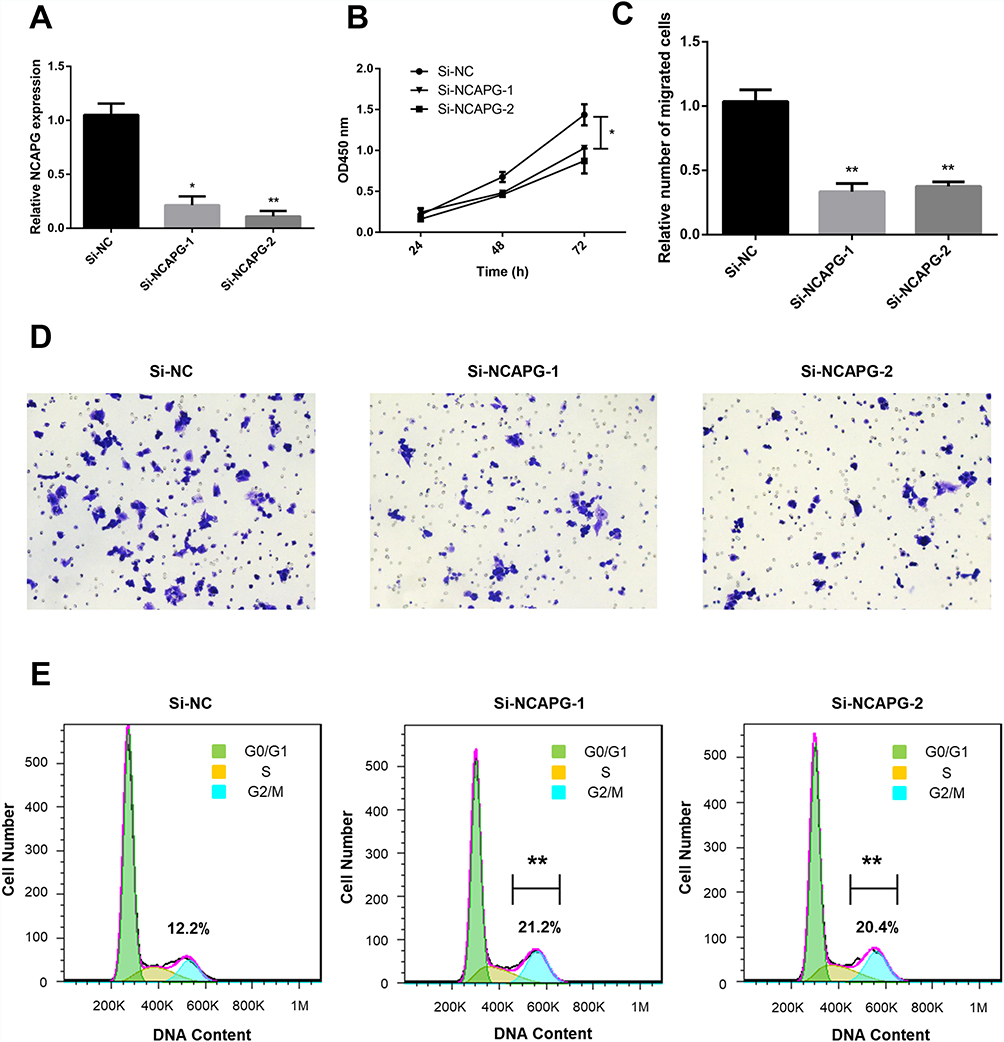 |
Figure 8 Effect of NCAPG knockdown on A2780 cell proliferation and migration. Notes: (A) Results of RT-qPCR showing NCAPG expression in cells transfected with negative control (si-NC) or NCAPG siRNA (si-NCAPG-1 and −2) at 48 h after transfection. (B) Results of representative CCK-8 assays showing the effect of NCAPG knockdown on cell proliferation. (C, D) Results of transwell assay (magnification, ×100) showing the effect of NCAPG knockdown on cell migration. (E) Results of representative flow cytometry experiments showing the effect of NCAPG knockdown on the cell cycle. *P<0.05 and **P<0.01 vs si-NC. |
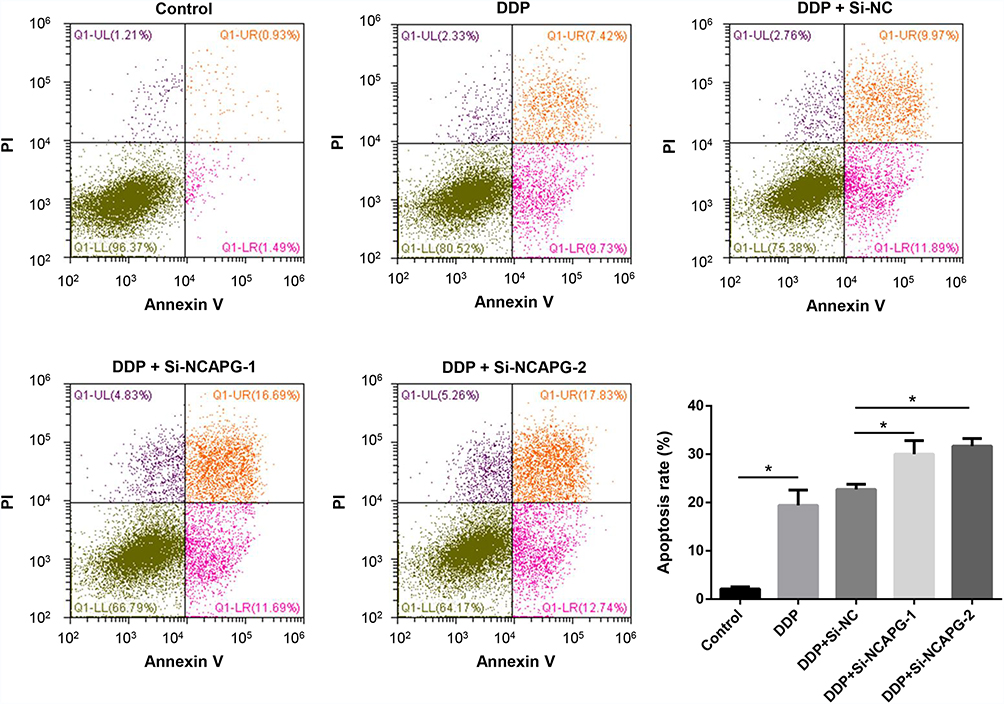 |
Figure 9 Effect of NCAPG knockdown on cisplatin sensitivity of ovarian cancer cells. Notes: A2780 cells were transfected with negative control (si-NC) or NCAPG siRNA (si-NCAPG-1 and −2) for 48 h and then treated with 8 μM cisplatin for 24 h. Apoptosis of cells were examined by flow cytometry. *P<0.05.Abbreviations: DDP, cisplatin; PI, propidium iodide. |
Discussion
In this study, we compared ovarian tumor specimens with normal ovarian specimens to identify 232 DEGs by the RRA method. Of these, 105 genes were up-regulated and 127 were down-regulated. To identify genes with key roles in the development of ovarian cancer, we set the cut-off criterion to >10 and identified 32 hub genes, in which 21 genes were related to the prognosis of ovarian cancer, one of which was NCAPG. Recent studies have reported that the condensin complex plays a critical role in mitosis and meiosis, and its level is also up-regulated during interphase. There are two types of condensins, condensin I and condensin II, in eukaryotes. NCAPG is a subunit of the condensin I complex, which is conserved among species. Its overexpression has been reported in hepatocellular carcinoma, lung cancer and prostate cancer, with poor prognosis, indicating that NCAPG is involved in carcinogenesis.
In this study, we found that NCAPG expression was significantly up-regulated in most ovarian cancer specimens in GSE18520 and GSE27651 datasets, which was verified by Oncomine, TCGA, GTEx, and THPA projects. High NCAPG expression was significantly associated with poor overall survival and progression-free survival (all P < 0.05). According to the copy number amplification data downloaded from cBioPortal, the elevated NCAPG expression in ovarian cancer cases was partly due to the copy number amplification. ROC curve analysis established the high prognostic value of NCAPG in the classification of ovarian cancer specimens, and these results were clinically significant. As there is no study reporting NCAPG expression and its potential functions in ovarian cancer, this gene was selected for further experiments.
Most studies on NCAPG have involved hepatocellular carcinoma, lung cancer, gastric cancer and prostate cancer specimens. Li et al reported that NCAPG and seven other genes were hub genes in lung adenocarcinoma that were closely related to overall survival. The prognostic ability of the eight-gene signature was also confirmed.28 Liang et al demonstrated that NCAPG expression was higher in high-grade pediatric gliomas than that in normal brain specimens. NCAPG knockdown, combined with temozolomide treatment, yielded stronger anti-cancer effects.29 Several studies have reported that NCAPG can affect the development and progression of hepatocellular carcinoma, suggesting that it may have use as a novel prognostic marker and therapeutic target.30–32 Furthermore, hepatocarcinogenesis has been reported to be caused by epigenetic alterations. Bayo et al showed decreased expression of NCAPG, as well as CENPA, KIF20A and PLK1, after hepatocellular carcinoma cells were treated with Jumonji lysine demethylase inhibitors, which inhibited cell proliferation and induced cell death.33 In this study, NCAPG knockdown arrested the cell cycle, inhibited the proliferation, and attenuated the migration ability of A2780 cells. Meanwhile, silencing of NCAPG significantly promoted cisplatin-induced apoptosis thus increased the sensitivity to cisplatin. Taken collectively, the above results revealed that NCAPG was a promising target of pan-cancer, as well as ovarian cancer.
To further understand the roles of NCAPG in ovarian cancer, GSEA was performed. The results showed that the genes associated with high NCAPG expression were mainly involved in homologous recombination, DNA replication, proteasomal degradation and mismatch repair. All of these cellular processes are critical for normal cell cycle function. As previously discussed, NCAPG is a subunit of the condensin I complex, which is comprised of the structural maintenance of chromosomes family of proteins (SMC2 and SMC4) and three non-SMC subunits, namely CAP-H, CAP-G and CAP-D2. On the other hand, the condensin II complex is comprised of SMC2 and SMC4, as well as CAP-H2, CAP-G2 and CAP-D3.34 Increasing evidence indicates that condensin subunits or complexes participate in mitosis, meiosis, and even tumorigenesis. Yin et al reported that NCAPH was highly expressed in colon cancer and colorectal cancer cell lines. They found that NCAPH knockdown inhibited cell proliferation, promoted apoptosis and induced cell cycle arrest at the G2/M phase.35 These findings are similar to those in lung adenocarcinoma reported by Zhan et al.36 In another study, Lai et al demonstrated that expression of a caspase-resistant form of NCAPH abolished cell death, and cells could enter the next step of the cell cycle, even after a long mitotic delay.37 These results reveal that above processes are critical for the function of normal and cancer cells. However, deeper studies are needed to confirm the roles of NCAPG in cancer.
In summary, this study showed that the hub gene NCAPG was significantly up-regulated in most ovarian cancer specimens. Comprehensive bioinformatics analysis revealed that high NCAPG expression was a predictor of poor prognosis. Further studies are needed to understand the regulatory mechanism of NCAPG and to identify any additional functions it might have in ovarian cancer cells.
Acknowledgments
This work was supported by the National Natural Science Foundation of China (81802676). We appreciate the linguistic assistance provided by TopEdit during the preparation of this manuscript. Tao Xu and Menglu Dong are co-first authors for this study.
Disclosure
The authors report no conflicts of interest in this work.
References
1. Bray F, Ferlay J, Soerjomataram I, Siegel RL, Torre LA, Jemal A. Global cancer statistics 2018: GLOBOCAN estimates of incidence and mortality worldwide for 36 cancers in 185 countries. CA Cancer J Clin. 2018;68(6):394–424. doi:10.3322/caac.21492
2. Luo P, Zhou J, Jin S, Qing M, Ma H. Influence of marital status on overall survival in patients with ovarian serous carcinoma: finding from the surveillance epidemiology and end results (SEER) database. J Ovarian Res. 2019;12(1):126. doi:10.1186/s13048-019-0600-7
3. Li W, Liu Z, Liang B, et al. Identification of core genes in ovarian cancer by an integrative meta-analysis. J Ovarian Res. 2018;11(1):94. doi:10.1186/s13048-018-0467-z
4. Mok SC, Bonome T, Vathipadiekal V, et al. A gene signature predictive for outcome in advanced ovarian cancer identifies a survival factor: microfibril-associated glycoprotein 2. Cancer Cell. 2009;16(6):521–532. doi:10.1016/j.ccr.2009.10.018
5. King ER, Tung CS, Tsang YTM, et al. The anterior gradient homolog 3 (AGR3) gene is associated with differentiation and survival in ovarian cancer. Am J Surg Pathol. 2011;35(6):904–912. doi:10.1097/PAS.0b013e318212ae22
6. Manley G. Public access NIH public access. Cancer Res. 2013;73(16):5016–5028. doi:10.1038/mp.2011.182.doi
7. Hill CG, Matyunina LV, Walker DE, Benigno BB, McDonald JF. Transcriptional override: a regulatory network model of indirect responses to modulations in microRNA expression. BMC Syst Biol. 2014;8(1):1–9. doi:10.1186/1752-0509-8-36
8. Song B, Du J, Song DF, Ren JC, Feng Y. Dysregulation of NCAPG, KNL1, miR-148a-3p, miR-193b-3p, and miR-1179 may contribute to the progression of gastric cancer. Biol Res. 2018;51(1):1–12. doi:10.1186/s40659-018-0192-5
9. Goto Y, Kurozumi A, Arai T, et al. Impact of novel miR-145-3p regulatory networks on survival in patients with castration-resistant prostate cancer. Br J Cancer. 2017;117(3):409–420. doi:10.1038/bjc.2017.191
10. Ritchie ME, Phipson B, Wu D, et al. Limma powers differential expression analyses for RNA-sequencing and microarray studies. Nucleic Acids Res. 2015;43(7):e47. doi:10.1093/nar/gkv007
11. Kolde R, Laur S, Adler P, Vilo J. Robust rank aggregation for gene list integration and meta-analysis. Bioinformatics. 2012;28(4):573–580. doi:10.1093/bioinformatics/btr709
12. Wang X, Ning Y, Zhou B, Yang L, Wang Y, Guo X. Integrated bioinformatics analysis of the osteoarthritis-associated microRNA expression signature. Mol Med Rep. 2018;17(1):1833–1838. doi:10.3892/mmr.2017.8057
13. Szklarczyk D, Morris JH, Cook H, et al. The STRING database in 2017: quality-controlled protein–protein association networks, made broadly accessible. Nucleic Acids Res. 2017;45(D1):D362–D368. doi:10.1093/nar/gkw937
14. Sun X, Clermont PL, Jiao W, et al. Elevated expression of the centromere protein-A (CENP-A)-encoding gene as a prognostic and predictive biomarker in human cancers. Int J Cancer. 2016;139(4):899–907. doi:10.1002/ijc.30133
15. Sakai K, Ohira T, Matsubayashi J, et al. Performance of Oncomine Fusion Transcript kit for formalin‐fixed, paraffin‐embedded lung cancer specimens. Cancer Sci. 2019;(March):
16. Stranger BE, Brigham LE, Hasz R, et al. Enhancing GTEx by bridging the gaps between genotype, gene expression, and disease. Nat Genet. 2017;49(12):1664–1670. doi:10.1038/ng.3969
17. Tang Z, Li C, Kang B, Gao G, Li C, Zhang Z. GEPIA: a web server for cancer and normal gene expression profiling and interactive analyses. Nucleic Acids Res. 2017;45(W1):W98–W102. doi:10.1093/nar/gkx247
18. Cabello CM, Bair WB, Lamore SD, et al. NIH public access. Cancer Discov. 2010;46(2):220–231. doi:10.1016/j.freeradbiomed.2008.10.025.The
19. Reimand J, Isserlin R, Voisin V, et al. Pathway enrichment analysis and visualization of omics data using g: profiler,GSEA, cytoscape and enrichment map. Nat Protoc. 2019;14(2):482–517. doi:10.1038/s41596-018-0103-9
20. Yoshihara K, Tsunoda T, Shigemizu D, et al. High-risk ovarian cancer based on 126-gene expression signature is uniquely characterized by downregulation of antigen presentation pathway. Clin Cancer Res. 2012;18(5):1374–1385. doi:10.1158/1078-0432.CCR-11-2725
21. Yu NYL, Hallström BM, Fagerberg L, et al. Complementing tissue characterization by integrating transcriptome profiling from the human protein atlas and from the FANTOM5 consortium. Nucleic Acids Res. 2015;43(14):6787–6798. doi:10.1093/nar/gkv608
22. Xu T, Zhang R, Dong M, et al. Osteoglycin (OGN) inhibits cell proliferation and invasiveness in breast cancer via PI3K/Akt/mTOR signaling pathway. Onco Targets Ther. 2019;12:10639–10650. doi:10.2147/OTT.S222967
23. Ai J, Gong C, Wu J, et al. MicroRNA-181c suppresses growth and metastasis of hepatocellular carcinoma by modulating NCAPG. Cancer Manag Res. 2019;11:3455–3467. doi:10.2147/CMAR.S197716
24. Wang D-Y, Li N, Cui Y-L. Long Non-coding RNA CCAT1 sponges miR-454 to promote chemoresistance of ovarian cancer cells to cisplatin by regulation of surviving. Cancer Res Treat. 2020. doi:10.4143/crt.2019.498
25. Hu Z, Cai M, Zhang Y, Tao L, Guo R. miR-29c-3p inhibits autophagy and cisplatin resistance in ovarian cancer by regulating FOXP1/ATG14 pathway. Cell Cycle. 2020;19(2):193–206. doi:10.1080/15384101.2019.1704537
26. Liu R, Guo H, Lu S. MiR-335-5p restores cisplatin sensitivity in ovarian cancer cells through targeting BCL2L2. Cancer Med. 2018;7(9):4598–4609. doi:10.1002/cam4.1682
27. Jian L, Yang G. Identification of key genes involved in diabetic peripheral neuropathy progression and associated with pancreatic cancer. Diabetes, Metab Syndr Obes Targets Ther. 2020;13:463–476. doi:10.2147/DMSO.S235011
28. Li S, Xuan Y, Gao B, et al. Identification of an eight-gene prognostic signature for lung adenocarcinoma. Cancer Manag Res. 2018;10:3383–3392. doi:10.2147/CMAR.S173941
29. Liang M-L, Hsieh T-H, Ng K-H, et al. Downregulation of miR-137 and miR-6500-3p promotes cell proliferation in pediatric high-grade gliomas. Oncotarget. 2016;7:15. doi:10.18632/oncotarget.7736
30. Liu W, Liang B, Liu H, et al. Overexpression of non-SMC condensin i complex subunit G serves as a promising prognostic marker and therapeutic target for hepatocellular carcinoma. Int J Mol Med. 2017;40(3):731–738. doi:10.3892/ijmm.2017.3079
31. Zhang Q, Su R, Shan C, Gao C, Wu P. Non-SMC Condensin I Complex, Subunit G (NCAPG) is a novel mitotic gene required for hepatocellular cancer cell proliferation and migration. Oncol Res Featur Preclin Clin Cancer Ther. 2017;26(2):269–276. doi:10.3727/096504017x15075967560980
32. Li B, Pu K, Wu X. Identifying novel biomarkers in hepatocellular carcinoma by weighted gene co‐expression network analysis. J Cell Biochem. 2019;120(7):11418–11431. doi:10.1002/jcb.28420
33. Bayo J, Fiore EJ, Dominguez LM, et al. A comprehensive study of epigenetic alterations in hepatocellular carcinoma identifies potential therapeutic targets. J Hepatol. 2019;71(1):78–90. doi:10.1016/j.jhep.2019.03.007
34. Kagami Y, Yoshida K. The functional role for condensin in the regulation of chromosomal organization during the cell cycle. Cell Mol Life Sci. 2016;73(24):4591–4598. doi:10.1007/s00018-016-2305-z
35. Yin L, Jiang LP, Shen QS, et al. NCAPH plays important roles in human colon cancer. Cell Death Dis. 2017;8(3):1–8. doi:10.1038/cddis.2017.88
36. Zhan P, Xi GM, Zhang B, et al. NCAPG2 promotes tumour proliferation by regulating G2/M phase and associates with poor prognosis in lung adenocarcinoma. J Cell Mol Med. 2017;21(4):665–676. doi:10.1111/jcmm.13010
37. Lai SK, Wong CH, Lee YP, Li HY. Caspase-3-mediated degradation of condensin Cap-H regulates mitotic cell death. Cell Death Differ. 2011;18(6):996–1004. doi:10.1038/cdd.2010.165
 © 2020 The Author(s). This work is published and licensed by Dove Medical Press Limited. The full terms of this license are available at https://www.dovepress.com/terms.php and incorporate the Creative Commons Attribution - Non Commercial (unported, v3.0) License.
By accessing the work you hereby accept the Terms. Non-commercial uses of the work are permitted without any further permission from Dove Medical Press Limited, provided the work is properly attributed. For permission for commercial use of this work, please see paragraphs 4.2 and 5 of our Terms.
© 2020 The Author(s). This work is published and licensed by Dove Medical Press Limited. The full terms of this license are available at https://www.dovepress.com/terms.php and incorporate the Creative Commons Attribution - Non Commercial (unported, v3.0) License.
By accessing the work you hereby accept the Terms. Non-commercial uses of the work are permitted without any further permission from Dove Medical Press Limited, provided the work is properly attributed. For permission for commercial use of this work, please see paragraphs 4.2 and 5 of our Terms.