")
Back to Journals » OncoTargets and Therapy » Volume 12
Elevated HOXA13 expression promotes the proliferation and metastasis of gastric cancer partly via activating Erk1/2
Authors Qin Z , Chen Z, Weng J, Li S, Rong Z, Zhou C
Received 5 December 2018
Accepted for publication 24 January 2019
Published 4 March 2019 Volume 2019:12 Pages 1803—1813
DOI https://doi.org/10.2147/OTT.S196986
Checked for plagiarism Yes
Review by Single anonymous peer review
Peer reviewer comments 2
Editor who approved publication: Dr William C. Cho
Zhiwei Qin,1,* Zhengqian Chen,1,* Junyong Weng,2 Shanbao Li,1 Zeyin Rong,1 Chongzhi Zhou1
1Department of General Surgery, Shanghai General Hospital, Shanghai Jiao Tong University School of Medicine, Shanghai 200080, China; 2Department of Gastrointestinal Surgery, Changzheng Hospital, Second Military Medical University, Shanghai 200003, China
*These authors contributed equally to this work
Purpose: HOXA13 is a transcription factor of the Homeobox (HOX) gene family, which is highly evolutionarily conserved. HOXA13 is upregulated and associated with oncogenic properties in some cancers. Here, we studied the potential mechanism of HOXA13-mediated proliferation and metastasis in gastric cancer (GC).
Methods: Quantitative real-time PCR, Western blot, and immunohistochemistry were used to detect HOXA13 expression levels in GC. In vitro and in vivo assays were performed to investigate the function of HOXA13 in GC cell proliferation, migration, and invasion. RNA-Seq transcriptome analysis was performed to study the underlying mechanism of HOXA13-mediated aggressiveness in GC.
Results: HOXA13 mRNA and protein expression levels were upregulated in GC tissues. According to Cell Counting Kit-8 and colony formation assays, we found that HOXA13 overexpression promoted proliferation. Flow cytometry analysis showed that HOXA13 overexpression or knockdown led to G1-S phase transition or G1 phase arrest, respectively. Western blot analysis results showed that HOXA13 overexpression increased cyclin D1 expression, while knockdown decreased its expression. Wound healing and transwell assay results demonstrated that HOXA13 overexpression promoted the migration and invasion of GC cells. Western blot analysis results also showed that HOXA13 overexpression upregulated N-cadherin and vimentin and downregulated E-cadherin, while HOXA13 knockdown led to the opposite results, indicating that HOXA13 might participate in epithelial to mesenchymal transition. These results were verified in vivo by tumor xenograft and metastasis assays. Mechanistically, using RNA-Seq transcriptome analysis, we found that Erk1/2 activation played an important role in HOXA13-induced GC progression.
Conclusion: Our results show that HOXA13 plays an important role in GC development. HOXA13 overexpression promotes proliferation and metastasis partly via activation of Erk1/2 in GC. Thus, HOXA13, together with Erk1/2, may be promising targets for novel anticancer strategies.
Keywords: gastric cancer, HOXA13, Erk1, Erk2, proliferation, metastasis
Introduction
Gastric cancer (GC) is the fifth most frequently diagnosed cancer and is the third leading cause of cancer-related death worldwide.1 Despite improvements in the therapeutic schedule for patients in the early stages of GC, the 5-year overall survival (OS) remains low, and these patients have a poor prognosis.2,3 Therefore, a deeper understanding of the molecular mechanisms underlying GC proliferation and metastasis may provide new insights for developing innovative therapeutic strategies.
As homeodomain-containing transcription factors, Homeobox (HOX) genes are widespread in living organisms and play important roles in embryogenesis by regulating numerous processes, including cell proliferation, differentiation, apoptosis, receptor signaling, and angiogenesis, which represent classic examples of the close connection between embryogenesis and tumorigenesis.4 HOXA13, as a member of the HOX gene family, has been implicated in the regulation of tumorigenesis, including hepatocellular carcinoma (HCC), esophageal squamous cell carcinoma, and pancreatic cancer.5–7 In our previous study, we detected several differentially expressed HOX genes in GC by cDNA microarray, especially HOXA13, which could serve as a significant independent prognostic factor for lower OS and disease-free survival (DFS) rates.8 Although HOXA13 is elevated in some human tumors, its mechanism in GC requires further exploration.
The mitogen-activated protein kinase (MAPK) pathway is a pivotal signal transduction cascade that is frequently activated in cancers.9 The MAPK pathway controls many fundamental cellular processes, such as cell proliferation, differentiation, motility, and metabolism.10 The Erk pathway is an important component of the MAPK pathway, and its activation can promote cell proliferation, survival, and metastasis.11 An increasing number of studies have found that inhibition of Erk1/2 signaling is an effective strategy for anticancer interventions.12,13 However, whether HOXA13 can activate Erk1/2 signaling and thereby exert tumor-promoting action in GC has not been reported in detail.
In the present study, we reveal that HOXA13 promotes GC cell proliferation by increasing cyclin D1 expression and inducing epithelial to mesenchymal transition (EMT) to promote metastasis. We inferred that Erk1/2 activation was one of the important mechanisms by which HOXA13 promotes malignant biological properties in GC.
Materials and methods
Patients and tissue specimens
Human primary GC tissues and adjacent normal tissues used in this study were obtained from the Department of General Surgery of Shanghai General Hospital Affiliated to Shanghai Jiao Tong University (Shanghai, China). Forty-eight tissue samples and their paired adjacent normal mucosae were collected after surgical resection for real-time PCR analysis and Western blot analysis. Another 47 paraffin-embedded pairs were used for immunohistochemistry (IHC). Written informed consent was obtained from all subjects, and the study was performed according to the World Medical Association Declaration of Helsinki. This study was approved by the Ethics Committee of Shanghai General Hospital.
Quantitative real-time polymerase chain reaction (qRT-PCR)
Total RNA was isolated from cells and tissues using TRIzol reagent (Takara, Shiga, Japan) according to the manufacturer’s instructions. The concentrations of RNA were measured using a NanoDrop 2000 (Thermo Fisher Scientific, Waltham, MA, USA). One microgram of RNA per sample was reverse transcribed using Hifair™ 1st Strand cDNA Synthesis SuperMix (Yeasen, Shanghai, China). qRT-PCR was performed using the Hieff™ qPCR SYRB Green Master Mix (Yeasen). The following primers were used for qRT-PCR: GAPDH, forward 5′-GGGAAGGTGAAGGTCGGAGT-3′ and reverse 5′-GGGGTCATTGATGGCAACA-3′; HOXA13, forward 5′-GAACGGCCAAATGTACTGCC-3′ and reverse 5′-GTATAAGGCACGCGCTTCTTTC-3′; VEGFA, forward 5′-ATCGAGTACATCTTCAAGCCAT-3′ and reverse 5′-GTGAGGTTTGATCCGCATAATC-3′; EGFR, forward 5′-ACCCATATGTACCATCGATGTC-3′ and reverse 5′-GAATTCGATGATCAACTCACGG-3′; FGF2, forward 5′-CATCAAGCTACAACTTCAAGCA-3′ and reverse 5′-CCGTAACACATTTAGAAGCCAG-3′; FGFR2, forward 5′-CTAAAGGCAACCTCCGAGAATA-3′ and reverse 5′-ACATTTTTGGGAAGCCAAGTAC-3′. Relative expression was normalized to GAPDH expression. Each qRT-PCR reaction was performed in triplicate, and the relative mRNA levels were calculated using the 2−ΔΔCt method.
Western blot analysis
Tissues and cells were collected and lysed in RIPA lysis buffer (Beyotime Biotechnology, Shanghai, China) containing protease and phosphatase inhibitors (NCM Biotechnology, Jiangsu, China) for 30 minutes at 4°C. The concentrations of proteins were measured using a BCA Protein Assay Kit (Beyotime Biotechnology). Equal amounts of proteins (30 μg) were separated by SDS-PAGE and transferred to polyvinylidene fluoride membranes (EMD Millipore, Billerica, MA, USA). After blocking with 5% skim milk for 1 hour at room temperature, the membranes were incubated with primary antibodies at 4°C overnight. The membranes were then incubated with a horseradish peroxidase-conjugated anti-mouse or anti-rabbit secondary antibody (Cell Signaling Technology, Beverly, MA, USA). The protein bands were detected using enhanced chemiluminescence reagent (NCM Biotechnology). Primary antibodies were anti-GAPDH (1:8,000; Proteintech, Chicago, IL, USA), anti-cyclin D1 (1:10,000; Abcam, Cambridge, UK), anti-HOXA13 (1:1,000; Abcam), anti-Erk1/2 (1:1,000; Cell Signaling Technology), anti-p-Erk1/2 (1:1,000; Cell Signaling Technology), anti-vimentin (1:1,000; Cell Signaling Technology), anti-E-cadherin (1:1,000; Cell Signaling Technology), and anti-N-cadherin (1:1,000; Cell Signaling Technology).
Immunohistochemical staining
Tissue sections were deparaffinized, rehydrated, and heat-treated with citrate buffer (0.01 M, pH 6.0) for epitope retrieval. After exposure to 3% hydrogen peroxide for 10 minutes to block endogenous peroxidase activity, the tissue sections were incubated with anti-HOXA13 (1:200; Abcam) and anti-Ki67 antibodies (1:100; Abcam) at 4°C overnight. Then, the anti-mouse or anti-rabbit GTVision™ Detection System (GeneTech, Shanghai, China) was used to detect the primary antibody after incubation for 30 minutes at room temperature. After washing, the slides were counterstained with hematoxylin and mounted with coverslips. The immunohistochemical score was based on the staining intensity and the percentage of positive cells.14
Cell lines and stable cell line generation
The human GC cell lines AGS and SGC-7901 were obtained from the Type Culture Collection of the Chinese Academy of Sciences (Shanghai, China). The cell lines were cultured in RPMI-1640 medium supplemented with 10% FBS (Thermo Fisher Scientific) and 1% penicillin–streptomycin at 37°C under a humidified atmosphere containing 5% CO2.
The human HOXA13 coding region was amplified by qRT-PCR. The amplified fragment of HOXA13 or the control was cloned into the lentivirus vector PGMLV-6395 to produce viruses, with which AGS cells were then infected. HOXA13 shRNA and control shRNA were cloned into the lentiviral vector PGMLV-SC5, with which SGC-7901 cells were then infected. All transfected cells were selected by growing them in a medium containing 1.5 μg/mL (AGS) or 1.0 μg/mL (SGC-7901) puromycin (Invivogen, San Diego, CA, USA) for 7 days. All lentiviral vectors were obtained from Genomeditech (Shanghai, China). The cell lines were divided into the following categories: AGS-CON, control group without any infection; AGS-Vector, infected with the lentiviral vector containing the control fragment; AGS-HOXA13, infected with the lentiviral vector containing the HOXA13 fragment; SGC-7901-CON, control group without any infection; SGC-7901-Scramble, infected with the control shRNA lentivirus; SGC-7901-sh-HOXA13, infected with Lenti-shRNA. The HOXA13 expression levels in the cells were verified by qRT-PCR and Western blot analyses.
Cell functional assays
Cell Counting Kit-8 (CCK-8) and plate colony formation assays were conducted to evaluate cellular proliferation in vitro. Briefly, AGS and SGC-7901 cells (5,000 cells/well) were plated in triplicate in 96-well cell culture plates. The CCK-8 assay (Dojindo, Kumamoto, Japan) was used to generate cell growth curves, after which the absorbance at 450 nm was measured on a Gen5 microplate reader (BioTek, Winooski, VT, USA). For the colony formation assays, cells were seeded in six-well plates (800 cells/well), fixed in methyl alcohol for 15 minutes, and dyed with 0.1% crystal violet solution for 15 minutes after 14 days of culture.
For the wound healing assay, cells were plated into six-well plates, and the monolayer was wounded by scratching a sterile pipette tip across the center of the well. Cell debris was then removed by washing with PBS. Images were captured at 0-, 24-, and 48-hour intervals. Wound widths were quantified and compared with baseline values. A Transwell 24-well Boyden chamber (Corning, New York, NY, USA) with an 8.0 μm pore size polycarbonate membrane was used without (migration) or with (invasion) Matrigel (Corning). Each group of cells (2.0×10⁴ cells/chamber) was seeded in the upper chambers in 200 μL of serum-free medium for 24 hours (migration) or 36 hours (invasion), while the bottom chambers were filled with 600 μL of medium containing 10% FBS as a chemoattractant. Cells that migrated or invaded the membranes of the bottom chambers were fixed in methyl alcohol and dyed with 0.1% crystal violet solution.
These experiments were performed independently in triplicate.
Flow cytometry analysis of the cell cycle
The Cell Cycle Kit (Beyotime Biotechnology) was utilized to analyze the cell cycle. Cells were harvested after 24 hours of culture in 6 cm dishes and then fixed in 70% alcohol overnight at 4°C. The cells were then washed with PBS, centrifuged, and resuspended in 0.5 mL of PI/RNase staining buffer. After incubation for 30 minutes at 37°C, cell cycle analysis was performed in a flow cytometer (BD Biosciences, San Jose, CA, USA). This experiment was performed independently in triplicate.
RNA-Seq transcriptome analysis
Total RNA was extracted from AGS-HOXA13 and AGS-Vector cells using TRIzol reagent (Takara). The integrity of the purified RNA was analyzed by the 2200 Electrophoresis Bioanalyzer System (Agilent, Santa Clara, CA, USA) and stored at −80°C. RNA with an RNA integrity number >6.0 was considered suitable for RNA-Seq. Sequencing and bioinformatics analysis were performed by Novelbio (Shanghai, China). Genes were considered to show a statistically significant difference in expression between groups when the P-value was <0.05 and the fold change in expression was greater than 1.5. The analysis was performed independently in triplicate biological replicates, and one sample of AGS-Vector was omitted because of bias.
In vivo tumor xenograft and metastasis assays
Four-week-old male BALB/C nude mice were used to establish GC xenografts and metastasis in vivo. The mice were then randomly divided into four groups (n=5) to establish GC xenografts. Then, 100 μL of 5×10⁶ AGS-HOXA13, AGS-Vector, SGC-7901-Scramble, or SGC-7901-shHOXA13 cells were injected into the subcutaneous tissues of nude mice. All mice were sacrificed 3 weeks after injection. Tumor volume was calculated using the following formula: volume = width2 × length ×0.5. After fixation in 4% paraformaldehyde, the tumors were embedded in paraffin. Paraffin sections of the xenograft tissues were prepared for IHC staining. For metastatic assays, 5×10⁶ cells containing SGC-7901-Scramble or SGC-7901-shHOXA13 were injected into the abdominal cavities of nude mice. Each group included three mice. After 4 weeks, all mice were sacrificed, and the peritoneal metastatic nodules were measured. All animal experiments were approved by the Animal Care Committee of Shanghai General Hospital and performed according to the animal welfare guidelines of the committee.
Statistical analysis
Data analyses were performed using SPSS 22.0 statistical software package (SPSS, Chicago, IL, USA). Two-tailed Student’s t-test was used to evaluate the differences in HOXA13 mRNA expression between GC tissues and paired adjacent normal mucosa. Relationships between variables were estimated using Pearson’s correlation. The statistical significance among covariates was determined using the χ2 test. Other quantitative results are presented as the mean ± SD and were compared using the two-tailed Student’s t-test. For all tests, statistical significance was considered at P-values <0.05.
Results
HOXA13 is upregulated in human GC tissues
The results of qRT-PCR showed that the mRNA expression levels of HOXA13 were significantly upregulated in 40 (83.33%) GC samples compared with the levels in adjacent normal mucosae (Figure 1A). Western blot analysis further confirmed that HOXA13 protein was elevated in GC tissues (Figure 1D). IHC analysis was used to detect HOXA13 expression in another 47 cases of primary GC with adjacent normal mucosae. As summarized in Table 1, HOXA13 expression was mainly detected in GC tissues, and the staining was stronger in these tissues than in normal mucosae (P<0.001). These results, together with the microarray data sets from the Oncomine database (www.oncomine.org) (Figure 1B and C), indicated that HOXA13 was upregulated at the transcriptional and translational levels. Furthermore, a statistically significant correlation between HOXA13 and Ki67 expression was verified (r=0.539, P<0.01, Figure 1E–I).
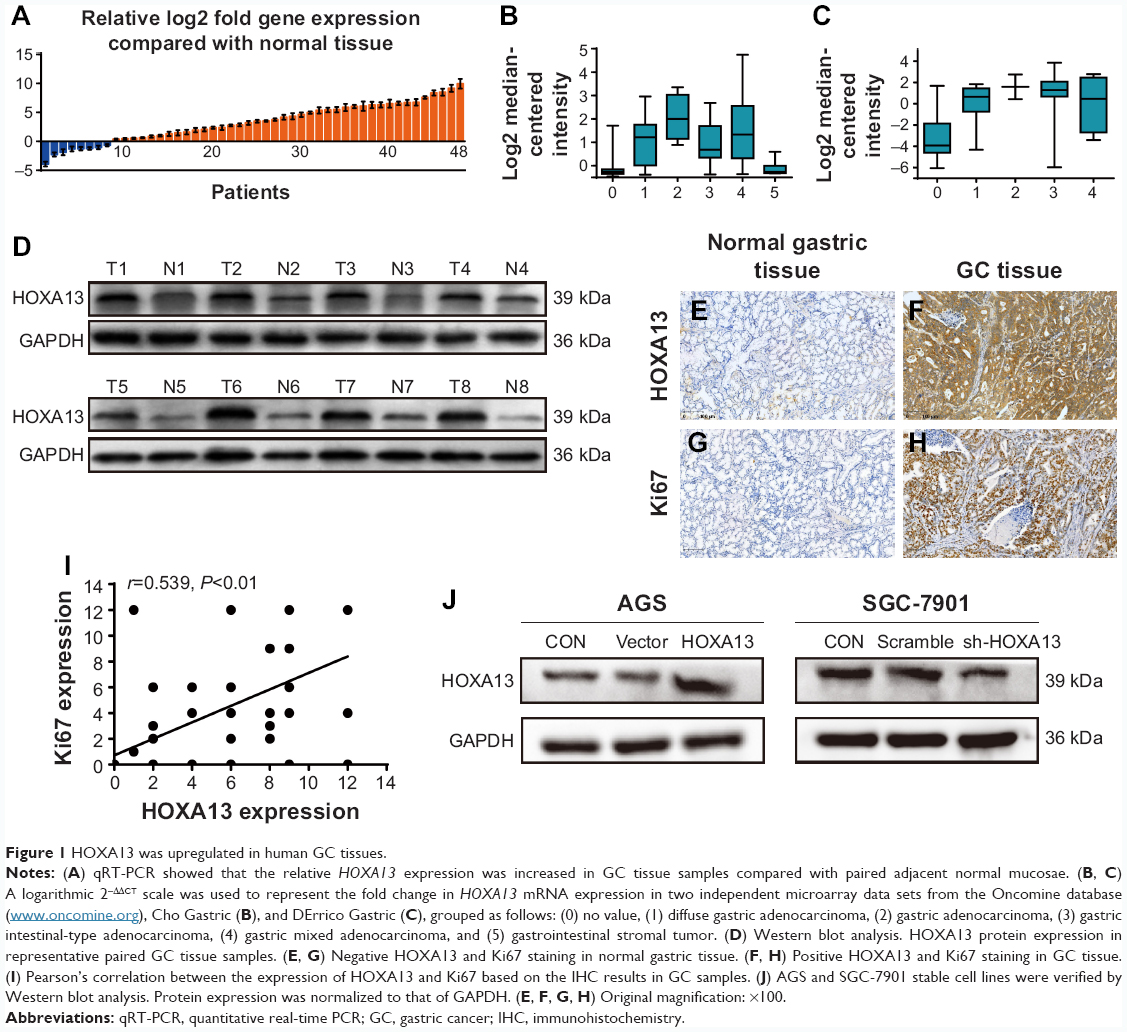 | Figure 1 HOXA13 was upregulated in human GC tissues. |
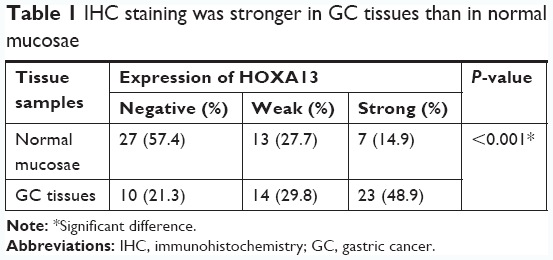 | Table 1 IHC staining was stronger in GC tissues than in normal mucosae |
Overexpression of HOXA13 promotes cell proliferation
To explore the influence of HOXA13 expression on the biological characteristics of GC cells, we selected the AGS and SGC-7901 cell lines to generate stable overexpression and knockdown cell lines (Figure 1J). CCK-8 and plate colony formation assays were used to evaluate the role of HOXA13 in GC cell proliferation. As shown in Figure 2A and B, a significant time-dependent promotion or inhibition of cell proliferation was observed. Furthermore, the colony formation assay showed that the overexpression or knockdown of HOXA13 enhanced or inhibited colony formation, respectively (Figure 2C and D). These results suggested that HOXA13 overexpression promoted cell proliferation.
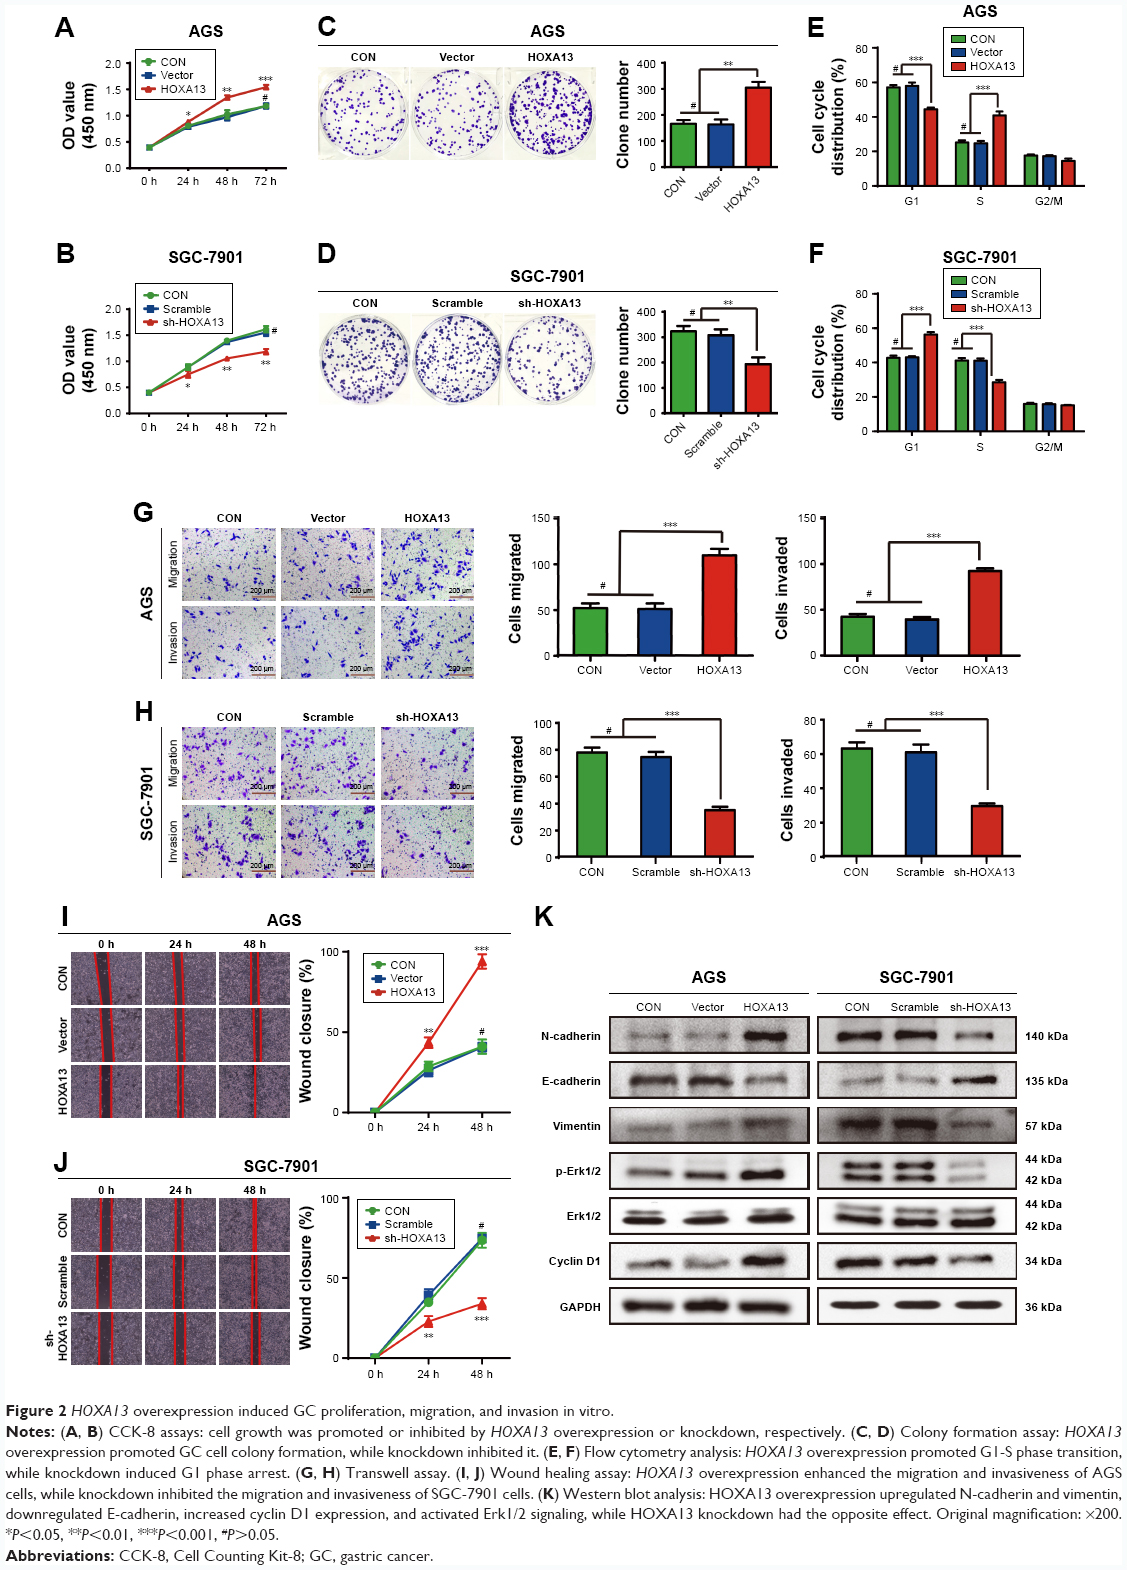 | Figure 2 HOXA13 overexpression induced GC proliferation, migration, and invasion in vitro. |
Overexpression of HOXA13 induces G1-S phase transition and increases cyclin D1 expression
To determine the effect of HOXA13 on the cell cycle, flow cytometry analysis was performed. The results showed that the overexpression of HOXA13 promoted G1-S phase transition in the AGS stable cell line (Figure 2E), while the knockdown of HOXA13 induced G1 phase cell cycle arrest in the SGC-7901 stable cell line (Figure 2F).
We examined cyclin D1 protein expression in AGS and SGC-7901 stable cells by Western blot analysis. The results showed that the overexpression or knockdown of HOXA13 led to elevated or reduced expression of cyclin D1, respectively (Figure 2K). These results indicated that HOXA13 overexpression or knockdown induced G1-S phase transition or an accumulation of cells in G1 phase, respectively, partly via cyclin D1.
Overexpression of HOXA13 enhances GC cell migration and invasion in vitro and induces EMT
Wound healing and transwell assays were used to assess the migration and invasion ability of cells, respectively, in vitro. HOXA13 overexpression significantly enhanced the migration and invasion of AGS cells (Figure 2G and I), while HOXA13 knockdown inhibited the migration and invasion of SGC-7901 cells (Figure 2H and J).
To study whether HOXA13 affected EMT, Western blot analysis was used to examine biomarkers related to the EMT process. The protein expression levels of both N-cadherin and vimentin were increased with HOXA13 overexpression in AGS cells; conversely, E-cadherin expression was decreased. SGC-7901 cells produced the opposite results (Figure 2K). These data revealed that HOXA13 could induce EMT and thereby promote GC cell migration and invasion.
Differential gene expression and pathway analysis in AGS-HOXA13 cells
To further explore the potential mechanisms of HOXA13-mediated proliferation and invasiveness of GC cells, RNA-Seq transcriptome analysis was used to compare the transcriptomes of AGS-HOXA13 and AGS-Vector cells. A total of 1,042 genes were found to be differentially expressed (Figure 3A, HOXA13/Vector ratio >1.50-fold, P<0.05). Gene ontology (GO) analysis was performed to elucidate the biological implications of unique genes in the significant or representative profiles. All data were analyzed to characterize biological processes, cellular components, and molecular functions (Figure 3B). The biological processes in which those differentially expressed genes participate are response to unfolded protein, positive regulation of smooth muscle cell proliferation, and endoplasmic reticulum unfolded protein response, among others. Pathway analysis was performed to identify the signaling pathways of the significantly differentially expressed genes according to the Kyoto Encyclopedia of Genes and Genomes database and revealed the involvement of pathways such as the MAPK signaling pathway, the PI3K-Akt signaling pathway, and the mTOR signaling pathway (Figure 3C). As shown in Figure 3D, the interactive network among these enriched pathways was subsequently explored. The pathway activity network revealed that the MAPK signaling pathway was located in the core position. Therefore, we inferred that the MAPK signaling pathway may be activated in HOXA13 overexpression cells, and its activation may mediate malignant biological properties resulting from HOXA13.
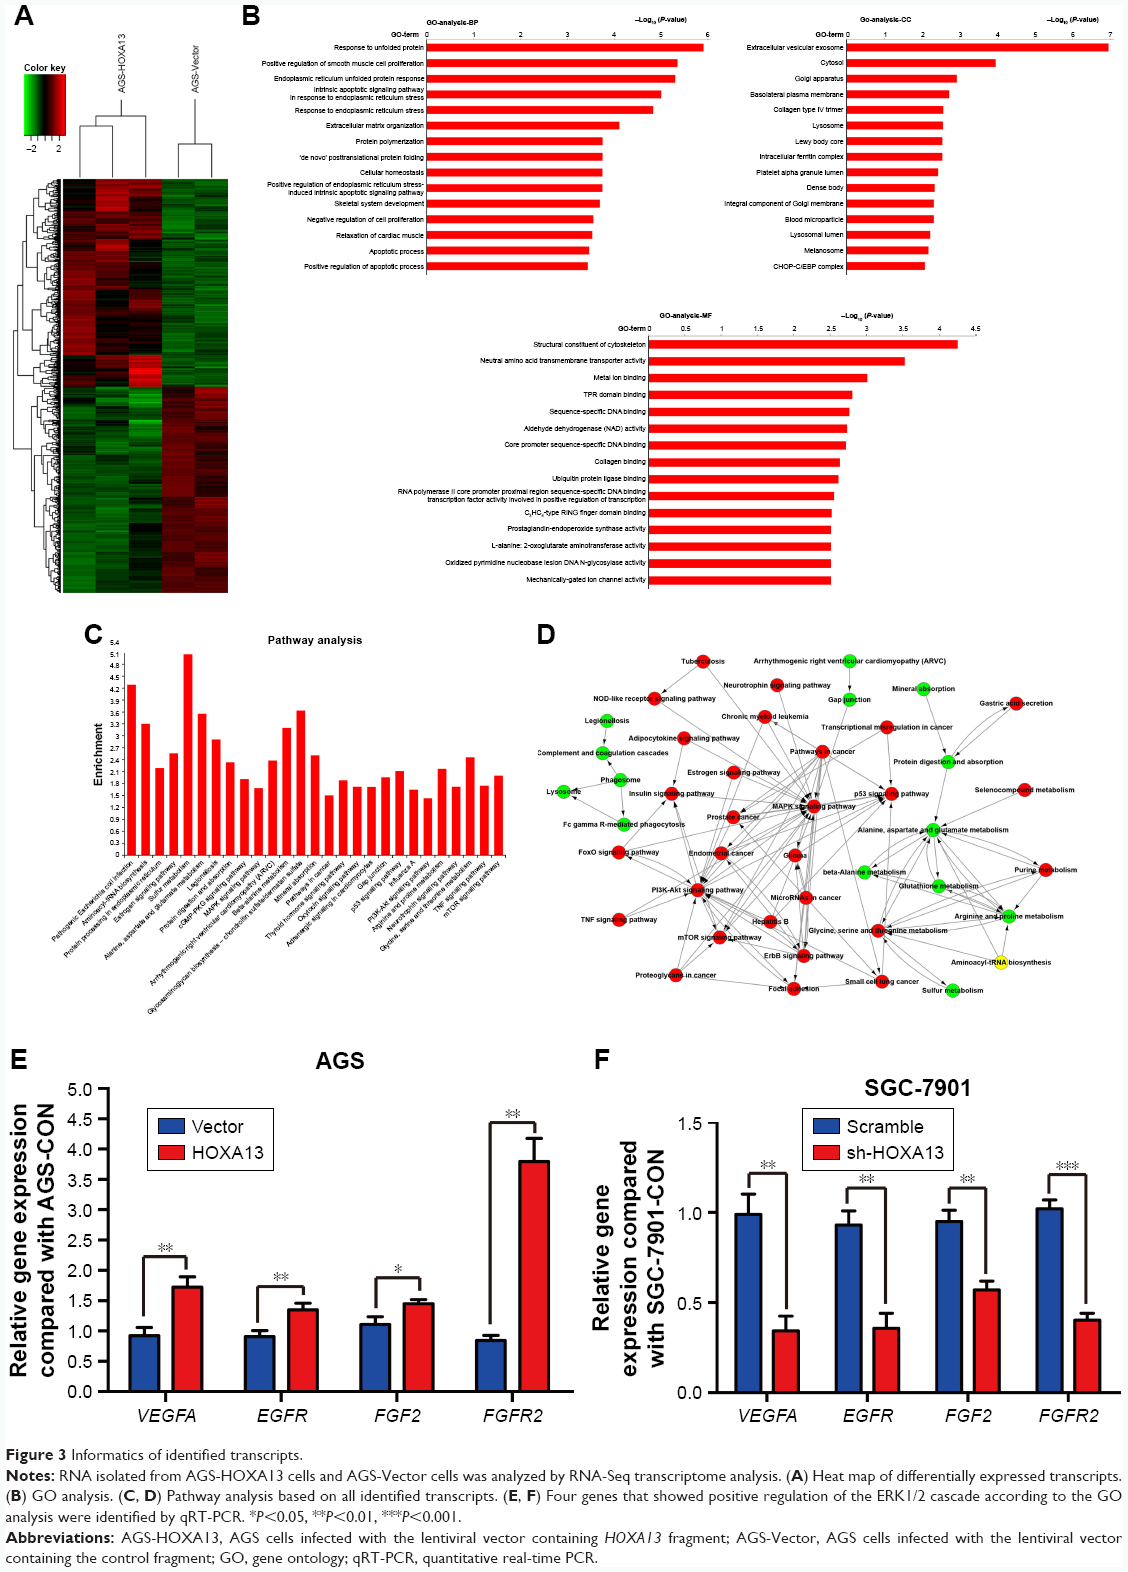 | Figure 3 Informatics of identified transcripts. |
HOXA13 activates the Erk signaling pathway
The Erk signaling pathway plays a key role in the MAPK signaling pathway. We used Western blot analysis to investigate whether HOXA13 participated in Erk1/2 activation. The results showed that HOXA13 overexpression increased Erk1/2 phosphorylation, whereas HOXA13 knockdown decreased Erk1/2 phosphorylation (Figure 2K). Interestingly, we found that VEGFA, EGFR, FGF2, and FGFR2, which exhibited positive regulation of the ERK1/2 cascade according to the GO analysis, were increased according to the RNA-Seq transcriptome analysis. This result was confirmed by qRT-PCR (Figure 3E and F), and altogether, these results indicated that HOXA13 could activate Erk1/2.
HOXA13 enhances tumor growth and metastasis in nude mice
To verify the role of HOXA13 in the tumorigenicity of GC cells, a tumor xenograft assay was performed. As shown in Figure 4A, the sizes of the xenograft tumors in the AGS-HOXA13 group were significantly larger than those in the AGS-Vector group, while HOXA13 knockdown in the SGC-7901 group led to the opposite result (Figure 4B). IHC analysis showed elevated expression of HOXA13 and Ki-67 in the AGS-HOXA13 group (Figure 4D), whereas reduced expression of HOXA13 and Ki67 was detected in the SGC-7901-shHOXA13 group (Figure 4E). These results revealed that HOXA13 overexpression promoted the tumorigenicity of GC cells.
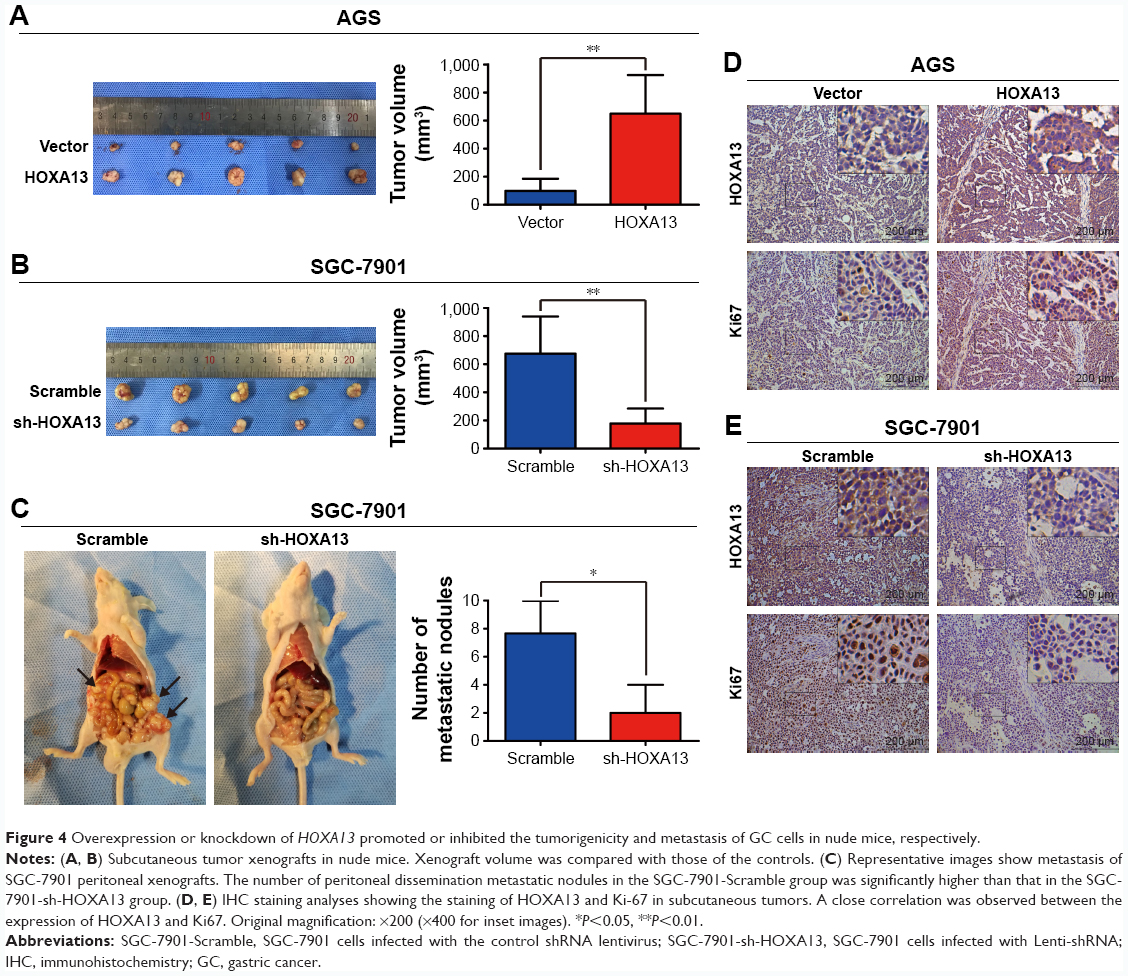 | Figure 4 Overexpression or knockdown of HOXA13 promoted or inhibited the tumorigenicity and metastasis of GC cells in nude mice, respectively. |
The effect of HOXA13 on metastasis was demonstrated by establishing a peritoneal metastatic model. SGC-7901-Scramble and SGC-7901-shHOXA13 were injected into the peritoneal cavities of nude mice. We dissected the nude mice after 4 weeks and observed that HOXA13 knockdown resulted in fewer metastatic nodules (Figure 4C), which confirmed that HOXA13 knockdown inhibited tumor metastasis. These results were consistent with the findings of the in vitro assays.
Discussion
It is widely accepted that embryogenesis and ontogenesis share many similarities with tumorigenesis and are characterized by the same cellular properties.15 Genes that regulate normal cell proliferation and differentiation in embryogenesis are involved in tumorigenesis when dysregulated. HOX genes are typical examples.4,16 HOXA13, a highly conserved transcription factor in the HOX gene family, is associated with a variety of human tumors. However, its mechanism in GC tumorigenesis and progression requires further exploration.
In the present study, we demonstrated that HOXA13 expression was much higher in GC tissues than in normal tissues. To further reveal the effect of HOXA13 on proliferation and metastasis, we generated stable cell lines to perform in vitro and in vivo assays. Using CCK-8 and colony formation assays, we found that the overexpression of HOXA13 promoted the proliferation of GC cells, which was verified by in vivo tumor xenograft assays.
Obviously, the cell cycle is closely correlated with cell proliferation, which is uncontrolled and aberrant in cancer.17,18 Flow cytometry analysis was used to examine the effect of HOXA13 on the cell cycle. The results showed that HOXA13 overexpression or knockdown led to G1-S phase transition or G1 phase arrest, respectively. Cyclin D1 is a key regulator of G1-S phase transition.19 Some studies have reported cyclin D1 to be involved in GC development.20,21 In our study, we found that cyclin D1 expression was increased in AGS-HOXA13 cells but decreased in SGC-7901-shHOXA13 cells compared with the corresponding control cells, which showed that HOXA13 regulated GC cell proliferation partly via cyclin D1.
Then, we performed wound healing and transwell assays to evaluate GC cell migration and invasion after changes in HOXA13 expression, and the results indicated that HOXA13 upregulation promoted GC cell migration and invasion in vitro. This result was consistent with the Western blot results, which showed that the EMT markers N-cadherin and vimentin were increased, E-cadherin was decreased, and that the knockdown of HOXA13 reversed these effects. Furthermore, peritoneal metastatic models in vivo also showed consistent results. Thus, we inferred that, by inducing EMT in GC cells, HOXA13 was closely associated with metastasis.
Regarding the possible mechanism, studies have shown that HOXA13 contributes to EMT in GC cells via the TGF-β signaling pathway,22 and Qu et al showed that CDH17 is a downstream effector of HOXA13 in modulating the Wnt/β-catenin signaling pathway in GC cells.23 In our study, to clarify the underlying mechanism of HOXA13-mediated proliferation and invasiveness of GC cells, we used RNA-Seq transcriptome analysis to explore how changes in HOXA13 expression affect downstream transcripts. The results indicated that 1,042 genes were differentially expressed between AGS-HOXA13 and AGS-Vector cells. Pathway analysis showed that the MAPK signaling pathway, in which Erk signaling is a key component,10,11 was located in the core position in the pathway activity network. The Erk signaling pathway has attracted special attention because of its dysregulation in a large number of cancers.24 Interestingly, Erk1/2 activation contributes to tumor progression through many mechanisms, including the maintenance of activated cyclin D1 and the modulation of cell invasion and progression of EMT.9,25 Studies have shown that the activation of Erk signaling induces EMT progression in HCC, pancreatic ductal adenocarcinoma, and lung cancer.26–28 Our research examined the impact of altered HOXA13 expression on Erk1/2 in GC. Western blot analysis results showed that HOXA13 overexpression increased Erk1/2 phosphorylation, whereas HOXA13 knockdown decreased Erk1/2 phosphorylation. We found that VEGFA, EGFR, FGF2, and FGFR2, which showed positive regulation of the Erk1/2 cascade according to the GO analysis, were increased in RNA-Seq transcriptome analysis, and these results were further confirmed by qRT-PCR. These findings indicate that HOXA13-mediated proliferation and metastasis might occur through the activation of Erk1/2 signaling.
In summary, we preliminarily reveal that HOXA13 promotes proliferation and metastasis by activating the Erk1/2 signaling pathway. In the future, we will focus on the relationship between HOXA13 and downstream genes. Our findings highlight the importance of HOXA13 in tumor proliferation and metastasis and demonstrate that HOXA13, together with Erk1/2, may be promising targets for the development of novel anticancer strategies.
Acknowledgments
This study was funded by the National Natural Science Foundation of China (grant number 81672346), the Medical Guidance Project of Shanghai Science and Technology Commission (grant number 15411965700), the Clinical Research Plan of SHDC (grant number 16CR3082B), and the Interdisciplinary Program of Shanghai Jiao Tong University (grant number YG2015MS27).
Disclosure
The authors report no conflicts of interest in this work.
References
Torre LA, Bray F, Siegel RL, Ferlay J, Lortet-Tieulent J, Jemal A. Global Cancer statistics, 2012. CA Cancer J Clin. 2015;65(2):87–108. | ||
Wadhwa R, Song S, Lee JS, Yao Y, Wei Q, Ajani JA. Gastric cancer-molecular and clinical dimensions. Nat Rev Clin Oncol. 2013;10(11):643–655. | ||
Qiu MZ, Xu RH, Rh X. The progress of targeted therapy in advanced gastric cancer. Biomark Res. 2013;1(1):32. | ||
Shah N, Sukumar S. The hox genes and their roles in oncogenesis. Nat Rev Cancer. 2010;10(5):361–371. | ||
Quagliata L, Matter MS, Piscuoglio S, et al. Long noncoding RNA HOTTIP/HOXA13 expression is associated with disease progression and predicts outcome in hepatocellular carcinoma patients. Hepatology. 2014;59(3):911–923. | ||
Lin C, Wang Y, Wang Y, et al. Transcriptional and posttranscriptional regulation of HOXA13 by lncRNA HOTTIP facilitates tumorigenesis and metastasis in esophageal squamous carcinoma cells. Oncogene. 2017;36(38):5392–5406. | ||
Li Z, Zhao X, Zhou Y, et al. The long non-coding RNA HOTTIP promotes progression and gemcitabine resistance by regulating HOXA13 in pancreatic cancer. J Transl Med. 2015;13:84. | ||
Han Y, Tu WW, Wen YG, et al. Identification and validation that up-expression of HOXA13 is a novel independent prognostic marker of a worse outcome in gastric cancer based on immunohistochemistry. Med Oncol. 2013;30(2):564. | ||
Smalley I, Smalley KSM. ERK inhibition: a new front in the war against MAPK pathway-driven cancers? Cancer Discov. 2018;8(2):140–142. | ||
Kolch W. Coordinating ERK/MAPK signalling through scaffolds and inhibitors. Nat Rev Mol Cell Biol. 2005;6(11):827–837. | ||
Roberts PJ, Der CJ. Targeting the Raf-MEK-ERK mitogen-activated protein kinase cascade for the treatment of cancer. Oncogene. 2007;26(22):3291–3310. | ||
Herrero A, Pinto A, Colón-Bolea P, et al. Small molecule inhibition of ERK dimerization prevents tumorigenesis by Ras-ERK pathway oncogenes. Cancer Cell. 2015;28(2):170–182. | ||
Lito P, Pratilas CA, Joseph EW, et al. Relief of profound feedback inhibition of mitogenic signaling by Raf inhibitors attenuates their activity in BRAFV600E melanomas. Cancer Cell. 2012;22(5):668–682. | ||
Weng J, Xiao J, Mi Y, et al. PCDHGA9 acts as a tumor suppressor to induce tumor cell apoptosis and autophagy and inhibit the EMT process in human gastric cancer. Cell Death Dis. 2018;9(2):27. | ||
Christensen KL, Patrick AN, Mccoy EL, Ford HL. The six family of homeobox genes in development and cancer. Adv Cancer Res. 2008;101:93–126. | ||
Abate-Shen C. Deregulated homeobox gene expression in cancer: cause or consequence? Nat Rev Cancer. 2002;2(10):777–785. | ||
Otto T, Sicinski P. Cell cycle proteins as promising targets in cancer therapy. Nat Rev Cancer. 2017;17(2):93–115. | ||
Malumbres M, Barbacid M. Cell cycle, Cdks and cancer: a changing paradigm. Nat Rev Cancer. 2009;9(3):153–166. | ||
Alao JP. The regulation of cyclin D1 degradation: roles in cancer development and the potential for therapeutic invention. Mol Cancer. 2007;6:24. | ||
Deng M, Zeng C, Lu X, et al. miR-218 suppresses gastric cancer cell cycle progression through the CDK6/Cyclin D1/E2F1 axis in a feedback loop. Cancer Lett. 2017;403:175–185. | ||
Yuan C, Zhu X, Han Y, et al. Elevated HOXA1 expression correlates with accelerated tumor cell proliferation and poor prognosis in gastric cancer partly via cyclin D1. J Exp Clin Cancer Res. 2016;35:15. | ||
He YX, Song XH, Zhao ZY, Zhao H. HOXA13 upregulation in gastric cancer is associated with enhanced cancer cell invasion and epithelial-to-mesenchymal transition. Eur Rev Med Pharmacol Sci. 2017;21(2):258–265. | ||
Qu LP, Zhong YM, Zheng Z, Zhao RX. CDH17 is a downstream effector of HOXA13 in modulating the Wnt/β-catenin signaling pathway in gastric cancer. Eur Rev Med Pharmacol Sci. 2017;21(6):1234–1241. | ||
Kidger AM, Sipthorp J, Cook SJ. ERK1/2 inhibitors: new weapons to inhibit the Ras-regulated Raf-Mek1/2-ERK1/2 pathway. Pharmacol Ther. 2018;187:45–60. | ||
Waerner T, Alacakaptan M, Tamir I, et al. ILEI: a cytokine essential for EMT, tumor formation, and late events in metastasis in epithelial cells. Cancer Cell. 2006;10(3):227–239. | ||
Xia H, Chen J, Shi M, et al. EDIL3 is a novel regulator of epithelial-mesenchymal transition controlling early recurrence of hepatocellular carcinoma. J Hepatol. 2015;63(4):863–873. | ||
Hu J, Li L, Chen H, et al. MiR-361-3p regulates ERK1/2-induced EMT via DUSP2 mRNA degradation in pancreatic ductal adenocarcinoma. Cell Death Dis. 2018;9(8):807. | ||
Wang K, Ji W, Yu Y, et al. FGFR1-ERK1/2-SOX2 axis promotes cell proliferation, epithelial-mesenchymal transition, and metastasis in FGFR1-amplified lung cancer. Oncogene. 2018;37(39):5340–5354. |
 © 2019 The Author(s). This work is published and licensed by Dove Medical Press Limited. The full terms of this license are available at https://www.dovepress.com/terms.php and incorporate the Creative Commons Attribution - Non Commercial (unported, v3.0) License.
By accessing the work you hereby accept the Terms. Non-commercial uses of the work are permitted without any further permission from Dove Medical Press Limited, provided the work is properly attributed. For permission for commercial use of this work, please see paragraphs 4.2 and 5 of our Terms.
© 2019 The Author(s). This work is published and licensed by Dove Medical Press Limited. The full terms of this license are available at https://www.dovepress.com/terms.php and incorporate the Creative Commons Attribution - Non Commercial (unported, v3.0) License.
By accessing the work you hereby accept the Terms. Non-commercial uses of the work are permitted without any further permission from Dove Medical Press Limited, provided the work is properly attributed. For permission for commercial use of this work, please see paragraphs 4.2 and 5 of our Terms.