")
Back to Journals » Diabetes, Metabolic Syndrome and Obesity » Volume 12
Elevated free fatty acid level is associated with insulin-resistant state in nondiabetic Chinese people
Authors Xin YL, Wang Y, Chi J, Zhu X, Zhao H, Zhao S, Wang Y
Received 5 September 2018
Accepted for publication 6 November 2018
Published 17 January 2019 Volume 2019:12 Pages 139—147
DOI https://doi.org/10.2147/DMSO.S186505
Checked for plagiarism Yes
Review by Single anonymous peer review
Peer reviewer comments 2
Editor who approved publication: Dr Steven F. Abcouwer
Yanlu Xin,1 Yunyang Wang,1 Jingwei Chi,2 Xvhua Zhu,3 Hui Zhao,4 Shihua Zhao,1,2 Yangang Wang1
1Department of Endocrinology and Metabolism, Affiliated Hospital of Qingdao University, Qingdao, China; 2Laboratory of Thyroid Disease, Affiliated Hospital of Qingdao University, Qingdao, China; 3Department of Endocrinology and Metabolism, Second People’s Hospital of Qingdao West Coast, Qingdao, China; 4Department of Endocrinology and Metabolism, Hiser Medical Center of Qingdao, Qingdao, China
Background: Free fatty acids (FFAs) are associated with insulin secretion and insulin resistance. However, the associations among FFAs, obesity, and progression from a normal to a prediabetic state are unclear.
Methods: Nondiabetic subjects (5,952) were divided in two groups according to their body mass index (BMI): obese subjects (BMI ≥24 kg/m2) and nonobese subjects (BMI <24 kg/m2). Clinical and multiple glucolipid metabolism data were collected. The homeostasis model assessment for insulin resistance (HOMA-IR) and β-cell function (HOMA-β) was used. HbA1c level between 5.7% and 6.4% was considered prediabetic. Nonparametric tests, one-way ANOVA, and linear correlation analysis were performed. R and SPSS 23.0 software programs were used to analyze the results.
Results: A U-shaped relationship between FFAs and HOMA-IR was observed. After adjusting for potential confounders, the turning points of FFA levels in the curves were 0.54 mmol/L in the nonobese group and 0.61 mmol/L in the obese group. HOMA-IR levels decreased with increasing FFA concentrations before the turning points (regression coefficient [β]= – 0.9, P=0.0111, for the nonobese group; β=0.2, P=0.5094, for the obese group) and then increased (β=0.9, P=0.0069, for the nonobese group; β=1.5, P=0.0263 for the obese group) after the points. Additionally, our study also identified that FFAs were associated with the prediabetes status in obese individuals.
Conclusion: FFA levels were associated with insulin resistance in nondiabetic subjects, and HOMA-IR in nonobese individuals was more sensitive to FFA changes. Monitoring and controlling plasma FFA levels in obese subjects is significant in decreasing insulin resistance and preventing diabetes.
Keywords: FFA, insulin resistance, T2DM, obesity, HOMA-IR
Introduction
Type 2 diabetes (T2DM) is a long-term metabolic disorder. At the beginning of this disorder, most T2DM patients are in an insulin-resistant state, especially in obese individuals.1–3 Long-term compensatory upregulation of insulin leads to an impairment of β-cell function.4 Insulin resistance and obesity are found in a metabolically unhealthy condition that can lead to prediabetes or even diabetes.5 Epidemiological studies have reported that obesity is an important factor of insulin resistance,6,7 in which free fatty acids (FFAs) may exert an assignable effect.
FFAs are intermediate products of fat mobilization, which result from lipolysis and the breakdown of triglycerides (TGs).8 The FFAs are transported to the mitochondria and broken down into CO2 and H2O through β-oxidation, resulting in the production of ATP. In an endocrine process, the levels of FFAs are decreased by insulin, in a process involving inhibition of lipolysis. Elevated FFA levels can also lead to insulin resistance and other metabolic disorders.9,10 Previous studies have reported that long-term FFA-associated insulin resistance was associated with T2DM or other metabolic diseases.11,12 Knowledge of FFA functional mechanisms can therefore provide a basis for preventing and treating diabetes.13
Studies have reported correlations between FFA levels, insulin resistance, and T2DM,7,11,14 but the detailed pathological processes involving FFAs in T2DM are not clear. Some reports have suggested that high levels of FFAs impair islet β-cell functioning,15 while other reports have suggested that high FFA levels lead to insulin resistance by inhibiting the insulin sensitivity of target cells. To characterize the actual effects of FFAs on islet functions and to determine how FFA levels might alter islet β-cell functions, we performed a cross-sectional study involving a large health checkup population in China.
Methods
Study participants
In total, using random cluster sampling methods, 8,752 participants, aged 20–80 years, from the coastal areas of Shandong Province, China, were examined, and 7,890 (4,900 females and 2,990 males) individuals were selected. The sampling was conducted from August 2015 to December 2017. We collected the blood samples and other basic information during the investigation. The exclusion criteria were missing data samples, occurrence of diabetes in patients, prior drug use that would impair β-cell functions or reduce blood lipids, and/or occurrence of liver disease or digestive diseases that would influence absorption, transport, and decomposition of FFAs. In total, 1,938 subjects were excluded. Finally, there were 5,952 individuals in the final analyses. All the individuals signed the informed consent, and the study protocol adhered to the Declaration of Helsinki. The study protocol was approved by the Medical Ethics Committee of the Affiliated Hospital of Qingdao University (QDFYLLWY-201506 number 15–27).
According to Chinese obesity reference standards, the individuals were divided into two groups according to the body mass index (BMI): the nonobese group (BMI <24 kg/m2), and the obese group (BMI ≥24 kg/m2). In subgroup analyses, on the basis of the previous grouping, each group was further randomized into the prediabetes group and group with no glucose impairment based on the criteria of the American Diabetes Association (ADA):16 HbA1c threshold <5.7%, and HbA1c threshold 5.7%–6.4%, respectively.
Biochemical measurements
We collected blood samples after 8 hours of fasting, prior to the laboratory tests. HbA1c was measured by HPLC (Bio-Rad Variant II HbA1c analyzer; Bio-Rad, Hercules, CA, USA). Serum insulin was measured by an electrochemiluminescence method (Cobas e 601; Roche Diagnosis, Mannheim, Germany). Serum samples were assayed for levels of thyroid stimulating hormone (TSH) through electrochemiluminescence using the Cobas e411 automated immunoassay platform (Roche Diagnostics GmbH, Mannheim, Germany). Plasma glucose (glucose oxidase method), FFA (enzyme cycling method), serum uric acid (uricase-phenol–amino-phenazone/N-ethyl-N-(2-hydroxy-3-sulfopropyl)-3-methylaniline [PAP/TOOS] method), serum total cholesterol (cholesterol oxidase/peroxidase aminophenazone [CHOD-PAP] method), serum high-density lipoprotein cholesterol (HDL-C) [International Reagents Corp HDL-C assay method]), serum low-density lipoprotein cholesterol (LDL-C) (catalase LDL-C assay method), serum TGs (glycerol lipase oxidase --peroxidase antiperoxidase method), as well as the enzymes aspartate aminotransferase, alanine aminotransferase, ALP (colorimetric analysis) were measured on a Hitachi 7600±020 instrument (Hitachi, Tokyo, Japan).
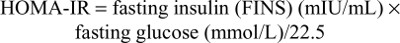
In order to evaluate the functions of β-cells and the degree of insulin resistance, we used the homeostasis model assessment for insulin resistance (HOMA-IR) and β-cell function (HOMA-β) models.17
The HOMA-IR evaluates insulin resistance as follows:
| (1) |
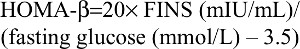
The HOMA-β estimates pancreatic β-cell function as follows:
| (2) |
Statistical analyses
The R software program, version 3.2.2 (http://www.Rproject.org) and the SPSS program, version 23.0 (IBM Corporation, Armonk, NY, USA) were used for statistical analyses. The Kolmogorov–Smirnov Z tests were used to determine whether the data were normally distributed. We used the mean ± SD or median (25th percentile, 75th percentile) as a description of the data. Differences between two groups were compared by independent two-tailed Student’s t-tests for normally distributed data or Mann–Whitney U tests for abnormally distributed data. One-way ANOVA was performed to estimate the influencing factors of pancreatic islet cell functions.
We further explored the nonlinear relationship between FFAs and pancreatic islet cell function by using generalized smoothing splines with knot locations generated automatically in generalized additive models by the R package software. We also attempted to determine the turning point of the relationships between FFAs and pancreatic islet cell function. The turning point of FFA levels was determined by using trial and error methods. We performed linear regression analyses to estimate the relationship between FFAs and HOMA-IR before and after the turning point in the different groups. A P-value (two-tailed) <0.05 was considered statistically significant.
Results
Higher levels of FFAs, HOMA-IR, and HOMA-β were detected in obese individuals
As shown in Table 1, there were no significant differences in sex, age, TSH levels, and the concentrations of uric acid. However, the characteristics of glycometabolism and lipid metabolism were significantly different. Compared to the nonobese group (BMI <24 kg/m2), FFA concentrations were slightly higher in the obese group (BMI ≥24 kg/m2) (0.45±0.23 vs 0.47±0.22, P=0.012). Additionally, TGs, total cholesterol,18 and LDL-C levels were higher (P<0.001) and HDL-C levels were lower in the obese group (P<0.001). In the obese group, several glycometabolism-related parameters were higher, including FINS (12.89±8.67 vs 8.95±6.79 P<0.001) and fasting plasma glucose (FPG) (5.91±1.21 vs 5.62±0.99, P<0.05). HOMA-IR and HOMA-β, the indexes for evaluating islet cell functions, were significantly higher in the obese group (1.93±0.65 vs 1.61±0.58, P<0.001; 108.9±61.98 vs 94.21±55.75, P<0.001) than in the nonobese group. According to these results, multiple indexes, such as FFA levels, HOMA-IR, and HOMA-β, were increased in nondiabetic obese individuals, but the correlations of these parameters with HOMA-IR/HOMA-β are still unknown.
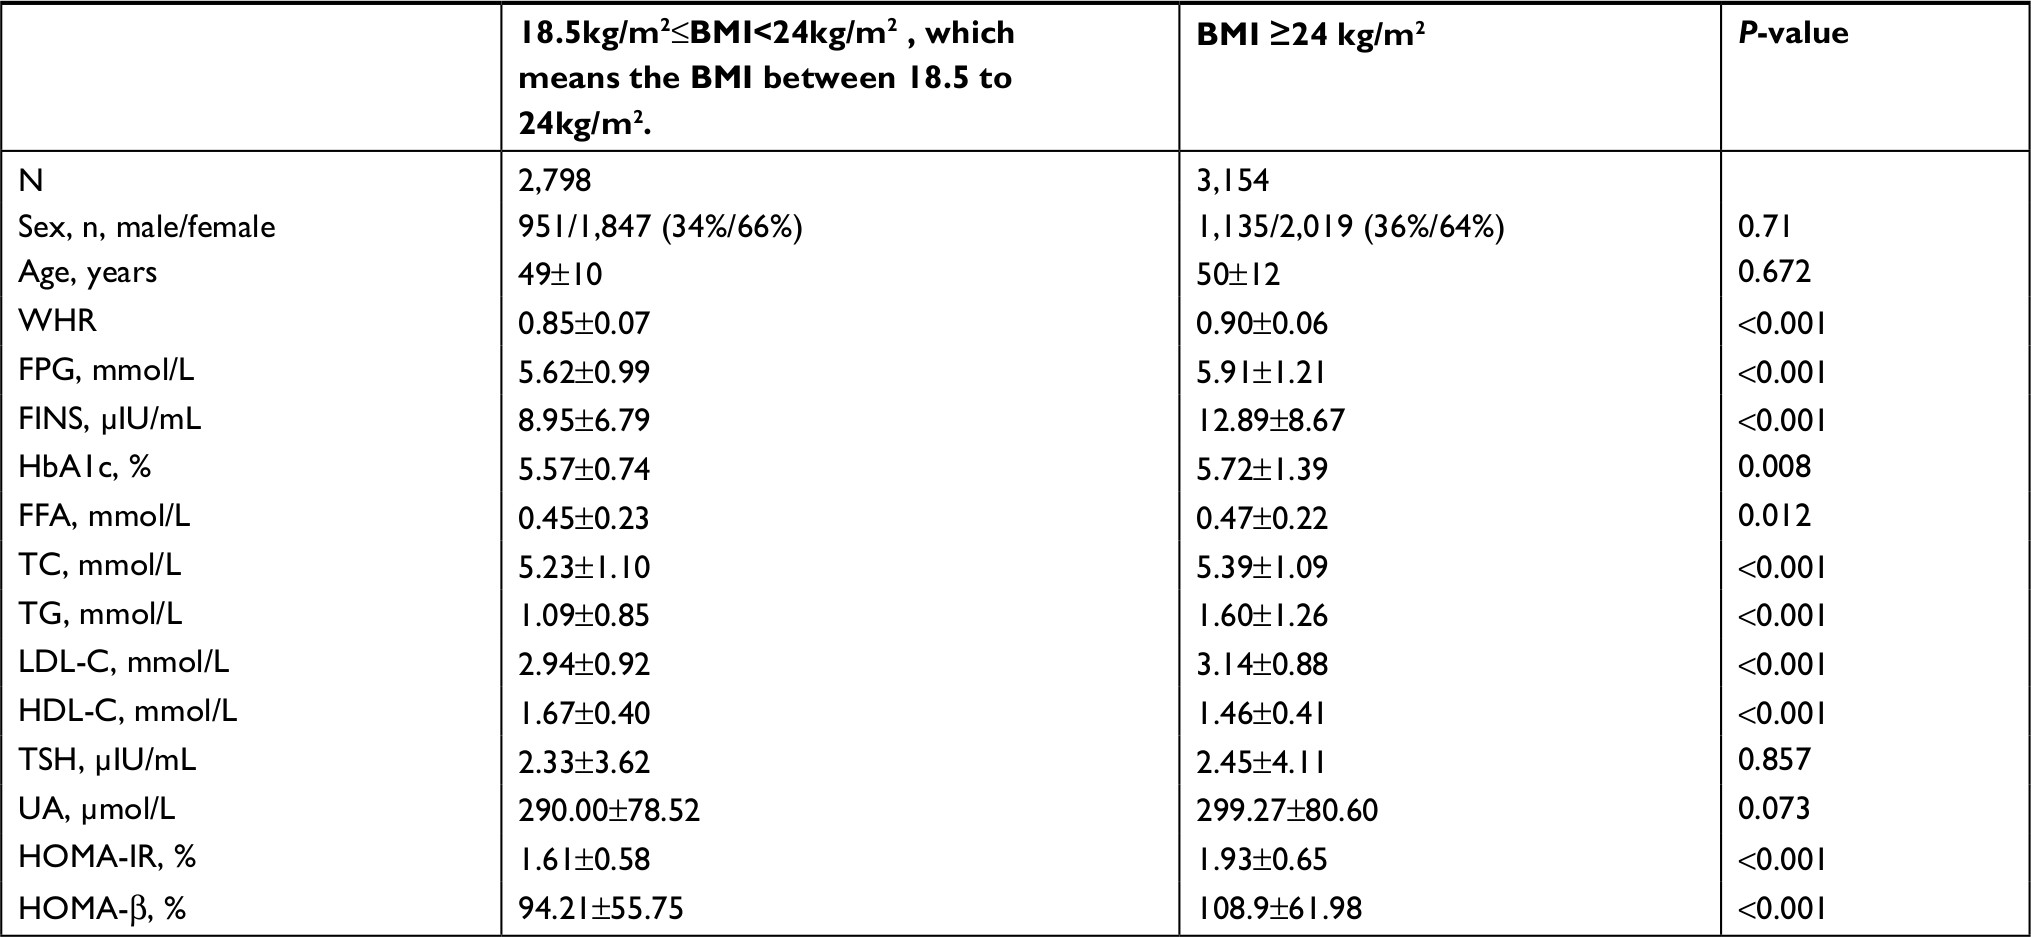 | Table 1 Clinical characteristics of the two groups Note: Data are presented as medians (25th percentile, 75th percentile) for skewed distribution variables. Abbreviations: BMI, body mass index; FFA, free fatty acid; FINS, fasting insulin; FPG, fasting plasma glucose; HDL-C, high-density lipoprotein cholesterol; HOMA-IR, homeostasis model assessment of insulin resistance; HOMA-β, homeostasis model assessment of β-cell function; LDL-C, low-density lipoprotein cholesterol; TC, total cholesterol; TG, triglyceride; TSH, thyroid stimulating hormone; UA, uric acid; WHR, waist-to-hip ratio. |
High FFA levels maybe an important risk factor for insulin resistance in obese individuals
One-way ANOVA was performed to determine the influence of HOMA-IR/HOMA-β among lipid metabolism indexes. HOMA-IR and HOMA-β were regarded as dependent variables, and, the waist-to-hip ratio (WHR), TC, TG, LDL-C, HDL-C, and FFAs were regarded as independent variables. Four items, including TC, TG, LDL-C, and HDL-C, were factors influencing HOMA-IR in the nonobese group, and five items, including WHR, TG, LDL-C, HDL-C, and FFA, were factors influencing the same in the obese group (Table 2). Additionally, HDL-C, LDL-C, and TC in the nonobese group, as well as HDL-C, LDL-C, TC, and TG in the obese group, were the factors influencing HOMA-β (Table 2). No association was observed between FFAs and HOMA-β in both cohorts. Lipid metabolism indexes such as TC, LDL-C, and HDL-C were the basic risk factors for pancreatic islet cell function, while FFA levels may be an important factor for insulin resistance in obesity.
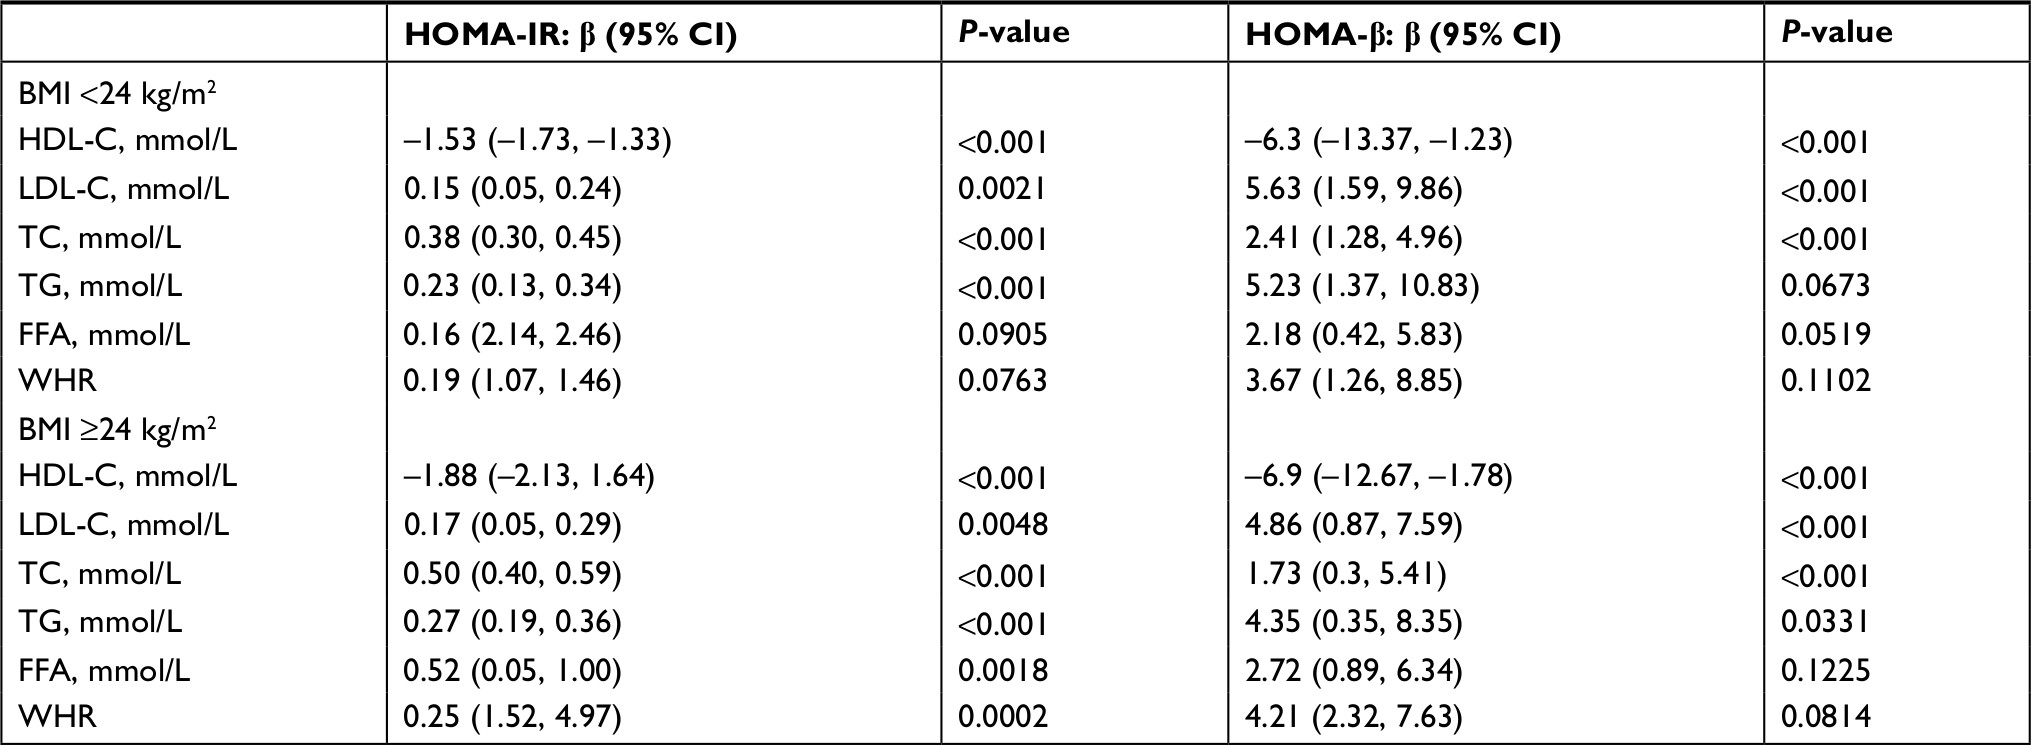 | Table 2 Effects of lipid metabolism indexes on HOMA-IR and HOMA-β Note: The effect of lipid metabolism indexes on HOMA-IR and HOMA-β using one-way ANOVA. Abbreviations: BMI, body mass index; FFA, free fatty acid; HDL-C, high-density lipoprotein; HOMA-IR, homeostasis model assessment of insulin resistance; HOMA-β, homeostasis model assessment of β-cell function; LDL-C, low-density lipoprotein; TC, total cholesterol; TG, triglyceride; WHR, waist-to-hip ratio. |
Insulin resistance was enhanced at FFA concentrations >0.54 mmol/L and >0.61 mmol/L in the two groups
In order to analyze the correlation between FFA concentration and HOMA-IR, we analyzed the relationship after adjusting for TC, TG, HDL-C, and LDL-C. The effects of FFAs on HOMA-IR values in both cohorts are shown in Figure 1. Smoothing splines suggested that the rate of increase of HOMA-IR value in the obese group (Figure 1, Group 2) was faster than that in the nonobese group (Figure 1, Group 1). In the obese group, HOMA-IR showed a trend of smooth decrease with the FFA concentration of 0–0.61 mmol/L and then became enhanced. From the FFA concentration of 0.61 mmol/L, the HOMA-IR increased linearly with increasing FFA levels, after adjusting for TC, TG, HDL-C, and LDL-C. The linear regression coefficients of FFAs above 0.61 mmol/L were 1.58 (95% CI: 0.29, 2.87, P=0.0161) (Table 3). In the nonobese group, HOMA-IR showed a decreasing trend with FFA concentrations of 0–0.54 mmol/L and an increasing trend beyond 0.54 mmol/L, after adjusting for TC, TG, HDL-C, and LDL-C. The linear regression coefficients of FFAs <0.54 mmol/L were –0.9 (95% CI: −1.59,–0.21, P=0.0111) and 0.9 (95% CI: 0.25,1.55, P=0.0069) for FFAs ≥0.54 (Table 3). Additionally, the association between HOMA-β and FFAs was also analyzed in both cohorts, and the results are shown in Figure S1. There were no significant correlations between FFA concentrations and HOMA-β, but the trend of HOMA-β being influenced by FFA levels was higher in the obese group.
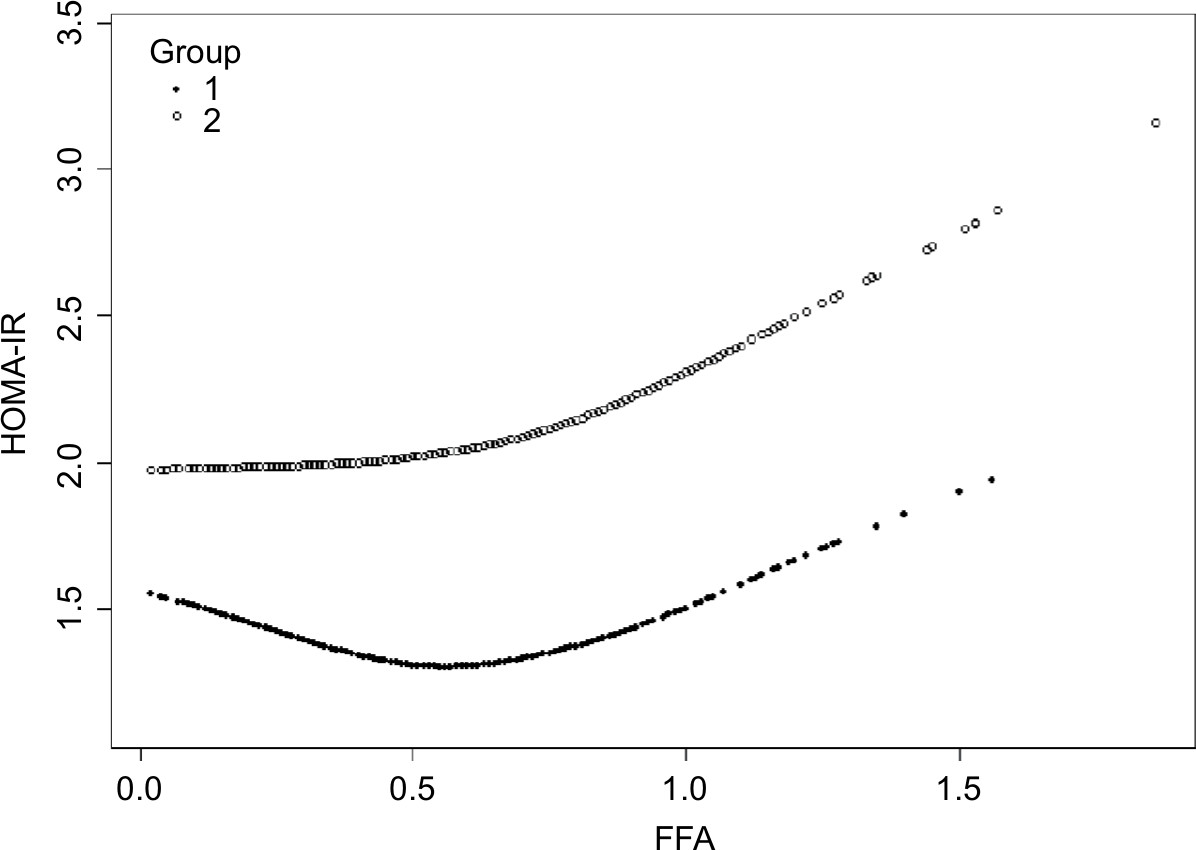 | Figure 1 Nonlinear relationship between FFA concentration and HOMA-IR in the nonobese group (Group 1) and the obese group (Group 2). Note: Results are after adjusting for HDL-C, LDL-C, TC, TG, and WHR. Abbreviations: FFA, free fatty acid; HDL-C, high-density lipoprotein; HOMA-IR, homeostasis model assessment of insulin resistance; LDL-C, low-density lipoprotein; TC, total cholesterol; TG, triglyceride; WHR, waist-to-hip ratio. |
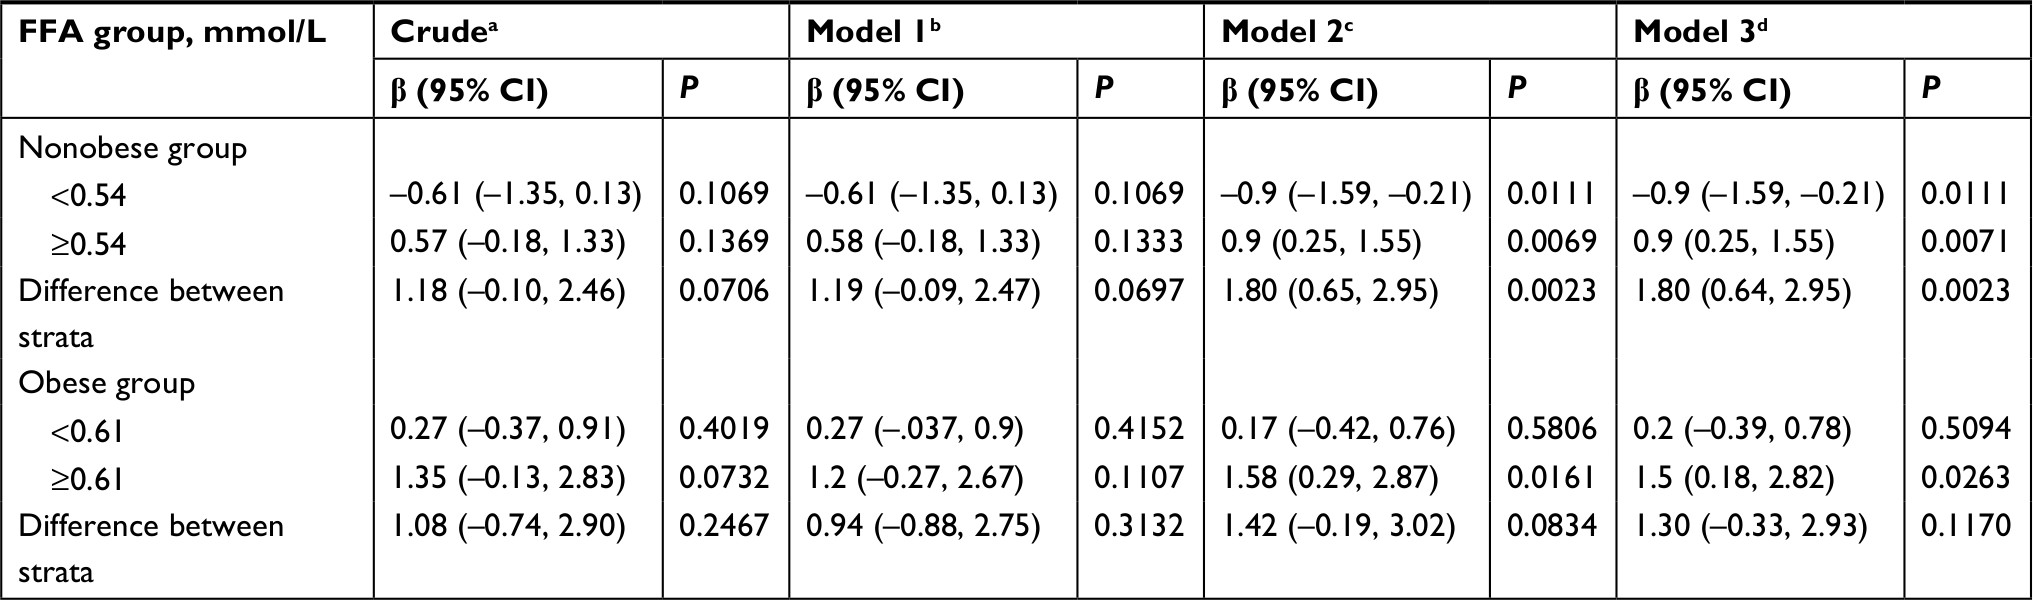 | Table 3 Linear regression model for FFA concentration (mmol/L) and HOMA-IR in the nonobese and obese groups Notes: aNo adjustment. bAdjustment for WHR. cAdditional adjustment for HDL-C, LDL-C, TC, and TG. dAdditional adjustment for HDL-C, LDL-C, TC, TG, and WHR. Linear regression analyses were conducted separately in the strata for the nonobese group and the obese group. Abbreviations: β, regression coefficient; FFA, free fatty acid; HDL-C, high-density lipoprotein; HOMA-IR, homeostasis model assessment of insulin resistance; LD, low-density lipoprotein; TC, total cholesterol; TG, triglyceride; WHR, waist-to-hip ratio. |
High FFA levels were identified as a risk factor for prediabetes in obese individuals
We performed additional analyses to determine the risk factors for prediabetes. Some prospective studies demonstrated that HbA1c ≥5.7% was a strong predictor of subsequent diabetes.16,19,44 In order to analyze the predictive ability of lipid metabolism indexes on prediabetes, we divided all participants into four subgroups according to BMI and HbA1c levels as follows: nonobese control group (BMI <24 kg/m2 and HbA1c <5.7%), nonobese prediabetes group (BMI <24 kg/m2 and 5.7% ≤ HbA1c <6.5%), obese control group (BMI ≥24 kg/m2 and HbA1c <5.7%), and obese prediabetes group (BMI ≥24 kg/m2 and 5.7% ≤ HbA1c <6.5%). The clinical data showed that several lipid metabolism indexes (except HDL-C) were higher in the prediabetes group than in the control group (P<0.05) at the same BMI level (Table 4). There was no difference in FFA concentrations between the prediabetes and control groups in the nonobese individuals (P>0.05). Logistic regression analyses indicated that six indexes were associated with the risk of prediabetes, including age, BMI, WHR, TC, TG, HDL-C, and LDL-C. After adjusting for age and BMI, the results showed that in the nonobese group, five factors were associated with prediabetes, including WHR, TC, TG, HDL-C, and LDL-C. In the obese group, besides the previously mentioned indexes, FFA concentration was another important risk factor for prediabetes.
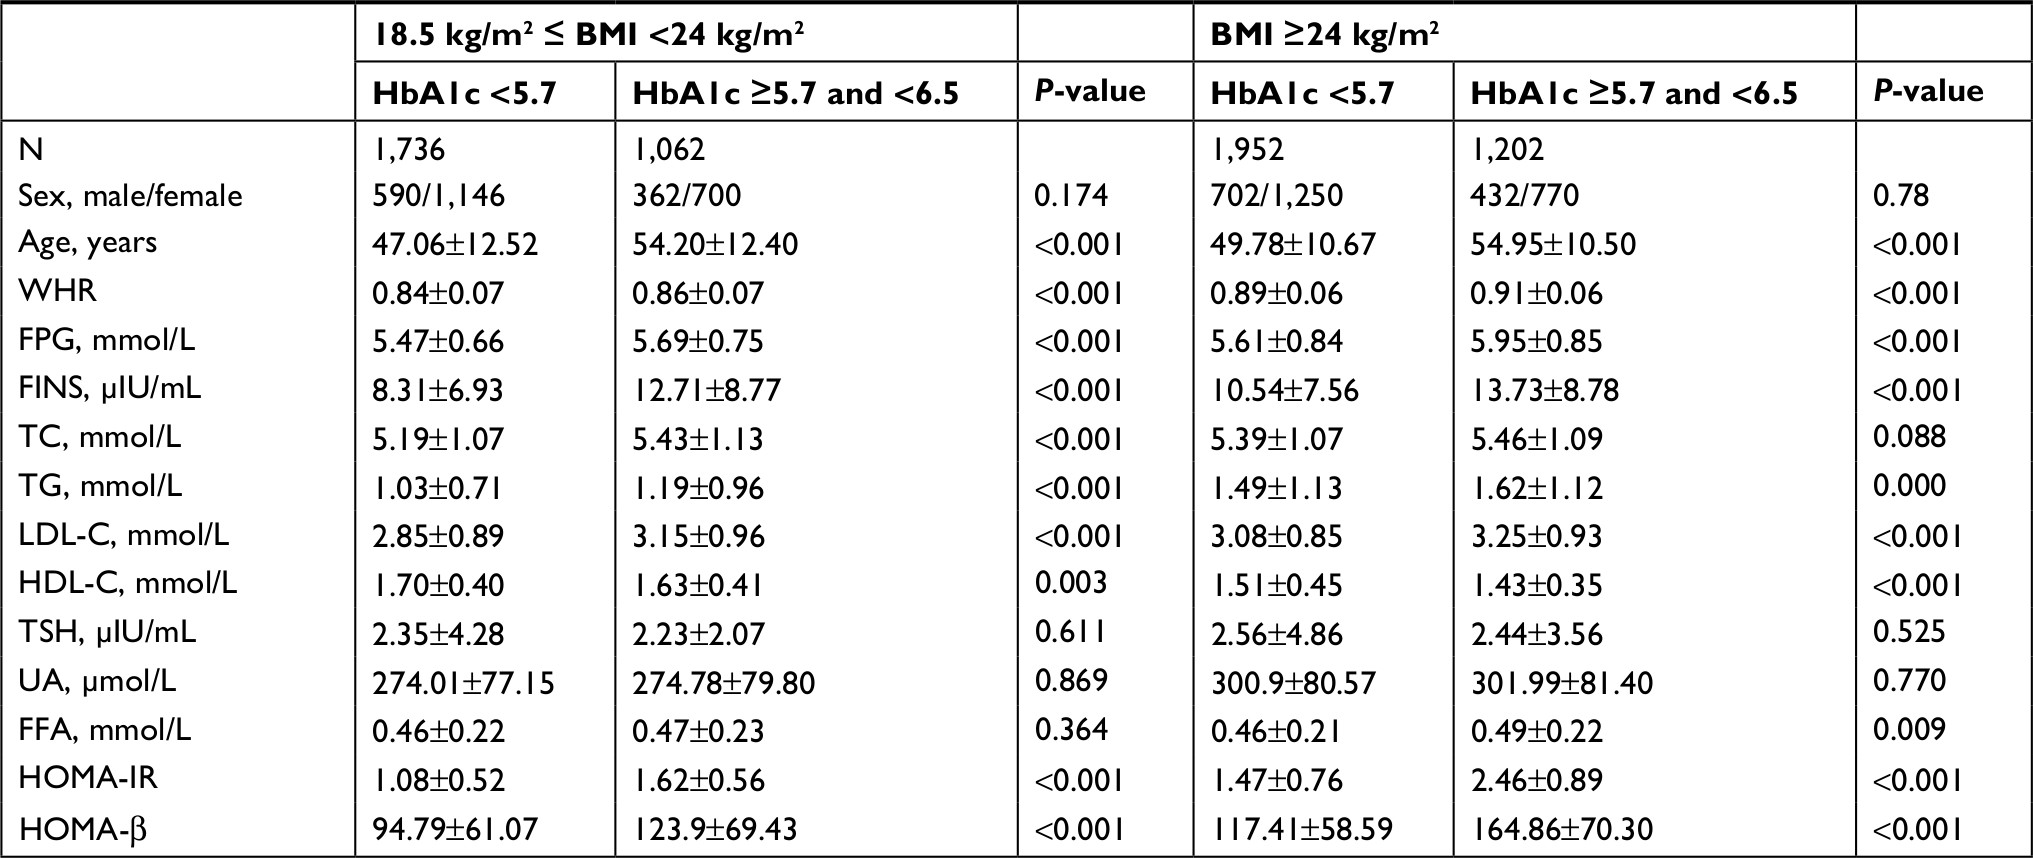 | Table 4 Clinical characteristics of subgroups of control subjects and prediabetes participants, stratified by HbA1c and BMI Note: Data are presented as mean ± SD for skewed distribution variables. Abbreviations: BMI, body mass index; FFA, free fatty acid; FINS, fasting insulin; FPG, fasting plasma glucose; HDL-C, high-density lipoprotein; HOMA-IR, homeostasis model assessment of insulin resistance; HOMA-β, homeostasis model assessment of β-cell function; LDL-C, low-density lipoprotein; TC, total cholesterol; TG, triglyceride; TSH, thyroid stimulating hormone; UA, uric acid; WHR, waist-to-hip ratio. |
Discussion
According to our study, there were significant correlations between HOMA-IR/HOMA-β and multiple glucolipid metabolism indexes in obese individuals or in nonobese ones without diabetes. After adjusting for confounding factors such as HDL-C, LDL-C, TC, and TG, the results of HOMA-IR significantly increased with the increase of FFA concentrations, especially in the obese group. Interestingly, a U-shaped correlation was identified between FFA concentrations and HOMA-IR. The turning points of FFA levels were 0.54 mmol/L in the nonobese group and 0.61 mmol/L in the obese group. However, no correlation between FFA levels and HOMA-β was observed in the two groups. We further performed an analysis in the subgroups classified using BMI and HbA1c. Significantly higher FFA level was found in obese people with prediabetes status. These results indicated that high FFA levels may be a risk factor of prediabetes in obese individuals.
According to the literature,20 insulin secretion is a complex process with various influencing factors, and FFA metabolism may exert double-sided effects on this course. FFA, at relatively low levels, functions as an energy source to provide ATP. Meanwhile, reduction of plasma FFA levels severely impairs glucose-induced release of insulin.21 On the contrary, high concentrations of FFAs induce oxidative stress in tissues by producing increased levels of ROS and reactive nitrogen species,22 which impair DNA and protein in tissues and may act as functionally signaling molecules in insulin resistance.23,24 In our research, we found that full utilization of FFAs or other lipids may impair insulin release in the descending segment of the curve, while in the ascending segment, increased levels of FFAs may contribute to the insulin-resistant state in both groups. Hence, this nonlinear relationship indicated the potential interaction between FFAs and insulin secretion. Interestingly, the turning point in the nonobese group showed up earlier than in the obese group, and the reasons were unclear. We posited a hypothesis that nonobese individuals may be more sensitive to FFA accumulation than obese ones.
Several studies have investigated the effect of FFAs on the process of glucose-induced insulin secretion.21 Acutely elevated insulin secretion could be a compensating mechanism to offset the insulin resistance found under high FFA levels. Meanwhile, insulin functions not only in reducing blood sugar but also in the process of promoting fat synthesis and inhibiting fat breakdown.5,24 Gastaldelli25 revealed that excess FFAs can be taken up by other organs (mainly liver), and that FFA oxidative metabolism is increased and not shifted toward glucose during insulin infusion. Roomp et al26 and Johns et al27 reported that the levels of FFAs have a modest negative correlation with insulin sensitivity. High levels of FFAs facilitate the process of insulin resistance, which is associated with the occurrence of T2DM.1,10,28 A study had further shown that abundant FFAs lead to increased phosphorylation of serine/threonine on insulin receptors and insulin receptor substrate (IRS)-1, thereby activating the signaling inhibition function of protein kinase C.10 Through downregulation of IkB-α, FFAs indirectly activate NF-kβ signaling, which results in inflammatory reactions and insulin resistance.29,30 Additionally, chronic inflammation in adipose tissue is one of the crucial reasons of obesity-related insulin resistance,31,32 and multiple factors such as STAT3, ROS, and TRL4 have been shown to be associated with tissue inflammation and insulin resistance, even β-cell dysfunction and apoptosis.18,33–38 High levels of FFAs can upregulate the expression of the P2X7 receptor, which plays an important role in oxidative stress and inflammatory responses.39
However, in our study, there was no significant correlation between FFAs and HOMA-β. However, high FFAs can increase insulin secretion acutely, not chronically.40 Long-time oxidative stress can also damage islet cells.41 We hypothesize that excessive FFAs will impair β-cells’ function chronically.
Moreover, studies have demonstrated the correlation between FFA levels and prediabetes.42,43 Elevated FFA levels not only stimulate insulin secretion but also contribute to insulin resistance via induction of oxidative stress, endoplasmic reticulum stress, and inflammation of insulin-targeted cells. In addition, Toledo-Corral et al42 found that prediabetic adolescents had higher levels of FFAs than normal adolescents. Insulin resistance caused by abundant FFAs can increase blood glucose levels and lead to prediabetes.43
We found that FFA levels may be a risk factor for prediabetes in obese individuals. Therefore, measuring and controlling plasma FFA levels in obese individuals is important for decreasing insulin resistance and controlling the progression to diabetes.
Conclusion
In general, a U-shaped relationship between FFAs and HOMA-IR levels in nondiabetic individuals was revealed in our study, and there were differences when considering the BMI. The mechanism of this relationship needs many more investigations to interpret.
There are some limitations in our study. We cannot draw a definitive conclusion about causality in this cross-sectional design. It is better to repeat measurements of FFAs and HOMA-IR in experiments on animal models and in longitudinal studies, which will lend greater sensitivity to our findings.
Acknowledgments
This study was funded by the National Natural Science Foundation of China (grant number: 81571625). Writing support was provided by International Science Editing.
Disclosure
The authors report no conflicts of interest in this work.
References
Gastaldelli A, Gaggini M, Defronzo RA. Role of adipose tissue insulin resistance in the natural history of type 2 diabetes: results from the San Antonio Metabolism study. Diabetes. 2017;66(4):815–822. | ||
Czech MP. Insulin action and resistance in obesity and type 2 diabetes. Nat Med. 2017;23(7):804–814. | ||
Xue H, Wang C, Li Y, et al. Incidence of type 2 diabetes and number of events attributable to abdominal obesity in China: A cohort study. J Diabetes. 2016;8(2):190–198. | ||
Florez JC. Newly identified loci highlight beta cell dysfunction as a key cause of type 2 diabetes: where are the insulin resistance genes? Diabetologia. 2008;51(7):1100–1110. | ||
Fatehi-Hassanabad Z, Chan CB. Transcriptional regulation of lipid metabolism by fatty acids: a key determinant of pancreatic beta-cell function. Nutr Metab. 2005;2(1):1. | ||
Xiao X, Liu Y, Sun C, et al. Evaluation of different obesity indices as predictors of type 2 diabetes mellitus in a Chinese population. J Diabetes. 2015;7(3):386–392. | ||
Boden G. Obesity and free fatty acids. Endocrinol Metab Clin North Am. 2008;37(3):635–646. | ||
Zechner R, Strauss JG, Haemmerle G, Lass A, Zimmermann R. Lipolysis: pathway under construction. Curr Opin Lipidol. 2005;16(3):333–340. | ||
Arner P. Insulin resistance in type 2 diabetes: role of fatty acids. Diabetes Metab Res Rev. 2002;18(Suppl 2):S5–S9. | ||
Boden G. Effects of free fatty acids (FFA) on glucose metabolism: significance for insulin resistance and type 2 diabetes. Exp Clin Endocrinol Diabetes. 2003;111(3):121–124. | ||
Ma XL, Meng L, Li LL, Ma LN, Mao XM. Plasma free fatty acids metabolic profile among Uyghurs and Kazaks with or without type 2 diabetes based on GC-MS. Exp Clin Endocrinol Diabetes. 2017;126(10):604-611. | ||
Chung JJ, Huber TB, Gödel M, et al. Albumin-associated free fatty acids induce macropinocytosis in podocytes. J Clin Invest. 2015;125(6):2307–2316. | ||
Tu YM, Gong CX, Ding L, et al. A high concentration of fatty acids induces TNF-α as well as NO release mediated by the P2X4 receptor, and the protective effects of puerarin in RAW264.7 cells. Food Funct. 2017;8(12):4336–4346. | ||
Capurso C, Capurso A. From excess adiposity to insulin resistance: the role of free fatty acids. Vascul Pharmacol. 2012;57(2–4):91–97. | ||
Eguchi K, Manabe I, Oishi-Tanaka Y, et al. Saturated fatty acid and TLR signaling link β cell dysfunction and islet inflammation. Cell Metab. 2012;15(4):518–533. | ||
American Diabetes Association. Standards of medical care in diabetes--2014. Diabetes Care. 2014;37 Suppl 1:S14–S80. | ||
Matthews DR, Hosker JP, Rudenski AS, Naylor BA, Treacher DF, Turner RC. Homeostasis model assessment: insulin resistance and beta-cell function from fasting plasma glucose and insulin concentrations in man. Diabetologia. 1985;28(7):412–419. | ||
Schönfeld P, Wojtczak L. Fatty acids as modulators of the cellular production of reactive oxygen species. Free Radic Biol Med. 2008;45(3):231–241. | ||
Lippi G, Mattiuzzi C, Targher G. Glycated hemoglobin, diabetes, and cardiovascular risk in nondiabetic adults. N Engl J Med. 2010;362(21):2030. | ||
Liang H, Lum H, Alvarez A, Garduno-Garcia JdeJ, Daniel BJ, Musi N. A low dose lipid infusion is sufficient to induce insulin resistance and a pro-inflammatory response in human subjects. PLoS One. 2018;13(4):e0195810. | ||
Boden G. Obesity, insulin resistance and free fatty acids. Curr Opin Endocrinol Diabetes Obes. 2011;18(2):139–143. | ||
Kopprasch S, Srirangan D, Bergmann S, Graessler J, Schwarz PEH, Bornstein SR. Association between systemic oxidative stress and insulin resistance/sensitivity indices - the PREDIAS study. Clin Endocrinol. 2016;84(1):48–54. | ||
Velasquez C, Vasquez JS, Balcazar N. In vitro effect of fatty acids identified in the plasma of obese adolescents on the function of pancreatic β-cells. Diabetes Metab J. 2017;41(4):303–315. | ||
Qu S, Zhang T, Dong HH. Effect of hepatic insulin expression on lipid metabolism in diabetic mice. J Diabetes. 2016;8(3):314–323. | ||
Gastaldelli A. Insulin resistance and reduced metabolic flexibility: cause or consequence of NAFLD? Clin Sci. 2017;131(22):2701–2704. | ||
Roomp K, Kristinsson H, Schvartz D, et al. Combined lipidomic and proteomic analysis of isolated human islets exposed to palmitate reveals time-dependent changes in insulin secretion and lipid metabolism. PLoS One. 2017;12(4):e0176391. | ||
Johns I, Goff L, Bluck LJ, et al. Plasma free fatty acids do not provide the link between obesity and insulin resistance or β-cell dysfunction: results of the Reading, Imperial, Surrey, Cambridge, Kings (RISCK) study. Diabet Med. 2014;31(11):1310–1315. | ||
Arner P, Rydén M. Fatty Acids, Obesity and Insulin Resistance. Obes Facts. 2015;8(2):147–155. | ||
Dasgupta S, Bhattacharya S, Biswas A, et al. NF-kappaB mediates lipid-induced fetuin-A expression in hepatocytes that impairs adipocyte function effecting insulin resistance. Biochem J. 2010;429(3):451–462. | ||
Hennige AM, Staiger H, Wicke C, et al. Fetuin-A induces cytokine expression and suppresses adiponectin production. PLoS One. 2008;3(3):e1765. | ||
Blüher M. Adipose tissue inflammation: a cause or consequence of obesity-related insulin resistance? Clin Sci. 2016;130(18):1603–1614. | ||
Fischer IP, Irmler M, Meyer CW, et al. A history of obesity leaves an inflammatory fingerprint in liver and adipose tissue. Int J Obes. 2018;42(3):507–517. | ||
Li Q, Liu X, Yin Y, et al. Insulin regulates glucose consumption and lactate production through reactive oxygen species and pyruvate kinase M2. Oxid Med Cell Longev. 2014;2014:1–10. | ||
Shirai T, Nazarewicz RR, Wallis BB, et al. The glycolytic enzyme PKM2 bridges metabolic and inflammatory dysfunction in coronary artery disease. J Exp Med. 2016;213(3):337–354. | ||
Min HK, Mirshahi F, Verdianelli A, et al. Activation of the GP130-STAT3 axis and its potential implications in nonalcoholic fatty liver disease. Am J Physiol Gastrointest Liver Physiol. 2015;308(9):G794–G803. | ||
Cai X, Fang C, Hayashi S, et al. Pu-erh tea extract ameliorates high-fat diet-induced nonalcoholic steatohepatitis and insulin resistance by modulating hepatic IL-6/STAT3 signaling in mice. J Gastroenterol. 2016;51(8):819–829. | ||
Zhang D, Gao X, Wang Q, et al. Kakkalide ameliorates endothelial insulin resistance by suppressing reactive oxygen species-associated inflammation. J Diabetes. 2013;5(1):13–24. | ||
Yin J, Peng Y, Wu J, Wang Y, Yao L. Toll-like receptor 2/4 links to free fatty acid-induced inflammation and β-cell dysfunction. J Leukoc Biol. 2014;95(1):47–52. | ||
Xue Y, Guo T, Zou L, et al. Evodiamine attenuates P2X7-mediated inflammatory injury of human umbilical vein endothelial cells exposed to high free fatty acids. Oxid Med Cell Longev. 2018;2018:1–10. | ||
Kristinsson H, Smith DM, Bergsten P, Sargsyan E. FFAR1 is involved in both the acute and chronic effects of palmitate on insulin secretion. Endocrinology. 2013;154(11):4078–4088. | ||
Hasnain SZ, Prins JB, Mcguckin MA. Oxidative and endoplasmic reticulum stress in β-cell dysfunction in diabetes. J Mol Endocrinol. 2016;56(2):R33–R54. | ||
Toledo-Corral CM, Alderete TL, Richey J, Sequeira P, Goran MI, Weigensberg MJ. Fasting, post-OGTT challenge, and nocturnal free fatty acids in prediabetic versus normal glucose tolerant overweight and obese Latino adolescents. Acta Diabetol. 2015;52(2):277–284. | ||
Stefan N, Stumvoll M, Bogardus C, Tataranni PA. Elevated plasma nonesterified fatty acids are associated with deterioration of acute insulin response in IGT but not NGT. Am J Physiol Endocrinol Metab. 2003;284(6):E1156–E1161. | ||
Dorcely B, Katz K, Jagannathan R, et al. Novel biomarkers for prediabetes, diabetes, and associated complications. Diabetes Metab Syndr Obes. 2017;10:345–361. |
Supplementary material
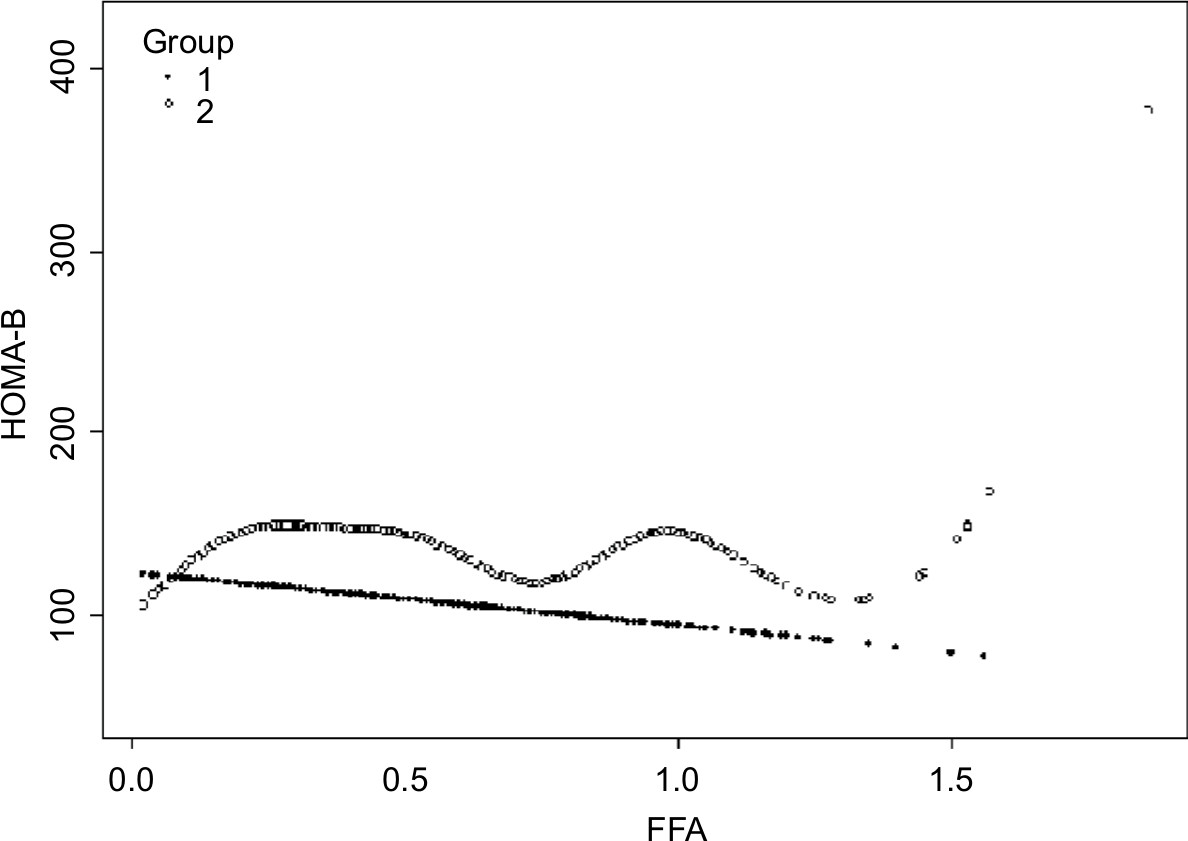 | Figure S1 Nonlinear relationship between FFA concentration and HOMA-β in the nonobese group (Group 1) and the obese group (Group 2). Notes: After adjusting for HDL-C, LDL-C, TC, and TG, there was no significant correlation between FFA concentrations and HOMA-β. Abbreviations: FFA, free fatty acid; HDL-C, high-density lipoprotein; HOMA-β, homeostasis model assessment of β-cell function; LDL-C, low-density lipoprotein; TC, total cholesterol; TG, triglyceride. |
 © 2019 The Author(s). This work is published and licensed by Dove Medical Press Limited. The full terms of this license are available at https://www.dovepress.com/terms.php and incorporate the Creative Commons Attribution - Non Commercial (unported, v3.0) License.
By accessing the work you hereby accept the Terms. Non-commercial uses of the work are permitted without any further permission from Dove Medical Press Limited, provided the work is properly attributed. For permission for commercial use of this work, please see paragraphs 4.2 and 5 of our Terms.
© 2019 The Author(s). This work is published and licensed by Dove Medical Press Limited. The full terms of this license are available at https://www.dovepress.com/terms.php and incorporate the Creative Commons Attribution - Non Commercial (unported, v3.0) License.
By accessing the work you hereby accept the Terms. Non-commercial uses of the work are permitted without any further permission from Dove Medical Press Limited, provided the work is properly attributed. For permission for commercial use of this work, please see paragraphs 4.2 and 5 of our Terms.