")
Back to Journals » Diabetes, Metabolic Syndrome and Obesity » Volume 7
Elevated body mass index as a risk factor for chronic kidney disease: current perspectives
Authors Garland J
Received 20 December 2013
Accepted for publication 3 April 2014
Published 29 July 2014 Volume 2014:7 Pages 347—355
DOI https://doi.org/10.2147/DMSO.S46674
Checked for plagiarism Yes
Review by Single anonymous peer review
Peer reviewer comments 4
Jocelyn S Garland
Department of Medicine, Queen's University, Kingston, ON, Canada
Abstract: Chronic kidney disease (CKD) is defined by the National Kidney Foundation Kidney Disease Outcomes Quality Initiative as the presence of reduced kidney function or kidney damage for a period of 3 months or greater. Obesity is considered a risk factor for CKD development, but its precise role in contributing to CKD and end stage kidney disease is not fully elucidated. In this narrative review, the objectives are to describe the pathogenesis of CKD in obesity, including the impact of altered adipokine secretion in obesity and CKD, and to provide an overview of the clinical studies assessing the risk of obesity and CKD development.
Keywords: obesity, chronic renal disease, adipokine
Chronic kidney disease (CKD) defined
In 2002, CKD was defined by the National Kidney Foundation Kidney Disease Outcomes Quality Initiative as the presence of reduced kidney function, or kidney damage, for a period of 3 months or greater.1 Decreased kidney function refers to a decrease in the glomerular filtration rate (GFR), which is typically estimated (eGFR) in clinical settings, calculated based on the serum creatinine and one of several available equations. By GFR criteria, CKD is diagnosed if GFR <60 mL/min/1.73 m2 for a period of 3 months or greater.1 Once detected, for clinical purposes, based on the eGFR, CKD is divided into stages, with mild CKD represented by stages 1 and 2, and moderate to severe CKD represented by stages 3–5.1 The 2012 Kidney Disease Improving Global Outcomes Guidelines for the Evaluation and Management of CKD recommended the GFR categories outlined in Table 1 to classify CKD.2
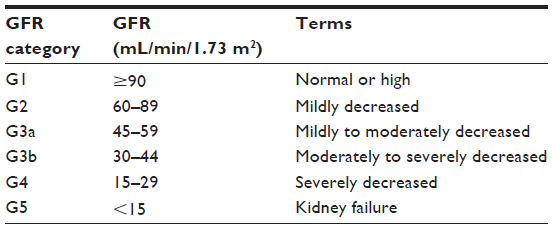 | Table 1 Classification of chronic kidney disease by estimated GFR criteria Kidney Disease: Improving Global Outcomes (KDIGO) CKD Work Group. |
Kidney damage in the CKD definition refers to pathologic abnormalities (obtained from renal biopsy or diagnostic imaging studies), abnormal urinary sediment, or increased urinary protein excretion. Of these, albuminuria is the most frequently assessed marker of kidney damage because of its associated increased risk of CKD progression and end stage renal disease (ESRD) at higher levels of albuminuria, independent of eGFR.3 Albuminuria is classified, based on severity, as A1 (optimal or normal; albuminuria category <30 mg/g), A2 (high; albuminuria category between 30 and 300 mg/g), and A3 (very high; albuminuria category >300 mg/g).2
The increasing prevalence of CKD in the general population and its associated comorbidities render this condition a substantial public health problem. Prevalence estimates of the burden of CKD vary according to the population under study and the CKD definition used. A systematic review from 2012 reported CKD prevalence estimates derived from eGFR measures ranged from 1.7% in China to 8.1% in the USA.4 A Canadian study predicted the life-time risk of an individual developing ESRD and determined the risk was higher in men and was highest in those who had baseline CKD (for eGFR =44–59 mL/min/1.73 m2, the life-time risk of ESRD was 7.51% for men and 3.21% for women).5 Thus, identifying strategies to diagnose and prevent CKD progression is imperative.
It remains uncertain whether screening the general population for CKD is cost-effective;6 therefore, targeted screening for certain groups within the population is recommended.7 Those at the highest risk of developing CKD should be screened: individuals with CVD risk factors (in particular diabetes and/or hypertension) or in patients who have established CVD.7 At this time, routine screening for CKD in patients who are obese in the absence of these other risk factors is not recommended.7
Obesity and CKD
Overweight and obesity are defined by the World Health Organization (WHO) as abnormal or excessive fat accumulation that may impair health.8 The WHO definition of obesity is based on various categorical cut-points based on the body mass index (BMI) of weight-for-height: underweight (<18.5 kg/m2), normal weight (18.5–24.9 kg/m2), overweight (25.0–29.9 kg/m2), and obesity (>30 kg/m2), with obesity class I (30.0–34.9 kg/m2), obesity class II (35.0–39.9 kg/m2), and obesity class III (>40.0 kg/m2).8 Obesity rates have doubled worldwide since 1980, and obesity-related disease is cited as the fifth leading risk factor for global deaths.8 In Canada, obesity rates have steadily risen during the last decade, and in 2011, 25.3% of the Canadian population identified themselves as obese.9
Pathophysiology of CKD development in obesity
Figure 1 describes altered renal hemodynamics, which result in two pathogenic mechanisms of kidney injury in obesity: glomerular hyperperfusion and hyperfiltration.10,11 An elegant study conducted in dogs by Henegar et al10 described in detail some of the physiologic and hormonal changes which occur acutely in obesity leading to hyperperfusion and hyperfiltration. Non-obese dogs were fed a high-fat diet (n=4) for 7–9 weeks, or for 24 weeks (n=4), (so that the dogs would gain 50% of their bodyweight or more), and were compared to non-obese control dogs (n=8).10 At study end, blood pressure, pulse rate, GFR and renal plasma flow were all significantly higher in obese versus non-obese dogs. Plasma insulin levels and plasma renin activity were also significantly greater (Table 2).10
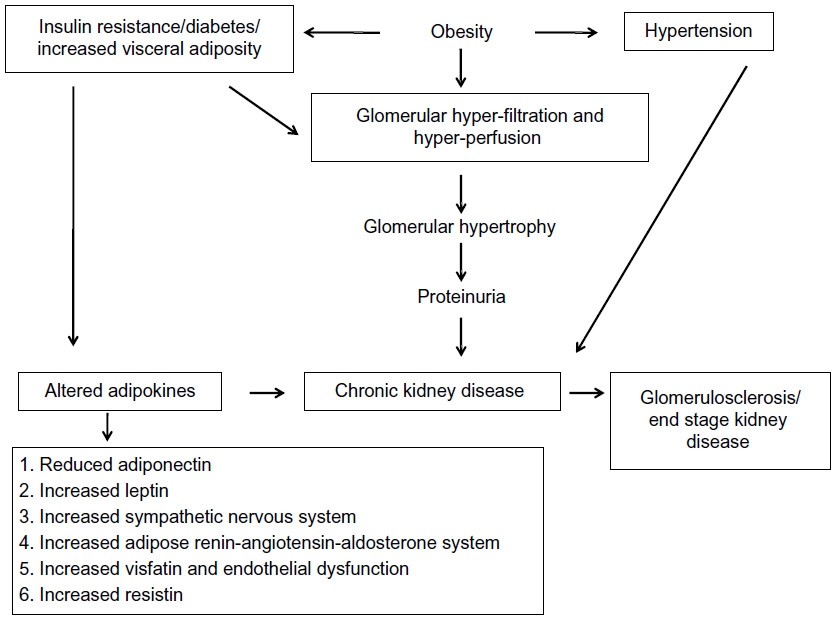 | Figure 1 Pathophysiology of obesity-related glomerulopathy. |
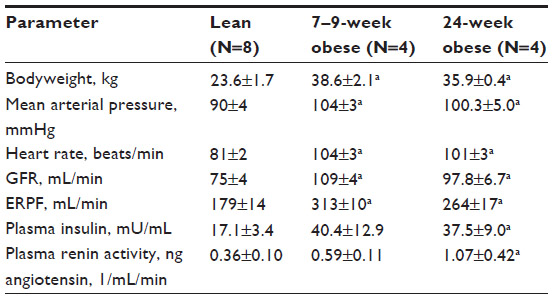 | Table 2 Weight, hemodynamic parameters, renal function, and hormone levels for obese and lean dogs |
In addition to these changes, histological analyses were performed. Structurally, the kidneys of obese dogs demonstrated enlarged Bowman’s space, increased glomerular cell proliferation, increased mesangial expansion and thickened basement membranes, and increased expression of renal TGF (transforming growth factor)-β. The glomerulosclerosis scores for obese versus lean dog kidneys were not statistically different, indicating that renal scarring does not occur acutely in obesity.10
Together, these results demonstrate a near immediate effect of acute obesity on kidney structure and function, but suggest chronic obesity is necessary for permanent renal scarring. Over time, it is postulated that chronic obesity results in glomerular hyperfiltration and in the development of microalbuminuria/proteinuria, (based on direct measurements of GFR in obese individuals),11 followed by hypofiltration, decreased GFR, and CKD progression.12,13 Renal pathology specimens have confirmed the finding of an obesity-related glomerulopathy, where the predominant findings are glomerular hypertrophy and focal segmental glomerulosclerosis.11
The biological mechanisms whereby obesity contributes to CKD remain incompletely understood; however, it is known that obesity may promote kidney damage through direct and indirect mechanisms. Indirect mechanisms of CKD development in obesity include coexisting conditions such as diabetes and hypertension, the two most common causes of CKD, and two conditions recommended for targeted CKD screening.7 Direct mechanisms include hemodynamic and hormonal effects, which lead to glomerular hyperperfusion (increased renal plasma flow)10 and glomerular hyperfiltration (increased GFR),11,12 processes hypothesized to occur because of renal afferent arteriolar vasodilation.13 As a result, glomerular capillary pressure increases, which may result subsequently in increased urinary albumin excretion: microalbuminuria (urinary protein loss of 30–300 mg per 24 hours), followed by overt proteinuria (urinary protein loss of >300 mg per 24 hours), progressive loss in kidney function (declining GFR), and eventually, ESRD.11
Obesity, adipokines, and CKD
In addition to the renal hemodynamic changes that contribute to the development of obesity-related glomerulopathy, recent evidence has suggested that hormones and cytokines secreted from adipose tissue also contribute to CKD. The type and location of adipose tissue is believed to impact on the development of systemic disease. For instance, white adipose tissue, which is the most prevalent in humans, under normal physiological conditions, is represented by a ratio of subcutaneous adipose tissue to visceral adipose tissue, which should be ideally less than 20%.14 Visceral adipose tissue has the highest capacity to secrete hormones and cytokines (referred to as adipokines),14 including those with anti-atherosclerotic properties and those with pro-atherosclerotic properties. The metabolic syndrome is a syndrome that emphasizes the role of visceral adiposity, along with other risk factors, in the pathogenesis of disease. The NCEP-ATP III (National Cholesterol Education Program Adult Treatment Panel III) defines metabolic syndrome as possessing any three of the following criteria: abdominal obesity (waist circumference >102 cm in men and >88 cm in women), serum triglycerides (TG) ≥1.7 mmol/L, or drug treatment for elevated TG; serum high-density lipoprotein cholesterol (HDL-C) <1 mmol/L in men and <1.3 mmol/L in women (or drug treatment for low HDL-C); blood pressure ≥130/85 mmHg or drug treatment for hypertension; and fasting plasma glucose 5.6 mmol/L or drug treatment for hyperglycemia.15 Although there are other definitions for this syndrome, the constellation of metabolic syndrome risk factors, including abdominal obesity, dysglycemia, hypertension, and dyslipidemia is consistent. Visceral obesity is strongly correlated with insulin resistance, and thus patients with some or all of the metabolic syndrome components have an increased risk of developing type 2 diabetes mellitus,16 cardiovascular disease (CVD),17 and CKD.18,19 It is hypothesized that in obesity and insulin resistance, an imbalance between the secretion of pro- versus anti-atherogenic occurs. As a result, pro-atherogenic and inflammatory cytokine production increases, interferes with insulin signaling, and contributes to the development of insulin resistance,20 vascular wall inflammation,21 and CKD.22,23
Diabetes mellitus and hypertension, two components of metabolic syndrome, are also the most common causes for CKD and ESRD. Thus, whether metabolic syndrome is an independent risk factor for CKD, or whether this observed association is confounded (based on the fact that the individual metabolic syndrome components may be associated with each other as well as with CKD) is important to discern. Thomas et al,23 in a systematic review including over 30,000 patients, reported that metabolic syndrome was an independent risk factor for CKD (odds ratio of eGFR <60 mL/min/1.73 m2 1.55; 95% confidence interval [CI] 1.34–1.80). Moreover, as the number of metabolic syndrome components increase from one to five, the strength of the association between metabolic syndrome and CKD increases (P for trend, 0.02).23
Since adipose tissue functions an active endocrine organ, there is interest in defining obesity-related alterations in hormone and adipokine secretion, and their contribution to CKD production and progression. There are numerous hormones and adipokines known to potentially impact on CKD development, and of these, adiponectin and leptin are two adipokines directly secreted from white adipose tissue whose impact on CKD development has been studied. Resistin, visfatin, and the renin–angiotensin–aldosterone system (RAAS) activity in adipose tissue will also be discussed briefly.
Adiponectin and CKD
Adiponectin is a 26.4 kDa protein directly secreted by adipocytes, and in healthy patients, is an important adipokine involved in anti-inflammatory, anti-atherogenic, and insulin-sensitizing properties. Adiponectin is believed to provide a protective role of preventing disease through decreasing inflammation, and levels have been shown to be reduced in obese patients,24 suggesting low adiponectin is important in the etiology of obesity-related diseases. In patients with kidney disease, adiponectin levels increase as kidney function declines,25 and adiponectin levels are increased in patients with ESRD receiving dialysis.26 However, whether higher adiponectin in CKD patients is present as a consequence of retention due to renal dysfunction, or is increased because of a physiological role, is uncertain.
To date, study conclusions have been inconsistent in determining a causal role of adiponectin in the pathogenesis of CKD development. The potential protective effect of adiponectin in preventing CKD development appears to be related to the preservation of renal podocytes, which when damaged are responsible, in part, for proteinuria development. A preclinical study of adiponectin knockout mice demonstrated increased renal fibrosis and proteinuria in CKD (subtotal renal ablation) versus wild-type mice.27 Subsequent treatment of knockout mice with adiponectin reversed proteinuria, and thus low adiponectin may be a novel mechanism for CKD development.27
In a study of 406 patients by Yilmaz et al,28 with non-diabetic CKD, including 80 receiving hemodialysis, adiponectin, visfatin, and endothelial dysfunction were assessed. Endothelial dysfunction has been implicated in the pathogenesis of vascular disease, including CKD, and is characterized by impaired function of the endothelium, such that vasodilation is reduced. In the Yilmaz study, endothelial dysfunction was assessed by flow-mediated dilatation of the brachial artery by high-resolution ultrasound technique. Adiponectin levels increased as kidney function declined, indicating decreased renal excretion with advancing CKD.28 However, once adjusted for kidney function, a multivariable linear regression model demonstrated that patients with the highest adiponectin levels have the highest flow-mediated dilatation levels (adiponectin [β=0.09; P=0.05]), and thus improved endothelial function. Therefore, low adiponectin, in CKD, is associated with endothelial dysfunction. Other CKD studies have demonstrated that low adiponectin is a risk factor for similar adverse outcomes. In a study of 86 patients with stage 1–4 CKD and diabetic nephropathy, low adiponectin was associated with an increased risk of CKD progression.25 Similarly, in a cohort of 227 CKD patients requiring dialysis,26 patients with lower adiponectin levels had an increased risk of developing cardiovascular events.
Koshimura et al compared serum and urine adiponectin levels in diabetic patients (including some patients with CKD) with either normo-, micro-, or macroalbuminuria (N=38).29 Serum adiponectin levels were higher in patients with macroalbuminuria compared with normoalbuminuria (11.0 μg/mL versus 6.5 μg/mL; P<0.05). Urine adiponectin results showed similar findings, and diabetic patients with macroalbuminuria had greater urine adiponectin versus normoalbuminuria (50.3 μg lg versus 4.9 μg lg; P<0.05). The authors suggested that increased adiponectin secretion might be enhanced in patients with overt nephropathy, in an effort to reduce microvascular damage.29 On the other hand, creatinine levels were significantly higher in the overt diabetic nephropathy group in this study (20 mg/dL (17.7 μmol/L) versus 0.70 mg/dL (62 μmol/L) in diabetics with microalbuminuria; P<0.001), and therefore reduced renal function could also have impacted on adioponectin levels.29
In summary, adiponectin levels may be increased in patients with severe CKD and in proteinuric CKD patients. However, low adiponectin in patients who have CKD is a risk factor for CKD progression and cardiovascular events. Possible biological mechanisms whereby adiponectin promotes CKD include proteinuria development (podocyte injury) and endothelial dysfunction. A definitive causal relationship between adiponectin, pathogenesis of vascular disease, and CKD remains uncertain.
Leptin and CKD
Another adipokine which has been evaluated in CKD patients is leptin. The word leptin is derived from the Greek word “leptos” meaning thin. Leptin is a 16 kDa protein coded by the obese (Ob) gene, is directly secreted by adipocytes, and is involved in regulation of bodyweight and metabolism.30 Leptin is secreted in proportion to the amount of body fat, and in health, has an inhibitory effect on food intake.31 Interestingly, studies have shown obese patients have increased leptin levels, and a leptin-resistant state has been described in obese patients with increased BMI.30 Increased leptin appears to be a risk factor for CKD development. A large cross-sectional study of 5,000 patients demonstrated, in an adjusted model for age, sex, race, socioeconomic status, smoking, BMI, diabetes, hypertension, and lipids, that the risk of CKD development significantly increases as blood leptin levels rise.32 In addition, another study of 219 CKD patients demonstrated leptin is correlated with C-reactive protein levels, suggesting that inflammation is a factor contributing to hyper-leptinemia in CKD.33
Leptin is postulated to be involved in the pathogenesis of CKD, and CKD progression, through more than one mechanism. First, leptin stimulates the sympathetic nervous system, promoting renal sodium reabsorption, thereby increasing blood pressure.31,34 Second, leptin has also been linked to inducing renal injury, by stimulating renal endothelial cell proliferation and increased mesangial cell production, leading to renal scarring through the production of type I and type IV collagen, renal fibrosis, and proteinuria.35,36 Longitudinal studies are needed to evaluate the relationship between leptin and CKD development and progression.
Other adipokines and risk of CKD: resistin, visfatin, and RAAS in adipose tissue
Resistin is a 12.5 kDa protein expressed in macrophages from visceral adipose tissue.31 There is interest in studying whether resistin is associated with CKD development, because of the observation that resistin may be a regulator of insulin sensitivity. Preclinical studies, in mice, have suggested that resistin may impact on insulin sensitivity and on blood glucose levels. Steppan et al37 administered resistin by injection versus control to mice after an overnight fast, and again 12 hours later. Glucose tolerance and blood glucose were assessed after the second injection. Blood glucose increased by 28% post-resistin injection (P=0.004) and insulin levels were also increased (data not provided in the Steppan manuscript). In addition, resistin-treated mice demonstrated a significantly blunted response to the hypoglycemic action of insulin, suggesting that resistin impairs glucose tolerance.37 Whether resistin plays a role in insulin sensitivity in humans remains unclear.
Resistin levels are increased in CKD because of decreased renal clearance,38 and thus, CKD-induced accumulation of resistin could be a novel mechanism contributing to the high prevalence of insulin resistance noted in CKD and uremic patients. In a prevalent post hoc study of 239 CKD patients with stage 3–5 CKD, Axelsson et al39 demonstrated that resistin levels are increased in CKD patients, but that resistin, when adjusted for level of GFR, is not a mediator of insulin resistance. Kielstein et al40 reported similar findings in a study of 30 pre-dialysis CKD patients. Thus, at present, there are no data to support a causal role between elevated resistin, insulin resistance, and CKD development.
Visfatin is a 52 kDa protein secreted from visceral adipose tissue and macrophages,31 and blood levels of visfatin accumulate as kidney function declines.41 Visfatin may affect appetite and nutrition in CKD. A cross-sectional study of 246 incident dialysis CKD patients showed that patients with the highest visfatin levels had increased anorexia, lower serum albumin levels, and lower levels of essential and nonessential amino acids.42 Increased visfatin is also a risk factor for endothelial dysfunction.28 In the Yilmaz et al study28 evaluating adipokines and risk of endothelial dysfunction in 406 non-diabetic CKDs patients, visfatin was also assessed. Risk factors for endothelial dysfunction, in a multivariable adjusted linear regression model, also included visfatin (β=−0.15; P≤0.001) in addition to adiponectin (β=0.09; P=0.05), suggesting individuals with lower visfatin and higher adiponectin levels have better endothelial function.28
RAAS in adipose tissue
Space limitations do not permit a full review of the actions of the RAAS in the context of obesity and CKD. There are extensive data regarding the role of the components of the RAAS as critical regulators of systemic blood pressure, and of cardiovascular and renal homeostasis. Thus many therapeutic trials have demonstrated positive effects with pharmacological blockage of either the angiotensin-converting enzyme inhibitors or angiotensin receptor antagonists in various clinical settings including diabetic nephropathy. However, recent evidence is supportive of the concept that RAAS may act locally in a variety of tissues, including adipose tissue.43 It has now been shown that all components of the RAAS are expressed in adipose tissue and that angiotensin type 1 and type 2 receptors are present in animal and human adipocytes.43 It is possible that local production of RAAS may contribute to the development of obesity-related hypertension. The normal actions of the RAAS include renal sodium retention and aldosterone secretion, and thus preservation of blood pressure. In obesity-related hypertension, despite elevated blood pressure, RAAS activity is increased. In a study of male Sprague Dawley rats, rats were fed a high-fat diet for 11 weeks to induce obesity.44 Obese rats were compared with non-obese rats. Obese rats had higher systemic blood pressure, higher plasma angiotensinogen levels, and had twice the angiotensinogen gene expression in (local) retroperitoneal adipose tissue.44 Thus, these results suggest that adipose tissue is a source of RAAS, which may act locally as well as systemically in contributing to obesity-related hypertension. Future studies are necessary to describe the specific role of local RAAS production in obesity and its potential contribution to the etiology of CKD development and CKD progression.
Clinical studies evaluating the association between obesity, CKD development, and CKD progression
Epidemiological studies have shown consistently that in the general adult population, individuals who are overweight (BMI >25.0–29.9 kg/m2) or obese (BMI >30 kg/m2) have an increased risk of CKD development.45–54 A comprehensive meta-analysis by Wang et al51 from 2008 identified longitudinal cohort studies in adult populations which assessed the risk of CKD development in obese patients. Overall, the pooled relative risk (RR) in this paper supports the hypothesis that patients who are overweight or obese have an increased risk of developing “kidney disease”, defined as CKD, ESRD, kidney stones, and kidney cancer (renal cell carcinoma). Using normal weight as the reference standard, individuals who were overweight (RR 1.4; 95% CI 1.3–1.5; P=0.003) or obese (RR 1.83; 95% CI 1.57–2.13; P=0.001) had a significantly increased risk of developing kidney disease.51 Most of the included studies were adjusted for confounders (such as age, sex, race, smoking status, diabetes, and hypertension), and thus, the pooled RR suggests obesity acts as an independent risk factor in the epidemiology of kidney disease development.51
In considering only those studies where kidney disease was defined only as the risk of developing CKD or ESRD as renal outcomes, the results are similar. Perhaps one of the largest studies attempting to evaluate this question is by Hsu et al.48 The authors evaluated the risk of developing ESRD over 21 years of follow-up, using WHO-recommended BMI cut-points, in 320,252 adults from the United States. Their findings suggested a dose–response relationship between BMI and ESRD. Compared with normal-weight patients, in this adjusted analysis, the RR for ESRD was 1.87 (95% CI 1.64–2.14) for overweight and 3.57 (95% CI 3.05–4.18) for class I obesity, 6.12 (95% CI 4.97–7.54) for class II, and 7.07 (95% CI 5.37–9.31) for class III obesity.48
Another recent large population study of participants from Iran by Noori et al53 demonstrated similar findings to the pooled RR from the Wang et al51 review. A total of 3,107 subjects free of CKD at baseline were followed over 7 years. The outcome was development of CKD defined as eGFR <60 mL/min/1.72 m2. Compared with the referent group (BMI <22 kg/m2) patients who were overweight (BMI 27–31 kg/m2; hazard ratio (HR) 1.79; 95% CI 1.19–2.69) or obese (BMI >31 kg/m2; HR 1.57; 95% CI 1.02–2.42) had an increased risk of developing CKD. Higher BMI, especially the obese category, was associated with an increased risk of CKD.49 This study also evaluated other obesity definitions in terms of CKD risk, including abdominal waist circumference, and waist-to-hip ratio. Results for abdominal waist circumference, but not waist-to-hip ratio, were consistent with the findings as described for increased BMI and risk of CKD.49
In patients with prevalent stage 3–5 CKD, there are few studies that have investigated the impact of obesity in contributing to CKD deterioration, and the available studies are of smaller sample size.55,56 In a prospective cohort study of 125 stage 3–5 CKD patients (excluding dialysis; mean eGFR 27.4±12 mL/min/1.73 m2), we (Garland et al55) evaluated the impact of BMI on kidney function decline. We described a deleterious effect of elevated BMI on kidney function decline over 1 year. In a multivariable adjusted regression model including age, hypertension, and proteinuria, we determined that every 5 kg/m2 rise in BMI increases the 1 year risk of progressive kidney function deterioration nearly twofold (odds ratio =1.8; 95% CI 1.3–2.6; P<0.0001).55 Another study, by Othman et al56 retrospectively evaluated the impact of obesity (BMI) on CKD progression in 125 non-diabetic CKD patients (mean eGFR 44.3 mL/min/1.73 m2). The frequency of CKD progression based on eGFR fall per year (>1 mL/min/1.73 m2/year) was 62.5% in overweight and 79.5% in obese compared with 44.7% in normal-weight CKD patients (P=0.007). By multivariate regression analysis, adjusted for age, hypertension, and proteinuria, baseline BMI was also an independent predictor of CKD progression (fall in eGFR mL/min/1.73 m2/year) (model R2=0.122; P<0.001).56 Larger longitudinal studies to study the relationship between BMI and CKD progression are needed.
Clinical assessment of obesity in CKD
The optimal measure of obesity in patients who have CKD is not known. BMI is commonly evaluated in clinical practice as a method of assessing obesity; however, a criticism of its use is that elevated BMI is reflective of general adiposity but does not differentiate between elevated BMI secondary to increased muscle mass, versus adipose tissues.57 In Noori et al’s study,53 waist circumference appeared to perform the best in terms of predicting CKD risk. However, in another study, by Elsayed et al,52 evaluating 13,324 patients, waist-to-hip ratio was associated with CKD development over 9.3 years, but not BMI. While most study findings concur that increased BMI is a risk for CKD and ESRD, some studies indicate sex-specific differences. One study by Iseki et al45 of over 100,000 patients from Japan, found that elevated BMI increased the risk of ESRD over 17 years in men but not in women. In Hsu et al’s48 study from the United States, sex-specific differences were not noted. Therefore, while pooled RR ratios are supportive that elevated BMI increases the overall population risk for CKD and ESRD, ethnicity and sex may modify the direction of these associations, and future studies are necessary to explore these relationships.
Some studies have indicated that patients within the lowest BMI category (underweight) have an increased risk of kidney disease.57 Malnutrition is a feature of uremia, and a reverse epidemiology has been described, where CKD patients in the highest WHO BMI categories have been observed to have paradoxically improved survival.57,58 In Hsu et al’s48 study predicting ESRD, underweight patients did not have an increased risk for developing ESRD (RR 0.44; 95% CI 0.15–1.00). Similarly, a study by Stengel et al50 of 9,082 patients from the United States failed to demonstrate an increased risk of CKD development in underweight patients (RR 1.3; 95% CI 0.5–3.1). Because the classifications of underweight, overweight, and obesity vary across studies, findings from various studies regarding the association between underweight BMI and kidney disease may be affected, and thus more data are required.
Summary
Studies show that obesity increases the risk of CKD and ESRD in the adult general population through direct and indirect mechanisms. The impact of obesity in the pathogenesis of CKD appears to be independent of blood pressure or diabetes mellitus, the two most common causes of CKD. Adipose tissue functions as an endocrine organ, and adipokines such as adiponectin, which have anti-inflammatory and anti-atherosclerotic properties, may serve as a future potential target for obesity therapy. Most epidemiological studies have shown a consistent positive association between increased BMI and CKD and/or ESRD development. However, studies evaluating whether lifestyle modification and weight loss strategies, such as bariatric surgery, mitigate CKD development and progression are needed.
Disclosure
Dr Garland has received paid honoraria for providing continuing medical education for Amgen Canada, Eli Lilly, and Boehringer-Ingelheim. The author reports no other conflicts of interest in this work.
References
National Kidney Foundation. K/DOQI clinical practice guidelines for chronic kidney disease: evaluation, classification, and stratification. Am J Kidney Dis. 2002;39:S1–S266. | |
Kidney Disease: Improving Global Outcomes (KDIGO) CKD Work Group. KDIGO 2012 Clinical Practice Guideline for the Evaluation and Management of Chronic Kidney Disease. Kidney Int Suppl. 2013;3:1–150. | |
Levin A, Djurdjev O, Beaulieu M, Er L. Variability and risk factors for kidney disease progression and death following attainment of stage 4 CKD in a referred cohort. Am J Kidney Dis. 2008;52(4):661–671. | |
McCullough K, Sharma P, Ali T, et al. Measuring the population burden of chronic kidney disease: a systematic literature review of the estimated prevalence of impaired kidney function. Nephrol Dial Transplant. 2012;27(5):1812–1821. | |
Turin TC, Tonelli M, Manns BJ, et al. Lifetime risk of ESRD. J Am Soc Nephrol. 2012;23(9):1569–1578. | |
Boulware LE, Jaar BG, Tarver-Carr ME, et al. Screening for proteinuria in US adults: a cost-effectiveness analysis. JAMA. 2003;290:3101–3114. | |
Levey AS, Atkins R, Coresh J, et al. Chronic kidney disease as a global public health problem: approaches andinitiatives – a position statement from Kidney Disease Improving Global Outcomes. Kidney Int. 2007;72(3):247–259. | |
World Health Organization [homepage on the Internet]. Obesity and overweight. Geneva: World Health Organization; 2012. Available from: http://www.who.int/mediacentre/factsheets/fs311/en. Accessed December 19, 2013. | |
Gotay CC, Katzmarzyk PT, Janssen I, Dawson MY, Aminoltejari K, Bartley NL. Updating the Canadian obesity maps: an epidemic in progress. Can J Public Health. 2012;104(1):e64–e68. | |
Henegar JR, Bigler SA, Henegar LK, et al. Functional and structural changes in the kidney in the early stages of obesity. J Am Soc Nephrol 2001;12:1211–1217. | |
Kasiske BL, Crosson JT. Renal disease in patients with massive obesity. Arch Intern Med. 1986;146:1105–1109. | |
de Jong PE, Verhave JC, Pinto-Sietsma SJ, Hillege HL. Obesity and target organ damage: the kidney. Int J Obes Relat Metab Disord. 2002;26:S21–S24. | |
Chagnac A, Weinstein T, Korzets A, et al. Glomerular hemodynamics in severe obesity. Am J Physiol Renal Physiol. 2000;278:F817–F822. | |
Rüster C, Wolf G. Adipokines promote chronic kidney disease. Nephrol Dial Transplant. 2013;28 Suppl 4:iv8–iv14. | |
National Cholesterol Education Program (NCEP) Expert Panel on Detection, Evaluation, and Treatment of High Blood Cholesterol in Adults (Adult Treatment Panel III). Third Report of the National Cholesterol Education Program (NCEP) Expert Panel on Detection, Evaluation, and Treatment of High Blood Cholesterol in Adults (Adult Treatment Panel III) final report. Circulation. 2002;106:3143–3421. | |
Ford ES, Li C, Sattar N. Metabolic syndrome and incident diabetes: current state of the evidence. Diabetes Care. 2008;31:1898–1904. | |
Galassi A, Reynolds K, He J. Metabolic syndrome and risk of cardiovascular disease: a meta-analysis. Am J Med. 2006;119:812–819. | |
Chen J, Muntner P, Hamm LL, et al. The metabolic syndrome and chronic kidney disease in US adults. Ann Intern Med. 2004;140(3):167–174. | |
Ninomiya T, Kiyohara Y, Kubo M, et al. Metabolic syndrome and CKD in a general Japanese population: the Hisayama Study. Am J Kidney Dis. 2006;48(3):383–391. | |
Kern PA, Ranganathan S, Li C, Wood L, Ranganathan G. Adipose tissue tumor necrosis factor and interleukin-6 expression in human obesity and insulin resistance. Am J Physiol Endocrinol Metab. 2001;280(5):E745–E751. | |
Suganami T, Nishida J, Ogawa Y. A paracrine loop between adipocytes and macrophages aggravates inflammatory changes: role of free fatty acids and tumor necrosis factor alpha. Arterioscler Thromb Vasc Biol. 2005;25(10):2062–2068. | |
Manabe I. Chronic inflammation links cardiovascular, metabolic and renal diseases. Circ J. 2011;75(12):2739–2748. | |
Thomas G, Sehgal AR, Kashyap SR, Srinivas TR, Kirwan JP, Navaneethan SD. Metabolic syndrome and kidney disease: a systematic review and meta-analysis. Clin J Am Soc Nephrol. 2011;6(10):2364–2373. | |
Kadowaki T, Yamauchi T, Kubota N, Hara K, Ueki K, Tobe K. Adiponectin and adiponectin receptors in insulin resistance, diabetes, and the metabolic syndrome. J Clin Invest. 2006;116(7):1784–1792. | |
Kacso IM, Bondor CI, Kacso G. Plasma adiponectin is related to the progression of kidney disease in type 2 diabetes patients. Scand J Clin Lab Invest. 2012;72(4):333–339. | |
Zoccali C, Mallamaci F, Tripepi G, et al. Adiponectin, metabolic risk factors, and cardiovascular events among patients with end-stage renal disease. J Am Soc Nephrol. 2002;13(1):134–141. | |
Sharma K, Ramachandrarao S, Qiu G, et al. Adiponectin regulates albuminuria and podocyte function in mice. J Clin Invest. 2008;118(5):1645–1656. | |
Yilmaz MI, Saglam M, Carrero JJ, et al. Serum visfatin concentration and endothelial dysfunction in chronic kidney disease. Nephrol Dial Transplant. 2008;23(3):959–965. | |
Koshimura J, Fujita H, Narita T, et al. Urinary adiponectin excretion is increased in patients with overt diabetic nephropathy. Biochem Biophys Res Commun. 1994;316:165–169. | |
Considine RV, Sinha MK, Heiman ML, et al. Serum immunoreactive leptin concentrations in normal-weight and obese humans. N Engl J Med. 1996;334(5):292–295. | |
Adamczak M, Wiecek A. The adipose tissue as an endocrine organ. Semin Nephrol. 2013;33(1):2–13. | |
Shankar A, Syamala S, Xiao J, Muntner P. Relationship between plasma leptin level and chronic kidney disease. Int J Nephrol. 2012;2012:269532. | |
Nordfors L, Lönnqvist F, Heimbürger O, Danielsson A, Schalling M, Stenvinkel P. Low leptin gene expression and hyperleptinemia in chronic renal failure. Kidney Int. 1998;54(4):1267–1275. | |
Nasrallah MP, Ziyadeh FN. Overview of the physiology and pathophysiology of leptin with special emphasis on its role in the kidney. Semin Nephrol. 2013;33(1):54–65. | |
Tang J, Yan H, Zhuang S. Inflammation and oxidative stress in obesity-related glomerulopathy. Int J Nephrol. 2012;2012:608397. | |
Han DC, Isono M, Chen S, et al. Leptin stimulates type I collagen production in db/db mesangial cells: glucose uptakeand TGF-beta type II receptor expression. Kidney Int. 2001;59(4):1315–1323. | |
Steppan CM, Bailey ST, Bhat S, et al. The hormone resistin links obesity to diabetes. Nature. 2001;409(6818):307–312. | |
Stepien M, Stepien A, Wlazeł RN, et al. Obesity indices and adipokines in non-diabetic obese patients with early stages of chronic kidney disease. Med Sci Monit. 2013;19:1063–1072. | |
Axelsson J, Bergsten A, Qureshi AR, et al. Elevated resistin levels in chronic kidney disease are associated with decreased glomerular filtration rate and inflammation, but not with insulin resistance. Kidney Int. 2006;69(3):596–604. | |
Kielstein JT, Becker B, Graf S, Brabant G, Haller H, Fliser D. Increased resistin blood levels are not associated with insulin resistance in patients with renal disease. Am J Kidney Dis. 2003;42(1):62–66. | |
Axelsson J, Witasp A, Carrero JJ, et al. Circulating levels of visfatin/pre-B-cell colony-enhancing factor 1 in relation to genotype, GFR, body composition, and survival in patients with CKD. Am J Kidney Dis. 2007;49(2):237–244. | |
Carrero JJ, Witasp A, Stenvinkel P, et al. Visfatin is increased in chronic kidney disease patients with poor appetite and correlates negatively with fasting serum amino acids and triglyceride levels. Nephrol Dial Transplant. 2010;25(3):901–906. | |
Cassis LA, Police SB, Yiannikouris F, Thatcher SE. Local adipose tissue renin-angiotensin system. Curr Hypertens Rep. 2008;10(2):93–98. | |
Boustany CM, Bharadwaj K, Daugherty A, Brown DR, Randall DC, Cassis LA. Activation of the systemic and adipose renin-angiotensin system in rats with diet-induced obesity and hypertension. Am J Physiol Regul Integr Comp Physiol. 2004;287(4):R943–R949. | |
Iseki K, Ikemiya Y, Kinjo K, et al. Body mass index and the risk of development of end-stage renal disease in a screened cohort. Kidney Int. 2004;65:1870–1876. | |
Hallan S, de Mutsert R, Carlsen S, et al. Obesity, smoking, and physical inactivity as risk factors for CKD: are men more vulnerable? Am J Kidney Dis. 2006;47:396–405. | |
Gelber RP, Kurth T, Kausz AT, et al. Association between body mass index and CKD in apparently healthy men. Am J Kidney Dis. 2005;46:871–880. | |
Hsu CY, McCulloch CE, Iribarren C, et al. Body mass index and risk for end-stage renal disease. Ann Intern Med. 2006;144:21–28. | |
Kramer H, Luke A, Bidani A, et al. Obesity andprevalent and incident CKD: the hypertension detection and follow-up program. Am J Kidney Dis. 2005;46:587–594. | |
Stengel B, Tarrer-Carr ME, Powe NR, et al. Life style factors, obesity and the risk of chronic kidney disease. Epidemiology. 2003;14:479–487. | |
Wang Y, Chen X, Song Y, Caballero B, Cheskin LJ. Association between obesity and kidney disease: a systematic review and meta-analysis. Kidney Int. 2008;73(1):19–33. | |
Elsayed EF, Sarnak MJ, Tighiouart H, et al. Waist-to-hip ratio, body mass index, and subsequent kidney disease and death. Am J Kidney Dis. 2008;52(1):29–38. | |
Noori N, Hosseinpanah F, Nasiri AA, Azizi F. Comparison of overall obesity and abdominal adiposity in predicting chronic kidney disease incidence among adults. J Ren Nutr. 2009;19(3):228–237. | |
Fox CS, Larson MG, Leip EP, Culleton B, Wilson PW, Levy D. Predictors of new-onset kidney disease in a community-based population. JAMA. 2004;291(7):844–850. | |
Garland JS, Holden RM, Hopman WM, Gill SS, Nolan RL, Morton AR. Body mass index, coronary artery calcification, and kidney function decline in stage 3 to 5 chronic kidney disease patients. J Ren Nutr. 2013;23(1):4–11. | |
Othman M, Kawar B, El Nahas AM. Influence of obesity on progression of non-diabetic chronic kidney disease: a retrospective cohort study. Nephron Clin Pract. 2009;113(1):c16–c23. | |
Kovesdy CP, Anderson JE, Kalantar-Zadeh K. Paradoxical association between body mass index and mortality in men with CKD not yet on dialysis. Am J Kidney Dis. 2007;49(5):581–591. | |
Beddhu S. The body mass index paradox and an obesity, inflammation, and atherosclerosis syndrome in chronic kidney disease. Semin Dial. 2004;17:229–232. |
 © 2014 The Author(s). This work is published and licensed by Dove Medical Press Limited. The full terms of this license are available at https://www.dovepress.com/terms.php and incorporate the Creative Commons Attribution - Non Commercial (unported, v3.0) License.
By accessing the work you hereby accept the Terms. Non-commercial uses of the work are permitted without any further permission from Dove Medical Press Limited, provided the work is properly attributed. For permission for commercial use of this work, please see paragraphs 4.2 and 5 of our Terms.
© 2014 The Author(s). This work is published and licensed by Dove Medical Press Limited. The full terms of this license are available at https://www.dovepress.com/terms.php and incorporate the Creative Commons Attribution - Non Commercial (unported, v3.0) License.
By accessing the work you hereby accept the Terms. Non-commercial uses of the work are permitted without any further permission from Dove Medical Press Limited, provided the work is properly attributed. For permission for commercial use of this work, please see paragraphs 4.2 and 5 of our Terms.