")
Back to Journals » Therapeutics and Clinical Risk Management » Volume 12
Elevated blood plasma levels of epinephrine, norepinephrine, tyrosine hydroxylase, TGFβ1, and TNFα associated with high-altitude pulmonary edema in Indian population
Authors Pandey P, Ali Z, Mohammad G, Pasha Q
Received 21 April 2016
Accepted for publication 15 June 2016
Published 8 August 2016 Volume 2016:12 Pages 1207—1221
DOI https://doi.org/10.2147/TCRM.S111030
Checked for plagiarism Yes
Review by Single anonymous peer review
Peer reviewer comments 3
Editor who approved publication: Professor Garry Walsh
Priyanka Pandey,1,2 Zahara Ali,1,2 Ghulam Mohammad,3 MA Qadar Pasha1,2
1Functional Genomics Unit, CSIR-Institute of Genomics and Integrative Biology, Delhi, 2Department of Biotechnology, Savitribai Phule Pune University, Pune, 3Department of Medicine, SNM Hospital, Ladakh, Jammu and Kashmir, India
Abstract: Biomarkers are essential to unravel the locked pathophysiology of any disease. This study investigated the role of biomarkers and their interactions with each other and with the clinical parameters to study the physiology of high-altitude pulmonary edema (HAPE) in HAPE-patients (HAPE-p) against adapted highlanders (HLs) and healthy sojourners, HAPE-controls (HAPE-c). For this, seven circulatory biomarkers, namely, epinephrine, norepinephrine, tyrosine hydroxylase, transforming growth factor beta 1, tumor necrosis factor alpha (TNFα), platelet-derived growth factor beta beta, and C-reactive protein (CRP), were measured in blood plasma of the three study groups. All the subjects were recruited at ~3,500 m, and clinical features such as arterial oxygen saturation (SaO2), body mass index, and mean arterial pressure were measured. Increased levels of epinephrine, norepinephrine, tyrosine hydroxylase, transforming growth factor-beta 1, and TNFα were observed in HAPE-p against the healthy groups, HAPE-c, and HLs (P<0.0001). CRP levels were decreased in HAPE-p against HAPE-c and HLs (P<0.0001). There was no significant difference or very marginal difference in the levels of these biomarkers in HAPE-c and HLs (P>0.01). Correlation analysis revealed a negative correlation between epinephrine and norepinephrine (P=4.6E-06) in HAPE-p and positive correlation in HAPE-c (P=0.004) and HLs (P=9.78E-07). A positive correlation was observed between TNFα and CRP (P=0.004) in HAPE-p and a negative correlation in HAPE-c (P=4.6E-06). SaO2 correlated negatively with platelet-derived growth factor beta beta (HAPE-p; P=0.05), norepinephrine (P=0.01), and TNFα (P=0.005) and positively with CRP (HAPE-c; P=0.02) and norepinephrine (HLs; P=0.04). Body mass index correlated negatively with epinephrine (HAPE-p; P=0.001) and positively with norepinephrine and tyrosine hydroxylase in HAPE-c (P<0.05). Mean arterial pressure correlated positively with TNFα in HAPE-p and norepinephrine in HLs (P<0.05). Receiver operating characteristic curve analysis yielded a positive predictive value for these biomarkers with HAPE (area under the curve >0.70, P<0.05). The results clearly suggest that increased plasma levels of these circulatory biomarkers associated with HAPE.
Keywords: adaptation, biomarkers, correlation, HAPE, high-altitude, sympathetic nervous system
Introduction
Extreme environmental conditions at high altitude (HA) cause a number of disorders in sojourners, while at the same time, permanent residents of the region remain in good physical shape. In this study, our primary concern has been associated with a rare, fatal (if not treated), and morbid respiratory illness, high-altitude pulmonary edema (HAPE). HAPE occurs in unacclimatized sojourners upon rapid ascent to HA regions. It is imperative to emphasize here that only a small population of sojourners gets afflicted with the disorder, while a large fraction remain healthy. HAPE is associated with abnormal build up of fluid in lungs, leading to signs and symptoms such as dyspnea at rest, lethargy, tachycardia, and congestion.1–3 Since estimating circulatory biomarkers has always been an established mechanism to understand the pathophysiology of any disease,4,5 in this study, we have studied seven circulatory biomarkers, namely, epinephrine, norepinephrine, tyrosine hydroxylase (TH), transforming growth factor beta 1 (TGFβ1), tumor necrosis factor alpha (TNFα), platelet-derived growth factor beta beta (PDGF-ββ), and C-reactive protein (CRP). The above-mentioned seven biomarkers are known to be related to the processes of exaggerated vasoconstriction and smooth muscle proliferation that are hallmark characteristics of HAPE (Figure 1).
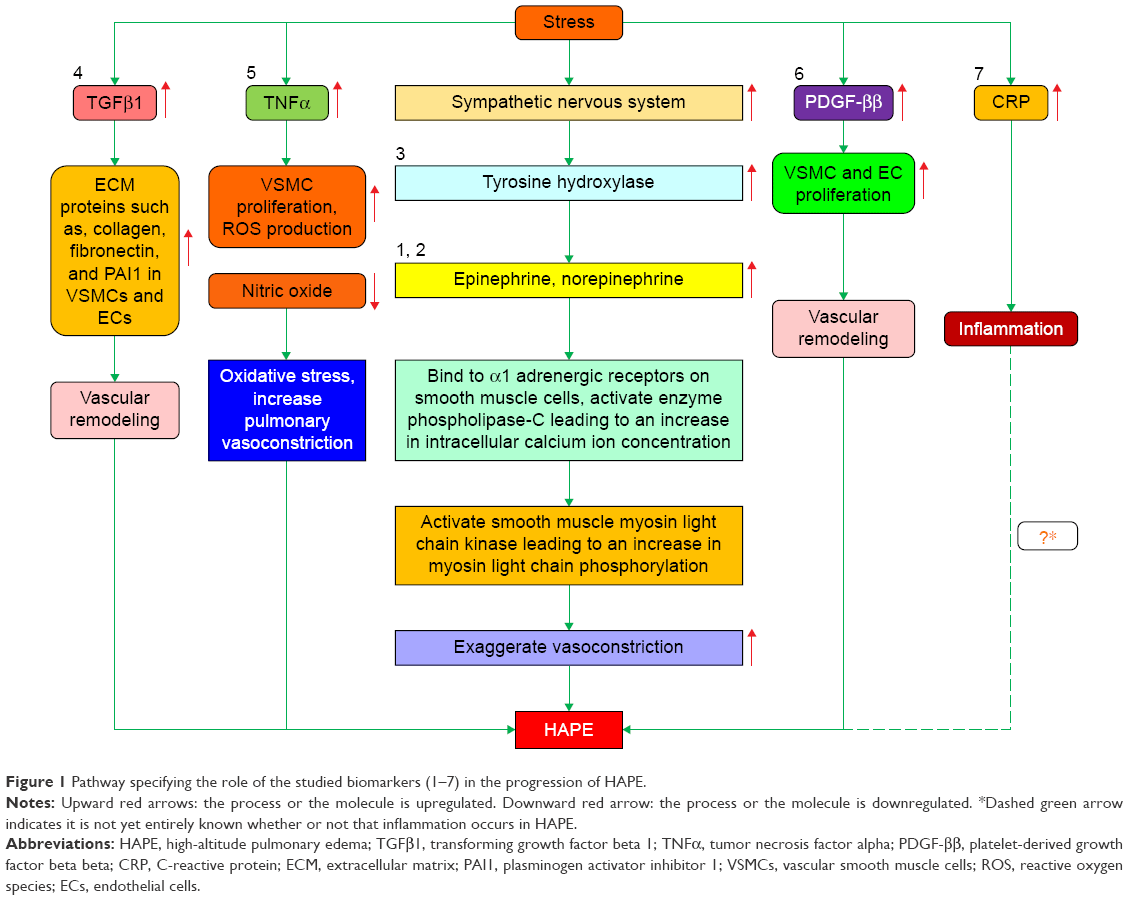 | Figure 1 Pathway specifying the role of the studied biomarkers (1–7) in the progression of HAPE. |
Hypobaric hypoxic environment at HA activates sympathetic nervous system.6–10 Stress-activated sympathetic nervous system releases epinephrine and norepinephrine through adrenal medulla via the enzyme TH. Epinephrine and norepinephrine activate Gq/11-coupled alpha 1-adrenergic receptors on the pulmonary smooth muscle cells, leading to an increase in intracellular Ca2+ concentrations (Figure 1).11–13 Increased calcium ion concentration activates smooth muscle cell-specific myosin light chain kinase, which, in turn, phosphorylates myosin light chain at serine residue 19, inducing the formation of actin–myosin cross-bridge formation, thus causing exaggerated vasoconstriction and leading to HAPE (Figure 1).14,15
Among the other molecules, TGFβ1, TNFα, PDGF-ββ, and CRP are the circulatory biomarkers that are induced under stress conditions.16–19 To the best of our knowledge, blood plasma levels of TGFβ1, TNFα, PDGF-ββ, and CRP have not been reported in such a large sample size and study module among the three study groups, namely, HAPE-patients (HAPE-p), HAPE-controls (HAPE-c), and permanent residents of HAs, that is, highlanders (HLs). TGFβ1, a regulator of collagen synthesis and vascular remodeling in fibroblasts,20–22 and PDGF-ββ, a pro-proliferative growth factor,23–25 are known to cause increased smooth muscle proliferation and thus vascular remodeling, a key process associated with HAPE (Figure 1). Since inflammation in HAPE is still a subject of contradictions, two major inflammatory mediators, that is, TNFα, a pleiotropic proinflammatory cytokine,26–28 and CRP, a proinflammatory marker,29,30 were also studied (Figure 1).
Therefore, this study aimed to determine the biochemical features associated with HAPE. For this, three-study group formula was adopted, that is, biochemical parameters measured in HAPE-p were compared with the two healthy groups. One healthy group was constituted of lowland population akin to the HAPE-p, that is, HAPE-c, and the second healthy group was constituted of the highland population, that is, permanent residents of the HA regions, the HLs. Given that individual molecule cannot run the whole disease pathophysiology, henceforth, a correlation study among the biomarkers and between various clinical parameters, such as arterial oxygen saturation (SaO2), body mass index (BMI), and mean arterial pressure (MAP), and biomarkers was also performed. The selected biomarkers were studied as all the seven were associated with the hallmark processes of HAPE, exaggerated vasoconstriction and smooth muscle cell proliferation, and their role in the physiology of HAPE per se has not been studied in great details (Figure 1).
Materials and methods
Ethics statement
The study protocol was approved by the human ethical committees of both the CSIR-Institute of Genomics and Integrative Biology, Delhi, and the Sonam Norboo Memorial Hospital, Leh, Ladakh. All the subjects were recruited by Sonam Norboo Memorial Hospital, Leh, Ladakh. Written informed consent was obtained from each subject for participation in the study.
Study groups
The study comprises three well-defined groups: 1) HAPE-p: sojourners who acquired HAPE upon ascent to HA (~3,500 m) on first exposure, 2) HAPE-c: sojourners who did not acquire HAPE upon ascent to HA (~3,500 m) under similar conditions as experienced by HAPE-p, 3) HLs: healthy natives of the HA region, that is, residing for generations at HA. Whole sample collection was performed in Leh, Ladakh (HA), and experimental analysis was performed in our base laboratory at Delhi.
The number of subjects incorporated per group was varied owing to the difference in timing and volume of samples being collected and simultaneous consumption in various assays. The actual number of samples incorporated per group has been mentioned in Table 1.
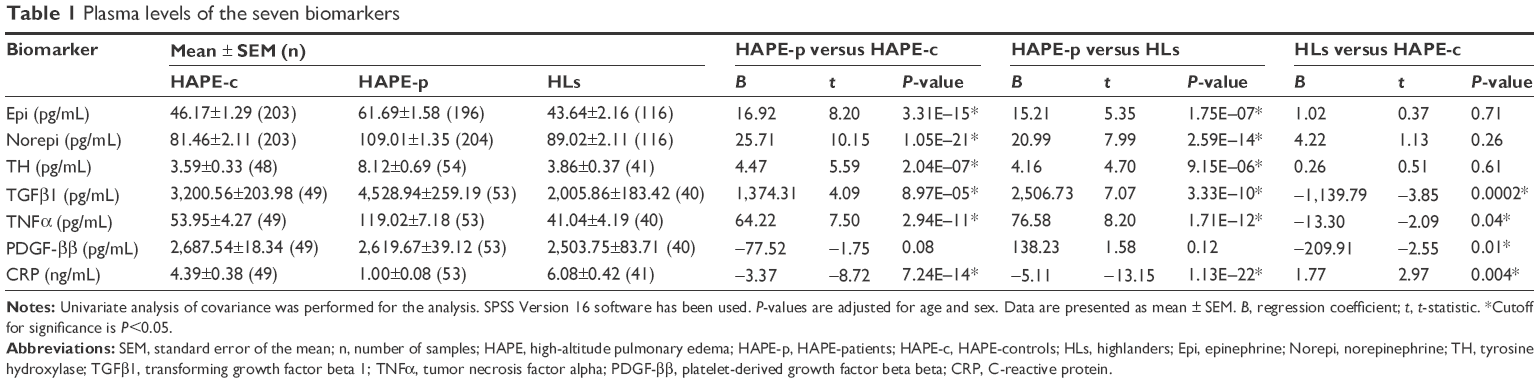 | Table 1 Plasma levels of the seven biomarkers |
Selection criteria
1) A detailed medical examination was performed, and the clinical findings that are mandatory for HAPE were recorded in an exhaustive questionnaire that was administered to the participants. The diagnosis of HAPE was based on chest radiographic infiltrates being consistent with pulmonary edema. The other clinical symptoms included hypoxemia, cough, and dyspnea at rest, breathlessness, presence of pulmonary rales, absence of any infection, reduced exercise performance, and cyanosis. The clinical parameters, for example, age, sex, BMI, blood pressure, and SaO2, were also measured. Lake Louise scoring was applied to rule out any symptoms of acute mountain sickness among HAPE-p and HAPE-c. 2) HAPE-p and HAPE-c were ethnically matched. 3) Both the HAPE-c and the HLs were declared healthy and fit, devoid of any disorder. 4) All the study subjects are permanent residents of India. 5) Only subjects within 15–50 years of age were recruited for the study. Of note, HAPE-p were the individuals who had developed HAPE upon their first visit to the HA region.
Sample collection
Ten milliliters of venous blood was drawn in acid–citrate–dextrose anticoagulant tubes (~3,500 m) with subjects in supine position. The plasma was collected after centrifuging the tubes at 1,500 rpm for 5 minutes and was stored at −80°C until analysis. Patient’s blood was collected once HAPE was diagnosed but prior to the beginning of any treatment. Blood from the subjects of the two healthy groups, that is, HAPE-c and HLs, was drawn following overnight fasting. The samples were collected, aliquoted, and preserved at −80°C over a period of years. The experiments and the subsequent analysis were performed in the year 2014. The subjects ascended from the base (Delhi ~200 m) to the HA region (Leh ~3,500 m) by air in an airplane. HAPE was diagnosed in the subjects within 1 week of their arrival at the HA region.
Biomarker estimation
Commercially available enzyme-linked immunosorbent assay kits were used to measure the blood plasma epinephrine (BA E-5100; LDN, Nordhorn, Germany), norepinephrine (BA E-5200; LDN), TH (E91438Hu; Uscn Life Science Inc., Houston, TX, USA), TGFβ1 (E90124Hu; Uscn Life Science Inc.), TNFα (E90133Hu; Uscn Life Science Inc.), PDGF-ββ (E90633Hu; Uscn Life Science Inc.), and CRP (E90821Hu; Uscn Life Science Inc.). The measurements were taken at appropriate wavelengths on a Benchmark Plus Microplate Spectrophotometer System (Bio-Rad Laboratories Inc., Hercules, CA, USA). Manufacturer’s protocol was adhered for the estimations.
Statistical analysis
Biomarker levels
All the data were expressed as mean ± standard error of the mean. The levels of the biomarkers were analyzed using the statistical regression model, univariate analysis of covariance on SPSS 16.0 software (SPSS Inc., Chicago, IL, USA). P<0.05 was considered statistically significant. P-values were adjusted for age and sex as confounding factors to nullify their effects. HAPE-c were the reference group in HAPE-p versus HAPE-c and HLs versus HAPE-c analysis. HLs were the reference group in HAPE-p versus HLs analysis.
Correlation analysis
A partial correlation model was fitted for the correlation analysis between 1) the studied biomarkers, 2) SaO2 and biomarkers, 3) BMI and biomarkers, and 4) MAP and biomarkers. Whole correlation analysis was performed on SPSS 16.0 software. All the graphs were constructed using MS excel. A P-value of <0.05 was considered statistically significant for biomarker evaluation and correlation analysis between 1) SaO2 and biomarkers, 2) BMI and biomarkers, and 3) MAP and biomarkers. Since the sample size overlapping per group for inter-biomarker correlation analysis was relatively small, in order to keep the consistency, coherency, and stringency of the results, the statistical outcomes/results were corrected for multiple comparisons using Bonferroni test leading to drop in significance cutoff to 0.006–0.01 from 0.05. As the total number of biomarkers studied is seven, 0.05/7=0.007–0.01 is the new cutoff. This has reduced the chances of any false-positive outcome being incorporated in the results. A two-tailed P-value of <0.01 was considered statistically significant for inter-biomarker correlations in Table 2. All the P-values were adjusted for age and sex as confounders to nullify their effects.
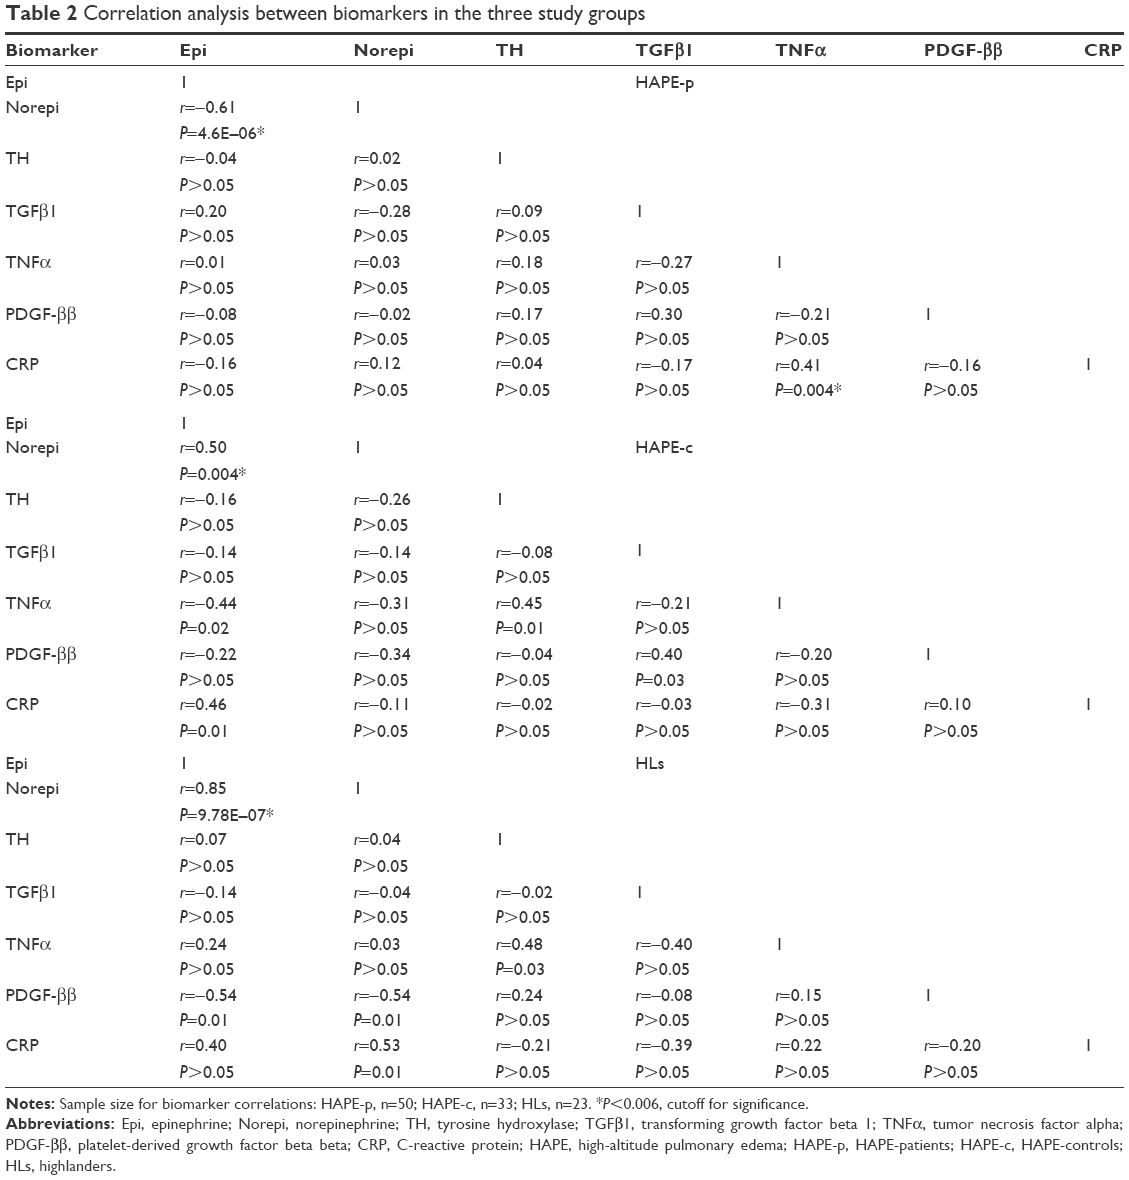 | Table 2 Correlation analysis between biomarkers in the three study groups |
Receiver operating characteristic curve
Receiver operating characteristic (ROC) curve analysis was performed on biomarker levels using SPSS 16.0 software. P<0.05 was considered statistically significant. Area under the curve (AUC) >0.70 was considered a positive test for prediction value of a biomarker. Distribution assumption was nonparametric.
Results
Clinical characteristics
The clinical characteristics of the three study groups are summarized in Table 3. Arterial oxygen saturation (SaO2, 69.95%) was significantly lower (P<0.0001) in HAPE-p compared to the levels in the other two healthy control groups, that is, HAPE-c (88.84%) and HLs (86.46%). Furthermore, HLs had comparatively lower SaO2 levels than HAPE-c. MAP was similar between HAPE-p and HAPE-c (P=0.41), but it was elevated in HAPE-p and HAPE-c when compared to HLs, respectively (P<0.0001). BMI was significantly higher in HAPE-p compared to the two healthy control groups, HAPE-c and HLs (P≤0.01).
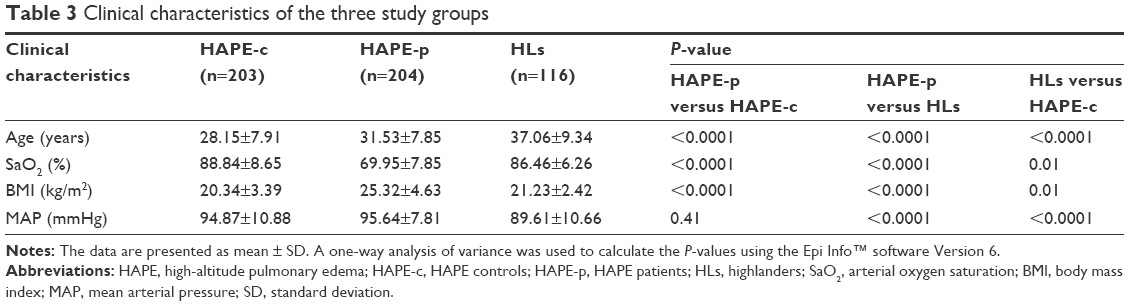 | Table 3 Clinical characteristics of the three study groups |
Biomarker evaluation
Blood plasma levels of epinephrine, norepinephrine, TH, TGFβ1, and TNFα were observed to be significantly increased in HAPE-p when compared with both the healthy groups, that is, HAPE-c and HLs (P<0.0001; Table 1). Blood plasma levels of CRP were significantly decreased in HAPE-p against HAPE-c (P=7.24E-14; Table 1) and HLs (1.13E-22; Table 1). The PDGF-ββ levels did not differ in HAPE-p when compared with the two healthy groups, that is, HAPE-c and HLs (P>0.01; Table 1). In HLs, there was no difference in the levels of epinephrine, norepinephrine, and TH against HAPE-c (P>0.05), while there was a marginally significant difference in the levels of TGFβ1 (P=0.0002), TNFα (P=0.04), PDGF-ββ (P=0.01), and CRP (P=0.004) against HAPE-c (Table 1).
Inter-biomarker correlations
In HAPE-p, a negative correlation between epinephrine and norepinephrine (r=−0.61, P=4.6E-06; Table 2) was observed, while a positive correlation was observed between epinephrine and norepinephrine in HAPE-c (r=0.50, P=0.004; Table 2) and HLs (r=0.85, P=9.78E-07; Table 2). A positive correlation was also observed between TNFα and CRP (r=0.41, P=0.004; Table 2) in HAPE-p, but the same was not significant in any of the other healthy groups, HAPE-c (r=−0.31, P>0.05; Table 2) and HLs (r=0.22, P>0.05; Table 2).
Correlations between arterial oxygen saturation (SaO2) and biomarkers
In HAPE-p, no correlation was observed between the studied biomarkers and SaO2 (Figure 2). In HAPE-c, a negative correlation was observed between SaO2 and norepinephrine (r=−0.18, P=0.01; Figure 2B) and SaO2 and TNFα (r=−0.41, P=0.005; Figure 2E). In contrast, a positive correlation was observed between SaO2 and CRP (r=0.34, P=0.02; Figure 2G). In HLs, a positive correlation was observed between SaO2 and norepinephrine (r=0.20, P=0.04; Figure 2B).
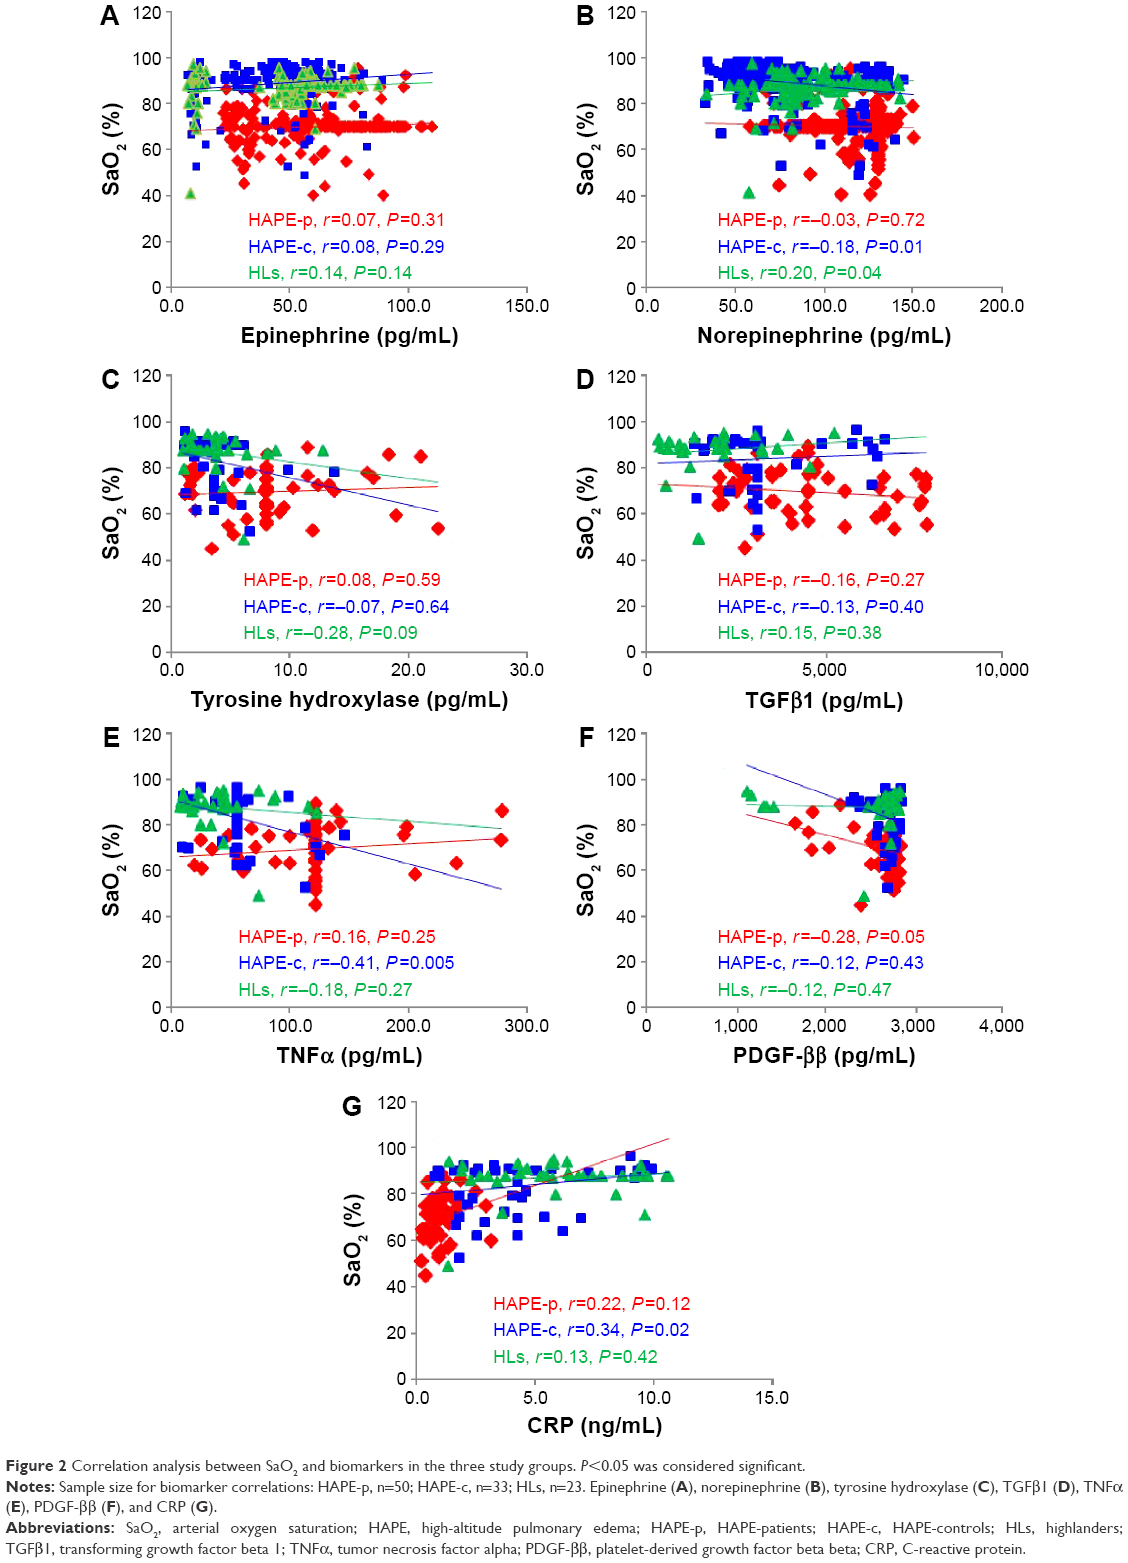 | Figure 2 Correlation analysis between SaO2 and biomarkers in the three study groups. P<0.05 was considered significant. |
Correlations between BMI and biomarkers
In HAPE-p, a negative correlation was observed between epinephrine and BMI (r=−0.24, P=0.001; Figure 3A), while a positive correlation was observed between norepinephrine and BMI (r=0.16, P=0.03; Figure 3B). In HAPE-c, a positive correlation was observed between BMI and norepinephrine (r=0.22, P=0.002; Figure 3B) and BMI and TH (r=0.34, P=0.02; Figure 3C). In HLs, no correlation was observed between the studied biomarkers and BMI (Figure 3).
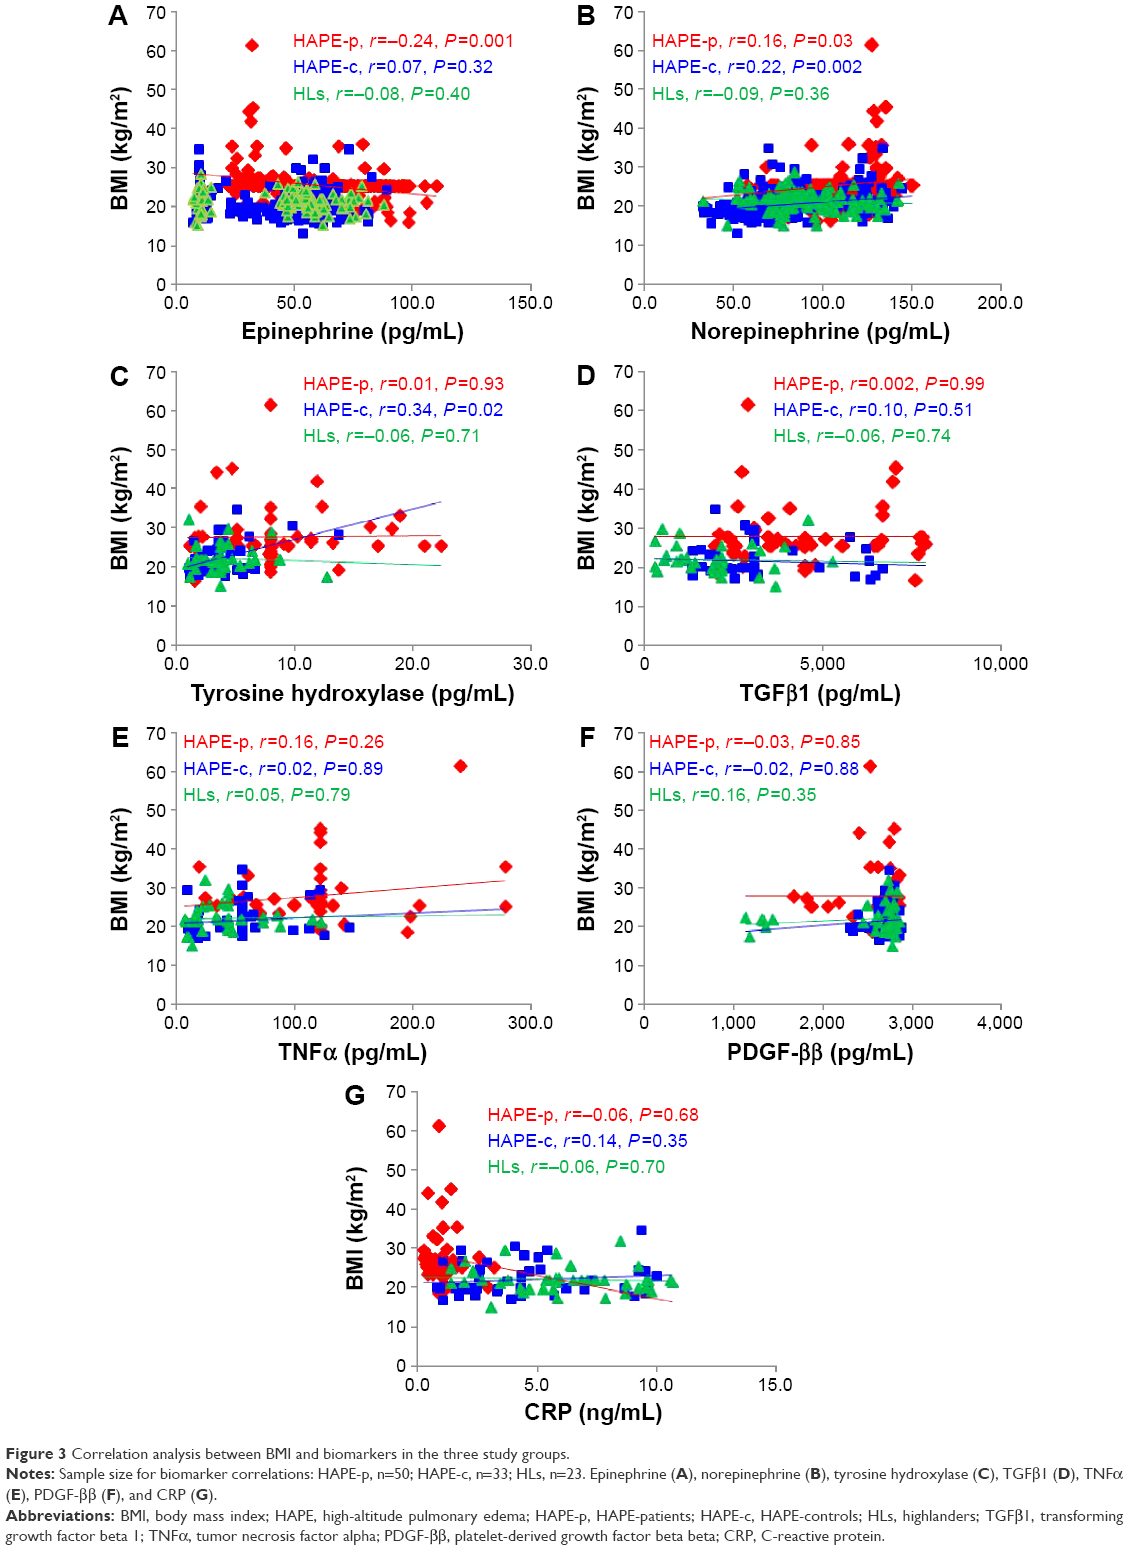 | Figure 3 Correlation analysis between BMI and biomarkers in the three study groups. |
Correlations between MAP and biomarkers
In HAPE-p, a significant positive correlation was observed between TNFα and MAP (r=0.33, P=0.02; Figure 4E). In HAPE-c, no correlation was observed between the studied biomarkers and MAP (Figure 4). In HLs, a significant positive correlation was observed between norepinephrine and MAP (r=0.20, P=0.03; Figure 4B).
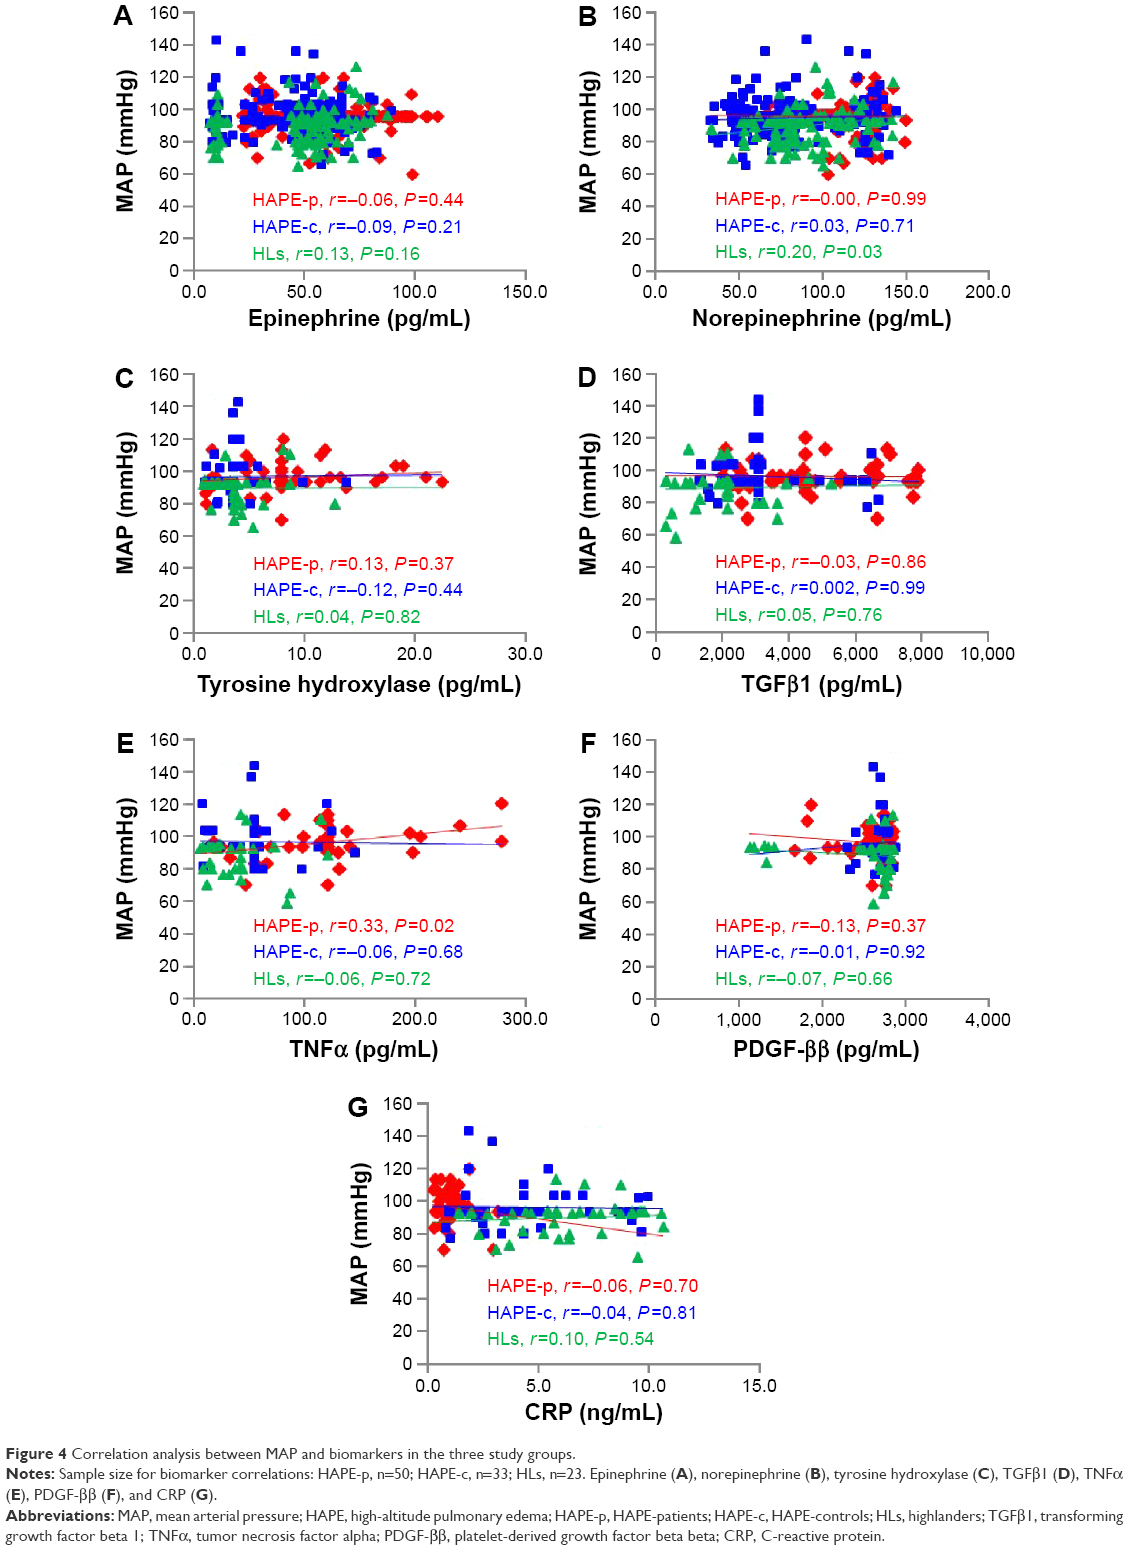 | Figure 4 Correlation analysis between MAP and biomarkers in the three study groups. |
Predictive value of biomarkers
ROC curve analyses using binary logistic regression model yielded epinephrine, norepinephrine, TH, TGFβ1, TNFα, and CRP as predictive/potential biomarkers for HAPE. In HAPE-p versus HAPE-c, AUC for the studied biomarkers was as follows: epinephrine (0.70, 95% CI =0.65–0.75, P=3.9E-12), norepinephrine (0.76, 95% CI =0.72–0.81, P=3.0E-20), TH (0.79, 95% CI =0.70–0.89, P=3.1E-07), TGFβ1 (0.71, 95% CI =0.61–0.81, P=0.0003), TNFα (0.88, 95% CI =0.80–0.95, P=4.3E-12), and CRP (0.94, 95% CI =0.89–0.98, P=3.2E-14) (Figure 5). In HAPE-p versus HLs, AUC for the studied biomarkers was as follows: epinephrine (0.71, 95% CI =0.65–0.76, P=1.2E-09), norepinephrine (0.75, 95% CI =0.69–0.81, P=1.0E-13), TH (0.77, 95% CI =0.66–0.87, P=0.00001), TGFβ1 (0.88, 95% CI =0.82–0.95, P=2.7E-10), TNFα (0.91, 95% CI =0.85–0.98, P=1.3E-11), and CRP (0.99, 95% CI =0.97–1.00, P=9.0E-16) (Figure 6). The AUC for PDGF-ββ was <0.70 in both HAPE-p versus HAPE-c and HAPE-p versus HLs.
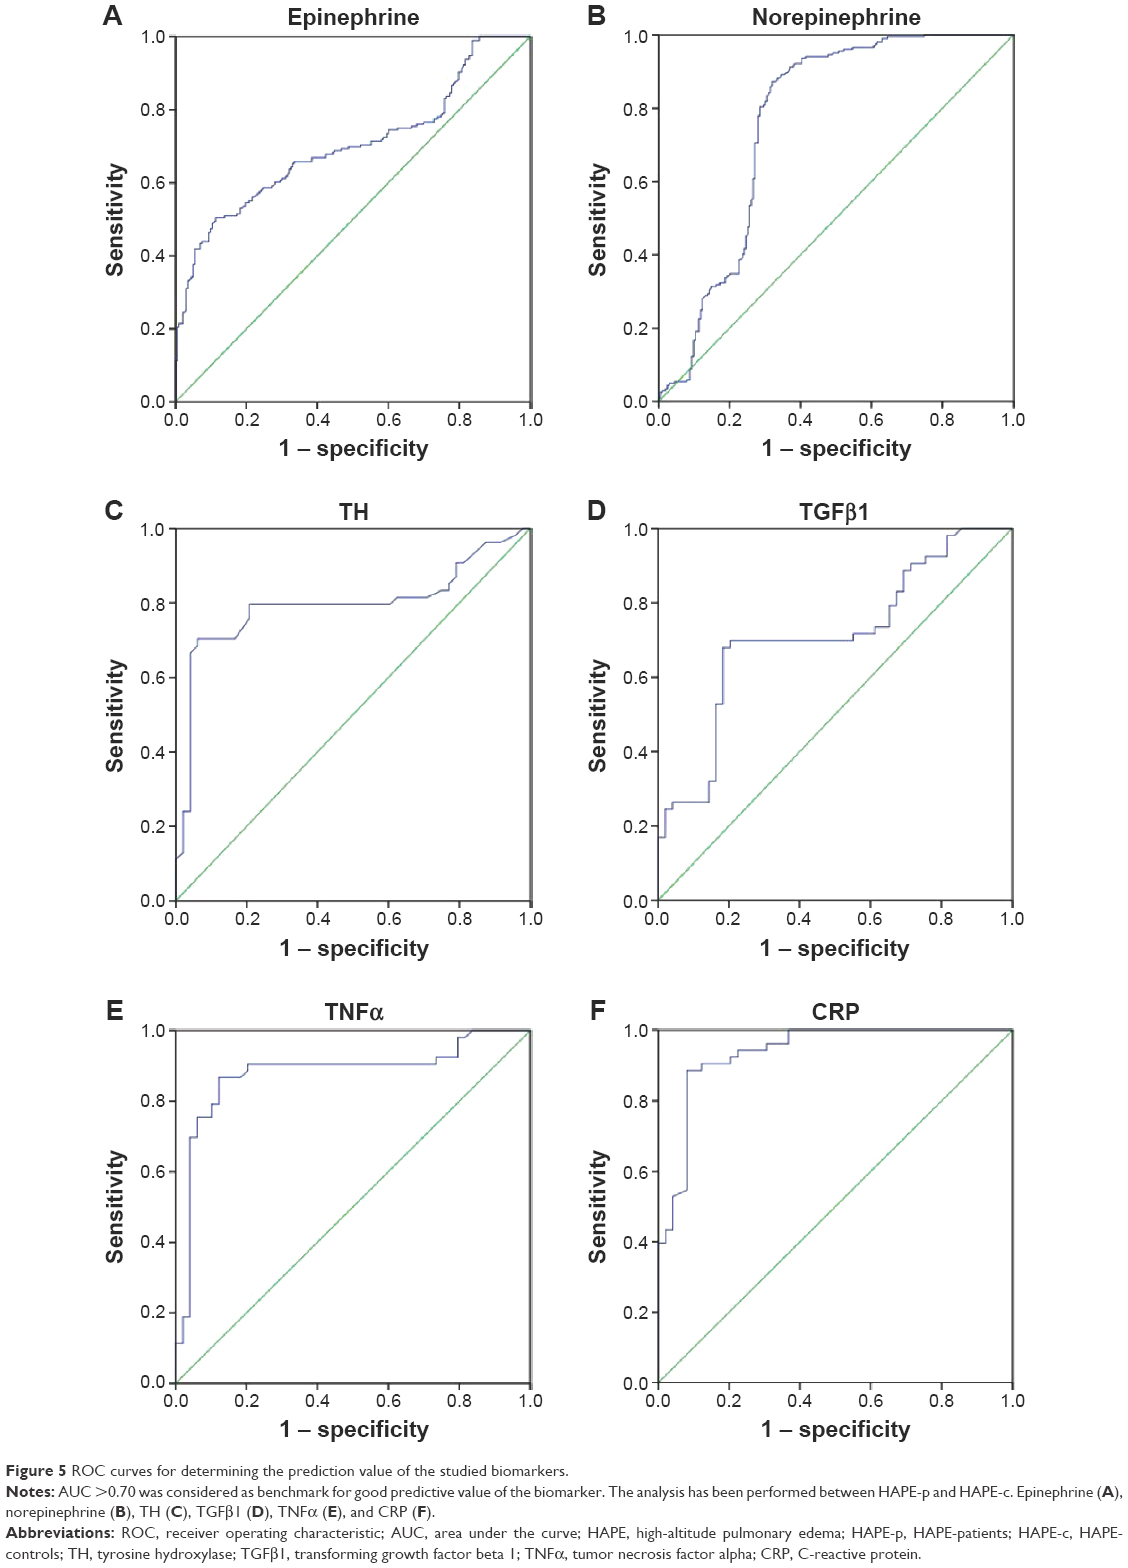 | Figure 5 ROC curves for determining the prediction value of the studied biomarkers. |
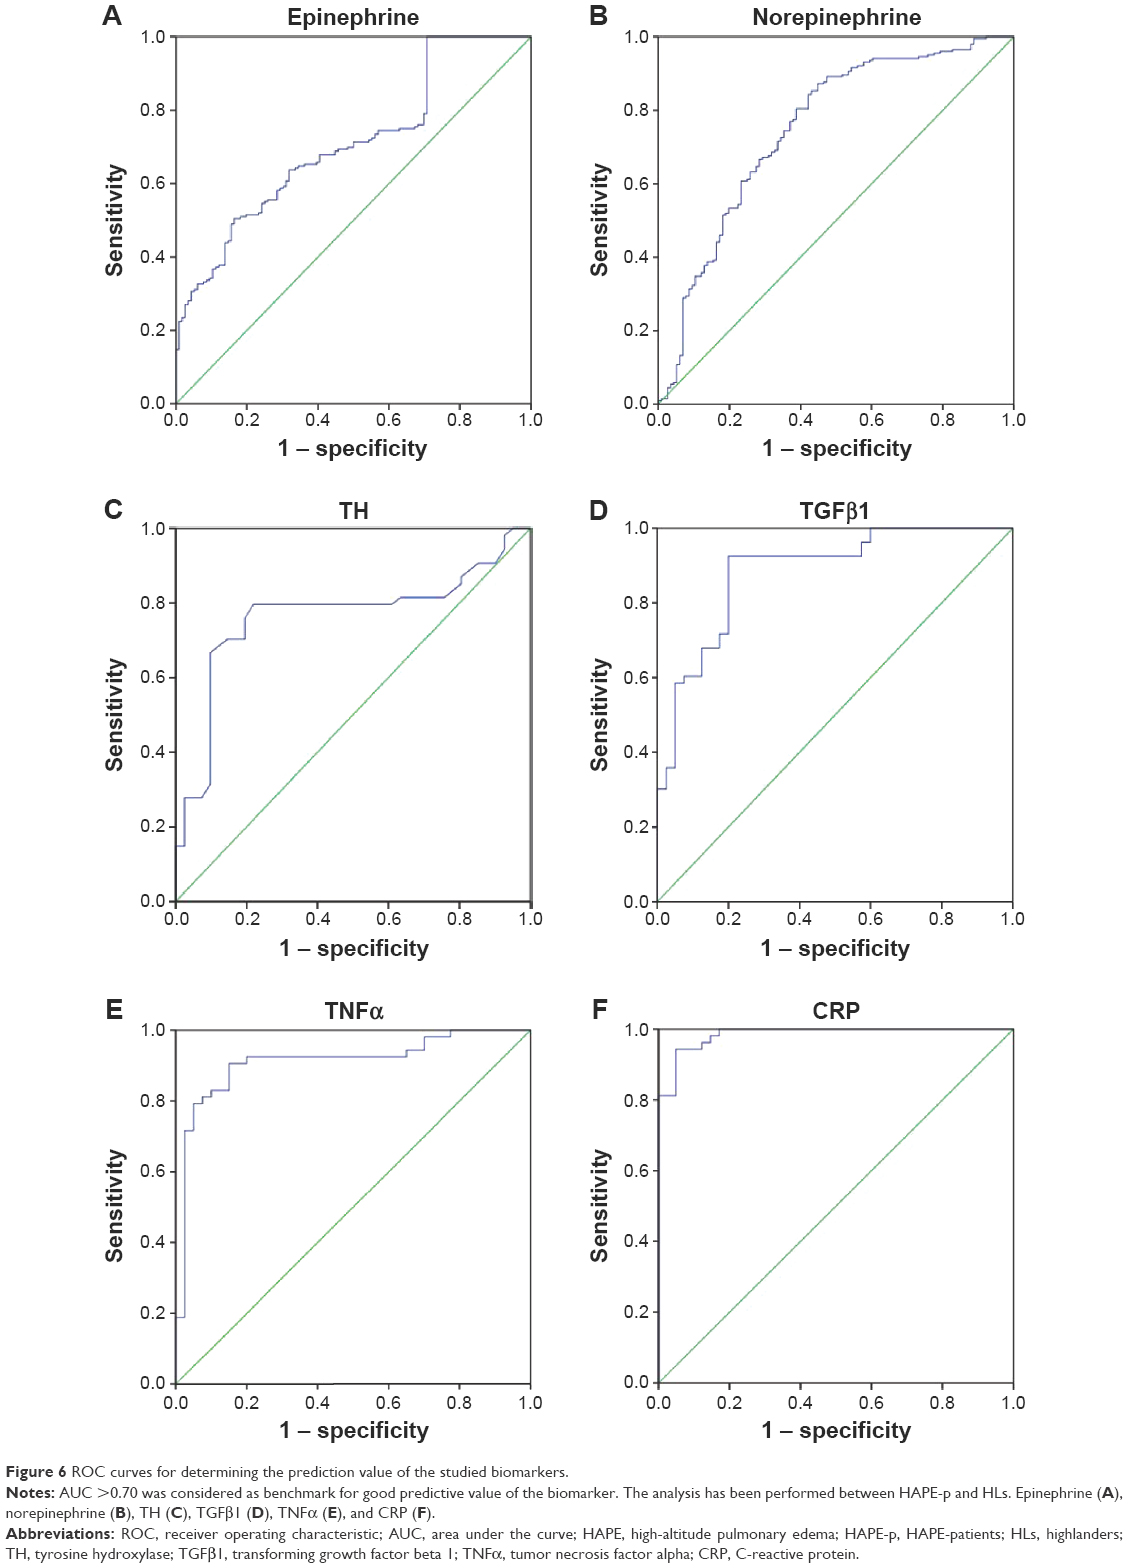 | Figure 6 ROC curves for determining the prediction value of the studied biomarkers. |
Discussion
A biomarker is a measurable indicator of any biological state or condition. This study has provided an understanding of the biochemical parameters under the stressful environment of hypobaric hypoxia at HA in HAPE subjects. To the best of our knowledge, this study is first of its kind with these molecules being studied in the three study groups. We do admit that more functional studies need to be done with higher number of samples to achieve more meaningful findings. But ours is a preliminary study, and we have made an effort to provide a glimpse of altered biochemical parameters in HAPE and tried to deduce the same and associate with biological findings.
Evaluation of clinical characteristics among the three groups revealed decreased SaO2 (<80%) and increased MAP (>95 mmHg) in HAPE-p. In contrast, the two healthy control groups, HAPE-c and HLs, had SaO2 (>85%) and MAP (<95 mmHg). Decrease in SaO2 <80% leads to hypoxemia that in turn impairs normal functioning of vital organs such as lungs, heart, brain, and kidneys.31 Moreover, MAP is a measure of systemic vascular resistance.32 The findings suggest that hypoxemia and increased vascular resistance in HAPE-p lead to lung dysfunction and exaggerated vasoconstriction, a hallmark of HAPE.1–3 The lower SaO2 in HLs (86.46%) against lowland control HAPE-c (88.84%) suggested that the native population was under stress. However, despite this stress, HLs do not suffer from any disorder, indicating that the population is adapted to the environment of HA; the results are in concordance with the earlier findings on adaptation in HLs.33,34
Adrenomedullary hormones, epinephrine and norepinephrine, are the products of activated sympathetic nervous system,35 and TH is a rate-limiting enzyme in the synthesis of epinephrine and norepinephrine.36 Significantly elevated levels of epinephrine and norepinephrine and TH in HAPE-p specified an increase in sympathetic nervous system activity in HAPE. Increased TH levels in HAPE-p also suggested a higher formation of these catecholamines in HAPE. The levels of epinephrine, norepinephrine, and TH in the HLs were less than those in the HAPE-p, suggesting that an increase in sympathetic nervous system activity is critical for determining an individual’s predisposition to HAPE. Epinephrine induces pulmonary edema;37,38 its elevated levels in HAPE again confirm this fact.
TGFβ1, a regulator of collagen deposition and other extracellular matrix proteins, such as fibronectin and plasminogen activator inhibitor 1, in vascular smooth muscle and endothelial cells lining the blood vessel, was observed to be increased in HAPE-p against the two healthy control groups.20–22,39 Increased deposition of collagen and other extracellular matrix proteins leads to the increased airway fibrosis or vascular remodeling, further decreasing the pulmonary capacity, a hallmark of HAPE.1–3,20–22,40 In addition, TNFα is a pleiotropic proinflammatory cytokine that is known to induce vascular smooth muscle cell proliferation and reactive oxygen species production leading to oxidative stress, a feature commonly associated with HAPE.26–28 Less or nonsignificant P-values between HAPE-c and HLs demonstrated that even though HLs and HAPE-c had small differences in the levels of these circulatory biomarkers, these levels were too close to protect against HAPE. In this study, stress-activated inflammatory marker, CRP, was observed to be protective against HAPE as the CRP levels were significantly reduced in HAPE-p against the two healthy groups, HAPE-c and HLs. The results were in sharp contrast to the initial hypothesis and earlier studies related to the CRP levels under HA exposure.41,42 More studies are needed in this direction with verification in larger sample size.
Correlation analysis is an important tool to understand the behavior of biomarkers with respect to one another. Thus, in this study, inter-biomarker correlations were performed along with clinical parameter–biomarker correlation to elucidate the effect of biomarkers on each other and also of clinical parameters such as SaO2 (arterial oxygen saturation), BMI, and MAP on biomarkers or vice versa. One of the limitations of our study has been less number of overlapping samples available for inter-biomarker correlation studies, but we had kept rigorous statistical cutoffs to deduce the current findings.
A negative correlation between epinephrine and norepinephrine in HAPE-p is evident from the fact that norepinephrine is a major binder for alpha 1-adrenergic receptors, so much of it is binding to the receptors and thus less is available in case of HAPE-p to be converted to epinephrine.35 Whereas in HAPE-c and HLs, the correlation was positive, this could be due to the normal functioning of the pathway (norepinephrine getting converted to epinephrine smoothly) in the two healthy control groups. In addition, a positive correlation between TNFα and CRP in HAPE-p could be due to the fact that CRP formation is enhanced in the presence of TNFα.43 With our results, we were not able to deduce much about the phenomenon of inflammation in HAPE. As both anti-inflammatory TGFβ1 and proinflammatory TNFα were observed to be increased in HAPE-p, the acute marker of inflammation, CRP, was observed to be decreased.
A normal response of body to hypobaric hypoxic conditions of HA is hypoxic pulmonary vasoconstriction that increases the amount of high oxygen blood redirected to lungs. In HLs, a significant positive correlation between SaO2 and norepinephrine was observed, indicating that increased norepinephrine in the permanent residents might be involved in increasing arterial oxygen saturation. But an inverse correlation between norepinephrine and SaO2, TNFα and SaO2, and PDGF-ββ and SaO2 in lowlanders, that is, HAPE-c and HAPE-p, signified that these stress-activated moieties are involved in causing exaggerated vasoconstriction that leads to decreased arterial oxygen saturation due to less amount of oxygen being allowed to stay in the lung vascular beds. CRP was observed to have a positive correlation with SaO2, again confirming its protective nature in HAPE.
Body fat is a major determinant of sympathetic nervous system activity.44 A positive correlation between norepinephrine and TH with BMI in the lowlanders suggested that high body weight might be a factor associated with increased risk of HAPE. Epinephrine levels were observed to be negatively correlated with BMI indicating that fatty acid oxidation, that is, the process of energy metabolism might be altered in HAPE, leading to weight gain in HAPE-p. The results of this study were in concert with the previous findings by Sharabi et al.45 In HLs, we did not observe any biomarker–BMI correlation, again suggesting the population being adapted to HA.
TNFα causes vasoconstriction by decreasing the generation of critical vasodilator nitric oxide46 and increasing the secondary release of vasoconstrictor endothelin-1.47 Decreased nitric oxide increases systemic vascular resistance,48,49 and in our study, we have found MAP, a measure of systemic vascular resistance and cardiac output, to be positively correlating with TNFα. The finding indicates that the phenomenon of exaggerated vasoconstriction is prevalent in HAPE-p, and TNFα might be one of the markers associated with the process.
ROC curve analysis is an important graphical measure to assess sensitivity and specificity of a prediction deduced via a statistical model.50 ROC curve analysis on the seven studied biomarkers yielded six biomarkers, namely, epinephrine, norepinephrine, TH, TGFβ1, TNFα, and CRP, showing good prediction value for HAPE with AUC >0.70. This finding supported our results that these biomarkers are associated with HAPE and could prove as potential predictive biomarkers. Nonetheless, we admit that verification in larger sample size is needed.
Conclusion
Among the seven studied biomarkers, six biomarkers, epinephrine, norepinephrine, TH, TGFβ1, TNFα, and CRP, could serve as plausible candidates for therapeutic interventions in HAPE. Nevertheless, we admit that more studies are needed in this field pertaining to these parameters with larger sample sizes.
Acknowledgments
The authors thank the Director, CSIR-Institute of Genomics and Integrative Biology, Delhi, for providing necessary facilities and constant encouragement; Council of Scientific and Industrial Research (CSIR; www.csir.res.in/) for financially supporting under the projects (MLP1401 and BSC0123); medical staff at SNM Hospital, Leh, Ladakh, Jammu and Kashmir, for providing precious study samples; volunteers for participating in the study; and University Grants Commission (UGC; http://www.ugc.ac.in/) for fellowship to PP. The funders had no role in study design, data collection and analysis, decision to publish, or preparation of the manuscript.
Author contributions
All authors contributed toward data analysis, drafting and critically revising the paper, gave final approval of the version to be published, and agree to be accountable for all aspects of the work.
Disclosure
The authors report no conflicts of interest in this work.
References
Basnyat B, Murdoch DR. High-altitude illness. Lancet. 2003;361(9373):1967–1974. | ||
Gallagher SA, Hackett PH. High-altitude illness. Emerg Med Clin North Am. 2004;22(2):329–355. | ||
Pandey P, Pasha MAQ. Oxidative stress at high altitude: genotype-phenotype correlations. Adv Genomics Genet. 2014;4:29–43. | ||
Biomarkers Definitions Working Group. Biomarkers and surrogate endpoints: preferred definitions and conceptual framework. Clin Pharmacol Ther. 2001;69(3):89–95. | ||
Strimbu K, Tavel JA. What are biomarkers? Curr Opin HIV AIDS. 2010;5(6):463–466. | ||
Hainsworth R, Drinkhill MJ, Rivera-Chira M. The autonomic nervous system at high altitude. Clin Auton Res. 2007;17(1):13–19. | ||
Hansen J, Sander M. Sympathetic neural overactivity in healthy humans after prolonged exposure to hypobaric hypoxia. J Physiol. 2003;546(pt 3):921–929. | ||
Duplain H, Vollenweider L, Delabays A, Nicod P, Bärtsch P, Scherrer U. Augmented sympathetic activation during short-term hypoxia and high-altitude exposure in subjects susceptible to high-altitude pulmonary edema. Circulation. 1999;99(13):1713–1718. | ||
Mazzuero G. Altitude and the autonomic nervous system. Ital Heart J Suppl. 2001;2(8):845–849. | ||
Cornolo J, Mollard P, Brugniaux JV, Robach P, Richalet JP. Autonomic control of the cardiovascular system during acclimatization to high altitude: effects of sildenafil. J Appl Physiol (1985). 2004;97(3):935–940. | ||
Shaul PW, Magness RR, Muntz KH, DeBeltz D, Buja LM. Alpha 1-adrenergic receptors in pulmonary and systemic vascular smooth muscle. Alterations with development and pregnancy. Circ Res. 1990;67(5):1193–1200. | ||
Salvi SS. Alpha1-adrenergic hypothesis for pulmonary hypertension. Chest. 1999;115(6):1708–1719. | ||
Piascik MT, Perez DM. Alpha1-adrenergic receptors: new insights and directions. J Pharmacol Exp Ther. 2001;298(2):403–410. | ||
Walsh MP. Calmodulin and the regulation of smooth muscle contraction. Mol Cell Biochem. 1994;135(1):21–41. | ||
Takashima S. Phosphorylation of myosin regulatory light chain by myosin light chain kinase, and muscle contraction. Circ J. 2009;73(2):208–213. | ||
Stenmark KR, Fagan KA, Frid MG. Hypoxia-induced pulmonary vascular remodeling: cellular and molecular mechanisms. Circ Res. 2006;99(7):675–691. | ||
Pepys MB, Hirschfield GM. C-reactive protein: a critical update. J Clin Invest. 2003;111(12):1805–1812. | ||
Hempel SL, Monick MM, Hunninghake GW. Effect of hypoxia on release of IL-1 and TNF by human alveolar macrophages. Am J Respir Cell Mol Biol. 1996;14(2):170–176. | ||
Schultz K, Fanburg BL, Beasley D. Hypoxia and hypoxia-inducible factor-1α promote growth factor-induced proliferation of human vascular smooth muscle cells. Am J Physiol Heart Circ Physiol. 2005;290(6):H2528–H2534. | ||
Birukova AA, Birukov KG, Adyshev D, et al. Involvement of microtubules and Rho pathway in TGF-beta1-induced lung vascular barrier dysfunction. J Cell Physiol. 2005;204(3):934–947. | ||
Clements RT, Minnear FL, Singer HA, Keller RS, Vincent PA. RhoA and Rho-kinase dependent and independent signals mediate TGF-beta-induced pulmonary endothelial cytoskeletal reorganization and permeability. Am J Physiol Lung Cell Mol Physiol. 2005;288(2):L294–L306. | ||
Shi-Wen X, Rodríguez-Pascual F, Lamas S, et al. Constitutive ALK5-independent c-Jun N-terminal kinase activation contributes to endothelin-1 overexpression in pulmonary fibrosis: evidence of an autocrine endothelin loop operating through the endothelin A and B receptors. Mol Cell Biol. 2006;26(14):5518–5527. | ||
Kamiyama M, Utsunomiya K, Taniguchi K, et al. Contribution of Rho A and Rho kinase to platelet-derived growth factor-BB-induced proliferation of vascular smooth muscle cells. J Atheroscler Thromb. 2003;10(2):117–123. | ||
Zhan Y, Kim S, Izumi Y, et al. Role of JNK, p38, and ERK in platelet-derived growth factor-induced vascular proliferation, migration, and gene expression. Arterioscler Thromb Vasc Biol. 2003;23(5):795–801. | ||
Amagasaki K, Kaneto H, Heldin CH, Lennartsson J. c-Jun N-terminal kinase is necessary for platelet-derived growth factor-mediated chemotaxis in primary fibroblasts. J Biol Chem. 2006;281(31):22173–22179. | ||
Mong PY, Petrulio C, Kaufman HL, Wang Q. Activation of Rho kinase by TNF-alpha is required for JNK activation in human pulmonary microvascular endothelial cells. J Immunol. 2008;180(1):550–558. | ||
McKenzie JA, Ridley AJ. Roles of Rho/ROCK and MLCK in TNF-alpha-induced changes in endothelial morphology and permeability. J Cell Physiol. 2007;213(1):221–228. | ||
Kim WH, Lee JW, Gao B, Jung MH. Synergistic activation of JNK/SAPK induced by TNF-alpha and IFN-gamma: apoptosis of pancreatic beta-cells via the p53 and ROS pathway. Cell Signal. 2005;17(12):1516–1532. | ||
Nakakuki T, Ito M, Iwasaki H, et al. Rho/Rho-kinase pathway contributes to C-reactive protein–induced plasminogen activator inhibitor-1 expression in endothelial cells. Arterioscler Thromb Vasc Biol. 2005;25(10):2088–2093. | ||
Calò LA, Pagnin E, Mussap M, Davis PA, Semplicini A. Rho/Rho-kinase and C-reactive protein relationship in hypertension and atherosclerosis. Nephrol Dial Transplant. 2006;21(4):1131–1132. | ||
Leach RM, Treacher DF. The pulmonary physician in critical care c • 2: oxygen delivery and consumption in the critically ill. Thorax. 2002;57(2):170–177. | ||
Sesso HD, Stampfer MJ, Rosner B, et al. Systolic and diastolic blood pressure, pulse pressure, and mean arterial pressure as predictors of cardiovascular disease risk in men. Hypertension. 2000;36(5):801–807. | ||
Ali Z, Mishra A, Kumar R, et al. Interactions among vascular-tone modulators contribute to high altitude pulmonary edema and augmented vasoreactivity in highlanders. PLoS One. 2012;7(9):e44049. | ||
Alkorta-Aranburu G, Beall CM, Witonsky DB, Gebremedhin A, Pritchard JK, Di Rienzo A. The genetic architecture of adaptations to high altitude in Ethiopia. PLoS Genet. 2012;8(12):e1003110. | ||
Flatmark T. Catecholamine biosynthesis and physiological regulation in neuroendocrine cells. Acta Physiol Scand. 2000;168(1):1–17. | ||
Nakashima A, Hayashi N, Kaneko YS, et al. Role of N-terminus of tyrosine hydroxylase in the biosynthesis of catecholamines. J Neural Transm (Vienna). 2009;116(11):1355–1362. | ||
Syal K, Ohri A, Thakur JR. Adrenaline induced pulmonary oedema. J Anaesthesiol Clin Pharmacol. 2011;27(1):132–133. | ||
Rassler B. Contribution of α- and β-adrenergic mechanisms to the development of pulmonary edema. Scientifica (Cairo). 2012;2012:829504. | ||
Ruiz-Ortega M, Rodríguez-Vita J, Sanchez-Lopez E, Carvajal G, Egido J. TGF-β signaling in vascular fibrosis. Cardiovasc Res. 2007;74(2):196–206. | ||
Stahl M, Schupp J, Jäger B, et al. Lung collagens perpetuate pulmonary fibrosis via CD204 and M2 macrophage activation. PLoS One. 2013;8(11):e81382. | ||
Hartmann G, Tschöp M, Fischer R, et al. High altitude increases circulating interleukin-6, interleukin-1 receptor antagonist and C-reactive protein. Cytokine. 2000;12(3):246–252. | ||
Kleessen B, Schroedl W, Stueck M, Richter A, Rieck O, Krueger M. Microbial and immunological responses relative to high-altitude exposure in mountaineers. Med Sci Sports Exerc. 2005;37(8):1313–1318. | ||
Vermeire S, Assche GV, Rutgeerts P. C-reactive protein as a marker for inflammatory bowel disease. Inflamm Bowel Dis. 2004;10(5):661–665. | ||
Scherrer U, Randin D, Tappy L, Vollenweider P, Jéquier E, Nicod P. Body fat and sympathetic nerve activity in healthy subjects. Circulation. 1994;89(6):2634–2640. | ||
Sharabi Y, Goldstein DS, Holmes C, Pechnik S, Grossman E, Eisenhofer G. P-482: divergent relationship of body mass index with plasma norepinephrine and epinephrine. Am J Hypertens. 2004;17:209A. | ||
Johnson A, Ferro TJ. TNF-alpha augments pulmonary vasoconstriction via the inhibition of nitrovasodilator activity. J Appl Physiol (1985). 1992;73(6):2483–2492. | ||
Wagner EM. TNF-alpha induced bronchial vasoconstriction. Am J Physiol Heart Circ Physiol. 2000;279(3):H946–H951. | ||
Stamler JS, Loh E, Roddy MA, Currie KE, Creager MA. Nitric oxide regulates basal systemic and pulmonary vascular resistance in healthy humans. Circulation. 1994;89(5):2035–2040. | ||
Blitzer ML, Loh E, Roddy MA, Stamler JS, Creager MA. Endothelium-derived nitric oxide regulates systemic and pulmonary vascular resistance during acute hypoxia in humans. J Am Coll Cardiol. 1996;28(3):591–596. | ||
Grund B, Sabin C. Analysis of biomarker data: logs, odds ratios, and receiver operating characteristic curves. Curr Opin HIV AIDS. 2010;5(6):473–479. |
 © 2016 The Author(s). This work is published and licensed by Dove Medical Press Limited. The full terms of this license are available at https://www.dovepress.com/terms.php and incorporate the Creative Commons Attribution - Non Commercial (unported, v3.0) License.
By accessing the work you hereby accept the Terms. Non-commercial uses of the work are permitted without any further permission from Dove Medical Press Limited, provided the work is properly attributed. For permission for commercial use of this work, please see paragraphs 4.2 and 5 of our Terms.
© 2016 The Author(s). This work is published and licensed by Dove Medical Press Limited. The full terms of this license are available at https://www.dovepress.com/terms.php and incorporate the Creative Commons Attribution - Non Commercial (unported, v3.0) License.
By accessing the work you hereby accept the Terms. Non-commercial uses of the work are permitted without any further permission from Dove Medical Press Limited, provided the work is properly attributed. For permission for commercial use of this work, please see paragraphs 4.2 and 5 of our Terms.