")
Back to Journals » Nature and Science of Sleep » Volume 14
Electroencephalography Theta/Beta Ratio Decreases in Patients with Severe Obstructive Sleep Apnea
Authors Li J, You J , Yin G, Xu J, Zhang Y, Yuan X, Chen Q, Ye J
Received 10 January 2022
Accepted for publication 16 May 2022
Published 30 May 2022 Volume 2022:14 Pages 1021—1030
DOI https://doi.org/10.2147/NSS.S357722
Checked for plagiarism Yes
Review by Single anonymous peer review
Peer reviewer comments 2
Editor who approved publication: Dr Sarah L Appleton
Jingjing Li,1 Jingyuan You,2 Guoping Yin,1 Jinkun Xu,1 Yuhuan Zhang,1 Xuemei Yuan,1 Qiang Chen,1 Jingying Ye1,3
1Department of Otorhinopharyngology–Head and Neck Surgery, Beijing Tsinghua Changgung Hospital, School of Clinical Medicine, Tsinghua University, Beijing, People’s Republic of China; 2Department of Biomedical Engineering, School of Medicine, Tsinghua University, Beijing, People’s Republic of China; 3Institute of Precision Medicine, Tsinghua University, Beijing, People’s Republic of China
Correspondence: Jingying Ye, Department of Otorhinopharyngology–Head and Neck Surgery, Beijing Tsinghua Changgung Hospital, School of Clinical Medicine, Tsinghua University, Litang Road 168, Beijing, 102218, People’s Republic of China, Tel +86-13701396970, Email [email protected]
Purpose: Accumulating evidence suggests that theta/beta ratio (TBR), an electroencephalographic (EEG) frequency band parameter, might serve as an objective marker of executive cognitive control in healthy adults. Obstructive sleep apnea (OSA) has a detrimental impact on patients’ behavior and cognitive performance while whether TBR is different in OSA population has not been reported. This study aimed to explore the difference in relative EEG spectral power and TBR during sleep between patients with severe OSA and non-OSA groups.
Patients and Methods: 142 participants with in-laboratory nocturnal PSG recording were included, among which 100 participants suffered severe OSA (apnea hypopnea index, AHI > 30 events/hour; OSA group) and 42 participants had no OSA (AHI ≤ 5 events/h; control group). The fast Fourier transformation was used to compute the EEG power spectrum for total sleep duration within contiguous 30-second epochs of sleep. The demographic and polysomnographic characteristics, relative EEG spectral power and TBR of the two groups were compared.
Results: It was found that the beta band power during NREM sleep and total sleep was significantly higher in the OSA group than controls (p < 0.001, p = 0.012, respectively), and the theta band power during NREM sleep and total sleep was significantly lower in the OSA group than controls (p = 0.019, p = 0.014, respectively). TBR during NREM sleep, REM sleep and total sleep was significantly lower in the OSA group compared to the control group (p < 0.001 for NREM sleep and total sleep, p = 0.015 for REM sleep). TBR was negatively correlated with AHI during NREM sleep (r=− 0.324, p < 0.001) and total sleep (r=− 0. 312, p < 0.001).
Conclusion: TBR was significantly decreased in severe OSA patients compared to the controls, which was attributed to both increased beta power and decreased theta power. TBR may be a stable EEG-biomarker of OSA patients, which may accurately and reliably identify phenotype of patients.
Keywords: sleep electroencephalography, spectral power, frequency band ratio, theta/beta ratio, OSA
Introduction
Obstructive sleep apnea (OSA) is a sleep-related breathing disorder characterized by repetitive pauses (apneas) or reductions in airflow amplitude (hypopneas) attributed to the collapsibility of the upper airway during sleep. A growing number of studies indicate that OSA, especially moderate-to-severe OSA, has a detrimental impact on patients’ behavior and cognitive performance.1–3 These adverse effects might be driven by disrupted restorative functions of nighttime sleep and reduced oxygen delivery resulting in neuronal damage. Continuous positive airway pressure (CPAP) can reverse cognitive deficits associated with OSA and improve occupational well-being and job productivity of the patients.4 Moreover, mild patients even obtain neurocognitive enhancements upon timely treatment.5–7 Hence, it is necessary to objectively identify cognitive impairments in OSA patients to minimize their impact and maximize their reversibility.
Currently, clinical evaluation of cognitive impairments often relies on subjective questionnaires which are not strongly and consistently related to disease severity (apnea hypopnea index, AHI and oxygen saturation indices), thus limiting the ability to draw conclusions on the association. Therefore, accurate and reliable objective evaluation methods and indicators are urgently needed to evaluate cognitive impairments of OSA patients.
Electroencephalogram (EEG) recordings as an objective measure can be quantitatively analyzed to reveal variations in brain activity. Previous quantitative EEG (qEEG) studies in OSA patients demonstrated a significantly slow brain activity during wakefulness over all cortical regions, suggesting lower levels of vigilance or a general brain dysfunction.2 Several studies exploring sleep EEG focused on specific EEG attributes of OSA patients, such as spindles,8 theta9,10 or delta9,11 activity, but the results were inconsistent. Consequently, how OSA alters the overnight electrical behavior of the brain remains unclear.
It has been reported that band ratio measures are more stable than either absolute or relative measures of individual frequency band power, with high test–retest reliability within individuals.12 The most common clinical application of band ratio measures is theta/beta ratio (TBR), which is used to investigate executive cognitive control, more specifically attentional control in healthy adults12–14 and also attention-deficit hyperactivity disorder (ADHD).15 Previous studies reported a relatively increased theta wave and decreased beta wave of awake-EEG in ADHD,16 and TBR was proposed as a potential diagnostic biomarker for the disorder.17,18 Slow theta waves are linked to subcortical brain regions involved in affective processes, whereas fast beta activity that is argued to reside at the thalamo-cortical and cortico-cortical level is associated with cognitive control processes.19 Since OSA has been reported to be associated with cognitive impairments,20,21 it is unknown whether the cognition-related brain damage can be indicated by EEG and there is no relevant study on the characteristics of TBR in patients with OSA.
The purpose of the current study was to assess electrocortical profiles during sleep in adults with severe OSA. It was hypothesized that OSA subjects were characterized by higher fast waves, lower slow waves and lower TBR during sleep compared to the controls.
Methods
Participants
A consecutive series of participants from the Sleep Medical Center of Beijing Tsinghua Changgung Hospital in Beijing, China, between January 2017 and August 2021 were recruited. Polysomnography (PSG) was used as the diagnostic standard of OSA. Inclusion criteria: aged 40–65 years; AHI > 30 events/hour for OSA patients (n = 100) or AHI ≤ 5 events/h for controls (n = 42). These cut-offs were used to ensure the maximum difference between the control and the OSA groups while maximizing the number of subjects in each group. Exclusion criteria: (i) Severe complications affecting sleep, such as cancer, chronic pain, etc.; (ii) Previous diagnosis of major psychiatric disorders or taking drugs for the treatment of mental diseases, such as depression, anxiety disorder, schizophrenia, etc.; (iii) history of uvulopalatopharyngoplasty; (iv) Suspected of other major sleep disorders, such as insomnia, restless leg syndrome, rapid eye movement sleep behavior disorder, circadian rhythm sleep disorder or narcolepsy; (v) Have a clear history of Parkinson’s disease, epilepsy, stroke and other brain diseases affecting EEG; (vi) significant artifacts in EEG date. All participants were interviewed and evaluated by doctors. Written informed consent was obtained from all participants prior to inclusion in the study. This study was performed following the principle of the Declaration of Helsinki, and the protocol had been approved by the ethics committee of Beijing Tsinghua Changgung Hospital, Tsinghua University. All experiments were performed in accordance with relevant guidelines and regulations.
Overnight Polysomnography
All the participants underwent in-laboratory nocturnal PSG recording. Standard PSG recordings included six electroencephalogram leads (F3, F4, C3, C4, O1, and O2), one electrocardiography channel, two electrooculogram channels (E1-M2 and E2-M2), and three electromyography channels (chin and both anterior tibialis muscles), and were conducted according to the recommendations of the American Academy of Sleep Medicine (AASM).22,23 PSG was performed using SOMNO systems (SOMNO medics Corporation, Germany), and PSG results were scored based on the criteria in the AASM2012 manual.22 Two board-certified PSG technologists completed the interscorer. An apnea event was defined as complete cessation of airflow lasting for at least 10s, and a hypopnea event was defined as a reduction in airflow of more than 50% lasting at least 10s or a less significant reduction in the airflow in the presence of arousal or oxygen desaturation of at least 3%. AHI was calculated as the sum of the numbers of apneas, hypopneas and arousal each hour of sleep.
Power Spectral Analysis of EEG
Raw EEG recordings were sampled at 128 Hz. The EEG was inspected visually, and epochs with excessive noise, drift or unstable connection were removed. The primary EEG channel (C4-A1) was exported and was digitally band-pass filtered from 1 to 20 Hz to remove any low- or high-frequency artifacts. Data on changes in sleep stages were then exported as plain text and automatically matched with EEG recordings by synchronizing with the clinically scored sleep onset time. The power spectral density of EEG recording was estimated by applying Welch’s method.24 A 5s Hanning window with 50% overlap and fast Fourier transform were applied, and a frequency resolution of 0.2 Hz was set. These 0.2 Hz frequency bins were subsequently summed within 5 frequency bands: delta (1–4 Hz), theta (4–8 Hz), alpha (8–12 Hz), sigma (12–15 Hz), and beta (15–20 Hz). The relative spectral power was determined as the frequency band power divided by total power in different sleep stages. For the present analysis, the data during total sleep, NREM sleep, and REM sleep were analyzed. TBR was defined as the ratio of relative theta band (4–8 Hz) power and relative beta band (15–20 Hz) power. TAR referred to the ratio of relative theta band (4–8 Hz) power and relative alpha band (8–12 Hz) power. A global measure of EEG slowing was also calculated which is reflected by the ratio of slow frequencies to fast frequencies (delta + theta)/(alpha + sigma + beta).
Statistical Analysis
Data were first tested for normality and equal variance, which were presented as mean ± standard deviation or n (%) values unless indicated otherwise. All data were analyzed using Statistical Products and Services Solutions (SPSS, 22.0 version). Chi-square test was performed for categorical variables, and two-tailed independent t-test of variance or analysis of covariance was used to compare the demographics, PSG characteristics, relative spectral power, frequency band ratios (TAR and TBR) and EEG slowing between the two groups. Cohen’s d was calculated to reflect the difference in effect between OSA and control group (Stata, 16.0 version). Pearson correlation analysis was performed to assess the correlation between AHI, arousal index (ArI) and relative spectral power. SPSS 22.0 was used to conduct analyses except the calculation of Cohen’s d. When the P value was <0.05, the difference was considered statistically significant.
Results
Demographic and PSG Characteristics of the Participants
A total of 142 participants were included in the present study. The demographic and clinical characteristics of the participants are presented in Table 1. The mean age of the participants in the OSA group and control group was 51.5 ± 7.2 years and 52.1 ± 8.0, respectively, without significant difference. There were also no significant differences in sex and Epworth sleepiness scale (ESS) scores between the two groups. As expected, the groups differed in body mass index (BMI), AHI, AI, hypopnea index (HI) and ArI and all values were higher in the OSA group compared to the controls. The OSA group was at higher risk for hypertension. We found no significant differences in the prevalence of diabetes, arrhythmia and coronary artery diseases between the two groups. The lowest oxygen saturation (LSaO2) was significantly lower in the OSA group compared to the controls. PSG data indicated that there were significant differences in the ratio of N1, N2 and REM sleep and sleep latency between the two groups except the ratio of N3, total sleep and sleep efficiency. The polysomnographic characteristics of the participants are presented in Table 2.
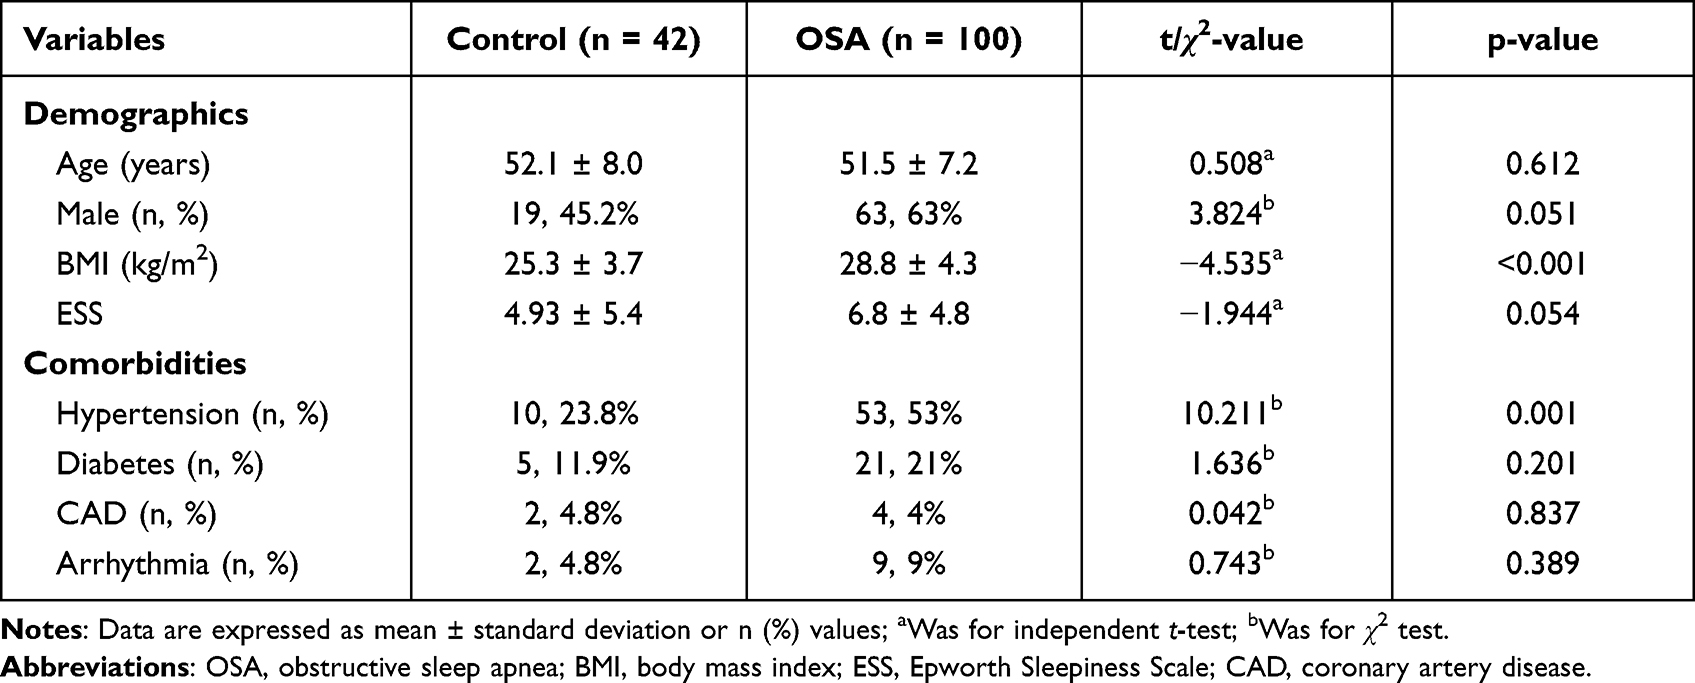 |
Table 1 Demographic and Clinical Characteristics of All the Participants |
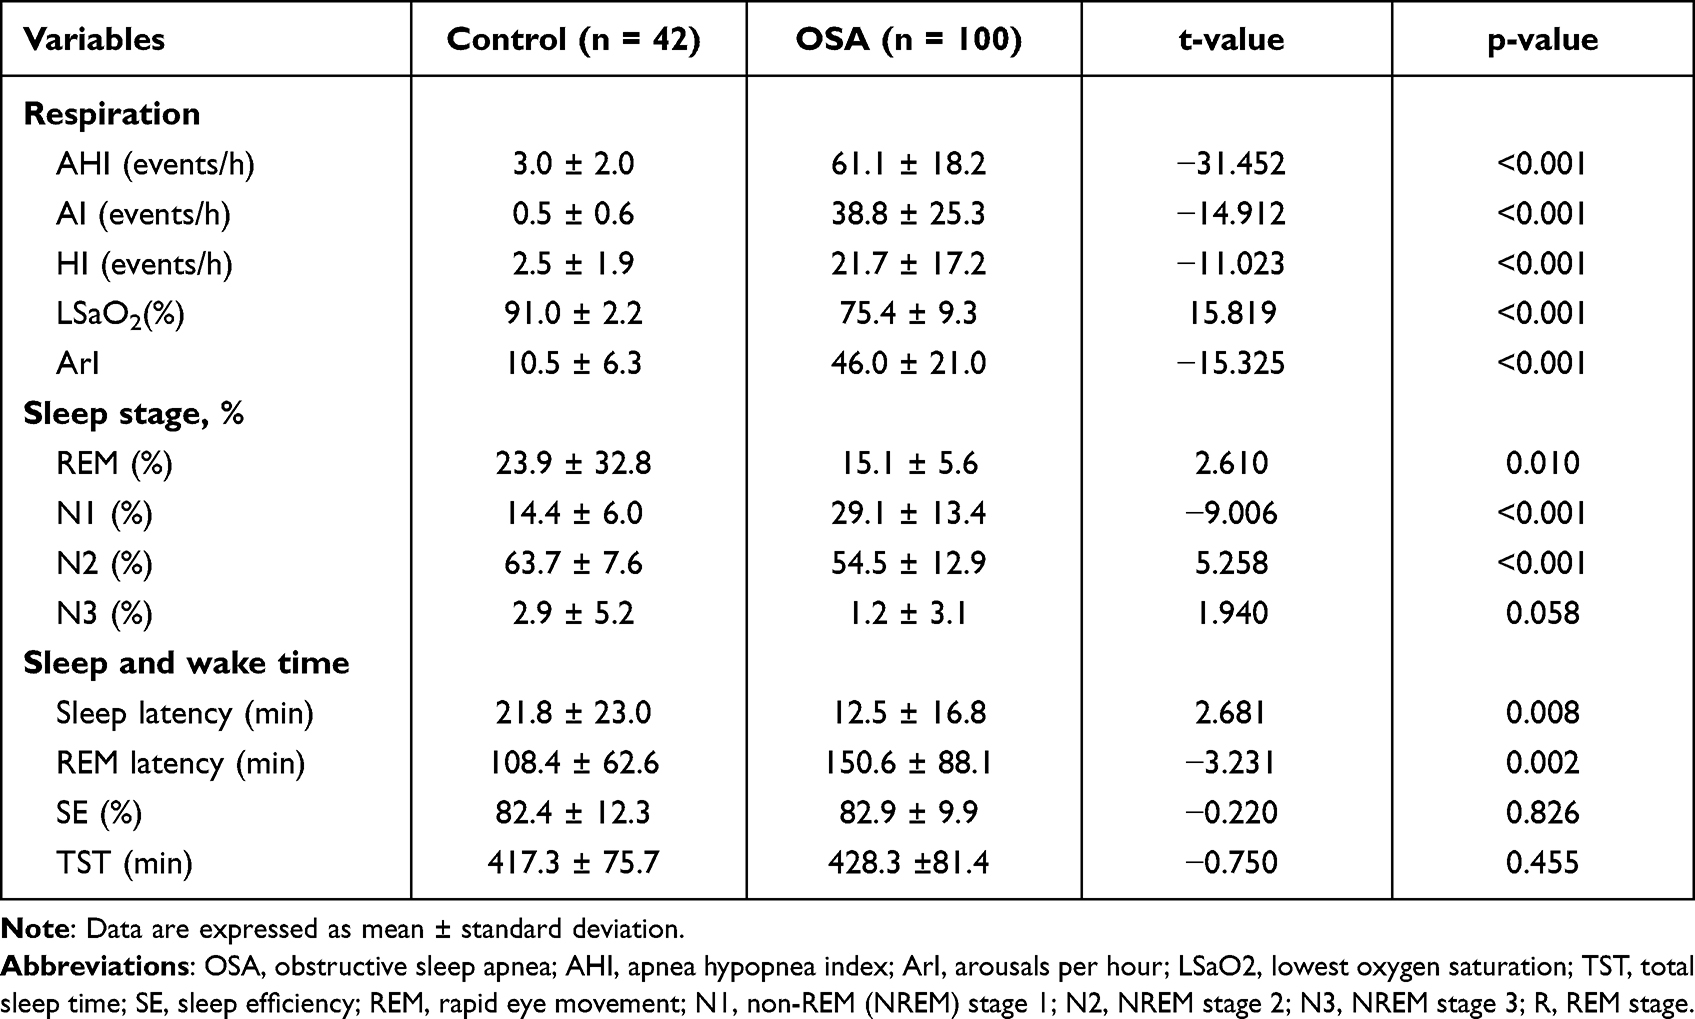 |
Table 2 Polysomnographic Characteristics of All the Participants |
Comparison of Relative Spectral Power and Frequency Band Ratios Between the Two Groups
In the comparison between groups for the relative spectral power during NREM sleep (Table 3) and total sleep (Table 3), the beta band power was significantly higher in the OSA group (p < 0.001, Cohen’s d (d) = 0.461 for NREM sleep; p = 0.012, d = 0.457 for total sleep, respectively), and the theta band power was significantly lower in the OSA group (p = 0.019, d = 0.455 for NREM sleep; p = 0.014, d = 0.443 for total sleep, respectively) than in the control group (Figure 1). Thus, TBR was significantly lower in the OSA group compared to the controls (p < 0.001, d = 0.805 for NREM sleep and p < 0.001, d = 0.815 for total sleep) (Figure 2). There were also significant differences between the OSA group and control group in TBR during REM sleep (p = 0.015, d = 0.539). In addition, OSA patients showed significantly higher delta power (p = 0.032, d = 0.397) and lower theta power (p = 0.001, d = 0.600) during REM sleep compared to the controls (Table 3). We found no difference in the EEG slowing ratio between the two groups in NREM (p = 0.812, d = 0.044), REM (p = 0.240, d = 0.217) and total sleep (p = 0.711, d = 0.068), although the mean value of OSA was higher than that of controls.
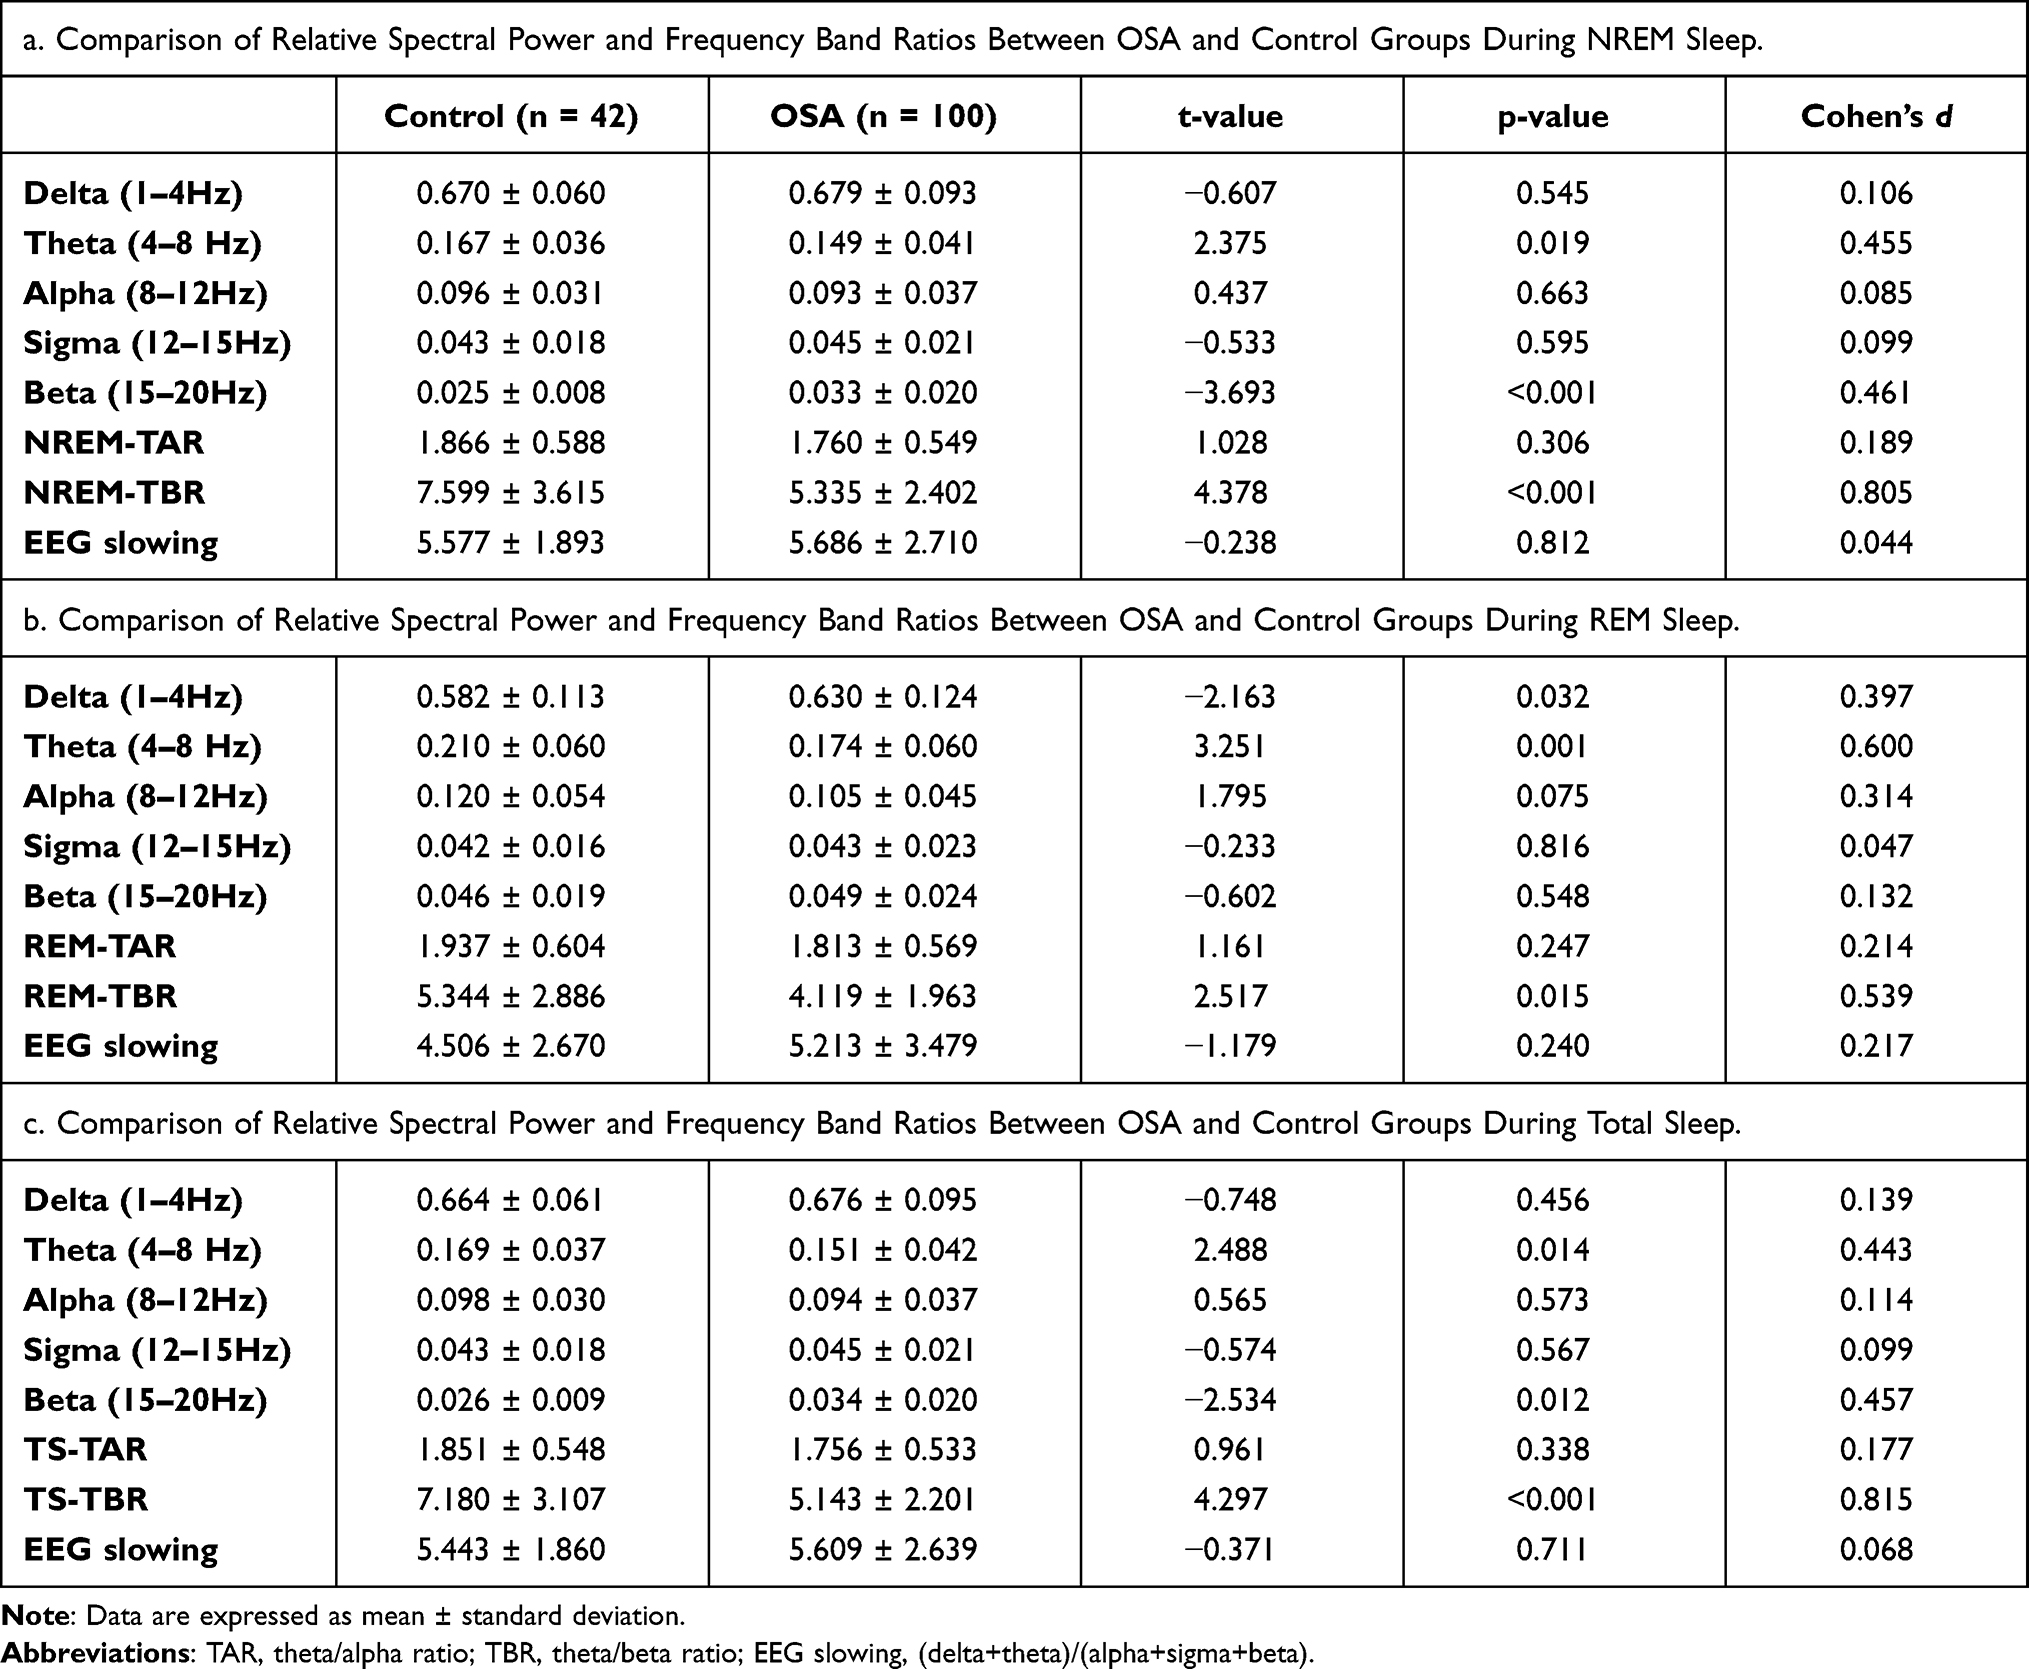 |
Table 3 Comparison of Relative Spectral Power and Frequency Band Ratios Between OSA and Control Groups |
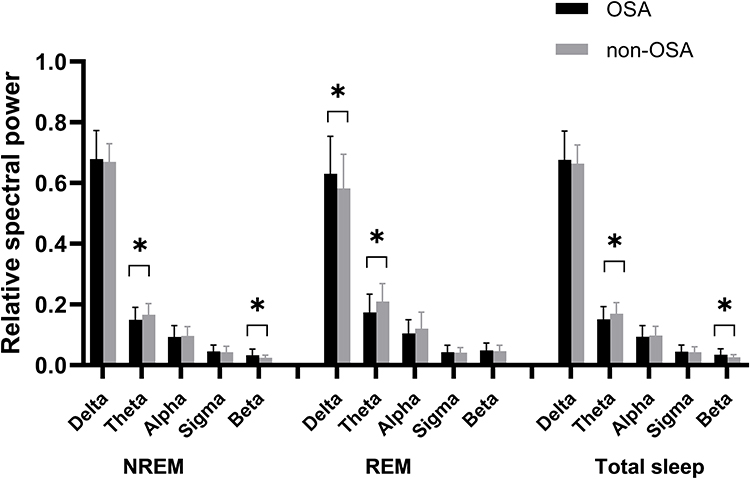 |
Figure 1 Comparisons of the relative spectral power during NREM sleep, REM sleep and total sleep between OSA patients and controls. *p < 0.05. Bars denote mean ± standard deviation. |
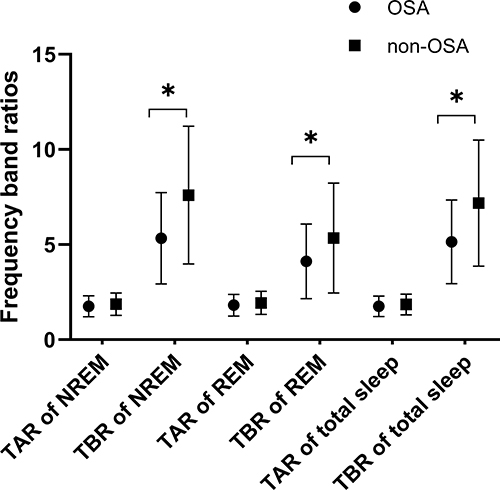 |
Figure 2 Comparisons of the frequency band ratios (TAR and TBR) during NREM sleep, REM sleep and total sleep between OSA patients and controls. *p< 0.05. Bars denote mean ± standard deviation. |
Correlation Between AHI, Relative Spectral Power and Frequency Band Ratios of All the Participants
The correlation between AHI and relative spectral power in total participants is shown in Table 4. AHI was positively correlated with beta power during NREM sleep (r = 0.229, p = 0.006) and total sleep (r = 0.204, p = 0.015), and delta power during REM sleep (r = 0.203, p = 0.016). AHI was negatively correlated with TBR during NREM sleep (r = −0.324, p < 0.001) and total sleep (r = −0. 312, p < 0.001). AHI was negatively correlated with theta power during REM sleep (r = −0.237, p = 0.005) and total sleep (r = −0.175, p = 0.038).
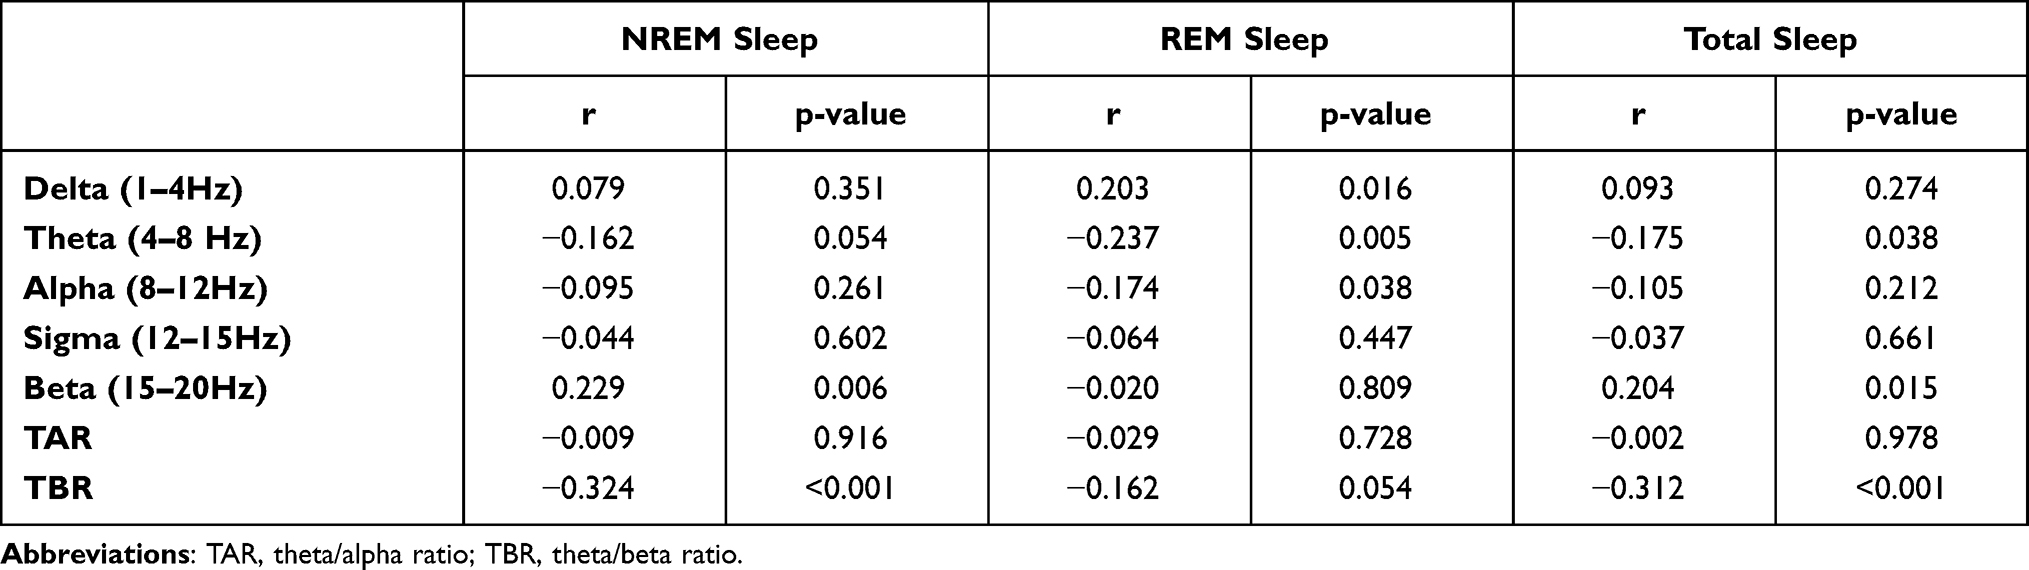 |
Table 4 Correlation Analyses Between AHI, Relative Spectral Power and Frequency Band Ratios of All the Participants |
The correlation between arousal index and relative spectral power in total participants is listed in Table 5. Arousal index was positively correlated with theta power and TBR in all participants during NREM (r = −0.344, p < 0.001), REM (r = −0.204, p = 0.015) and total sleep stages (r = −0.338, p < 0.001).
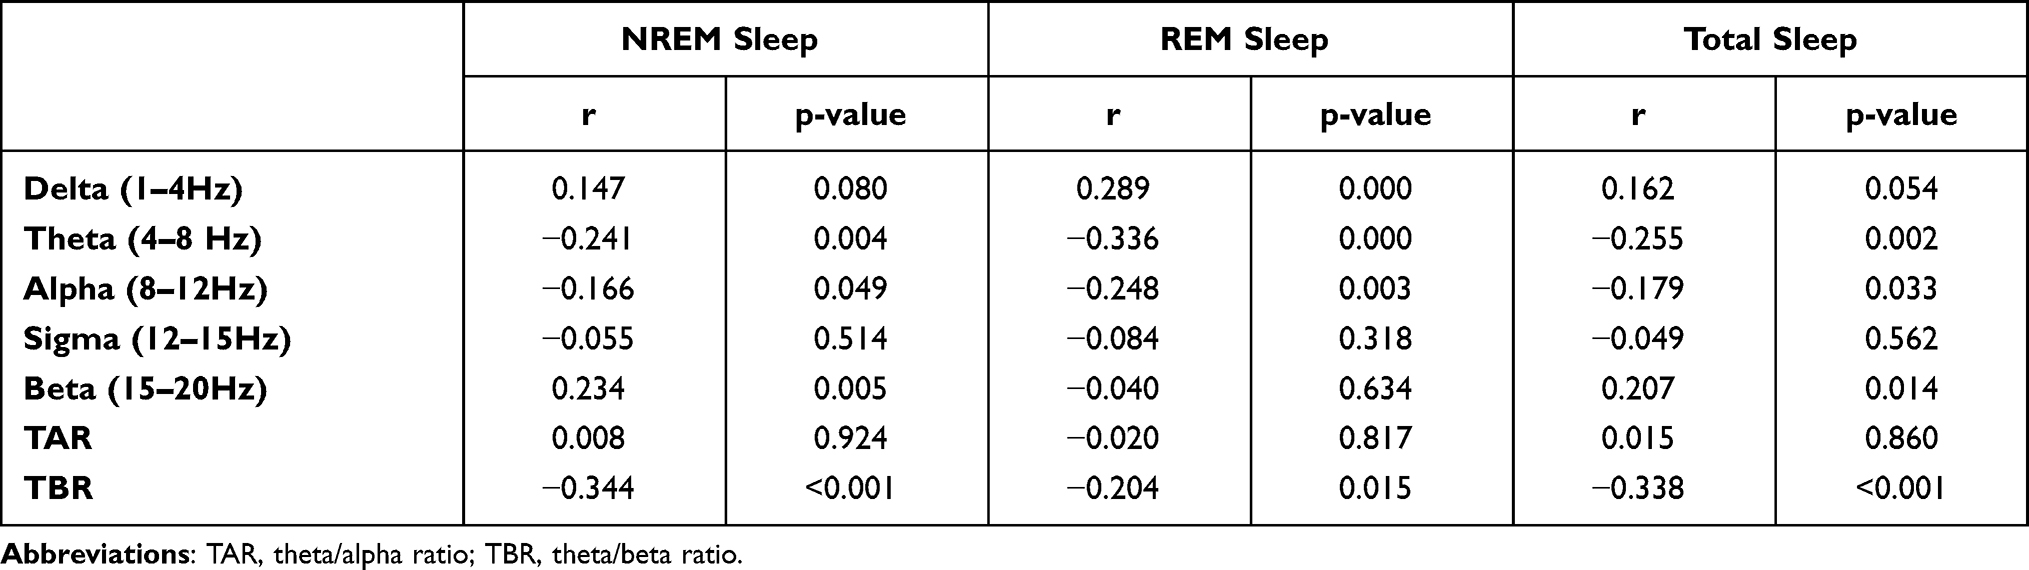 |
Table 5 Correlation Between Arousal Index, Relative Spectral Power and Frequency Band Ratios of All the Participants |
Discussion
Our study first evaluated sleep EEG changes in OSA patients using frequency band ratio, especially TBR, which may facilitate further investigation on the pathophysiological mechanisms of cognitive impairments in OSA patients. Spectral power analysis was performed on sleep EEG derived from PSG recordings of the general population, and the spectral power of severe OSA patients and controls was compared. The results showed that TBR was significantly decreased in OSA patients during NREM sleep, REM sleep and total sleep. The decreased TBR was caused by both the decreased theta power and the increased beta power. In addition, TBR was negatively correlated with AHI during NREM sleep and total sleep.
Higher beta power was found in OSA patients compared to controls (Table 3), and the beta power was positively correlated with AHI and arousal index in all participants during NREM sleep and total sleep (Tables 4 and 5). The higher beta power can be explained by higher background brain activity, which means shallower sleep in OSA patients. It was consistent with the microstructure of sleep in OSA patients who had a significantly increased percentage of N1 sleep (Table 2). Consistent with our findings, a previous study found that beta and delta power during NREM sleep was higher in OSA participants than in the simple snoring subjects.9 Another study investigated the degree of daytime sleepiness and the characteristics of the sleep EEG by examining the macro- and microstructure of sleep among patients with OSA and upper airway resistance syndrome (UARS) and normal controls, and it was found that the OSA patients had significantly higher beta power during NREM sleep and lower delta power during all sleep stages compared to the controls, which was consistent with the outcomes of our study.25 A recent study also confirmed the increasing trend of beta power with the severity of OSA using large-scale data (n = 4493) and controlled the covariates that could affect the spectral sleep EEG.26 However, it was found that the relative beta power was higher during N3 sleep and lower during N2 sleep in the sleep apnea group than in the healthy group, and the change in beta power depended on the sleep stage.27 More specifically, we found a positive correlation between the beta power activity and AHI in NREM sleep and total sleep, which implies that beta power may be linearly correlated with increased background activity and arousal in OSA patients compared with the controls.
The theta power of OSA patients during NREM sleep, REM sleep and total sleep was significantly lower compared with the controls. The decreased theta power can be explained by the attenuation of slowing sleep EEG which may inversely cause waking EEG slowing.28 The waking EEG slowing has been linked to greater subjectively rated levels of sleepiness and fatigue29,30 and objectively measured lapses in attention and vigilance failure.31 A previous study was performed on older adults with self-reported cognitive decline, and increased theta power in wake-EEG at the baseline was found in participants who presented an objective cognitive decline during 7–9 years of follow-up.32 Consistent with our results, an earlier study found reduced theta activity in NREM sleep predicted increased daytime sleepiness measured by the Multiple Sleep Latency Test (MSLT),33 while greater slow wave activity (SWA) during slow wave sleep (SWS) was related to improved declarative memory, procedural learning and faster reaction.34 However, inconsistent results have also been reported, which showed no significant differences in the theta frequency during NREM and REM sleep between groups.9,25
Theta waves are linked to subcortical brain regions involved in affective processes, whereas beta activity that is argued to reside at the thalamo-cortical and cortico-cortical level is associated with emotional and cognitive control processes and arousal during sleep.19,35 TBR is argued to reflect cortico-subcortical interactions. Accumulating evidence indicates that TBR might be a promising electrophysiological marker for cognitive control in healthy adults12–14 and children with ADHD. Increased theta/beta ratio in awake EEG has been observed in children with ADHD.16 In the current study, both lower theta power and higher beta power were observed in OSA patients, which resulted in significantly decreased TBR. The finding that the effect sizes of TBR were over 0.8 for both NREM sleep and total sleep suggests that the differences were clinically meaningful with large effect. Therefore, TBR may be a more stable EEG-biomarker of OSA patients, which may accurately and reliably identify the disease/non-disease states of OSA even to evaluate the changes of EEG after treatment in the future.
Our study showed different patterns of spectral power during NREM and REM sleep. Significantly increased delta power of OSA patients was found only during REM sleep. Delta band power activity was shown to be positively correlated with AHI and ArI in REM sleep. That is, patients with higher EEG slowing are more prone to arousals, resulting in sleep fragmentation. This is supported by previous studies, which demonstrated an increase in delta power and a decrease in theta power in the severe OSA group compared to primary snoring and mild-moderate groups.10 One study including 76 patients with OSA found that higher delta power in REM sleep and higher beta power in NREM sleep were predictors of worse steering deviation on a 30-minute driving simulator task.36 Inconsistent findings have also been reported, that is, higher delta activity during NREM sleep in OSA patients than in controls37 or simple snoring participants.9 The finding of increased delta power in REM sleep might be interpreted that REM sleep was interrupted by arousal and sleep spindles, which are relatively faster than REM sleep.
The major limitation of our research is the lack of cognitive evaluation. Therefore, the causal relationship between TBR and cognitive decline caused by OSA cannot be determined. It is suggested that cognitive related evaluation should be considered in future research. The main limitations of this study also included small and unmatched sample size between OSA patients and controls due to the clinical characteristics of the disease. Moreover, we only included middle-aged severe OSA patients; since earlier studies have shown that the macrostructural and microstructural features have age-related changes, we chose the middle-aged group which is mostly affected by OSA. Meanwhile, it is speculated that brain dysfunction is susceptible to the severity of OSA, so we only included patients with severe OSA. Our findings remain to be further verified by studies with a larger sample size and OSA patients of different severity.
Conclusion
In summary, the major finding of the present study is that TBR was significantly decreased in severe OSA patients compared with controls, which is attributed to both the general increase in beta power and the decrease in theta power. Meantime, TBR was negatively correlated with AHI and arousal index. TBR may be a more stable EEG-biomarker of OSA patients, which may accurately and reliably identify the disease/non-disease states of OSA even to evaluate the changes of EEG after treatment in the future. However, the stability of TBR, the correlation between TBR and subjective assessment of cognitive function and the changes before and after therapy of OSA remain to be investigated in the future.
Acknowledgments
We appreciate Professor Phyllis C. Zee of Northwestern University Feinberg School of Medicine, Chicago, America, for the instruction of the study design.
Funding
This study was supported by grants No. 81873696 from the National Natural Science Foundation of China.
Disclosure
The authors report no conflicts of interest in this work.
References
1. Yaffe K, Laffan AM, Harrison SL, et al. Sleep-disordered breathing, hypoxia, and risk of mild cognitive impairment and dementia in older women. JAMA. 2011;306(6):613–619. doi:10.1001/jama.2011.1115
2. Gosselin N, Baril AA, Osorio RS, Kaminska M, Carrier J. Obstructive sleep apnea and the risk of cognitive decline in older adults. Am J Respir Crit Care Med. 2019;199(2):142–148. doi:10.1164/rccm.201801-0204PP
3. Leng Y, McEvoy CT, Allen IE, Yaffe K. Association of sleep-disordered breathing with cognitive function and risk of cognitive impairment: a systematic review and meta-analysis. JAMA Neurol. 2017;74(10):1237–1245. doi:10.1001/jamaneurol.2017.2180
4. Jurádo-Gámez B, Guglielmi O, Gude-Sampedro F, Buela-Casal G. Effect of CPAP therapy on job productivity and psychosocial occupational health in patients with moderate to severe sleep apnea. Sleep Breath. 2015;19(4):1293–1299. doi:10.1007/s11325-015-1162-6
5. Wang G, Goebel JR, Li C, Hallman HG, Gilford TM, Li W. Therapeutic effects of CPAP on cognitive impairments associated with OSA. J Neurol. 2020;267(10):2823–2828. doi:10.1007/s00415-019-09381-2
6. Richards KC, Gooneratne N, Dicicco B, et al. CPAP adherence may slow 1-year cognitive decline in older adults with mild cognitive impairment and apnea. J Am Geriatr Soc. 2019;67(3):558–564. doi:10.1111/jgs.15758
7. Dalmases M, Solé-Padullés C, Torres M, et al. Effect of CPAP on cognition, brain function, and structure among elderly patients with OSA: a randomized pilot study. Chest. 2015;148(5):1214–1223. doi:10.1378/chest.15-0171
8. Weiner OM, Dang-Vu TT. Spindle oscillations in sleep disorders: a systematic review. Neural Plast. 2016;2016:7328725. doi:10.1155/2016/7328725
9. Kang JM, Kim ST, Mariani S, et al. Difference in spectral power density of sleep EEG between patients with simple snoring and those with obstructive sleep apnoea. Sci Rep. 2020;10(1):6135. doi:10.1038/s41598-020-62915-x
10. Liu S, Shen J, Li Y, et al. EEG power spectral analysis of abnormal cortical activations during REM/NREM sleep in obstructive sleep apnea. Front Neurol. 2021;12:643855. doi:10.3389/fneur.2021.643855
11. Xiromeritis AG, Hatziefthimiou AA, Hadjigeorgiou GM, Gourgoulianis KI, Anagnostopoulou DN, Angelopoulos NV. Quantitative spectral analysis of vigilance EEG in patients with obstructive sleep apnoea syndrome: EEG mapping in OSAS patients. Sleep Breath. 2011;15(1):121–128. doi:10.1007/s11325-010-0335-6
12. Angelidis A, van der Does W, Schakel L, Putman P. Frontal EEG theta/beta ratio as an electrophysiological marker for attentional control and its test-retest reliability. Biol Psychol. 2016;121(Pt A):49–52. doi:10.1016/j.biopsycho.2016.09.008
13. Putman P, van Peer J, Maimari I, van der Werff S. EEG theta/beta ratio in relation to fear-modulated response-inhibition, attentional control, and affective traits. Biol Psychol. 2010;83(2):73–78. doi:10.1016/j.biopsycho.2009.10.008
14. Putman P, Verkuil B, Arias-Garcia E, Pantazi I, van Schie C. EEG theta/beta ratio as a potential biomarker for attentional control and resilience against deleterious effects of stress on attention. Cogn Affect Behav Neurosci. 2014;14(2):782–791. doi:10.3758/s13415-013-0238-7
15. Loo SK, Makeig S. Clinical utility of EEG in attention-deficit/hyperactivity disorder: a research update. Neurotherapeutics. 2012;9(3):569–587. doi:10.1007/s13311-012-0131-z
16. Bresnahan SM, Barry RJ. Specificity of quantitative EEG analysis in adults with attention deficit hyperactivity disorder. Psychiatry Res. 2002;112(2):133–144. doi:10.1016/S0165-1781(02)00190-7
17. Snyder SM, Hall JR. A meta-analysis of quantitative EEG power associated with attention-deficit hyperactivity disorder. J Clin Neurophysiol. 2006;23(5):440–455. doi:10.1097/01.wnp.0000221363.12503.78
18. Snyder SM, Rugino TA, Hornig M, Stein MA. Integration of an EEG biomarker with a clinician’s ADHD evaluation. Brain Behav. 2015;5(4):e00330. doi:10.1002/brb3.330
19. Knyazev GG, Slobodskaya HR. Personality trait of behavioral inhibition is associated with oscillatory systems reciprocal relationships. Int J Psychophysiol. 2003;48(3):247–261. doi:10.1016/S0167-8760(03)00072-2
20. Mullins AE, Kim JW, Wong KKH, et al. Sleep EEG microstructure is associated with neurobehavioural impairment after extended wakefulness in obstructive sleep apnea. Sleep Breath. 2021;25(1):347–354. doi:10.1007/s11325-020-02066-5
21. Parker JL, Appleton SL, Melaku YA, et al. The association between sleep microarchitecture and cognitive function in middle-aged and older men: a community-based cohort study. JCSM. 2022. doi:10.5664/jcsm.9934
22. Berry RB, Budhiraja R, Gottlieb DJ, et al. Rules for scoring respiratory events in sleep: update of the 2007 AASM manual for the scoring of sleep and associated events. deliberations of the sleep apnea definitions task force of the American Academy of Sleep Medicine. JCSM. 2012;8(5):597–619. doi:10.5664/jcsm.2172
23. Iber C. The AASM Manual for the Scoring of Sleep and Associated Events: Rules, Terminology and Technical Specifications. American Academy of Sleep Medicine; 2007.
24. Welch PD. The use of fast Fourier transform for the estimation of power spectra: a method based on time averaging over short, modified periodograms. IEEE Trans Audio Electroacoust. 1967;15(2):70–73. doi:10.1109/TAU.1967.1161901
25. Guilleminault C, Do Kim Y, Chowdhuri S, Horita M, Ohayon M, Kushida C. Sleep and daytime sleepiness in upper airway resistance syndrome compared to obstructive sleep apnoea syndrome. Eur Respir J. 2001;17(5):838–847. doi:10.1183/09031936.01.17508380
26. Kang JM, Cho SE, Na KS, Kang SG. Spectral power analysis of sleep electroencephalography in subjects with different severities of obstructive sleep apnea and healthy controls. Nat Sci Sleep. 2021;13:477–486. doi:10.2147/NSS.S295742
27. Abdullah H, Maddage NC, Cosic I, Cvetkovic D. Cross-correlation of EEG frequency bands and heart rate variability for sleep apnoea classification. Med Biol Eng Comput. 2010;48(12):1261–1269. doi:10.1007/s11517-010-0696-9
28. Morisson F, Décary A, Petit D, Lavigne G, Malo J, Montplaisir J. Daytime sleepiness and EEG spectral analysis in apneic patients before and after treatment with continuous positive airway pressure. Chest. 2001;119(1):45–52. doi:10.1378/chest.119.1.45
29. Cajochen C, Brunner DP, Kräuchi K, Graw P, Wirz-Justice A. Power density in theta/alpha frequencies of the waking EEG progressively increases during sustained wakefulness. Sleep. 1995;18(10):890–894. doi:10.1093/sleep/18.10.890
30. Strijkstra AM, Beersma DG, Drayer B, Halbesma N, Daan S. Subjective sleepiness correlates negatively with global alpha (8–12 Hz) and positively with central frontal theta (4–8 Hz) frequencies in the human resting awake electroencephalogram. Neurosci Lett. 2003;340(1):17–20. doi:10.1016/S0304-3940(03)00033-8
31. Oken BS, Salinsky MC, Elsas SM. Vigilance, alertness, or sustained attention: physiological basis and measurement. Clin Neurophysiol. 2006;117(9):1885–1901. doi:10.1016/j.clinph.2006.01.017
32. Prichep LS, John ER, Ferris SH, et al. Prediction of longitudinal cognitive decline in normal elderly with subjective complaints using electrophysiological imaging. Neurobiol Aging. 2006;27(3):471–481. doi:10.1016/j.neurobiolaging.2005.07.021
33. Wichniak A, Geisler P, Brunner H, et al. Spectral composition of NREM sleep in healthy subjects with moderately increased daytime sleepiness. Clin Neurophysiol. 2003;114(8):1549–1555. doi:10.1016/S1388-2457(03)00158-5
34. Göder R, Aldenhoff JB, Boigs M, Braun S, Koch J, Fritzer G. Delta power in sleep in relation to neuropsychological performance in healthy subjects and schizophrenia patients. J Neuropsychiatry Clin Neurosci. 2006;18(4):529–535. doi:10.1176/jnp.2006.18.4.529
35. Ray WJ, Cole HW. EEG alpha activity reflects attentional demands, and beta activity reflects emotional and cognitive processes. Science. 1985;228(4700):750–752. doi:10.1126/science.3992243
36. Vakulin A, D’Rozario A, Kim JW, et al. Quantitative sleep EEG and polysomnographic predictors of driving simulator performance in obstructive sleep apnea. Clin Neurophysiol. 2016;127(2):1428–1435. doi:10.1016/j.clinph.2015.09.004
37. Svanborg E, Guilleminault C. EEG frequency changes during sleep apneas. Sleep. 1996;19(3):248–254.
 © 2022 The Author(s). This work is published and licensed by Dove Medical Press Limited. The full terms of this license are available at https://www.dovepress.com/terms.php and incorporate the Creative Commons Attribution - Non Commercial (unported, v3.0) License.
By accessing the work you hereby accept the Terms. Non-commercial uses of the work are permitted without any further permission from Dove Medical Press Limited, provided the work is properly attributed. For permission for commercial use of this work, please see paragraphs 4.2 and 5 of our Terms.
© 2022 The Author(s). This work is published and licensed by Dove Medical Press Limited. The full terms of this license are available at https://www.dovepress.com/terms.php and incorporate the Creative Commons Attribution - Non Commercial (unported, v3.0) License.
By accessing the work you hereby accept the Terms. Non-commercial uses of the work are permitted without any further permission from Dove Medical Press Limited, provided the work is properly attributed. For permission for commercial use of this work, please see paragraphs 4.2 and 5 of our Terms.