")
Back to Journals » Neuropsychiatric Disease and Treatment » Volume 11
Electroencephalography signatures of attention-deficit/hyperactivity disorder: clinical utility
Authors Alba G, Pereda E, Mañas S, Méndez L, González A, González J
Received 8 May 2015
Accepted for publication 11 September 2015
Published 22 October 2015 Volume 2015:11 Pages 2755—2769
DOI https://doi.org/10.2147/NDT.S51783
Checked for plagiarism Yes
Review by Single anonymous peer review
Peer reviewer comments 2
Editor who approved publication: Dr Roger Pinder
Guzmán Alba,1 Ernesto Pereda,2 Soledad Mañas,3 Leopoldo D Méndez,3 Almudena González,1 Julián J González1
1Physiology Unit, Health Sciences Faculty (S Medicine), 2Department of Industrial Engineering, School of Engineering and Technology, University of La Laguna, 3Clinical Neurophysiology Unit, University Hospital La Candelaria, Tenerife, Spain
Abstract: The techniques and the most important results on the use of electroencephalography (EEG) to extract different measures are reviewed in this work, which can be clinically useful to study subjects with attention-deficit/hyperactivity disorder (ADHD). First, we discuss briefly and in simple terms the EEG analysis and processing techniques most used in the context of ADHD. We review techniques that both analyze individual EEG channels (univariate measures) and study the statistical interdependence between different EEG channels (multivariate measures), the so-called functional brain connectivity. Among the former ones, we review the classical indices of absolute and relative spectral power and estimations of the complexity of the channels, such as the approximate entropy and the Lempel-Ziv complexity. Among the latter ones, we focus on the magnitude square coherence and on different measures based on the concept of generalized synchronization and its estimation in the state space. Second, from a historical point of view, we present the most important results achieved with these techniques and their clinical utility (sensitivity, specificity, and accuracy) to diagnose ADHD. Finally, we propose future research lines based on these results.
Keywords: EEG, ADHD, power spectrum, functional connectivity, clinical assessment
Introduction
Attention-deficit/hyperactivity disorder (ADHD) is recognized as a dysfunction characterized by symptoms of hyperactivity, impulsivity, and inattention. In 1992, the World Health Organization recognized the ADHD as a clinical entity in the International Classification of Diseases, tenth edition (ICD-10). This pathology is defined as ADHD in the Diagnostic and Statistical Manual of Mental Disorders IV Text Revision (DSM IV-TR) along with its three subtypes (inattentive, hyperactive, and combined). Currently, ADHD is characterized by the criteria outlined in the DSM-IV-TR and DSM-V.1,2 These criteria are used for the diagnosis through functional cognitive tests and observations of the behavior.
Longstanding issues affecting the current diagnostic process include the subjectivity of ADHD symptoms, the irregular correlation between parents and teachers diagnostic classification scales, and the overlap of attention and behavioral symptoms with other disorders.3 In fact, Snyder et al reported, based on the results of their own work and on a review made by them during 10 years, that the accuracy of the behavioral classification scales range between 47% and 79%, which clearly affects their clinical validity.4
Neurophysiological measures could help solving this problem because ADHD is largely related to neurophysiological impairments. Electroencephalogram (EEG) measurements have been widely used in neurophysiology due to their easy implementation in low cost recording machines. These facts make these techniques attractive for the current diagnostic protocol. In addition, there are many relevant results based on EEG studies that explain and clarify different aspects about ADHD.
Neuroanatomical5–7 and functional connectivity (FC) alterations8–11 have been reported in ADHD using image analysis (positron emission tomography, fMRI, etc). Executive attention and/or reward-motivational network alterations have been reported in some fMRI ADHD studies.11,12 It seems reasonable that such changes are also apparent in the electrical activity of the cerebral cortex (EEG) and in EEG FC between cortical areas. The univariate and multivariate EEG measurements described later may be thus modified in patients with ADHD, as happens with the fMRI measurements, and may also be related to the symptoms of ADHD.
In this review, we aim at explaining, in a way accessible to readers who are not familiar with the field (but hopefully also in a way useful to experts), the EEG measures most commonly used in the context of ADHD. These measures have been divided into two types: those stemming from the individual analysis of the EEG channels (univariate measures) and those analyzing the interdependence or statistical correlation between different EEG channels (multivariate measures), used to estimate the FC between different cortical areas. In turn, within these two groups of EEG measures, we will review both, those that assume the linear nature of the system that generates the EEG signals, as well as those assuming its nonlinear nature. Then, we will review the results obtained with these techniques and the most relevant findings in relation to their clinical utility for the diagnosis of ADHD.
EEG techniques for ADHD assessment
Univariate measures
Linear approach
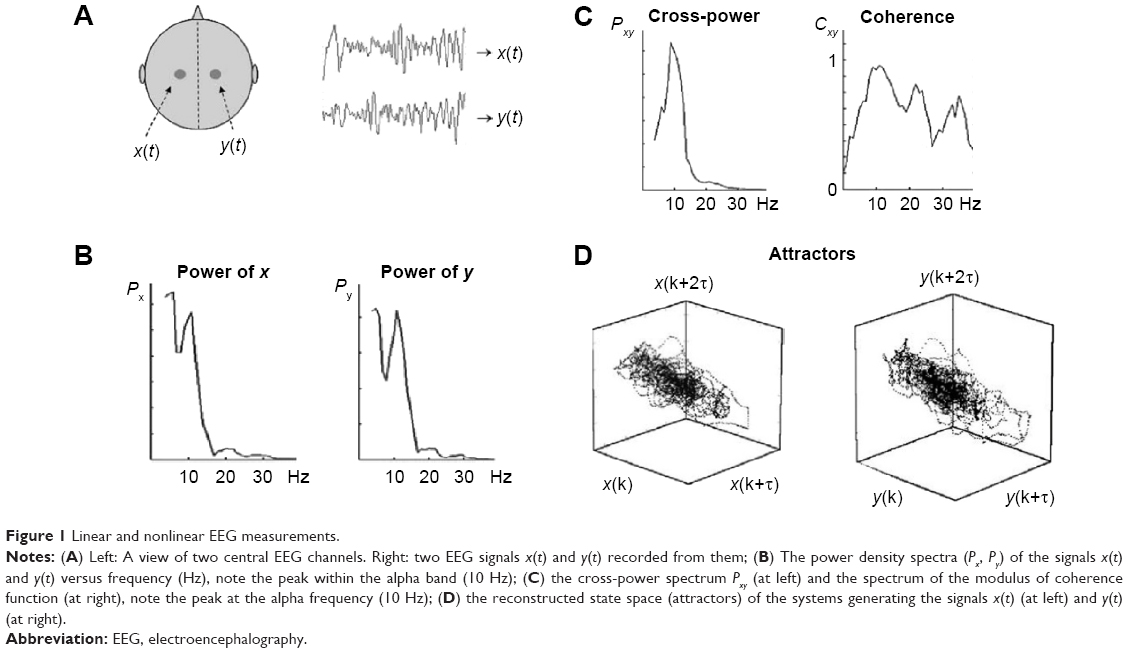
The first quantitative EEG studies on ADHD were published in the last years of the 70s of the past century, when the computational algorithm of fast Fourier transform (FFT) was introduced. The FFT very efficiently estimates the spectral content of a signal as a sum of orthogonal sine and cosine waves (harmonics) of different frequencies up to half the sampling frequency of the data. Thus, it allows computing the power spectral density (PSD) of an EEG, a measure that estimates in which frequency bands the power or energy of the signal is concentrated (Figure 1A and B). The PSD is considered a reflection of the local synchronized synaptic activity of the cortical and subcortical neuronal areas next to a channel/electrode.
 | Figure 1 Linear and nonlinear EEG measurements. |
In the EEG, the classical frequency bands most commonly studied are, from lowest to highest frequencies, delta (0.1–4 Hz), theta (4–8 Hz), alpha (8–13 Hz), beta (14–30 Hz), and gamma (>30 Hz), although the ranges may vary depending on the authors. The absolute power of one EEG, recorded from one electrode attached to the scalp, is calculated at a certain frequency band as the sum of the square of the amplitude of the harmonics in this band. It is also customary to estimate the ratio between the power in each band and the total power of the signals, which is termed as the relative power in the corresponding band. Another common spectral measures used in EEG analysis are the ratio between the power in different bands. In the context of ADHD, the most commonly used one is the ratio of the power in the theta and beta bands (theta/beta ratio, TBR).
In this study, as we will use terms and concepts concerning linear and nonlinear systems/signals, we have considered appropriate to make a brief introduction to allow the reader a better understanding of them.
A short outline of linear and nonlinear dynamical systems
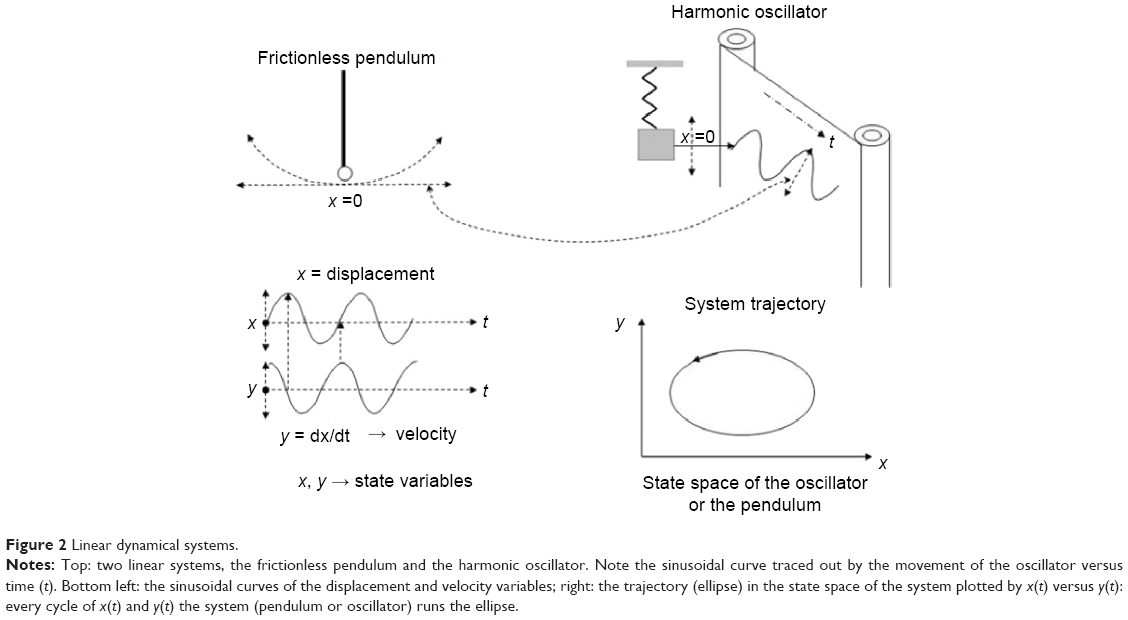
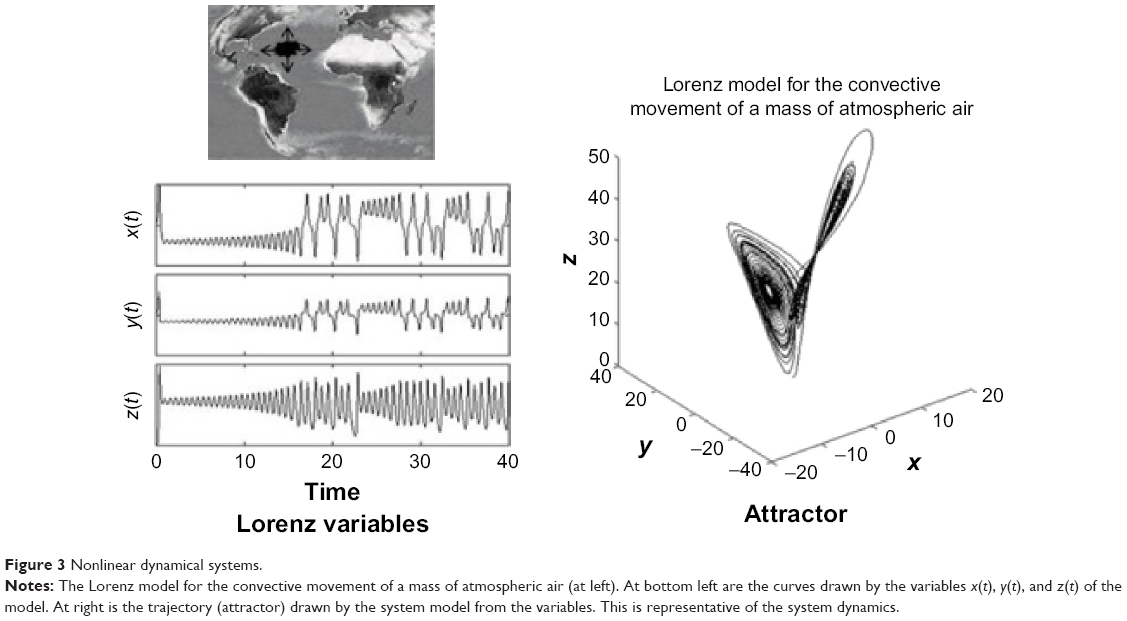
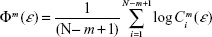
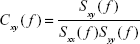
A dynamical system is a system, whether physical, biological, or otherwise (eg, an air mass or a neural network), whose state evolves with time over a state space according to a certain rule (its evolution equations). It can be studied from the analysis of the temporal evolution (signals) of the state variables that characterize its states. If the number of state variables is 2, 3, … m, their time evolution or dynamics will take place in a 2D, 3D, … mD space, respectively; the resulting picture is what we call the state space of the system representing the system trajectory. The latter is a geometric portrait that is, in the case of a low-dimensional linear system, usually very simple (eg, a 2D ellipse trajectory in the case of a frictionless pendulum or a harmonic oscillator, with variables x [displacement] and y [velocity] versus time [Figure 2]); for more complex and/or nonlinear systems such as the Lorenz model of the convective movement of masses of atmospheric air, the 3D trajectories produced by the state variables (x, y, z) are indicative that the dynamics of the system is more complex (the famous Lorenz butterfly).13 Despite its complexity, the trajectories are limited to a certain region of the 3D space, termed “the attractor”, which in this case is defined as “strange” (Figure 3).
 | Figure 2 Linear dynamical systems. |
 | Figure 3 Nonlinear dynamical systems. |
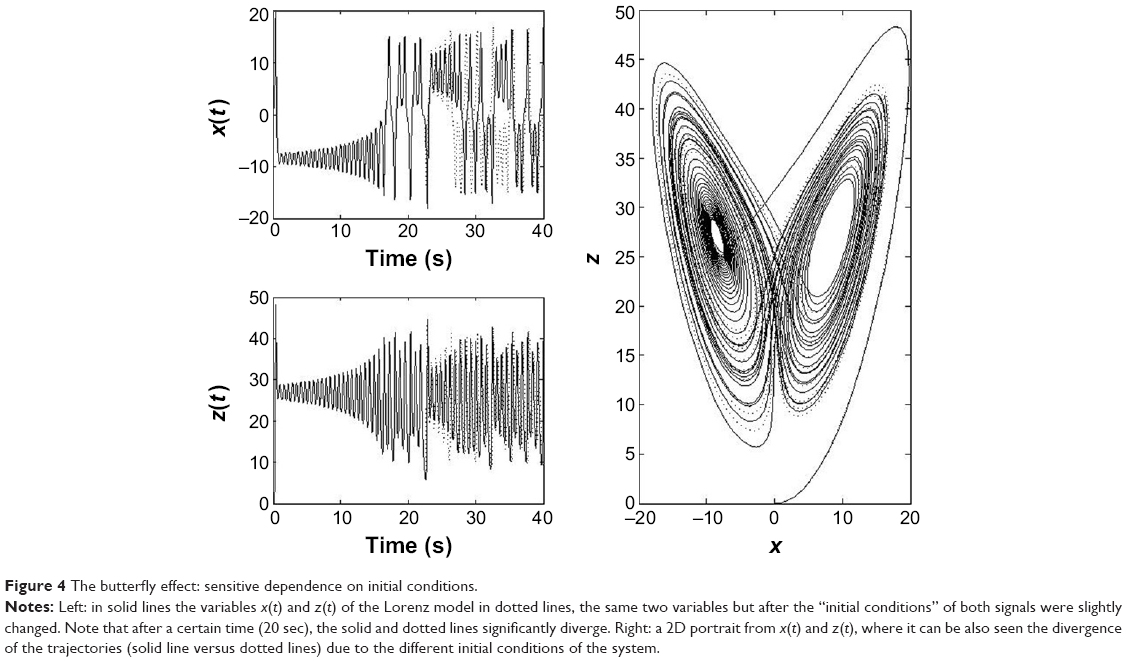
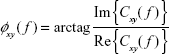
In the simple frictionless pendulum, the state variables (x, y) are sinusoidal signals of fixed frequency. In general, in the absence of measurement noise, the signals generated by simple linear systems have power density spectra with clear spectral peaks in well-defined frequency bands. This partly reflects the fact that, in linear systems, the responses to each of the inputs are independent of the existence of the other ones, and they present proportionality between stimulus and response. Both features derive from the superposition principle of linear systems. Besides, in deterministic linear systems, once the initial conditions are set, the values of the variables can be predicted at any time thereafter. For nonlinear systems such as the Lorenz model,13 the time evolution of state variables (x, y, z) are often nonsinusoidal irregular oscillations, with a power spectrum covering a wide frequency band without noticeable peaks. Furthermore, nonlinear systems do not verify the superposition principle: the response to one of the inputs is affected by the existence of the others, which means that small stimuli may produce large responses. Two important features characterize nonlinear systems: one is that the dimension of their attractos, often termed as strange, is fractal (noninteger) unlike what happens with the figures in Euclidean geometry. The second property concerns the so-called sensitivity to initial conditions, namely that a slight change in the initial conditions, with respect to the previous starting point, could produce, after a certain time, a significant departure of the new trajectory of the system with respect to the previous one (Figure 4). This has been often termed as the butterfly effect, due to the shape of Lorenz’s attractor. This behavior means that in nonlinear systems, it is only possible to predict the evolution of the system for short periods of time; this effect constitutes the outstanding property of deterministic chaos.
 | Figure 4 The butterfly effect: sensitive dependence on initial conditions. |
Therefore, despite chaotic, nonlinear systems present complex behavior, this complexity can be evaluated from the geometrical dimension of the set of trajectories in the state space (strange attractor), which is also indicative of the number of variables that characterize the system; their sensitivity to initial conditions can also be evaluated from the divergence of their trajectories in the state space.
The behavior of many physiological systems is closer to the nonlinear model than to the linear ones. Consider the cardiovascular system as an example, where variables such as blood pressure, heart rate, oxygen consumption, blood flow, etc, do not act independently in response to a given stimulus such as physical effort. The functioning of our brain, where the activation of different neural networks after a given stimulus are not independent (because the brain integrates information from multiple brain locations), is even closer to the nonlinear paradigm.
In the context of neurophysiology, we usually record output signals or responses from a physiological system in a given experimental condition or after a given stimulus. We may know the anatomical structure of the system that produces them, but little about the number of variables that characterize the system and even less (or nothing at all) about its dynamics. But since we do record the output signals of the system, we might wonder whether it is possible to extract from them quantitative information about the system that generates them. The answer to this question was provided by Takens’ time-delay embedding theorem, which mathematically proved that – under certain assumptions about the system – it is possible to reconstruct the original state space of the system from one single output signal.14 The method used (called “delay embedding technique”) is explained in the section “Nonlinear approach”. Once the state space of the system is reconstructed in the appropriate embedding dimension, we can make measurements of its entropy and complexity and also about its synchronization or interdependence with other systems, similar in nature, for assessing its FC with them.
Nonlinear approach
The linear methods reviewed hitherto allow characterizing properties of EEG in the frequency domain. Yet, as commented before, at the beginning of the 80s of the 20th century, the Dutch mathematician Takens14 nicely proved a theorem whereby, under general conditions, it is possible to reconstruct the state space of a complex dynamical system (even nonlinear systems in chaotic regime) using the consecutive values of one of its time series.14–16 Indeed, he demonstrated that, given the time series x(k), the delayed vectors defined as:
| (1) |

are equivalent to the original state vectors of the system that generates this time series. In Equation 1, m is the so-called embedding dimension, which has to be at least equal to the dimension of the original system, and τ is the delay time, which has to ensure that two consecutive components of the vector are (almost) independent. Usually, m is estimated using the heuristic approach termed false nearest neighbors, whereas τ can be estimated using the autocorrelation or the auto mutual information function of the data (Figure 5 shows an example of state space reconstruction).17
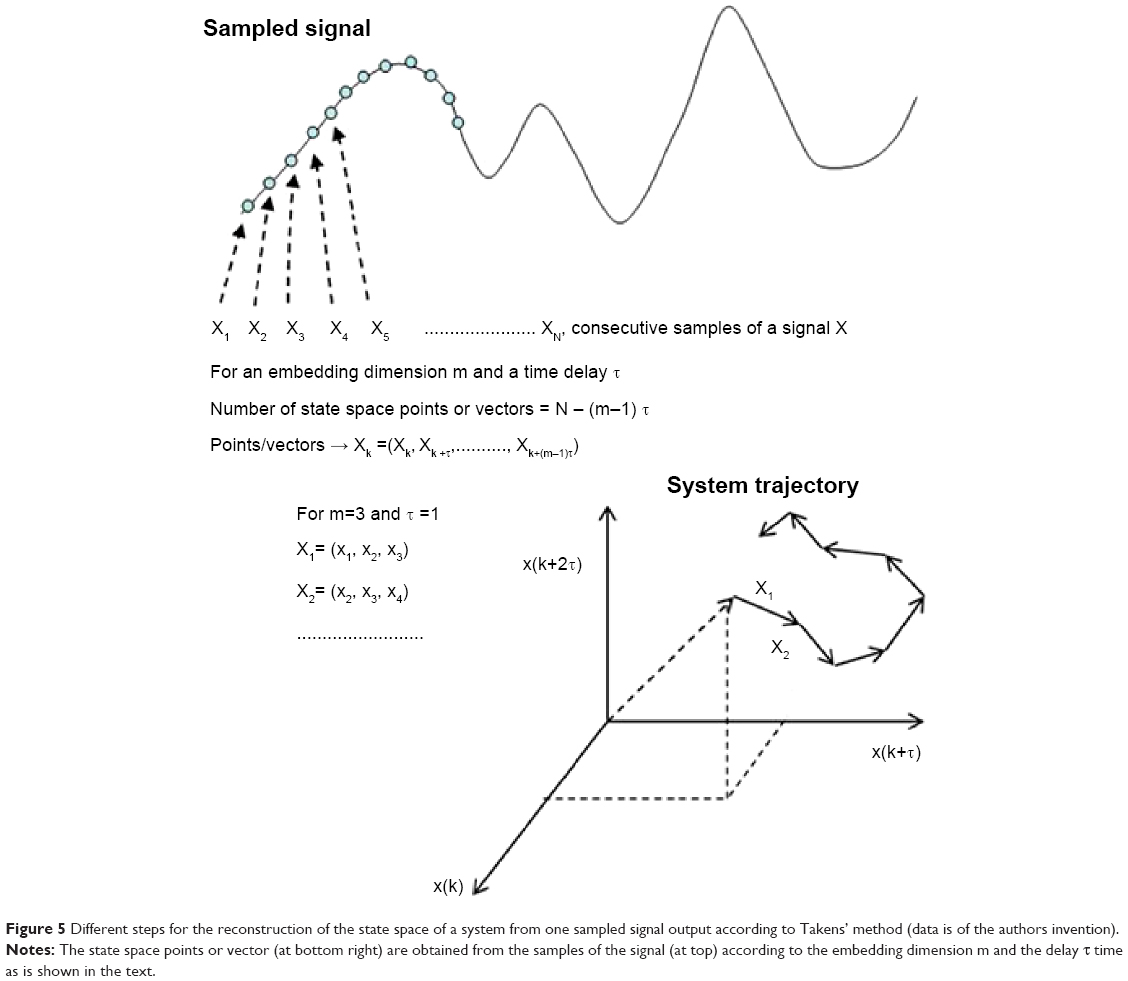 | Figure 5 Different steps for the reconstruction of the state space of a system from one sampled signal output according to Takens’ method (data is of the authors invention). |
This celebrated result paved the way to characterize the topological features of a dynamical systems whose state equations are unknown (as it is the case for most natural systems) from one single signal. Since then, many studies have analyzed the nonlinear properties of a single EEG channel, such as its correlation dimension, largest Lyapunov exponent, entropy, and so on, and how they change in different stages (such as sleep versus awake) or as a result of different pathologies (we refer to Stam18 for an extensive review).
Among these measures, those estimating the complexity of the data19 (such as the approximate entropy20 or the Lempel-Ziv complexity [LZC]21) have been used in the study of ADHD from neurophysiological data.22,23
Approximate entropy
A useful measure to characterize the dynamic of a (possibly nonlinear) system from the signals it generates is the rate at which this system creates information (or the degree of uncertainty on the next measure given the previous history). Grassberger and Procaccia developed an efficient algorithm to estimate such a rate (termed the entropy of the time series).24 Later on, Pincus proposed a modification of this definition to deal with short time series from (possibly nonchaotic) dynamical systems.25 Namely, the approximate entropy (ApEn) is defined as:
| (2) |

where m is the embedding dimension as in Equation 1, N is the number of data points, ε is a distance, and
| (3) |
where Cim (ε) is the probability of finding a reconstructed vector closer to Xi than the prefixed distance ε. By taking ε ≈0.2 SD (standard deviation of the time series), ApEn provides a reliable estimation of the complexity of a system even for short time series (N=1,000 data points), which has proven useful to analyze EEG data.26 The ApEn has been proposed as a measure of the level of EEG desynchronization or the interactive dependencies among multiple frequency components during cognitive processing.
Lempel-Ziv complexity
The other complexity measure applied to extracranially recorded neurophysiological data to study ADHD23 (albeit magnetoencephalography [MEG] instead of EEG) is the LZC.21 The LZC is a measure of the complexity of the local synchronized activity as reflected by the profile of the frequency spectrum. It simply counts the number of distinct substrings and their rate of recurrence along the time series. More complex data has a lower rate of recurrence and a higher value of LZC.
Multivariate measures
The measures presented hitherto are very useful in characterizing the features of individual EEG channels. However, they do not provide any information on the degree of statistical dependence (FC)27 between two EEG channels. Yet the study of FC has become a necessary step to extract information about EEG activity, which cannot be inferred from the pattern of activation/complexity of each individual channel. Its assessment, however, requires a different set of (bi- or multivariate) techniques, which allow the analysis of relationship between (or among) more than one simultaneously recorded EEG channels. We briefly describe henceforth the FC indices most commonly used for the study of ADHD from EEG data.
The term FC is used to refer to the statistical interdependence between two EEG channels or cortical areas or from the average or global interdependence of a channel or area of the cortex evaluated from a set of pairs of EEG channels associated with that area. The FC assessed by means of the interdependence between two EEG channels is in agreement with the concept of FC given by Lang et al28 who defined FC as the temporal statistical correlation or dependence between spatially remote neurophysiological events in distributed neuronal groups and areas. FC was initially used by Friston et al29 in the analysis of positron emission tomography images for assessing the existence of statistical dependence between voxel time series. Presently, the term FC is used also to refer to any measure of interdependence between cortical EEG channels. Indeed, although EEG activity may be contaminated by multiple sources and by the volume-conduction effects, the use of tailored EEG preprocessing methods and FC assessment techniques are useful tools to estimate the degree of statistical dependence between EEG data. Such methods, which will be detailed later, include (but are not restricted to): 1) the calculation of coherence and/or phase synchronization in specific frequency bands, 2) the computation of the generalized nonlinear indices of synchronization by using efficient and sophisticated algorithms, and finally 3), the use of procedures such as the surrogate data test, to rule out that the results of the FC indices are not different to what would be expected by chance. Furthermore, in a recent paper by Nunez et al30 where they had discussed FC in the human brain, they stated: “Cross-scale interactions of local, regional, and global networks are apparently responsible for much of EEG’s oscillatory behavior”. They also concluded that “Combined EEG and high resolution EEG can provide distinct multi-scale estimates of functional connectivity in both healthy and diseased brains with measures like frequency and phase spectra, covariance, and coherence”.
Linear approach
The coherence spectral function is a measure of the linear correlation, both in amplitude and phase, between two signals at a given frequency. In other words, the coherence is a measure of linear FC or temporal correlation between different brain regions as a function of the frequency.
It is obtained from the (complex) coherency function between two signals x and y, which is defined as follows:
| (4) |
where Sxy( f ) is the PSD cross-spectrum between these signals, Sxx( f ) and Syy( f ) are the respective PSD auto-spectra, and f is the discrete frequency.
The coherence is simply the squared modulus of Equation 4. For each f, coherence values range between 0 (no correlation) and 1 (full linear correlation). The mean value of the coherence for all the frequencies included in that band is taken as the coherence in a certain frequency band. As an example, in Figure 1A–C, the auto PSD of two EEG signals from two central channels are shown; the cross-PSD and coherence of both signals are also shown.
The argument of the coherency provides an estimate of the phase delay between the signals:
| (5) |
where Im() and Re() are the imaginary and the real part of Cxy( f ), respectively. The imaginary part of the coherency has been proposed as a robust index of interdependence between EEG data, robust to volume conduction,31 although to the best of our knowledge, this index has not yet been applied to ADHD research.
The nonlinear approach
As happens with the univariate techniques, in the case of the multivariate ones, the linear approach only cover a part of the information that can be extracted from the EEG. In the case of FC studies, the nonlinear approach reviewed earlier also allows for a sophisticated assessment (ie, beyond the “traditional” one of the coherence or the cross correlation function) of the degree of statistical dependence between two EEG channels, x and y. For this purpose, delayed state vectors Xi and Yi are first reconstructed from x and y, as in Equation 1. Then, let ai,j and bi,j be the time indices of the k nearest neighbors of Xi and Yi, respectively. The existence of FC between both EEGs entails that vectors close in the state space of X are also close in Y, which can be measured using different bivariate indices.32,33 Figure 1D shows an example of the state space reconstructed of two EEG signals from which the nonlinear interdependence measures are derived (Figure 5).
For the study of ADHD from EEG data, one such index, termed fuzzy synchronization likelihood (FSL), has been recently used.34–36 This index, similar to its non-fuzzy version, the well-known synchronization likelihood (SL),37 sacrifices the ability to provide information on the directionality of the connectivity in return for greater robustness against the individual features of the data in the assessment of FC. According to Ahmadlou et al,35 FSL is more reliable than SL for discriminating patients with ADHD from healthy individuals. More recently, SL have been also applied to study ADHD in a frequency-specific way36 and in the framework of complex network theory as applied to EEG38,39 (refer section “From FC indices to complex networks”). A different, yet closely related index, this one based in rank statistics40 has also proven successful to estimate EEG FC in ADHD subjects and the difference with age-matched control subjects.41 All these indices of generalized synchronization measure the degree of (possibly nonlinear) temporal interdependence between different brain regions in the reconstructed state spaces.
From FC indices to complex networks
A natural step forward to extract information from the set of bivariate FC indices between all possible pairs of EEG channels consists in analyzing the whole interdependence matrix as if it were the adjacency matrix of a complex network. Indeed, the set of EEG electrodes/sources and the bivariate FC indices between them closely resembles a graph, where the EEG electrodes/sources are the nodes and the FC indices are the links between them (refer to Stam,42 Papo et al,43 Fornito et al,44 De Vico Fallani et al45 for recent reviews on the application of this idea on clinical neurology). Such an approach has become very popular in the past decade, so much so that nowadays, almost every study using high density (>32) EEG setups includes, one way or another, some type of complex network analysis. Recent ADHD studies of multivariate EEG channels participate of this trend, which is also evident in MEG and fMRI studies.35,40
There is a plethora of graph theoretic measures that can be used to characterize different aspects of the complex brain network.46,47 However, the most popular ones can be roughly divided into three categories: first, those assessing the centrality of a node, that is, its importance in the network, such as the degree (number of nodes it is connected to) or its weighted equivalent, the strength; second, those assessing the segregation of a node, with the clustering coefficient being the more popular by far in this group; and finally, those ones measuring the way in which a node (or the whole network) integrates information, such as the average shortest path length. All these indices can be defined in different ways, depending, for example, on whether the links of the reconstructed network are weighted or unweighted. We refer the interested reader to the appropriate literature for details.43,45–47
Classification methods for clinical evaluation of EEG indices
Once the relevant features have been extracted from the EEG using any of the techniques described earlier (or combination thereof), it only remains to use them to better understand the signatures of ADHD. For this purpose, there are basically two options. One is the traditional approach of applying a suitable statistical test to compare two groups of subjects (ADHD and healthy controls) and check what are the most important differences between them. A second, closely related yet not quite the same one, consists in training a classifier (ie, a mathematical function), which first detects the most salient features of each group and then use them to classify the subjects as either control or ADHD. This approach falls in the research field usually termed as “machine learning”. It is beyond the scope of the present review to give a detailed account of such a vast and rapidly expanding field. Instead we refer the interested reader to the specialized literature.48,49 We will only briefly review here the basic ideas underlying this approach, with emphasis on those techniques most often used in ADHD studies from EEG data.
Training of the classifier
Regardless of the classification algorithm used, the process of defining the optimal classification function (classifier) always involves two steps. The first one is the training of the classifier, whereby the appropriate measures (eg, the complexity estimations of a set of electrodes or the power in a given frequency band) is fed to the classifier, which uses them to tune its internal parameters according to a given cost function. The second one is the validation of the classifier, which consists in determining how well it does its work of classifying the data. Training and validation are commonly used on different sets of data, to prevent overfitting, and the training process often includes the reduction in the dimensionality of the data, to minimize the set of features that are taken into account in the classification (implicitly following the well-known Occam’s razor principle). Among the most used methods in ADHD, we can name the logistic regression26,41 and the linear discriminant analysis.36 Again, we refer to the relevant literature for details.48,49
Receiving operator curves
Among the many validation methods for the classifier, the receiving operator curve (ROC) is the most widely used in the current framework, very likely because its visual character facilitates its interpretation. A ROC is a graphical representation of the true positive rate of the classifier (also known as its sensitivity, or the ratio of correctly classified subjects) against the false positive rate (or 1-specificity, ie, the number of incorrectly classified subjects) as a function of the discrimination threshold. The ideal classifier would have a sensitivity and a specificity of 1 (all the subjects will be perfectly classified). Real classifiers, however, present a trade-off between both desirable features: the more its sensitivity, the lower its specificity. Although there are many ways of quantifying the quality of a classifier using a ROC,50 the usual one consists in estimation of the normalized area under the curve. Thus, the closer the area under the curve is to 1, the better the classifier.
Main results obtained from univariate measurements
Once we have briefly introduced the mathematical techniques most commonly used to analyze the ADHD signatures of EEG data, we will review in this section, the main results obtained hitherto with each of these techniques, with special emphasis in their possible clinical utility, which, for lack of a more specific definition, we will understand henceforth as the ability of the corresponding technique to distinguish ADHD subjects from control ones using some classification technique. In Table 1, the main works and results using univariate measurements for clinical ADHD diagnosis are summarized, which will be discussed below in the Linear and Nonlinear approach sections.
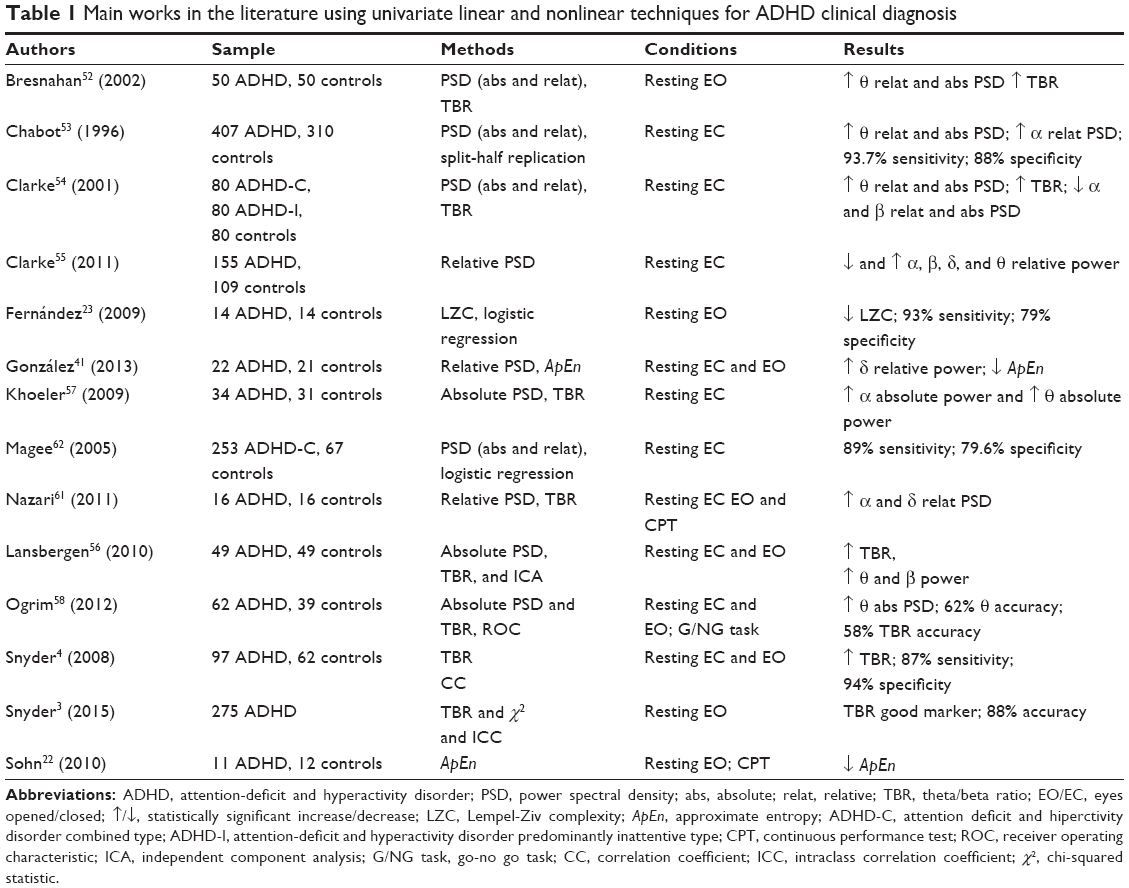 | Table 1 Main works in the literature using univariate linear and nonlinear techniques for ADHD clinical diagnosis |
Linear approach
EEG spectral power variations are typically dominated by distinct changes in power in a few frequency bands. In ADHD, the main frequency bands that have been studied are delta (<4 Hz), theta (4–7 Hz), alpha (8–12 Hz), beta (13–25 Hz), and TBR. Since Satterfield et al,51 one of the most consistent results in the field is that ADHD subjects show an increment of the power in the theta band as compared to age-matched controls. This increase occurs both in absolute power and in the relative power and is usually located in the frontocentral region of the cortex.52–58 Elevated theta power, however, may be a nonspecific marker of cortical dysfunction common to other disorders, such as sleep behavior disorders, schizophrenia and so on.59,60 Ogrim et al58 have analyzed the clinical utility of this EEG signature and found that the theta power had an accuracy of 62% to differentiate between ADHD and controls subjects.57 Less frequently, experts have also found differences between ADHD and controls subjects in the frequency bands delta, alpha, and beta. Power in the delta band is usually increased in ADHD.40,54,58 In contrast, power in the alpha and beta bands are usually decreased in ADHD, although literature on the effect of ADHD in these bands are somehow inconsistent.52–56,58
The TBR is the most widely used (both power-related and overall) EEG index in neurophysiological studies of ADHD and its clinical utility has been thoroughly assessed. Most studies find that ADHD subjects present a higher TBR than control subjects.4,48,53,56 However, there are several studies in the literature where the TBR did not discriminate between the control and ADHD groups.55,57,58 Moreover Lansberguen et al57 found that the increase in TBR can be considered as a nonspecific measure. They observed that this increase does not occur when using the individualized frequency bands based on individual alpha peak frequency; therefore, it is possible that the combination of several distinct neurophysiological subgroups is related to this EEG index.56 Very recently, a clinical cohort study3 evaluated the utility of TBR in a large group (275 children and adolescents) when it is integrated into the usual protocol for ADHD diagnosis. These authors found that the diagnostic accuracy increased an outstanding 27% (from 61% to 88%) when the usual protocol for ADHD diagnosis was administered along with the TBR. This result seems to reinforce the role of TBR as a useful EEG-based biomarker of ADHD.
Some of these studies have associated the following functional significance to spectral power: arousal disorders, ADHD maturational lag, and different symptoms of the disorder.52,53,55,56,61 Each study has associated these functional significances with different frequency bands, but all these interpretations have been indistinctly associated with all frequency bands.
Based on the previous results, we can conclude that the univariate linear measures generally discriminate between ADHD subjects and controls,3,4,54,55,61,62 but a clear relationship between EEG power spectrum measurements and ADHD symptoms has not been found.52,53,55,56,61
Nonlinear approach
As indicated in the section “A short outline of linear and nonlinear dynamical systems”, univariate nonlinear EEG measures have been comparatively less studied in the case of ADHD. These studies analyze the differences between ADHD and controls on EEG complexity. Fernández et al23 calculated the LZC from MEG records in ADHD and controls for each individual sensor at rest with eyes open (EO). They also estimated the average LZC for five groups of sensors (anterior, central, left lateral, right lateral, and posterior); they found that LZC decreased in ADHD subjects. Furthermore, Sohn et al22 recorded EEG in eleven ADHD and 12 age-matched healthy boys both at rest with EO and during a continuous performance test (CPT). They calculated ApEn as in Equation 2 and found that EEG complexity was reduced in ADHD during the CPT, mainly in the frontal electrodes. In turn, Gonzalez et al41 also estimated the ApEn from EEG activity of 22 ADHD and 21 healthy controls at rest during eyes open and eyes closed. They found a reduction in ApEn in ADHD during the resting condition of open eyes but only for one single channel (O2).
In summary, the complexity of the EEG decreased in ADHD subjects as compared to controls; this phenomenon is mainly observed when subjects are in a condition of higher arousal state (EO or making a task).22,23,41 To the best of our knowledge, the clinical utility of complexity estimators has been studied only by Fernández et al23 who found that age-corrected LZC values of the anterior sensors presented a sensitivity of 93% and a specificity of 79% to distinguish ADHD from controls.
Altogether, these results suggest that the EEG of ADHD subjects present reduced complexity as compared to age-matched healthy subjects, which can be useful to classify them from neurophysiological data, although more EEG studies are necessary to confirm the validity of this approach in clinical applications.
Main results obtained from multivariate measurements
In Table 2, the main works and results using multivariate measurements for clinical ADHD diagnosis are summarized, which will be discussed below.
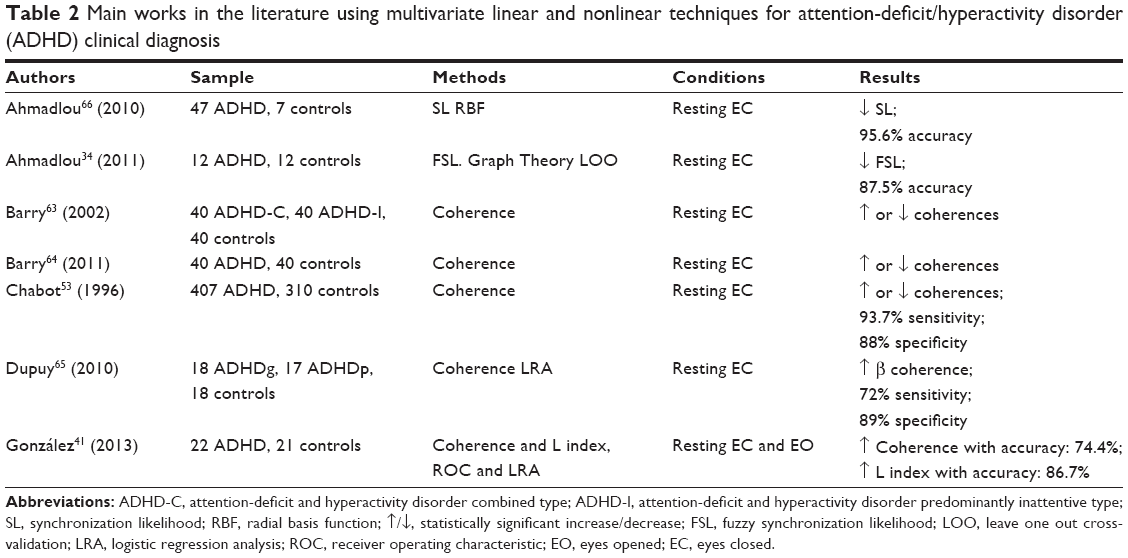 | Table 2 Main works in the literature using multivariate linear and nonlinear techniques for attention-deficit/hyperactivity disorder (ADHD) clinical diagnosis |
Linear approach
In recent years, coherence (Equation 4) has been much studied in the field of ADHD. There is a referent group from Brain & Behaviour Research Institute and Department of Psychology of the University of Wollongong, Australia, studying the EEG coherence in ADHD.63,64 They have analyzed EEG coherence in different interelectrodes distances (short, medium, and larger), intrahemispheric and interhemipheric electrodes pairs, cerebral regions (frontal, temporal, and central/parietal/occipital), and frequency bands (delta, theta, alpha and beta). The different electrode pairs allow finding changes in coherence that would not be observed with global averages. The intra and interhemispheric pairs provide information about hemispheric lateralization and specialization. The pairings for cerebral regions give an idea about the cognitive functions that may be compromised. In general, the EEG coherence in ADHD can either increase or decrease depending on the paired brain regions. Notably, one of the most replicated findings is that theta coherence increases in ADHD as compared to healthy controls, especially in the frontal and central/parietal/occipital interhemispheric connections.63,64 Despite the growing interest in the study of EEG coherence in ADHD, there are few results on its clinical utility. One of the first studies to verify it was carried out by Chabot and Serfontein.53 From 407 ADHD and 310 controls, these authors calculated intra and interhemispheric EEG coherence in the frequency bands delta, theta, alpha, and beta. Again, they found that, depending on the paired brain regions, EEG coherence in ADHD may increase or decrease, and this feature presented a sensitivity and specificity of 93.7% and 88%, respectively. Dupuy et al65 following the methodology of the University of Wollongong, observed that ADHD, with good response to methylphenidate (MPH), experienced an increase in EEG beta coherence. In addition, they observed differences between ADHD and controls in the intrahemispheric EEG coherences using short–medium distances between electrode pairs, with a sensitivity and a specificity of 72% and 89%, respectively. Gonzalez et al41 following the methodology of Chabot and Serfontein,53 found that EEG coherence in ADHD increased in certain brain regions with an accuracy of 74.4%. As with the ApEn index, the results of the clinical utility of the EEG coherence for diagnosing ADHD are promising, but more studies to replicate the results, a greater consensus in the matches between channels and classification techniques used, are necessary.
Nonlinear approach
The studies about the differences between ADHD and controls using nonlinear EEG multivariate measures are scarce. In general, they often use measures of EEG synchronization, but the measures used are heterogeneous. Nevertheless the results of different studies are similar: the EEG synchronization is usually decreased in ADHD.34,41,66
The clinical utility of EEG synchronization indices in the diagnosis of ADHD has been even less tested. Ahmadlou and Adeli66 studied differences in EEG synchronization between ADHD and control subjects using SL; this index decreased in ADHD, especially in posterior cortical areas at certain EEG bands, with an accuracy of 95.6%. The following year, the same authors34 measured EEG synchronization using the FSL in a group of 12 ADHD and other group of 12 controls; the FSL, which is decreased in ADHD in posterior and anterior brain areas, had a diagnostic accuracy of 87.50%. Later on, Gonzalez et al41 used the index of generalized synchronization (index L) to measure EEG synchronization; they observed that ADHDs presented higher values of L as compared to controls in certain cerebral regions (mainly in O1–C4 and C3–T4) with an accuracy of 86.7%.
Differential diagnosis and clinical monitoring of the ADHD by EEG measures
The sections “Main results obtained from univariate measurements” and “Main results obtained from multivariate measurements” provided information about the EEG measures capacity to discriminate between ADHD and healthy subjects. There are few studies that investigate the ability of EEG measures to discriminate between ADHD and other mental disorders. Bresnahan and Barry52 analyzed the absolute and relative power in an ADHD group, a non-ADHD group (patients with some symptoms of ADHD), and a healthy control group. When they compared the ADHD with the non-ADHD group, they found that both had different profiles of EEG power in different frequency bands. On the other hand, increase in theta power is not a specific marker of ADHD, but it is also associated with other disorders.59,60 We have not found in the literature EEG FC studies about this issue.
Other studies have assessed the differences in EEG profile in ADHD subtypes and comorbid disorders. Two studies have shown differences between ADHD subjects with and without comorbid disorder; specifically, the group without comorbid disorder had a lower intrahemispheric coherence for shorter distances in the delta band.67,68 In the literature, it has been found that ADHD and Atention Deficit Disorder (ADD) had similar EEG profiles, but the ADHD subjects presented greater differences versus controls than the ADD group.63,69,70 The effect of MPH in univariate and multivariate EEG measures in ADHD has been studied. MPH effect in ADHD EEG measures is not clear and neither is it clear in the relationship between cognitive/behavioral changes that can be observed after treatment.71–76 Furthermore, it has been found that ADHD subjects with good response to MPH treatment differ from those with a poor response in EEG activity and connectivity.65,77,78 Although the effect of MPH on the ADHD EEG profile is unclear, these studies suggest that EEG measures could be useful to assess which cases of ADHD are worth treating with MPH and to follow up patient’s progress during the therapy.
Prospects for future times
The results reviewed in this work demonstrate that quantitative EEG measures have clinical utility in the diagnosis of ADHD because they can improve the accuracy and validity of the traditional cognitive tests used for this purpose. Thus, within the revised measures, the TBR is the most studied and considered to be the most useful in ADHD clinical. The other EEG measures revised here show that they have at present a good potential to be considered in the assessment of ADHD according to the results already obtained. However, we think they need to be further validated in the clinical context for knowing their real accuracy and extent. The use of more sophisticated machine learning classification methods such as Support Vector Machines or Bayesian Networks, which can handle highly dimensional multimodal features, would also represent an important step in this direction, as they will allow to combine, for example, power spectral measures with FC indices to improve classification accuracy.
Apart from the indices reviewed hitherto, the temporal variability of the FC is a new EEG measure that has been recently introduced for the assessment of ADHD.79,80 The method involves defining an index of variability of the ensemble of FC indices along several EEG segments in the same experimental condition, to assess the dynamics of the FC. The study of Barttfeld et al79 was the first to study the EEG profile in ADHD using this method. They found that ADHD had a higher level of inherent variability of EEG FC than controls. In the latest work by our group,80 we compared this method with the traditional EEG analysis and found that the temporal variability appears to discriminate better between ADHD and controls subjects. We also noted that the variability of EEG FC was higher in ADHD subjects than in controls. The results with this method are promising, but again additional work is necessary to confirm its possible clinical utility.
Acknowledgments
The authors acknowledge the financial support of the European Regional Development Fund (ERDF) through a grant from the Instituto de Salud Carlos III, (FIS) (Spanish Ministry of Health and Consumption, Grant No PS09/00856) and the Spanish Ministry of Economy and Competitiveness through grant TEC2012-38453-CO4-03.
Disclosure
The authors report no conflicts of interest in this work.
References
APA. Manual Diagnóstico y Estadístico de los Trastornos Mentales. Texto Revisado. DSM IV TR [Diagnostic and Statistical Manual of Mental Disorders]. Masson, editor. Washington, DC: American Psychiatric Association; 2001. | ||
APA. Diagnostic and Statistical Manual of Mental Disorders: DSM-5. Washington, DC: American Psychiatric Association; 2013. | ||
Snyder SM, Rugino TA, Hornig M, Stein MA. Integration of an EEG biomarker with a clinician’s ADHD evaluation. Brain Behav. 2015;5:e00330. | ||
Snyder SM, Quintana H, Sexson SB, Knott P, Haque AF, Reynolds DA. Blinded, multi-center validation of EEG and rating scales in identifying ADHD within a clinical sample. Psychiatry Res. 2008;159:346–358. | ||
Castellanos F, Lee P, Sharp W, Jeffries N, Greenstein D, Clasen L. Developmental trajectories of brain volume abnormalities in children and adolescents with attention-deficit/hyperactivity disorder. JAMA. 2002;288:1740–1748. | ||
Tremols V, Bielsa A, Soliva J, et al. Differential abnormalities of the head and body of the caudate nucleus in attention deficit hyperactivity disorder. Psychiatry Res. 2008;163:270–278. | ||
Batty MJ, Liddle EB, Pitiot A, et al. Cortical gray matter in attention-deficit/hyperactivity disorder: a structural magnetic resonance imaging study. J Am Acad Child Adolesc Psychiatry. 2010;49:229–238. | ||
Cao X, Cao Q, Long X, et al. Abnormal resting-state functional connectivity patterns of the putamen in medication-naive children with attention deficit hyperactivity disorder. Brain Res. 2009;1303:195–206. | ||
Castellanos FX, Margulies DS, Kelly C, et al. Cingulate-precuneus interactions: a new locus of dysfunction in adult attention-deficit/hyperactivity disorder. Biol Psychiatry. 2008;63(3):332–337. | ||
Tian L, Jiang T, Wang Y, et al. Altered resting-state functional connectivity patterns of anterior cingulate cortex in adolescents with attention deficit hyperactivity disorder. Neurosci Lett. 2006;400:39–43. | ||
Tomasi D, Volkow ND. Abnormal functional connectivity in children with attention deficit/hyperactivity disorder. Biol Psychiatry. 2012; 71:443–450. | ||
Rubia K, Halari R, Cubillo A, Mohammad A, Brammer M, Taylor E. Methylphenidate normalizes activation and functional connectivity deficits in attention and motivation networks in medication-naive children with ADHD during a rewarded continuous performance task. Neuropharmacology. 2009;57:640–652. | ||
Lorenz EN. Deterministic nonperiodic flow. J Atmos Sci. 1963;20:130–141. | ||
Takens F. Detecting strange attractors in fluid turbulence. In: Rand D, Young LS, editors. Dynamical Systems and Turbulence. Berlin: Springer; 1981:366–381. | ||
Pecora LM, Moniz L, Nichols J, Carroll TL. A unified approach to attractor reconstruction. Chaos. 2007;17:013110. | ||
Sauer T, Yorke JA, Casdagli M. Embedology. J Stat Phys. 1991;65:579–616. | ||
Hegger R, Kantz H, Schreiber T. Practical implementation of nonlinear time series methods: the TISEAN package. Chaos. 1999;9:413–435. | ||
Stam CJ. Nonlinear dynamical analysis of EEG and MEG: review of an emerging field. Clin Neurophysiol. 2005;116:2266–2301. | ||
Takahashi T. Complexity of spontaneous brain activity in mental disorders. Prog Neuropsychopharmacol Biol Psychiatry. 2013;45:258–266. | ||
Pincus SM. Approximate entropy as a measure of system complexity. Proc Natl Acad Sci U S A. 1991;88:2297–2301. | ||
Lempel A, Ziv J. On the complexity of finite sequences. IEEE Information Theory Group. 1976;22:75–81. | ||
Sohn H, Kim I, Lee W, et al. Linear and non-linear EEG analysis of adolescents with attention-deficit/hyperactivity disorder during a cognitive task. Clin Neurophysiol. 2010;121:1863–1870. | ||
Fernández A, Quintero J, Hornero R, et al. Complexity analysis of spontaneous brain activity in attention-deficit/hyperactivity disorder: diagnostic implications. Biol Psychiat. 2009;65:571–577. | ||
Grassberger P, Procaccia I. Estimation of the Kolmogorov entropy from a chaotic signal. Phys Rev A. 1983;28:2591–2593. | ||
Pincus S. Approximate entropy (ApEn) as a complexity measure. Chaos. 1995;5:110–117. | ||
Pincus SM. Approximate entropy as a measure of irregularity for psychiatric serial metrics. Bipolar Disord. 2006;8:430–440. | ||
Friston KJ. Functional and effective connectivity: a review. Brain Connect. 2011;1:13–36. | ||
Lang EW, Tomé AM, Keck IR, Górriz-Sáez JM, Puntonet CG. Brain connectivity analysis: a short survey. Comput Intel Neurosc. 2012;2012:1–21. | ||
Friston KJ, Frith CD, Liddle PF, Frackowiak RSJ. Functional connectivity: the principal-component analysis of large (PET) data sets. J Cereb Blood Flow Metab. 1993;13(1):5–14. | ||
Nunez PL, Srinivasan R, Fields RD. EEG functional connectivity, axon delays and white matter disease. Clin Neurophysiol. 2015;126:110–120. | ||
Nolte G, Bai O, Wheaton L, Mari Z, Vorbach S, Hallett M. Identifying true brain interaction from EEG data using the imaginary part of coherency. Clin Neurophysiol. 2004;115:2292–2307. | ||
Pereda E, Quiroga RQ, Bhattacharya J. Nonlinear multivariate analysis of neurophysiological signals. Prog Neurobiol. 2005;77:1–37. | ||
Wang HE, Bénar CG, Quilichini PP, Friston KJ, Jirsa VK, Bernard C. A systematic framework for functional connectivity measures. Front Neurosci. 2014;8:405. | ||
Ahmadlou M, Adeli H. Functional community analysis of brain: a new approach for EEG-based investigation of the brain pathology. Neuroimage. 2011;58:401–408. | ||
Ahmadlou M, Adeli H, Adeli A. Graph theoretical analysis of organization of functional brain networks in ADHD. Clin EEG Neurosci. 2012;43:5–13. | ||
Ahmadlou M, Rostami R, Sadeghi V. Which attention-deficit/hyperactivity disorder children will be improved through neurofeedback therapy? A graph theoretical approach to neocortex neuronal network of ADHD. Neurosci Lett. 2012;516:156–160. | ||
Stam CJ, Van Dijk BW. Synchronization likelihood: an unbiased measure of generalized synchronization in multivariate data sets. Physica D. 2002;163:236–251. | ||
Liu T, Lin P, Chen Y, Wang J. Electroencephalogram synchronization analysis for attention deficit hyperactivity disorder children. BioMed Mater Eng. 2014;24:1035–1039. | ||
Liu T, Chen Y, Lin P, Wang J. Small-world brain functional networks in children with attention-deficit/hyperactivity disorder revealed by EEG synchrony. Clin EEG Neurosci. 2014;46(3):183–191. | ||
Chicharro D, Andrzejak RG. Reliable detection of directional couplings using rank statistics. Phys Rev E. 2009;80:26217–26217. | ||
González JJ, Méndes LD, Mañas S, Duque MR, Pereda E, De Vera L. Performance analysis of univariate and multivariate EEG measurements in the diagnosis of ADHD. Clin Neurophysiol. 2013;124:1139–1150. | ||
Stam CJ. Modern Network Science of Neurological Disorders. London: Nature Publishing Group; 2014. | ||
Papo D, Buldú J, Boccaletti S, Bullmore ET. Complex network theory and the brain. Philos Trans R Soc Lond B Biol Sci. 2014;369: 20130520–20130520. | ||
Fornito A, Zalesky A, Breakspear M. The connectomics of brain disorders. Nat Rev Neurosci. 2015;16:159–172. | ||
De Vico Fallani F, Richiardi J, Chavez M, Achard S, Fallani FDV. Graph analysis of functional brain networks: practical issues in translational neuroscience. Philos Trans R Soc Lond B Biol Sci. 2014;369:20130521–20130521. | ||
Newman MEJ. Networks: An Introduction. Oxford: Oxford University Press; 2010. | ||
Rubinov M, Sporns O. Complex network measures of brain connectivity: uses and interpretations. Neuroimage. 2010;52:1059–1069. | ||
Bishop CM. Pattern Recognition and Machine Learning. New York: Springer; 2006. | ||
Govindaraju V, Rao CR. Machine Learning: Theory and Applications. Amsterdam; Boston: Elsevier/North Holland; 2013. | ||
Fawcett T. An introduction to ROC analysis. Pattern Recognit Lett. 2006;27(8):861–874. | ||
Satterfield JH, Cantwell DP, Satterfield BT. Pathophysiology of the hyperactive child syndrome. Arch Gen Psychiatry. 1974;31:839–844. | ||
Bresnahan SM, Barry RJ. Specificity of quantitative EEG analysis in adults with attention deficit hyperactivity disorder. Psychiatry Res. 2002;112(2):133–144. | ||
Chabot RJ, Serfontein G. Quantitative electroencephalographic profiles of children with attention deficit disorder. Biol Psychiatry. 1996;40(10):951–963. | ||
Clarke AR, Barry RJ, McCarthy R, Selikowitz M. Age and sex effects in the EEG: differences in two subtypes of attention-deficit/hyperactivity disorder. Clin Neurophysiol. 2001;112:815–826. | ||
Clarke AR, Barry RJ, Dupuy FE, et al. Behavioural differences between EEG-defined subgroups of children with attention-deficit/hyperactivity disorder. Clin Neurophysiol. 2011;122:1333–1341. | ||
Koehler S, Lauer P, Schreppel T, et al. Increased EEG power density in alpha and theta bands in adult ADHD patients. J Neural Transm. 2009;116:97–104. | ||
Lansbergen MM, Arns M, van Dongen-Boomsma M, Spronk D, Buitelaar JK. The increase in theta/beta ratio on resting-state EEG in boys with attention-deficit/hyperactivity disorder is mediated by slow alpha peak frequency. Prog Neuropsychopharmacol Biol Psychiatry. 2010;35:47–52. | ||
Ogrim G, Kropotov J, Hestad K. The quantitative EEG theta/beta ratio in attention deficit/hyperactivity disorder and normal controls: sensitivity, specificity, and behavioral correlates. Psychiatry Res. 2012;198:482–488. | ||
Fantini ML, Gagnon JF, Petit D, et al. Slowing of electroencephalogram in rapid eye movement sleep behavior disorder. Ann Neurol. 2003;53:774–780. | ||
Sponheim SR, Clementz BA, Iacono WG, Beiser M. Resting EEG in first-episode and chronic schizophrenia. Psychophysiology. 1994;31(1):37–43. | ||
Nazari MA, Wallois F, Aarabi A, Berquin P. Dynamic changes in quantitative electroencephalogram during continuous performance test in children with attention-deficit/hyperactivity disorder. Int J Psychophysiol. 2011;81:230–236. | ||
Magee CA, Clarke AR, Barry RJ, McCarthy R, Selikowitz M. Examining the diagnostic utility of EEG power measures in children with attention deficit/hyperactivity disorder. Clin Neurophysiol. 2005;116:1033–1040. | ||
Barry RJ, Clarke AR, McCarthy R, Selikowitz M. EEG coherence in attention-deficit/hyperactivity disorder: a comparative study of two DSM-IV types. Clin Neurophysiol. 2002;113:579–585. | ||
Barry RJ, Clarke AR, Hajos M, Dupuy FE, McCarthy R, Selikowitz M. EEG coherence and symptom profiles of children with attention-deficit/hyperactivity disorder. Clin Neurophysiol. 2011;122:1327–1332. | ||
Dupuy FE, Clarke AR, Barry RJ, McCarthy R, Selikowitz M. EEG coherence in children with attention-deficit/hyperactivity disorder: differences between good and poor responders to methylphenidate. Psychiatry Res. 2010;180:114–119. | ||
Ahmadlou M, Adeli H. Wavelet-synchronization methodology: a new approach for EEG-based diagnosis of ADHD. Clin EEG Neurosci. 2010;41:1–10. | ||
Barry RJ, Clarke AR, McCarthy R, Selikowitz M. EEG coherence in children with attention-deficit/hyperactivity disorder and comorbid oppositional defiant disorder. Clin Neurophysiol. 2007;118(2):356–362. | ||
Barry RJ, Clarke AR, McCarthy R, Selikowitz M. EEG coherence in children with attention-deficit/hyperactivity disorder and reading disabilities. Int J Psychophysiol. 2009;71:205–210. | ||
Clarke AR, Barry RJ, McCarthy R, Selikowitz M. EEG analysis in attention-deficitr/hyperactivity disorder: a comparative study of two subtypes. Psychiatry Res. 1998;81:19–29. | ||
Clarke AR, Barry RJ, McCarthy R, Selikowitz M. Electroencephalogram differences in two subtypes of attention-deficit/hyperactivity disorder. Psychophysiology. 2001;38:212–221. | ||
Clarke AR, Barry RJ, McCarthy R, Selikowitz M, Clarke DC, Croft RJ. Effects of stimulant medications on children with attention-deficit/hyperactivity disorder and excessive beta activity in their EEG. Clin Neurophysiol. 2003;114:1729–1737. | ||
Clarke AR, Barry RJ, McCarthy R, et al. Effects of methylphenidate on EEG coherence in attention-deficit/hyperactivity disorder. Int J Psychophysiol. 2005;58:4–11. | ||
Clarke AR, Barry RJ, McCarthy R, Selikowitz M, Johnstone S. Effects of stimulant medications on the EEG of girls with attention-deficit/hyperactivity disorder. Clin Neurophysiol. 2007;118:2700–2708. | ||
Hermens DF, Williams LM, Clarke S, Kohn M, Cooper N, Gordon E. Responses to methylphenidate in adolescent AD/HD: evidence from concurrently recorded autonomic (EDA) and central (EEG and ERP) measures. Int J Psychophysiol. 2005;58:21–33. | ||
Lubar JF, White JN, Swartwood MO, Swartwood JN. Methylphenidate effects on global and complex measures of EEG. Pediatr Neurol. 1999;21(3):633–637. | ||
Swartwood MO, Swartwood JN, Lubar JF, Timmermann DL, Zimmerman AW, Muenchen RA. Methylphenidate effects on EEG, behavior, and performance in boys with ADHD. Pediatr Neurol. 1998;18(3):244–250. | ||
Clarke AR, Barry RJ, McCarthy R, Selikowitz M. EEG differences between good and poor responders to methylphenidate and dexamphetamine in children with attention-deficit/hyperactivity disorder. Clin Neurophysiol. 2002;113:194–205. | ||
Dupuy FE, Clarke AR, Barry RJ, McCarthy R, Selikowitz M. EEG coherence in girls with attention-deficit/hyperactivity disorder: stimulant effects in good responders. Int J Psychophysiol. 2008;70(3):151–157. | ||
Barttfeld P, Petroni A, Báez S, et al. Functional connectivity and temporal variability of brain connections in adults with attention deficit/hyperactivity disorder and bipolar disorder. Neuropsychobiology. 2014;69:65–75. | ||
Alba G, Pereda E, Mañas S, Méndez LD, Duque MR, et al. The variability of EEG functional connectivity of young ADHD subjects in different resting states. Clin Neurophysiol. Epub 2015. |
 © 2015 The Author(s). This work is published and licensed by Dove Medical Press Limited. The full terms of this license are available at https://www.dovepress.com/terms.php and incorporate the Creative Commons Attribution - Non Commercial (unported, v3.0) License.
By accessing the work you hereby accept the Terms. Non-commercial uses of the work are permitted without any further permission from Dove Medical Press Limited, provided the work is properly attributed. For permission for commercial use of this work, please see paragraphs 4.2 and 5 of our Terms.
© 2015 The Author(s). This work is published and licensed by Dove Medical Press Limited. The full terms of this license are available at https://www.dovepress.com/terms.php and incorporate the Creative Commons Attribution - Non Commercial (unported, v3.0) License.
By accessing the work you hereby accept the Terms. Non-commercial uses of the work are permitted without any further permission from Dove Medical Press Limited, provided the work is properly attributed. For permission for commercial use of this work, please see paragraphs 4.2 and 5 of our Terms.