")
Back to Journals » International Journal of Chronic Obstructive Pulmonary Disease » Volume 14
Eicosanoids metabolized through LOX distinguish asthma–COPD overlap from COPD by metabolomics study
Authors Cai C, Bian X, Xue M, Liu X, Hu H, Wang J, Zheng SG , Sun B , Wu JL
Received 27 February 2019
Accepted for publication 24 May 2019
Published 6 August 2019 Volume 2019:14 Pages 1769—1778
DOI https://doi.org/10.2147/COPD.S207023
Checked for plagiarism Yes
Review by Single anonymous peer review
Peer reviewer comments 2
Editor who approved publication: Dr Chunxue Bai
Chuanxu Cai,1,2,* Xiqing Bian,3,* Mingshan Xue,1 Xiaoqing Liu,1 Haisheng Hu,1 Jingxian Wang,4 Song Guo Zheng,5 Baoqing Sun,1 Jian-Lin Wu3
1Department of Allergy and Clinical Immunology, Guangzhou Institute of Respiratory Health, State Key Laboratory of Respiratory Disease, National Clinical Research Center of Respiratory Disease, First Affiliated Hospital of Guangzhou Medical University, Guangzhou, People’s Republic of China; 2Department of Laboratory Medicine, Shenzhen People’s Hospital, Shenzhen, People’s Republic of China; 3State Key Laboratory of Quality Research in Chinese Medicine, Macau Institute for Applied Research in Medicine and Health, Macau University of Science and Technology, Taipa, Macao, People’s Republic of China; 4Center for Tissue Engineering and Stem Cell Research, Guizhou Medical University, Guiyang, Guizhou, People’s Republic of China; 5Department of Internal Medicine, Ohio State University College of Medicine and Wexner Medical Center, Columbus, OH, USA
*These authors contributed equally to this work
Background and objective: The prevalence of asthma is greater than 20% in patients previously diagnosed with COPD. Patients with asthma–COPD overlap (ACO) are at risk of rapid progression of disease and severe exacerbations. However, in some patients with ACO, a clear distinction from COPD is very difficult by using physiological testing techniques. This study aimed to apply a novel metabolomic approach to identify the metabolites in sera in order to distinguish ACO from COPD.
Methods: In the study, blood samples were collected from patients with COPD, ACO, and healthy controls. Cholamine derivatization-ultrahigh performance liquid chromatography-quadrupole time-of-flight mass spectrometry (UHPLC-Q-TOF/MS) was used to investigate serum metabolites of eicosanoids.
Results: A clear intergroup separation existed between the patients with ACO and those with COPD, while ACO tends to have higher serum metabolic levels of eicosanoids. A robust Orthogonal Projections to Latent Structures-Discriminant Analysis (OPLS-DA) model was found for discriminating between ACO and COPD (R2Y =0.81, Q2=0.79). In addition, there is a significant correlation between some metabolites and clinical indicators, such as hydroxyeicosatetraenoic acids (HETEs), hydroperoxyeicosatetraenoic acids (HPETEs) and FEV1/FVC. The higher values of area under the receiver operating characteristic curves (ROC) of HETEs, which were metabolized from HPETEs through lipoxygenase (LOX), indicated that they should be the potential biomarkers to distinguish ACO from COPD.
Conclusion: Eicosanoids can clearly discriminate different biochemical metabolic profiles between ACO and COPD. The results possibly provide a new perspective to identify potential biomarkers of ACO and may be helpful for personalized treatment.
Keywords: metabolomics, COPD, asthma–COPD overlap, cholamine derivatization-UHPLC-Q-TOF/MS
Introduction
Chronic obstructive pulmonary disease (COPD) is a common pulmonary disease, which is currently the top four leading cause of death all over the world.1 COPD and asthma can coexist and converge, and for such patients, it is assumed as asthma-COPD overlap (ACO).2,3 Subjects with ACO have frequent and severe exacerbations, a rapid decline in pulmonary function, poor quality of life, and higher mortality compared with COPD patients.4,5 Previous studies have demonstrated that the pooled prevalence of asthma was more than 20% among individuals who have originally been diagnosed with COPD.6 However, in some patients with ACO, a clear distinction from COPD is very difficult by using current physiological or imaging testing techniques, such as airway function tests, ultrasonic imaging, and X-ray imaging.7 Therefore, it is urgent to find an approach to diagnose and prognose COPD from other diseases.
Metabolomics is an emerging innovative study that helps to analyze low molecule biochemical metabolite profiles in a specific biological system using statistical analyses to detect the chemical fingerprint of samples.8 The state of metabolites associated with many biochemical processes, such as redox balance, oxidative stress, signal transduction, apoptosis, and inflammation, can provide informational measurement for multifactorial diseases.9,10 Recently, metabolomic studies demonstrate the close relationship between serum eicosanoids and COPD.11 Eicosanoids are signaling molecules made by the enzymatic or non-enzymatic oxidation of arachidonic acid (AA), including prostaglandins (PGs) and hydroxyeicosatetraenoic (HETEs), which play important roles in diverse physiological systems and pathological processes like inflammation, fever, and other immune responses.12 However, few studies have been reported on serum eicosanoid metabolic characteristics in patients with ACO. Gas chromatography (GC) and liquid chromatography (LC) coupled with mass spectrometry (MS) have been widely used for eicosanoids analysis.13–15 However, the thermal instability, low contents, high polarity similarities, poor ionization efficiency, etc. hinder their use. Fortunately, our previously reported approaches (2-aminoethyl)trimethylammonium chloride hydrochloride (cholamine) and 5-(diisopropylamino)amylamine derivatization coupled with ultrahigh performance liquid chromatography-quadrupole time-of-flight mass spectrometry (UHPLC-Q-TOF/MS),16,17 as well as solid phase extraction-nano-UHPLC-Q-TOF/MS18 were developed to sensitively and effectively detect eicosanoids. In this study, cholamine derivatization-UHPLC-Q-TOF/MS was applied to investigate eicosanoids in serum samples of COPD, ACO, and control groups. A new perspective was provided to determine whether ACO could be characterized with biochemical metabolites. More importantly, the expected results may provide new biological markers for the diagnosis of patients with ACO.
Methods
Chemicals and reagents
All fatty acid standards mixtures were bought from Cayman Chemical (Ann Arbor, MI). They are 5(S)-, 8(S)-, 11(S)-, 12(S)-, and 15(S)-HETE; 5(S)-, 12(S)-, and 15(S)-HPETE, 9(S)- and 13(S)-HPODE; 5(S)-, 12(S)-, and 15(S)-hydroxyeicosapentaenoic acid (HEPE), 13(S)-hydroxyoctadecatrienoic acid (HOTrE); 14,15-epoxyeicosatrienoic acids (14,15-EET); leukotriene B4 (LTB4); PGA2, PGD2, PGE2, PGJ2; PGE1, PGF1α, PGF2α; thromboxane B2 (TXB2), 11-dehydro TXB2, 12(S)-hydroxyheptadecatrienoic acid (HHTrE); 13,14-dihydro-15-keto PGD2 (DK-PGD2), 11β-PGF2α, DK-PGE2, DK-PGF2α. The isotope-labeled eicosanoids, 12(S)-HETE-d8 and PGD2-d4 were used as internal standards.
1-Hydroxybenzotriazole hydrate (HOBt), 1-[bis(dimethylamino)methylene]- 1H-1,2,3-triazolo[4,5-b] pyridinium 3-oxid hexafluorophosphate (HATU) and triethylamine (TEA) were purchased from Sigma-Aldrich Laboratories, Inc. (St. Louis, MO). Cholamine was obtained from Santa Cruz (Indian Gulch, CA). Acetonitrile (MS grade), dimethyl sulfoxide (DMSO) (MS grade) and ethyl acetate (ACS grade) were provided by J.T. Baker (Danville, PA). Deionized water was prepared using a Millipore water purification system (Billerica, MA). MS grade formic acid and other chemical reagents were obtained from Sigma-Aldrich Laboratories, Inc.
Patients and study design
A total of 56 patients, including 27 patients with COPD and 29 patients with ACO, were enrolled from the First Affiliated Hospital of Guangzhou Medical University in time of June 2017 to September 2017. At the time of enrollment, all subjects completed standardized questionnaires regarding sex, age, and body mass index (BMI). Simultaneously, all subjects underwent spirometry, exhaled nitric oxide (FeNO) test, and serum phadiatop test on the same day. The diagnosis of COPD was based on GOLD guidelines.7 The diagnosis of ACO was based on both the GINA19 and GOLD guidelines following the criteria: 1) persistent airflow limitation, forced expiratory volume in 1 s/ forced vital capacity (FEV1/FVC) ratio <0.7; 2) reversible airway obstruction (increase of >12% and 200 mL in FEV1 after inhaled bronchodilator administration); 3) history of physician-diagnosed atopy or asthma. In addition, 28 healthy volunteers were recruited as healthy control subjects, who met the following criteria: 1) no history of respiratory or other diseases that might interfere with the results; 2) baseline FEV1>80% predicted and FEV1/FVC ratio >0.7; and 3) negative methacholine challenge. This study was approved by the Ethics Committee of First Affiliated Hospital of Guangzhou Medical University (IRB Nos. 2016–20) and conducted in accordance with the Declaration of Helsinki. All participants provided written informed consent to take part in the study.
Lung function measurements and bronchodilator response testing
According to the recommendations of the American Thoracic Society and European Respiratory Society (ATS/ERS), lung function tests were performed on a computerized spirometer (MasterScreen, Leibnizstrasse, Hoechberg, Germany). The examination parameters included forced vital capacity (FVC), forced expiratory volume in 1 second (FEV1), peak expiratory flow (PEF), maximal mid-expiratory flow (MMEF) percentage predictors parameters (%FVC, %FEV1, %PEF, %MMEF), and the FEV1/FVC ratio. The response of bronchodilators was quantified in two ways: 1) an absolute number (absolute, Change in FEV1 (mL); 2) a percentage of the prebronchodilator value (relative, %Change in FEV1 (%)).
Blood collection, serum processing, and storage
All subjects received phlebotomy for peripheral blood samples (5 mL). The samples were collected and centrifuged at 3,000 rpm for 10 mins, and then the serum supernatants were collected and used for detection. The remaining serum samples were stored at −80°C for long-term storage in order to avoid repeated thawing and freezing.
Derivatization
The derivatization was performed using our previously developed cholamine derivatization UHPLC-Q-TOF/MS approach.16 The residue of 50 μL aliquot of standards or real samples was sequentially mixed with 5 µL of 20 mM HOBt in DMSO, 10 µL of 100 mM cholamine in DMSO containing 200 mM TEA, 5 µL of 20 mM HATU in DMSO, and then incubated at room temperature for 1 min. Finally, 30 µL acetonitrile was added to make up to the final volume of 50 µL.
UHPLC-Q-TOF/MS analysis of metabolites
The Agilent 1290 Infinity LC system (UHPLC, Santa Clara, CA) which consisted of an autosampler, a thermostatic column compartment, and an Agilent Eclipse XDB-C18 column (2.1×100 mm, 1.8 μm) with binary pump was employed for the separation of components. The column temperature was maintained at 40°C and the autosampler was set at 4°C. The flow rate was 0.3 mL/min, and the injection volume was 1 μL. Mobile phase A and B were water (containing 0.1% formic acid) and acetonitrile (containing 0.1% formic acid), respectively, and the gradient was set as follows: 0–1 min, 15–23% B; 1–8 mins, 23–33% B; 8–8.5 mins, 33–35% B; 8.5–15.5 mins, 35–47% B; 15.5–16 mins, 47–50% B; 16–23 mins, 50–85% B; 23–25 mins, 85–95% B; 25–28.9 mins, 95% B.
The mass spectrometry was performed on an Agilent 6550 UHD accurate-mass Q-TOF/MS system with a dual Jet stream electrospray ion source (dual AJS ESI). The MS parameters were set as follows: dry gas temperature at 250°C, dry gas flow at 15 L/min, sheath gas temperature at 300°C, sheath gas flow at 11 L/min, nebulizer pressure at 20 psig, capillary voltage at 5,000 V, and nozzle voltage at 500 V. The mass spectra were recorded across the range of 200–1000 m/z. Accurate mass measurements were obtained by using a low flow of TOF reference mixture, containing the internal reference masses at m/z 922.0098 (C18H18F24N3O6P3).
Statistical analysis
Raw LC-MS data from the COPD, ACO, and control group samples were extracted and aligned using the Agilent MassHunter Qualitative Analysis B.06.00 software (Agilent Technology, USA). Internal standards were used to normalize each retained peak. The Molecular Feature Extractor was used to extract molecular features including identical elution profiles, relative m/z values, and group ions through accurate masses, retention times, and ion intensities. Data measurements were then performed using MassHunter Profiler Professional (MPP) software (Agilent Technologies) with a tolerance window of 20 ppm for the m/z value. The metabolites were identified based on the comparison of retention times, MS, and MS/MS spectra with corresponding standards, and the metabolites database Lipid Maps and METLIN.
The SIMCA-P software (version 11.0; Umetrics, Umea, Sweden) was used for the multivariate statistical analysis. Orthogonal projections to latent structures discriminant analysis (OPLS-DA) regression was performed to assess the relationship between COPD and ACO, as well as healthy and ACO groups. Permutation test on the responses and procedures of seven-fold cross-validation was run for each model to check its validity. The corresponding variable importance in projection (VIP) values are calculated in the OPLS-DA model. The VIP value represents the difference in the variables.
Data were processed and analyzed using the statistical software package IBM SPSS Statistics for Windows Version 23.0 (IBM Corp, Chicago, IL, USA). After the multivariate approaches, the significance of each metabolite in group discrimination was further measured by nonparametric test using GraphPad Prism 5. P-value below 0.05 was regarded as statistically significant. The Gephi software (version 0.9.2; NetBeans) was used for Spring-embedded correlation plot. Parametric quantitative data were depicted as the mean±standard deviation and non-parametric quantitative data were described as a median (interquartile range).
Results
Characteristics of the study population
Demographics of the study population are briefly presented in Table 1. Most of the subjects in the groups with COPD and ACO were male, while the group with COPD had the highest mean age. The group with ACO had the highest mean BMI. FeNO levels in each group were similar, all within the normal ranges, indicating the stable airway inflammatory state. As expected, positive rates and levels of phadiatop had no significant differences among all the groups, representing the equal allergic sensitization among them. The pulmonary function parameters, including FVC% predicted, FEV1% predicted, and the FEV1/FVC ratios were significantly lower in patients with COPD and in those with ACO than in healthy controls, while FEV1/FVC (%) and FEV1 (%) predicted showed no significant difference between COPD and ACO cases.
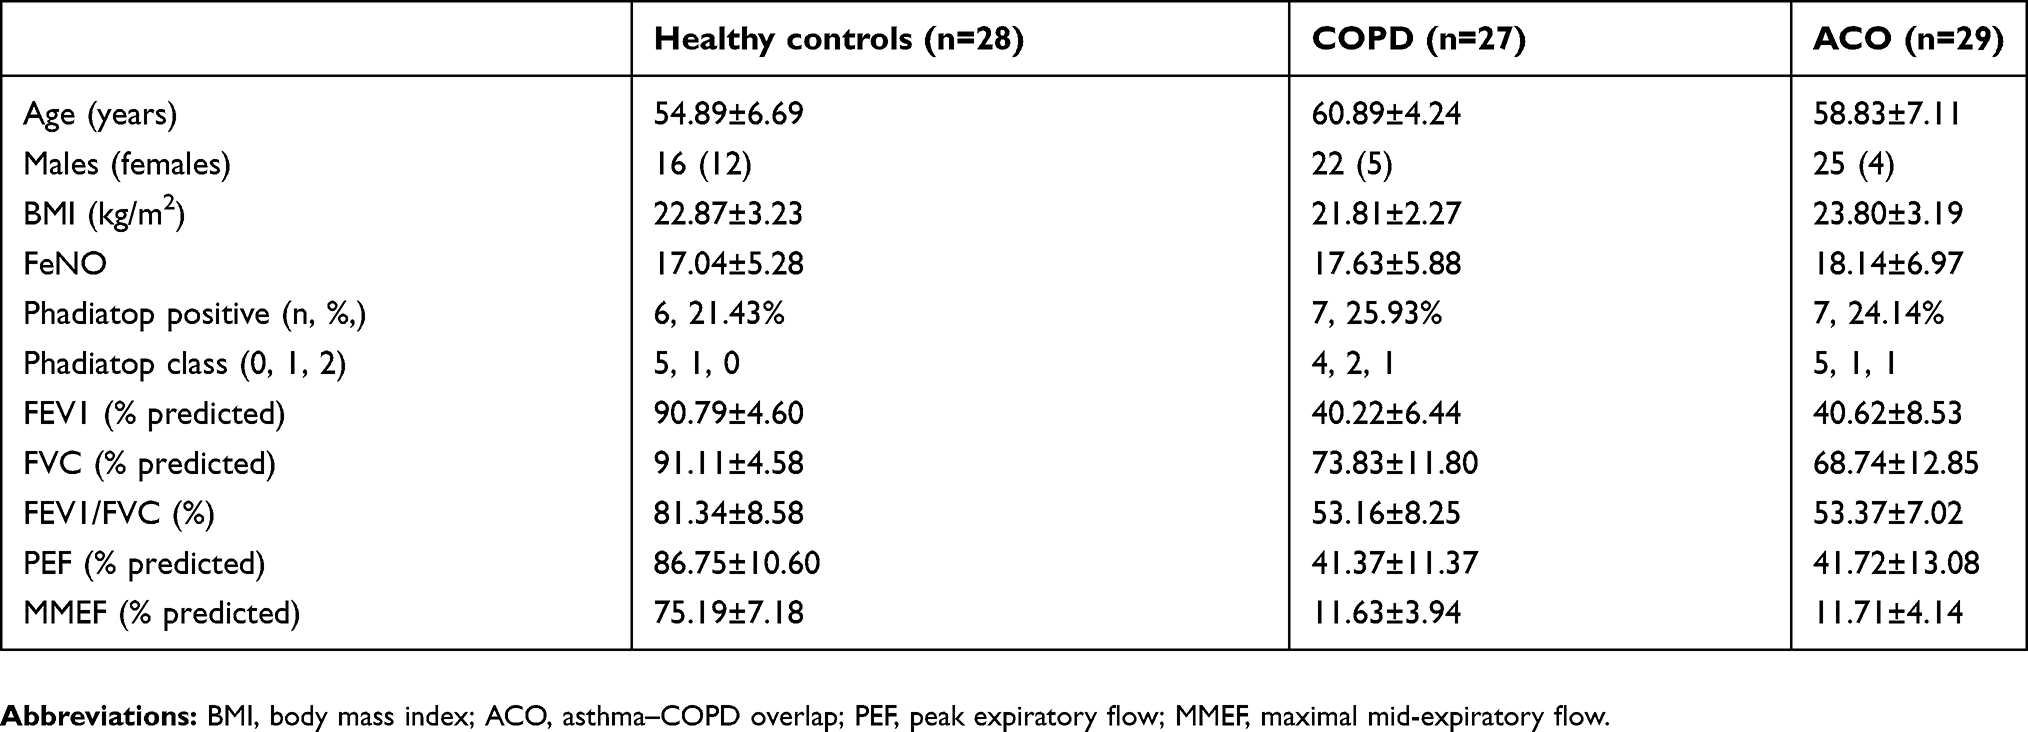 |
Table 1 Characteristics of the subjects |
Metabolomics analysis by cholamine derivatization-UHPLC-Q-TOF/MS
Twenty-eight eicosanoids were detected in serum by targeted cholamine derivatization-UHPLC-Q-TOF/MS approach. PCA analysis was performed to capture the most significant difference between ACO and COPD groups, as well as ACO and healthy subjects. Finally, a clear separation was found between ACO and COPD groups (R2Y =0.81, Q2=0.79, Figure 1A) and between ACO and healthy subjects (R2Y =0.84, Q2=0.81, Figure 1B) using OPLS-DA model. Additionally, the three sets of groups, ACO, COPD, and healthy controls were also well separated with each other, while COPD was located in the middle of ACO and healthy subjects in three-dimensional (3-D) OPLS-DA score plot (Figure 1C). The OPLS-DA analysis suggested that metabolic alterations indeed occurred in the sera of ACO. As a result, a robust classification model was obtained. These metabolites were also analyzed using heatmap (Figure 2). In the upper part of heatmap, serum levels of some metabolites were highest in ACO and lowest in healthy controls, while COPD was found significantly decreased compared with ACO groups, such as 12(S)-, and 15(S)-HPETE, 9(S)-, and 13(S)-HPODE, 8(S)-, 11(S)-, and 15(S)-HETE, etc. In the second part of the heat map, the metabolites, including 12(S)-HEPE, 12(S)-HETE, TXB2, etc., were only increased in ACO group, while, they had no significant differences between COPD group and control group. In the bottom part of the heat map, metabolites levels were approximate in each group.
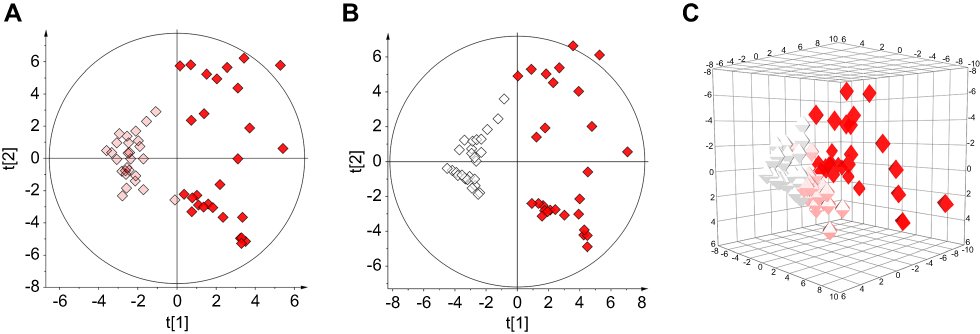 |
Figure 1 (A) Scores plots of OPLS-DA model separating COPD and asthma–COPD overlap (ACO) (R2Y =0.81, Q2=0.79); (B) Scores plots of OPLS-DA model separating healthy control and ACO (R2Y =0.84, Q2=0.81); (C) 3D-Plot of OPLS-DA model separating healthy control, COPD and ACO. Note: White, healthy control group; pink, COPD group; red, ACO group. |
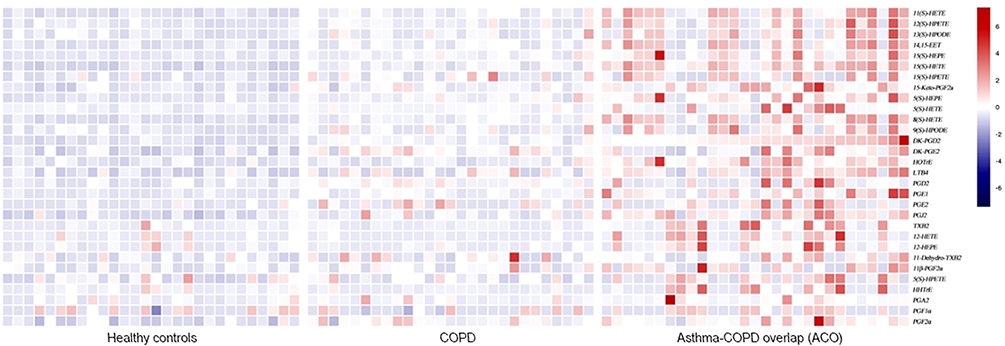 |
Figure 2 Heatmap analysis of eicosanoids levels in serum of healthy control, COPD, and asthma–COPD overlap (ACO). |
Metabolites are associated with clinical parameters
To further determine the clinical relevance of these metabolites, the relationship between the metabolites and clinical parameters, such as exhaled nitric oxide levels and lung function, was also evaluated. As shown in spring-embedded correlation analysis (Figure 3), several metabolites were found to be negatively correlated with the FEV1/FVC ratios, such as 8(S)-, and 11(S)-HETE, 12(S)-, and 15(S)-HPETE. HPETEs, produced by oxidation of AA via LOX, were metabolized into HETEs through glutathione peroxidase enzymes (GPX).20 Additionally, 9(S)-, and 13(S)-HPODE were associated with the lung function parameters, such as FEV1/FVC ratio and PEF. They were metabolized from linoleic acid.
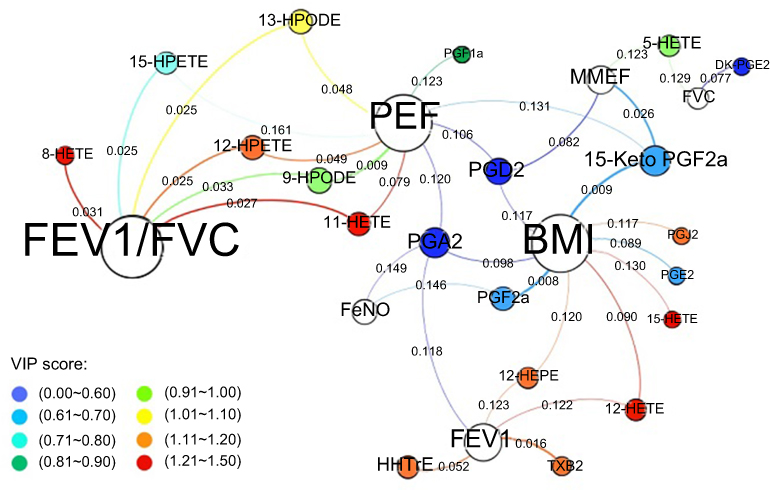 |
Figure 3 Spring-embedded correlation plot illustrating the relationship between eicosanoids and clinical parameters. Notes: The size of the node is proportional to the weight of the relationship with metabolite (the larger the circle, the more correlation the metabolite). Node color directly maps onto the VIP score of metabolites between COPD and asthma–COPD overlap (ACO) (see bottom left of the figure). The length of the line between the nodes (spring length) is proportional to the correlation strength (the shorter the length, the stronger the correlation with neighboring metabolites). The thickness of the line is proportional to the significance of correlation (more thicker the line, the more significant the metabolites). |
The relevant metabolic pathway is shown in Figure 4. The AA metabolic network produces a large family of inflammatory mediators, including HETEs, which are metabolized via lipoxygenase (LOX). The levels of metabolites were quantified by measuring the peak area after normalization using relevant internal standards. On the basis of eicosanoids data, healthy controls were clearly separated from COPD and ACO groups. As shown in Figure 4, 8(S)-, 12(S)-, and 15(S)-HETE, 12(S)-, and 15(S)-HPETE, 9(S)-, and 13(S)-HPODE, which were associated with LOX, were significantly increased in ACO group compared with COPD group. Collectively, we proposed that ACO was associated with the eicosanoids cycle due to the abnormalities in the LOX pathway.
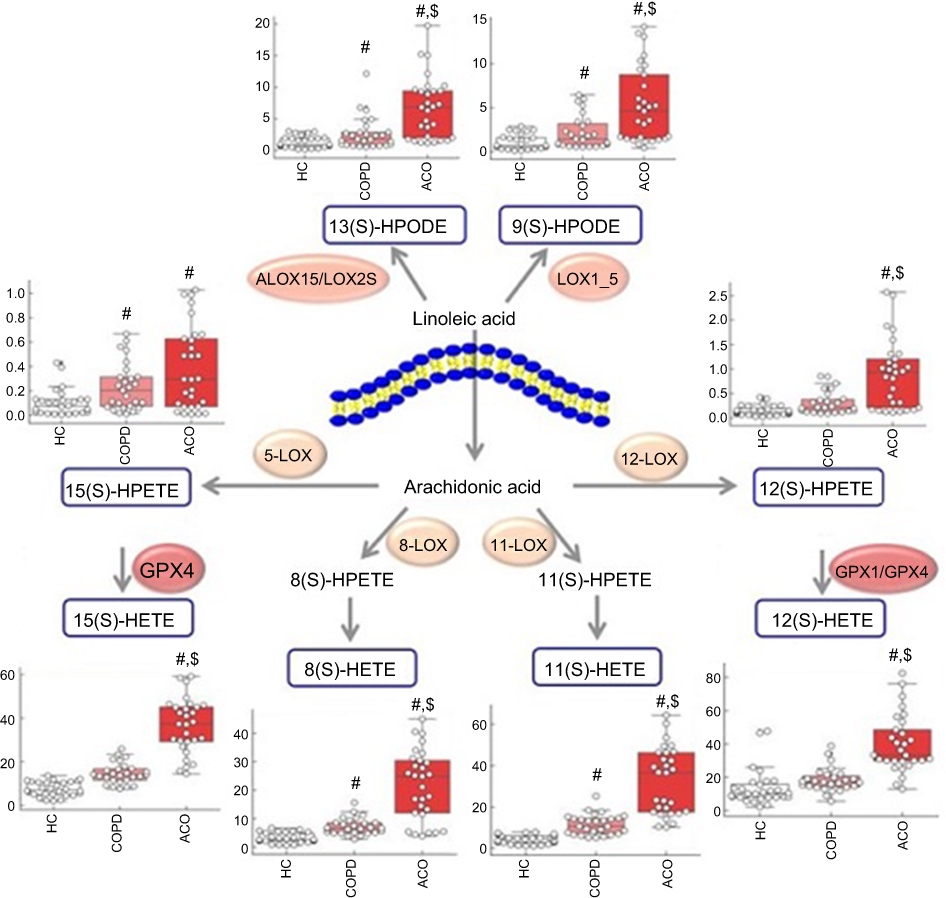 |
Figure 4 Proposed metabolic pathway of the relevant eicosanoids. White column: healthy control (HC) group; pink column: COPD group; red column: asthma–COPD overlap (ACO) group. #, significantly compared with healthy control; $, significantly compared with COPD. |
Metabolites allow for distinction between ACO and COPD
In order to investigate which metabolite played the greatest role in the separation of ACO and COPD, the VIP values of metabolites were obtained from the OPLS-DA analysis, as shown in Table 2, HETEs were the most relevant for the separations. Furthermore, the area under the receiver operating characteristic curves (AUC) values of these metabolites were applied to assess the performance of disease diagnosis (Figure 5). As we know, the AUC value of 1 represents a perfect test, while the AUC value of 0.5 indicates a priceless test. The good AUC values of 8(S)-, 12(S)-, and 15(S)-HETE indicated that HETEs should be potential biomarkers to distinguish ACO from COPD in the clinic.
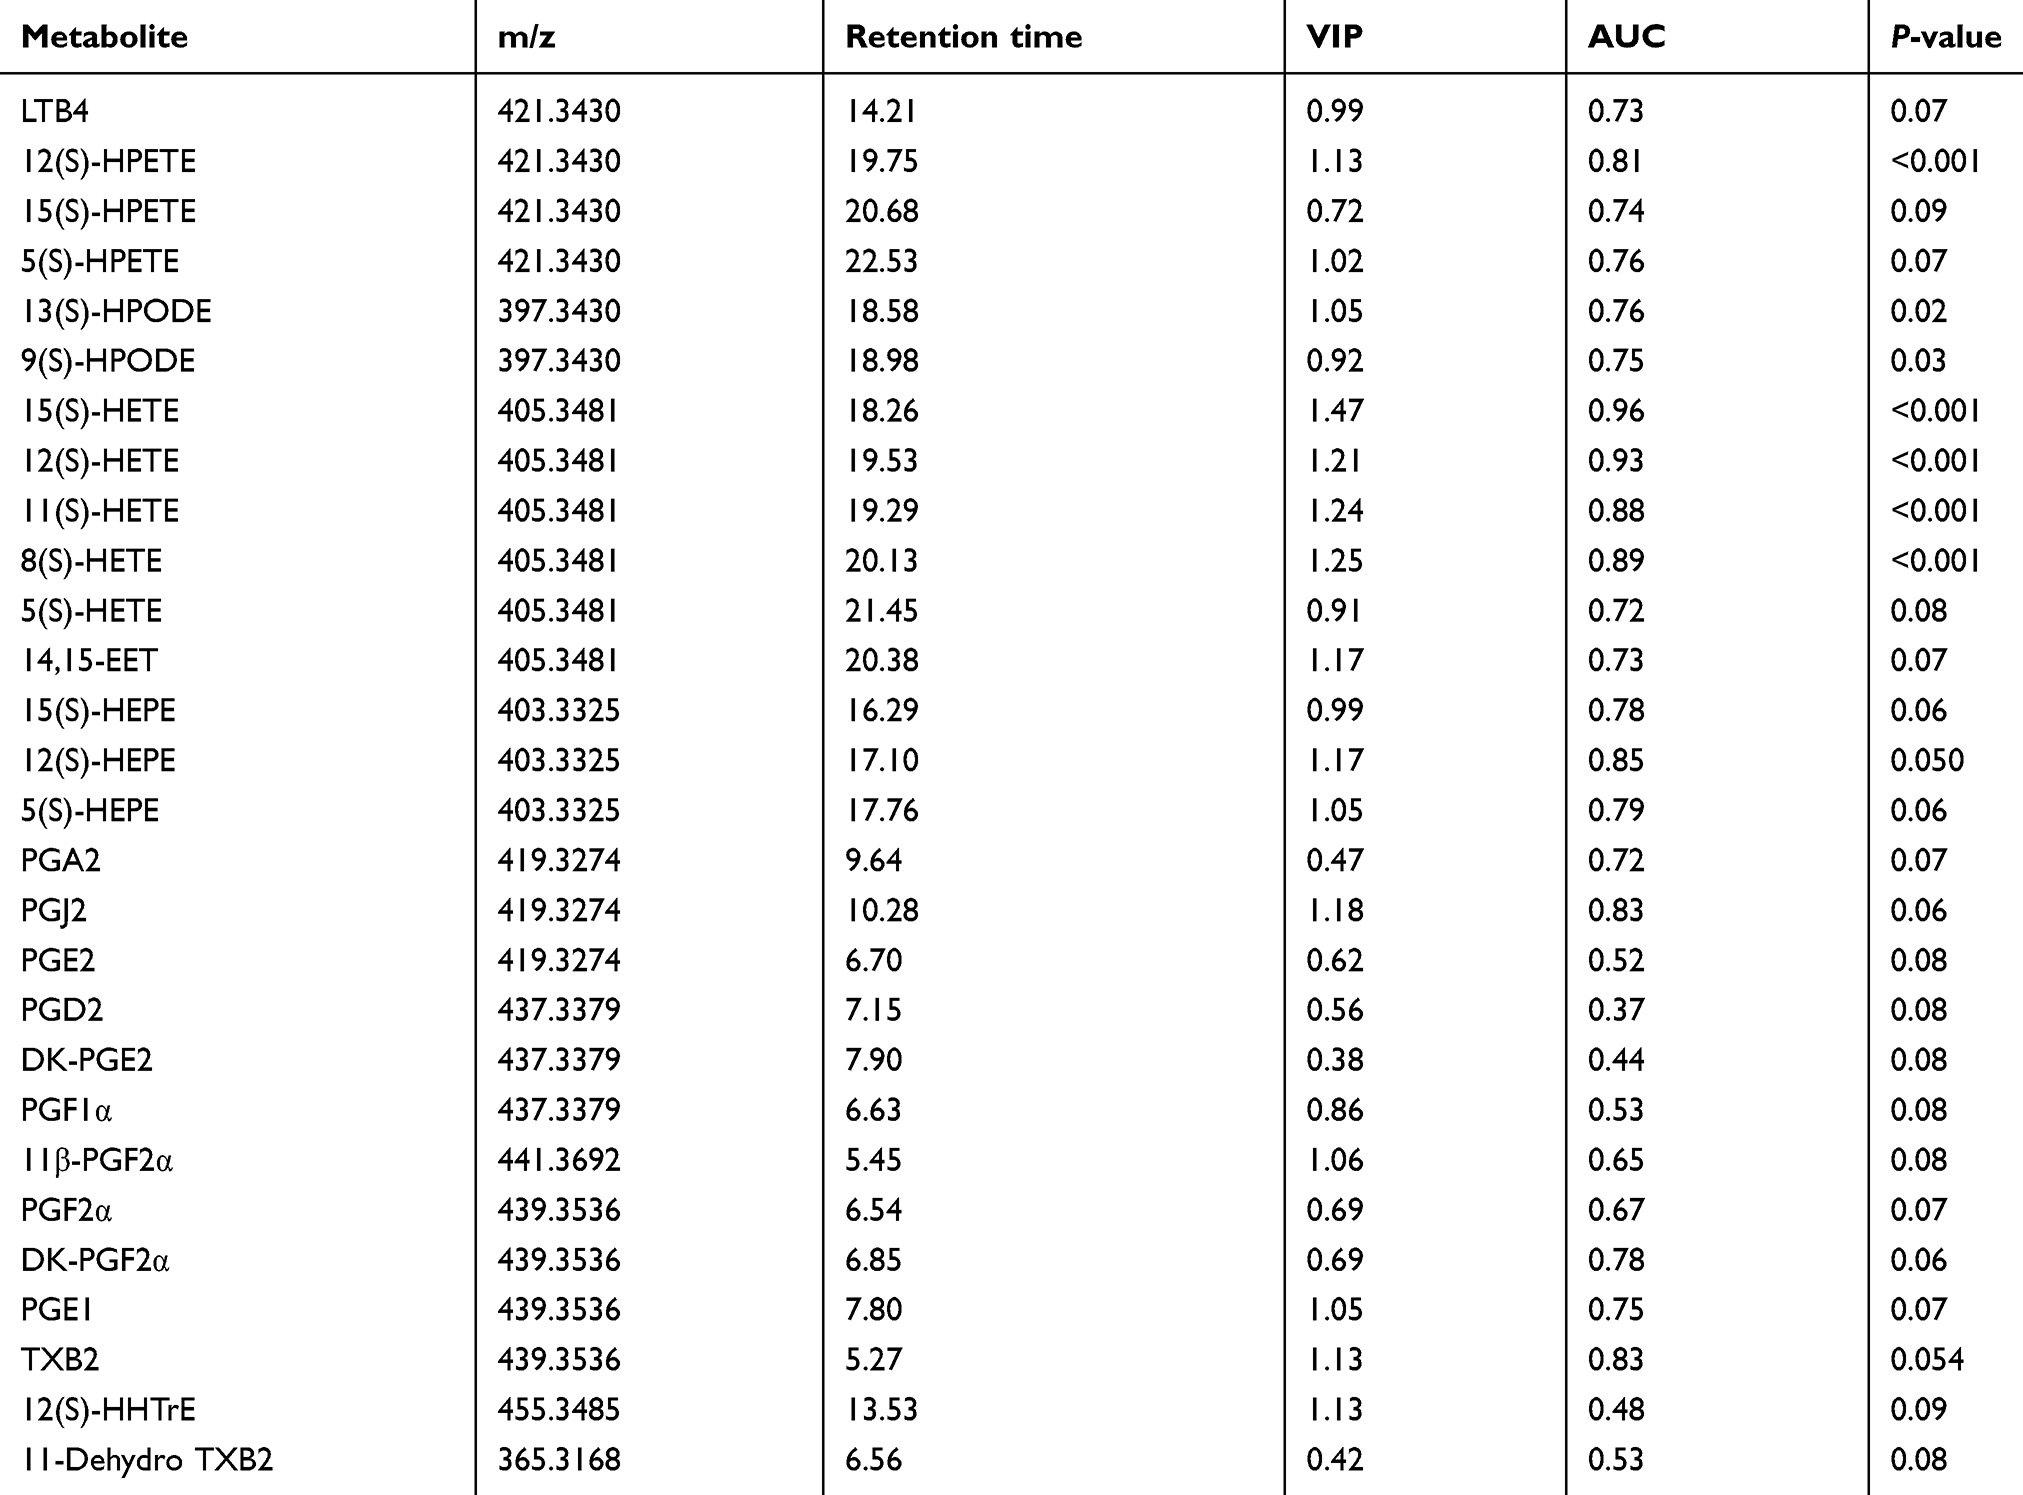 |
Table 2 Identification and selection of metabolites between ACO and COPD |
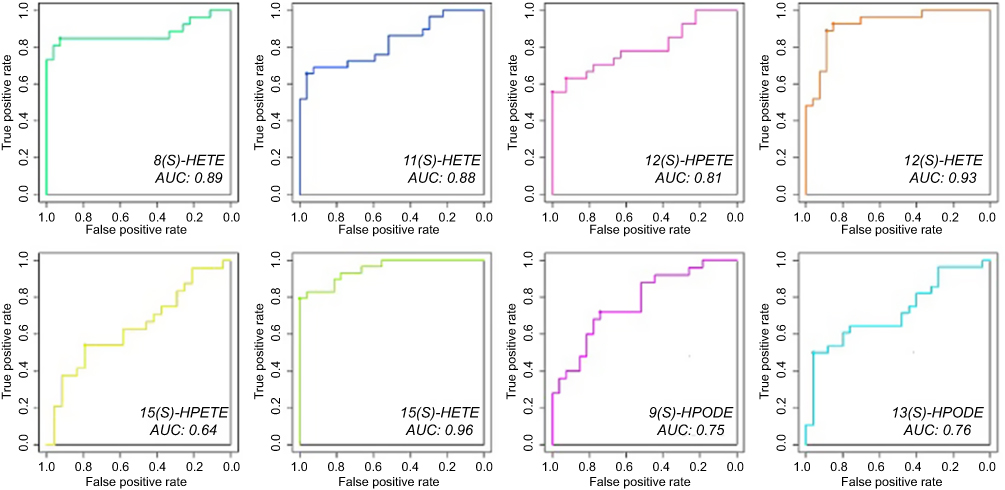 |
Figure 5 Receiver operating characteristic (ROC) curves of relevant eicosanoids. |
Discussion
As biomarkers play a crucial role in clinical diagnosis and prognosis,21,22 metabolomic technology using derivatization-UHPLC-Q-TOF/MS has emerged as a great potential in this aspect due to its high sensitivity, specificity, and peak resolution. Current study has explored the relationship of eicosanoid with COPD and ACO subjects and analyzed their possible correlation with exhaled nitric oxide levels, lung function, and other clinical characteristics in patients with COPD and ACO. A significantly differential regulation of eicosanoids metabolites was demonstrated between COPD and ACO, while the other metabolites, which differentiated across the groups, have also been identified.
Eicosanoids are metabolized from AA, which has many important functions in vivo, such as mediation of inflammation, immunity, and as messengers of nervous system. From our results, the serum levels of HETEs, including 8(S)-, 11(S)-, and 15(S)-HETE, were significantly increased in ACO group compared with COPD group. HETEs, which are produced by oxidation of AA through LOX and GPX, are a family of structurally related metabolites. They are associated with immune regulation and the response of the respiratory epithelium.23–25 Accordingly, we speculated that patients with ACO had higher inflammatory baseline levels, while this might be one of the reasons why ACO patients tended to have frequent and severe exacerbations. In addition, ACO group had higher serum concentrations of HPETEs and HPODEs. HPETEs were precursor of HETEs and could rapidly convert to HETEs; this indicated that the two kinds of metabolites have similar activities. HPODEs were derived by oxidation of linoleic acid through LOX enzymes. HPODEs can mediate pathological and physiological responses, and contribute to the progression of certain diseases in humans. Since smoking is usually associated with a larger oxidative stress burden,26 an increase in the levels of these eicosanoids would have been expected in COPD and ACO. A factor possibly contributing to the observed discrepancy was that obesity was also associated with a larger oxidative stress, while the groups with ACO had the higher mean body weight.27 It is likely that these eicosanoids can not only be used as therapeutic targets but also as auxiliary diagnostics for some kinds of diseases.
Spring-embedded correlation plot demonstrated the correlations between the metabolites and clinical parameters. It is intuitive that HETEs, HPETEs, and HPODEs were closely correlated with FEV1/FVC. HETEs play important roles in physiological functions such as regulating inflammation.28,29 They may amplify cell and tissue responses to disturbances.30,31 The lung function was possibly affected by HETEs through prompting airway cell differentiation and upregulating airway inflammatory. HPETEs were unstable precursors of HETEs, and they had similar activities. HPETEs and HETEs can combine together and activate stimulating effects that may contribute to the progression of narrowing pulmonary arteries caused by hypoxia-induced pulmonary hypertension.32,33 It may be the reason why those metabolites greatly influence the function of lung. Additionally, 9(S)- and 13(S)-HPODE were also correlated with lung function; this might be due to a close association between those metabolites and oxidative stress.
Receiver operating characteristic (ROC) curves showed that top three area under curves (AUC) values were 0.89 for 8(S)-HETE, 0.93 for 12(S)-HETE, and 0.96 for 15(S)-HETE. These results suggested that inflammatory reactions might be one of the most important metabolic features of ACO. HETEs might be the potential biomarkers to diagnose ACO.
As abovementioned, the metabolites in the LOX pathway were accumulated in ACO group. LOX is a family of iron-containing enzymes that serve diverse roles as autocrine signals in order to regulate the function of their parent cells. LOX pathway is most important in AA metabolism, which is well known to play important roles in inflammatory diseases such as cardiovascular disease, arthritis, etc. In our opinion, the micro levels, such as pathology, blood low molecular level, etc., have significant influence on the differentiation between COPD and ACO. Some patients with ACO were difficult to distinguish from COPD using current physiological or imaging testing techniques. This is a serious problem for physicians with insufficient clinical experience. As we know, traditional diagnosis approach for ACO was not sufficient and had a high misdiagnosis rate, the metabolomics analysis using cholamine-derivatized UHPLC-Q-TOF/MS approach provided a new perspective for ACO diagnosis, prognosis, and distinction from COPD.
Conclusion
Our study indicated that the metabolomic profiling of serum using cholamine derivatization-UHPLC-Q-TOF/MS approach could help distinguish ACO from COPD. HETEs, which metabolized through LOX from eicosanoids, seem likely be the disturbance to lung function. It may be the potential biomarkers to distinguish ACO from COPD in the clinic, and this approach could provide a new perspective to identify potential biomarkers of ACO and could be helpful for personalized treatment.
Acknowledgments
This study was supported by the Guangzhou Science and Technology Foundation (201804020043); Guangzhou Education Bureau (1201630393; 1201630044); Open Project of State Key Laboratory of Respiratory Disease (SKLRD2016OP003); National Natural Science Foundation of China (NSFC 81871736; NSFC 81601394; NSFC 81572063); Macau Science and Technology Development Fund (009/2017/A1); A Clinical Trial for COPD Treatment (HDZY-151231).
Disclosure
The authors report no conflicts of interest in this work.
References
1. Gelb AF, Christenson SA, Nadel JA. Understanding the pathophysiology of the asthma-chronic obstructive pulmonary disease overlap syndrome. Curr Opin Pulm Med. 2016;22(2):100–105. doi:10.1097/MCP.0000000000000236
2. Yanagisawa S, Ichinose M. Definition and diagnosis of asthma-COPD overlap (ACO). Allergol Int. 2018;67(2):172–178. doi:10.1016/j.alit.2018.01.002
3. Wang J, Lv H, Luo Z, et al. Plasma YKL-40 and NGAL are useful in distinguishing ACO from asthma and COPD. Respir Res. 2018;19(1):47. doi:10.1186/s12931-018-0755-6
4. Mindus S, Malinovschi A, Ekerljung L, et al. Asthma and COPD overlap (ACO) is related to a high burden of sleep disturbance and respiratory symptoms: results from the RHINE and Swedish GA2LEN surveys. PLoS One. 2018;13(4):e195055. doi:10.1371/journal.pone.0195055
5. Sorino C, Scichilone N, D’Amato M, Patella V, DI Marco F. Asthma-COPD overlap syndrome: recent advances in diagnostic criteria and prognostic significance. Minerva Med. 2017;108(3 Suppl 1):1–5. doi:10.23736/S0026-4806.17.05321-6
6. Sin DD. Asthma-COPD overlap syndrome: what we know and what we don’t. Tuberc Respir Dis (Seoul). 2017;80(1):11–20. doi:10.4046/trd.2017.80.1.11
7. Kokturk N, Gurgun A, Sen E, et al. The view of the turkish thoracic society on the report of the GOLD 2017 global strategy for the diagnosis, management, and prevention of COPD. Turk Thorac J. 2017;18(2):57–64. doi:10.5152/TurkThoracJ.2017.060417
8. Reinke SN, Gallart-Ayala H, Gomez C, et al. Metabolomics analysis identifies different metabotypes of asthma severity. Eur Respir J. 2017;49(3). doi:10.1183/13993003.01740-2016
9. Chang C, Guo ZG, He B, Yao W-Z. Metabolic alterations in the sera of Chinese patients with mild persistent asthma: a GC-MS-based metabolomics analysis. Acta Pharmacol Sin. 2015;36(11):1356–1366. doi:10.1038/aps.2015.102
10. Lee DS, Park J, Kay KA, et al. The implications of human metabolic network topology for disease comorbidity. Proc Natl Acad Sci U S A. 2008;105(29):9880–9885. doi:10.1073/pnas.0802208105
11. Titz B, Luettich K, Leroy P, et al. Alterations in serum polyunsaturated fatty acids and eicosanoids in patients with mild to moderate chronic obstructive pulmonary disease (COPD). Int J Mol Sci. 2016;17(9):1583. doi:10.3390/ijms17091583
12. Huang Y, Chen G, Liu X, et al. Serum metabolomics study and eicosanoid analysis of childhood atopic dermatitis based on liquid chromatography-mass spectrometry. J Proteome Res. 2014;13(12):5715–5723. doi:10.1021/pr5007069
13. Tsikas D, Zoerner AA. Analysis of eicosanoids by LC-MS/MS and GC-MS/MS: a historical retrospect and a discussion. J Chromatogr B Analyt Technol Biomed Life Sci. 2014;964:79–88. doi:10.1016/j.jchromb.2014.03.017
14. Furman R, Lee JV, Axelsen PH. Analysis of eicosanoid oxidation products in Alzheimer brain by LC-MS with uniformly 13C-labeled internal standards. Free Radic Biol Med. 2018;118:108–118. doi:10.1016/j.freeradbiomed.2018.02.019
15. Fang M, Ivanisevic J, Benton HP, et al. Thermal degradation of small molecules: a global metabolomic investigation. Anal Chem. 2015;87(21):10935–10941. doi:10.1021/acs.analchem.5b03003
16. Bian X, Sun B, Zheng P, Li N, Wu J-L. Derivatization enhanced separation and sensitivity of long chain-free fatty acids: application to asthma using targeted and non-targeted liquid chromatography-mass spectrometry approach. Anal Chim Acta. 2017;989:59–70. doi:10.1016/j.aca.2017.08.009
17. Bian X, Li N, Tan B, et al. Polarity-tuning derivatization-LC-MS approach for probing global carboxyl-containing metabolites in colorectal cancer. Anal Chem. 2018;90(19):11210–11215. doi:10.1021/acs.analchem.8b01873
18. Gu WY, Liu MX, Sun BQ, et al. Profiling of polyunsaturated fatty acids in human serum using off-line and on-line solid phase extraction-nano-liquid chromatography-quadrupole-time-of-flight mass spectrometry. J Chromatogr A. 2018;1537:141–146. doi:10.1016/j.chroma.2018.01.015
19. Global Initiative for Asthma (GINA). Pocket guide for asthma management and prevention. Available from: http://ginasthma.org/download/520/wms-Main-pocket-guide_2017.pdf. Accessed July 10, 2019.
20. Buckley CD, Gilroy DW, Serhan CN. Proresolving lipid mediators and mechanisms in the resolution of acute inflammation. Immunity. 2014;40(3):315–327. doi:10.1016/j.immuni.2014.02.009
21. Chen W, Cao H, Lin J, Olsen N, Zheng SG. Biomarkers for primary sjogren’s syndrome. Genomics Proteomics Bioinformatics. 2015;13(4):219–223. doi:10.1016/j.gpb.2015.06.002
22. Zheng SG. Transforming growth factor-beta level: indicator for severity of disease and organ damage in patients with systemic lupus erythematosus. J Rheumatol. 2010;37(10):1983–1985. doi:10.3899/jrheum.100558
23. Powell WS, Rokach J. Biosynthesis, biological effects, and receptors of hydroxyeicosatetraenoic acids (HETEs) and oxoeicosatetraenoic acids (oxo-ETEs) derived from arachidonic acid. Biochim Biophys Acta. 2015;1851(4):340–355. doi:10.1016/j.bbalip.2014.10.008
24. Moore GY, Pidgeon GP. Cross-talk between cancer cells and the tumour microenvironment: the role of the 5-lipoxygenase pathway. Int J Mol Sci. 2017;18(2):236. doi:10.3390/ijms18020236
25. Cossette C, Gravel S, Reddy CN, et al. Biosynthesis and actions of 5-oxoeicosatetraenoic acid (5-oxo-ETE) on feline granulocytes. Biochem Pharmacol. 2015;96(3):247–255. doi:10.1016/j.bcp.2015.05.009
26. Yoshida Y, Umeno A, Shichiri M. Lipid peroxidation biomarkers for evaluating oxidative stress and assessing antioxidant capacity in vivo. J Clin Biochem Nutr. 2013;52(1):9–16. doi:10.3164/jcbn.12-112
27. Wonisch W, Falk A, Sundl I, Winklhofer-Roob BM, Lindschinger M. Oxidative stress increases continuously with BMI and age with unfavourable profiles in males. Aging Male. 2012;15(3):159–165. doi:10.3109/13685538.2012.669436
28. Romano M, Cianci E, Simiele F, Recchiuti A. Lipoxins and aspirin-triggered lipoxins in resolution of inflammation. Eur J Pharmacol. 2015;760:49–63. doi:10.1016/j.ejphar.2015.03.083
29. Szczeklik W, Sanak M, Mastalerz L, et al. 12-hydroxy-eicosatetraenoic acid (12-HETE): a biomarker of Churg-Strauss syndrome. Clin Exp Allergy. 2012;42(4):513–522. doi:10.1111/j.1365-2222.2011.03943.x
30. Zhao J, Minami Y, Etling E, et al. Preferential generation of 15-HETE-PE induced by IL-13 regulates goblet cell differentiation in human airway epithelial cells. Am J Respir Cell Mol Biol. 2017;57(6):692–701. doi:10.1165/rcmb.2017-0031OC
31. Morin C, Sirois M, Echave V, Gomes MM, Rousseau E. Functional effects of 20-HETE on human bronchi: hyperpolarization and relaxation due to BKCa channel activation. Am J Physiol Lung Cell Mol Physiol. 2007;293(4):L1037–L1044. doi:10.1152/ajplung.00145.2007
32. Nieves D, Moreno JJ. Hydroxyeicosatetraenoic acids released through the cytochrome P-450 pathway regulate 3T6 fibroblast growth. J Lipid Res. 2006;47(12):2681–2689. doi:10.1194/jlr.M600212-JLR200
33. Li J, Zhang Y, Liu Y, et al. PGC-1alpha plays a major role in the anti-apoptotic effect of 15-HETE in pulmonary artery endothelial cells. Respir Physiol Neurobiol. 2015;205:84–91. doi:10.1016/j.resp.2014.10.015
 © 2019 The Author(s). This work is published and licensed by Dove Medical Press Limited. The full terms of this license are available at https://www.dovepress.com/terms.php and incorporate the Creative Commons Attribution - Non Commercial (unported, v3.0) License.
By accessing the work you hereby accept the Terms. Non-commercial uses of the work are permitted without any further permission from Dove Medical Press Limited, provided the work is properly attributed. For permission for commercial use of this work, please see paragraphs 4.2 and 5 of our Terms.
© 2019 The Author(s). This work is published and licensed by Dove Medical Press Limited. The full terms of this license are available at https://www.dovepress.com/terms.php and incorporate the Creative Commons Attribution - Non Commercial (unported, v3.0) License.
By accessing the work you hereby accept the Terms. Non-commercial uses of the work are permitted without any further permission from Dove Medical Press Limited, provided the work is properly attributed. For permission for commercial use of this work, please see paragraphs 4.2 and 5 of our Terms.