")
Back to Journals » International Journal of Nanomedicine » Volume 17
Egr1/HSP70 Promoter-Driven Activation of Gene Expression for Synergistic Anti-Hepatoma Using PEI-MZF Nanoparticles and Radiation
Authors Zhang J, Dong M, Feng Y, Zhang D, Lin M, Yuan C, Li H, Wang L, Zhang H, Liang C
Received 15 September 2021
Accepted for publication 14 December 2021
Published 26 January 2022 Volume 2022:17 Pages 423—441
DOI https://doi.org/10.2147/IJN.S334015
Checked for plagiarism Yes
Review by Single anonymous peer review
Peer reviewer comments 2
Editor who approved publication: Dr Farooq A. Shiekh
Jia Zhang,1,2 Min Dong,1 Yan Feng,1 Dongsheng Zhang,2 Mei Lin,2 Chenyan Yuan,2 Hongbo Li,2 Ling Wang,2 Hao Zhang,2 Chen Liang2
1Nanjing Medical University Affiliated Cancer Hospital & Jiangsu Cancer Hospital & Jiangsu Institute of Cancer Research, Nanjing, Jiangsu, People’s Republic of China; 2Imaging and Nuclear Medicine, Southeast University, Nanjing, Jiangsu, People’s Republic of China
Correspondence: Yan Feng
Nanjing Medical University Affiliated Cancer Hospital, No. 42 Baiziting Road, Nanjing, 210009, Jiangsu, People’s Republic of China
Tel +86-25-83283397
Email [email protected]
Dongsheng Zhang
Imaging and Nuclear Medicine, Southeast University, No. 87 Dingjiaqiao Road, Nanjing, 210000, Jiangsu, People’s Republic of China
Tel +86-25-83272538
Email [email protected]
Introduction: Spatially restricted gene expression circumvents the gene expression and gene vector problem by enabling localized amplification. The objective of this study is to construct a spatially restricted gene expression for liver cancer therapy based upon the MFH-absorbing properties of PEI- Mn0.5zn0.5Fe2o4, gene therapy and radiation.
Methods: Mn0.5zn0.5Fe2O4 (MZF) magnetic nanoparticles were prepared by an improved chemical co-precipitation method, modified by polyethylene imine (PEI), and then the structure, modification characters, biocompatibility, temperature rise and control ability and binding efficiency of the plasmid were characterized. Then, the dual-promoter plasmid PCDNA3.1-EGR1-HSP70-HSVTK was constructed. The recombinant vectors were identified by enzyme digestion analysis and DNA sequencing. The TK gene expression level was detected by realtime-PCR assay in HEK293 cells. Also, the HSV-TK gene expression was detected in SMMC7721 cells with the help of PEI-Mn0.5Zn0.5Fe2O4. In vitro anti-tumor experiment, MTT assay and flow cytometry were used to evaluate the therapeutic effects of the cultured SMMC7721 cells treated by different ways. In vivo anti-tumor experiment, the xenografted mice were treated by different ways for three times to detect the antitumor effect.
Results: The Mn0.5Zn0.5Fe2O4 magnetic nanoparticles could be successfully prepared through improved co-precipitation process and showed good biocompatibility. And PEI had been coated on MZF complex. The modified PEI-MZF presented favorable dispensability, responsibility to magnetism, good loading capability and transfect capability. Also, pCDNA3.1-Egr1-Hsp70-HSVTK plasmid had been constructed successfully and could be induced by heat and irradiation. It would be used for further target gene therapy research. The antitumor results in vitro showed: The therapeutic effects of nanosized PEI-MZF-HSV-TK complex could significantly inhibit the proliferation of cultured liver cancer cells (SMC7721), induce cell apoptosis and had a prominent cell cycle disturbance in the S phase in vitro. The results in vivo showed: The combined therapy induced by PEI-MZF-HSV-TK could inhabit the growth of hepatocellular carcinoma xenografts by killing and inhabiting the proliferation of the tumor cells.
Conclusion: The novel site-directed heat/radiation-inducible expression system based upon the hyperthermia (by MFH) and radiation possessed superior antitumor effect in vivo and in vitro.
Keywords: radiation, magnet-induced heating, dual sensitive, magnetic nano vector
Introduction
Traditional treatment of cancer with gene therapy suffers lack of selectivity and specificity even causes some toxic side-effects.1 Several strategies have been developed, which allow control of both spatial and temporal expression of trans-genes. Spatial resolution is often achieved by using tissue- or cell-specific promoters, or exploitation of the inducible response. Many of these promoters have been developed and applied to the research, whose expression is regulated rigorously by the simple and cheap way. Like early growth response-1 (Egr1) promoter, first described more than two decades ago, is one of the most widely investigated radiation-inducible promoters. The researchers find radio-genetic therapy is a good way of combination of gene treatment and radiation. It’s effective at a lower radiation dose of the tumor and helpful at a less damage of the normal tissue. Meanwhile, the target gene could express according to their needs.2,3 But radio-genetic therapy is not so satisfied in the research, for its short and lower expression efficiency. At the same time, the radiation induction activity is not so high because of the hypoxia inside the tumor.4,5 Thermotherapy could improve the hypoxia inside the tumor and boots the radiation therapeutic effects.6,7
Heat shock has been suggested as a non-invasive and non-toxic alternative to induce gene expression locally using a heat-inducible promoter.8,9 For example, Tang et al have demonstrated that a hetero gene with hsp70 promoter could be elevated to 10 to 500-fold over background by magnetic heat (43 °C).10 Isomoto et al reported hsp 70B gene promoter-oriented HSV-tk (HSP-tk)/ganciclovir (GCV) system directed by heat shock significantly inhibited the growth of subcutaneous tumors and prolonged survival of mice with peritoneal carcinomatosis.11 Thermo resolution may be controlled by external cues, such as frequency magnetic field. Induction of heat shock promoter (HSP)-mediated gene expression by frequency magnetic field is a promising approach for achieving temporal and spatial control of gene expression.10,12,13
Although many inducible promoters have been developed, there are limitations. Hence, more effective and continual gene expression should be established, preferably with the advantages of different induced methods. The dual-promoter regulation system offering a new concept for gene expression with high efficiency. While there are a lot of evidence that the same gene expression regulated by double promoters in the nature,14 but few people used it for the expression of exogenous gene in the research. Some scholars have found that increased the number of the promoters could improve the expression level of target gene. The most common approach for solving this problem is two single promoter in series to form a dual promoter system.15–19 Finn et al studies showed that the dual promoter can effectively increase the gene expression level with non-viral vector.20 Thus it is more important in clinical application.
Based on the above considerations, we design an Hsp70 and Egr1 promoters-driven eukaryotic expression vector pCDNA3.1-Egr1-Hsp70-HSVTK to increase and control the gene expression mediated by the self-made PEI-Mn0.5Zn0.5Fe3O4 magnetic gene delivery system. The magnetic nanoparticles can absorb energy from the high frequency alternating magnetic field (AMF) to warm up. When reaching their curie temperature, they will stop absorbing the energy and the temperature will keep. Once the alternating magnetic field is removed, the temperature will drop. The curie temperature of the self-made nanoparticles is 42–44°C, which is the temperature required for hyperthermia. Thus, we intend to use the temperature-sensitive PEI-Mn0.5Zn0.5Fe2O4 nanoparticles as the vector of pEgr-1-Hsp70-HSV-TK gene and as a link to construct an anti-tumor gene/magnetic composite nano-system (pEgr1-Hsp70-HSV-TK/GCV/PEI-Mn0.5Zn0.5Fe2O4), organically combines gene therapy, hyperthermia, and nuclide therapy. It not only solves the problem of gene transfer vector, automatic heating, temperature control and targeted hyperthermia but also uses Egr1 and Hsp70 dual promoters to solve the expression of target genes in tissues and timing. Furthermore, synergistic therapy of two or more therapies may significantly improve efficacy and reduce adverse reactions through synergistic enhancement of the interactions.21
Materials and Methods
Materials
pCDNA3.1-EGFP-C1 (4.7 kb), encoding a green fluorescent protein, driven by an immediate early promoter of CMV, was purchased from Clontech Laboratories (Mountain View, California, USA); pD3SX-HSP70-HSVTK, mammalian expression vector, encoding HSVTK, driven by human Hsp70 promoter was purchased from Stressgen bioreagents corps (Canada); Polyethylenimine (PEI; averageMW25 kDa, average degree of polymerisation 580), and most of the reagents were purchased from Sigma Aldrich (St. Louis, MD, USA);HEK293 cells and SMC7721 cells were purchased from Shanghai Institute of Biochemistry and Cell Biology, Chinese Academy of Sciences (Shanghai, China). Magneto FACTOR plate was purchased from Chemicell (Berlin, Germany). The plasmids were propagated in Escherichia coli, extracted by the alkaline lysis technique, and purified by a QIAGENR kit (Hilden, German). The purity of the plasmids consisting of supercoiled and open circular forms was checked by electro-phoresis on a 1% agarose gel, and the concentration of DNA was determined by measuring UV absorbance at 260 nm. The purity (LPS) of plasmid is 0.1EU/g DNA and the amount of supercoiled DNA is 90%.
Preparation and Characterization of PEI- Mn0.5Zn0.5Fe2O4 Nanoparticles
Mn-Zn ferrite of composition Mn0.5Zn0.5Fe2O4 was prepared by the precipitation method (for details see 7), and PEI-coated Mn0.5Zn0.5Fe2O4 (PEI-MZF) was prepared by the method described before.12,21 They were characterized by HREM (High Resolution Electron Microscopy), TEM (Transmission Electron Microscope), FTIR (Fourier Transform Infrared Spectroscopy) and XRD (X-Ray Diffraction).
Toxicity of PEI-Mn0.5Zn0.5Fe2O4 Nanoparticles
PEI Cytotoxicity Test (MTT)
PEI-MZF-NPs magnetic nanoparticles were sterilized by low-temperature batch sterilization (60°C10h, 37°C12h, repeated 3 times). L929 cells were seeded in 96-well plates, and they were co-incubated with PEI-MZF-NPs/DNA complexes or PEI-DNA complexes with different N/P ratios (1, 3, 5, 7, 9 and 11) (each well contains 0.5μg plasmid DNA). The negative group was only 1640 culture medium, and the positive control was added with 0.7% polyacrylamide monomer solution. There were 8 wells in each group. Forty-eight hours later, 20μL MTT was added onto the cells, and were incubated for 4 hours. Then the liquid was discarded. 150μL/well DMSO was added in, then the mixture were shook for 10 minutes to measure the absorbance value at 493nm on the immunoassay reader (Note: There were different reports in the literature about the test wavelengths required for the maximum absorbent value. The purple solution formed by the solution of MTT crystallization with DMSO as a solvent, the maximum light absorption wavelength was about 490nm–515nm, and 493nm was taken in this experiment). Cell viability (%)=average OD of experimental group/average OD of negative group × 100%.
Hemolysis Test
Ten milliliters of New Zealand rabbit blood was extracted, then 0.5mL of 20g/L potassium oxalate was added in, and 10mL of saline per 8mL was added in to obtain diluted anti-coagulated rabbit blood. 0.2mL rabbit blood diluent was added into 10mL distilled water and measured by spectrophotometer. The wavelength was 540nm and the OD value was 0.685, which met the test requirements. PEI-Mn0.5Zn0.5Fe2O4 nanoparticles were washed twice with distilled water, dried, and suspended with normal saline to 0.1g/mL; Normal saline was used as negative control and distilled water as positive control. After preheating in 37°C water bath, 0.2ml of diluted rabbit blood was added to each group, and then gently mixed. The supernatant of each tube was taken by centrifugation (2500g/min, 5min) after 37°C water bath for 60min.Spectrophotometer to measure the OD value at 545nm, the absorbance value of positive control group should be 0.8±0.3, the absorbance value of negative control group should not be greater than 0.03, hemolysis rate (%) = (mean OD of the tested sample - mean OD of negative control)/(positive control OD - mean OD of negative control) ×100%,If the hemolysis rate <5%, indicating that the material has no hemolysis effect and meets the requirements of hemolysis test for medical materials. Three parallel samples were set for each group.
The Median Lethal Dose (LD50) Test of Mice
Sixty Kunming mice were randomly divided into 6 groups with 10 mice in each group. After fasting overnight, mice in each group were intraperitoneally injected with PEI-MZF nanoparticles suspension at dosage of 1.568g/kg, 2.8g/kg, 5g/kg, 8.92g/kg and 15.94g/kg, respectively. 0.9%NaCl equivalent to the maximum dose was injected as the negative control group. The animals in each group were recorded for 15 days after injection. At the end of the experiment, Karber method was used to calculate the LD50 of the nanoparticles in mice, LD50 = LG-1 (XK-I(∑ P-0.5)). XK is the logarithm of the maximum dose group, P is the response rate of each group, expressed as a decimal, I is the logarithm of the ratio of the two adjacent dose groups (LG (high/low)), and n is the number of animals in each group.
Mice Bone Marrow Micronucleus Test
Thirty-six Kunming mice were divided into 6 groups. Six in each group. PEI-MZF nanoparticle suspension was intraperitoneously injected at dosage of 5g/kg, 2.5g/kg, 1.25g/kg and 0.625g/kg, respectively. 40mg/kg cyclophosphamide was injected in as the positive control, and the maximum dose of 0.9%NaCL was as the negative control. The experiment method was adopted at 30h, that is, the interval between the two administrations of the test substance was 24 hours. Six hours after the second administration, the animals were sacrificed. The femoral bone marrow was taken, fixed with methanol for 5 minutes, dried and stained with Giemsa dye for 15 minutes, and then observed. One thousand polychromatic erythrocytes (PCE) with MN were counted in each mouse. The results were expressed in ‰. Poisson distribution was used to detect whether there were statistical differences between the groups
Determination of PEI Adsorption on Nanoparticles
According to the literature,22 the Bradford method was used to detect the PEI-MZF magnetic fluids prepared under different pH conditions. The mixture was centrifuged in a high-speed centrifuge for 1 hour. Ten microliters of the supernatant was aspirated from the mixture, and diluted to 100μL with PBS buffer, then 1000μL of Coomassie Brilliant Blue solution was added in. Two minutes later, UV/vis spectrometer (U-2001, HITACHI Japan) was used to measure the optical density of the new mixture at 595nm wavelength. Comparing with the standard curve (drawn under the same experimental conditions), the amount of free PEI in the supernatant was obtained. According to the formula [N] = (C total-C free)/[NP], the amount of PEI adsorbed on nanoparticles (mg/g) under different modification conditions was calculated. Where [N] represents the amount of PEI adsorbed on the nanoparticles, C total and C free respectively represent the concentration of added and remaining PEI (mg/mL), and [NP] represents the concentration of nanoparticles (g/mL).
Heating Characteristics of PEI-Mn0.5Zn0.5Fe2O4 Nanoparticles in High Frequency Electromagnetic Field
Different doses of PEI-Mn0.5Zn0.5Fe2O4 nanoparticles were dispersed in 5 mL 0.9% NaCl, to the concentrations of 8, 10, 12.5, 15g/L, respectively. Then, the nanoparticle fluid was placed in a flat-bottomed cuvette, and in turn heated under the high frequency electromagnetic field (SP-04C, Shenzhen, China) machine. The output frequency was 230 KHz and the output current was 30 ampere. Then, the temperature was measured every 5 minutes in 1 hour.
DNA Binding Assay of PEI-MZF-NPs
pEGFP-C1 DNA solution (0.01 mg/mL) was mixed with various amounts of PEI-MZF-NPs (10 mg/mL), to a final volume of 1 mL. The nanoparticle–DNA complexes were prepared at ratios of 0:1, 5:1, 10:1, 20:1, 30:1 (weight/weight), respectively. The complex formation study was performed at room temperature and allowed to stand for 30 minutes to attain complexes. Then, the PEI-MZF-DNA complexes were electrophoresed by 1% agarose gel electrophoresis at 100 V for 45 minutes.
Construction and Identification of the Eukaryotic Expression Plasmids: Egr1-Hsp70- HSVTK
Construction of Egr1- HSVTK
The primer sequences of HSVTK were designed according to pD3SX-HSP70-HSVTK template (Stressgen), and amplified by PCR. In order to facilitate subsequent experiment, several restriction sites were added on the two sides of HSVTK. Then, the HSVTK segment was subcloned into pCDNA3.1-Egr1-EGFP vector (Constructed and kept in our lab [11]) on EcoRI and XhoI sites. Synthetic products were identified by PCR amplification and gene sequence analysis (sequence primer: Egr1-f, BGH-r).
HSVTK-f:5ʹ-G GAATTC GCCACC ATGGCC TCGTAC CCGGCCAT-3ʹ (EcoRI)
HSVTK-r:5ʹ-CCG CTCGAG TCAGTTAGCCTCCCCCATCT-3ʹ (XhoI)
Product: Length=1131+13+9=1153bp, GC%=65.4, Ta=59.7
PCR Amplification of Hsp70 Promoter Segments
The primer sequences of Hsp70 promoter was designed according to pD3SX template, and amplified by PCR. In order to facilitate subsequent experiment, several restriction sites were also added on the two sides of Hsp70. Synthetic products were identified by enzyme cleavage and gene sequence analysis (gene name: Hsp70; gene length: 434 bp; carrier name: pUC57; cloning site: EcoRI, HindIII).
Hsp70-f:5ʹ-CCC AAGCTT CTCGAGGCGCG TCCTCAGA-3ʹ (HindIII).
Hsp70-r:5ʹ-G GAATTC GGTCGACTAGAGAGCTTCTT-3ʹ (EcoRI).
Product:Length=418+9+7=434bp, GC%=70.6, Ta=58.
Hsp70p Was Sub-Cloned into Egr1-EGFP to Get Hsp70-Egr1-EGFP
The amplified Hsp70p fragments were collected and sub-cloned into Egr1-EGFP on HindIII and EcoRI sites. After transfection, the plasmids were purified and identified by PCR.
Hsp70-f:5ʹ-CCC AAGCTT TCGAGGCGCGTCCTCAGA-3ʹ (HindIII).
Hsp70-r:5ʹ-G GAATTC GGTCGACTAGAGAGCTTCTT-3ʹ (EcoRI).
Product:Length=418+9+7=434bp, GC%=70.6, Ta=58.
According to the PCR electrophoresis results, the correct Hsp70-Egr1-EGFP sequences were selected to be sequenced, EGFP-N-3 as the sequence primer.
Construction of Hsp70-Egr1p-HSVTK
Hsp70- and Egr1p-HSVTK were connected after Egr1-Hsp70-EGFP digested by HindIII and EcoRI. Then, the connected products were transfected into DH5α. At last, the plasmids were isolated and purified after enlargement culturing and tested by HindIII &EcoRI enzyme cleavage. For further, the right clone was verified by MluI enzyme cleavage. (The flow chart of pHsp70-Egr1-HSVTK construction see Figure 1.)
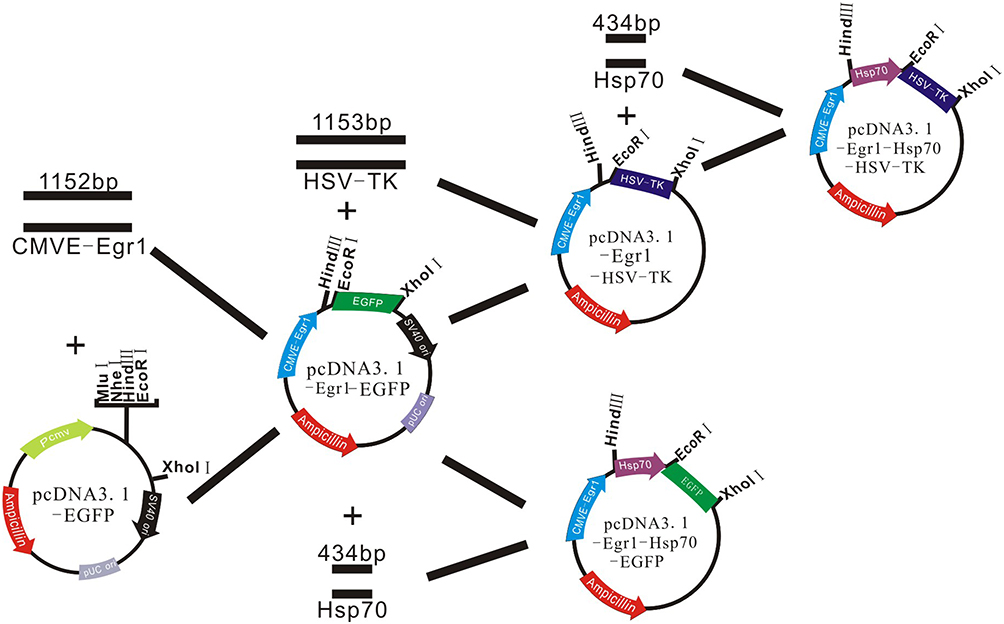 |
Figure 1 The flow chart of pHsp70-Egr1-HSVTK construction. |
In vitro Optimization of Thermo and Radiation Driven Expression
Cell Transfection and Optimization of Expression Efficiency Assay Using PEI-Mn0.5Zn0.5Fe2O4
HEK293 cells were transfected with Egr1-Hsp70-HSVTK (or Egr1-HSVTK or Hsp70-HSVTK) using PEI-Mn0.5Zn0.5Fe2O4 (self-made) at a ratio of 1:20 (DNA: PEI-MZF, w/w), and placed on a Magneto FACTOR plate (magnet-transfection) for 30 minutes. Then, the medium was replaced with fresh medium containing serum, and continued to incubate for 24 hours. As a control, blank plasmid (pCDNA3.1) were transfected into the cells. To investigate the effect of the radiation and heat on the induction of transgene expression, the transfected cells were exposed to varying conditions.
- Twenty-four hours later, cells were exposed to 2Gy (6 Me V) X-ray radiation, using Siemens medical linear accelerator and harvested at time point of 1h, 6h, 12h, 24h, 48h, respectively. Then, the HSVTK expression level in the cells were tested by real-time PCR analysis.
- The transfected cells were exposed to varying dose of X-ray (1, 2, 4, 8, 16Gy), following the ways as described above. Six hours after treatment, HSVTK expression of the cells were analyzed by real-time PCR.
- The cells transfected with Hsp70-Egr1-HSVTK or Egr1-HSVTK or Hsp70-HSVTK were treated by 2Gy X-ray, thermotherapy mediated by MZF, both of radiation and thermotherapy, and none of the treatment, respectively. Six hours later, the expression of HSVTK in the cells was also tested via real-time PCR.
HSVTK Expression Tested by Real-Time PCR
- Total RNA from each cell population was extracted using a commercial kit according to the instructions provided by the supplier (Takara). Total RNA was diluted to 5 ng/mL in water immediately to perform RT–PCRs. GAPDH was used as internal reference.
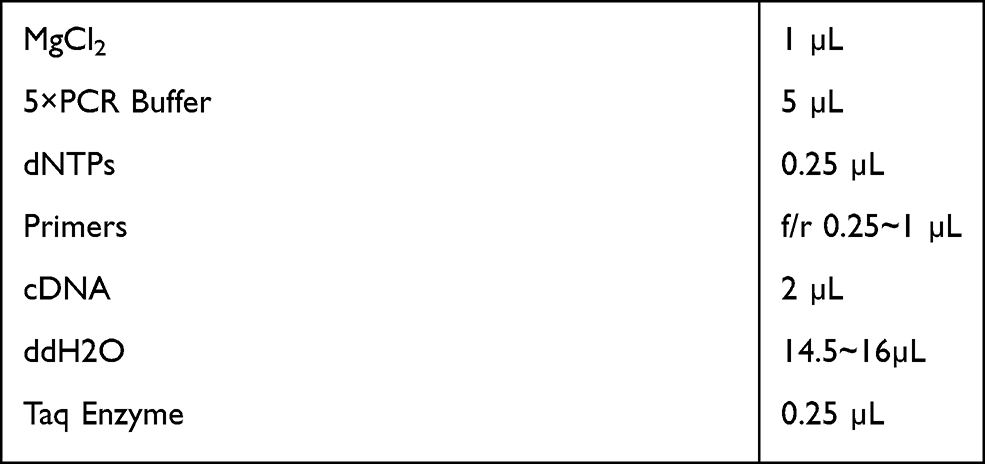
- The real-time PCRs required the following primers:
HSVTK-f: CCC ACG CTA CTG CGG GTT TAT (153–174).
HSVTK-r: TGT TGG TGC CGG GCA AGG TC (621–602).
Product Length: 469bp Ta=51°C.
GAPDH-f: 5ʹ–GCCACATCGCTCAGACAC– 3ʹ.
GAPDH-r: 5ʹ–CATCACGCCACAGTTTCC– 3ʹ.
Product Length: 614bp Ta=53°C.
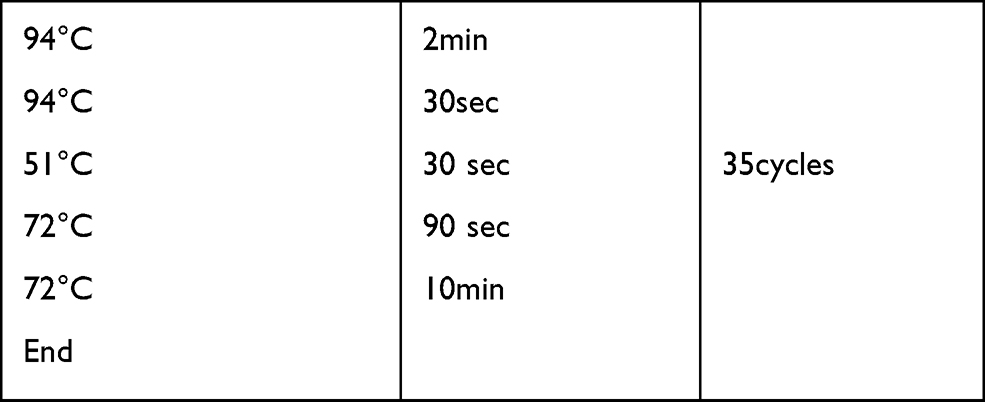
- Reaction and Analysis
Regents:
 |
|
Mix them on the ice, then centrifuge (4000 rpm, 10s), PCR
 |
|
- Data analysis of QPCR
The expression of gene F value=2−ΔΔct
ΔΔct= (Average ct value of target gene in experiment group – Average ct value of housekeeping gene in experiment group) – (Average ct value of target gene in control group – Average ct value of housekeeping gene in control group).
The higher F value means the higher gene expression level.
Verification of Transfection and Expression of Egr1/Hsp70-HSVTK in SMC7721 Cells
To investigate the transfection ability of PEI-MZF NPs in vitro, the SMC7721 cells (a kind of HCC cells, purchased from Shanghai Institute of Biochemistry and Cell Biology) were transfected with Egr1-Hsp70-HSVTK (or Egr1-HSVTK or Hsp70-HSVTK) using PEI-Mn0.5Zn0.5-Fe2O4 (self-made) at a ratio of 1:20 (DNA: PEI-MZF), and placed on a Magneto FACTOR plate (magnetofection) for 30 minutes. Then, the medium was replaced with fresh medium containing serum, and continued to incubate for 24 hours. As a control, blank plasmid (pCDNA3.1) was transfected into the cells. To investigate the effect of the radiation and heat on the induction of transgene expression, the transfected cells were exposed to 2Gy (6 Me V) X ray radiation, and harvested at time point of 12h. And HSVTK expression of the transfected cells were analyzed by RT-PCR.
The in vitro Anti-Hepatoma Therapy of Hsp70-Egr1-HSVTK Using PEI-MZF Nanoparticles and Radiation
MTT Assay for Cell Proliferation
The cytotoxicity of the combination therapy on SMC7721 cells was estimated by MTT assay. Twelve hours before transfection, cells were plated in a 96-well microtiter plate at a density of 4 × 10³ cells per well (day 0) and 6 holes each group. The Hsp70-HSVTK or Egr1-HSVTK or Egr1- Hsp70-HSVTK plasmid DNAs were introduced to cells using the PEI-MZF nano-particles and Magneto FACTOR plate (day 1). They were treated with different ways: (1) negative control group (RPMI1640 culture medium), (2) PEI-Mn0.5Zn0.5Fe2O4 hyperthermia group, (3) 2Gy radiation therapy group, (4) Egr1-HSVTK combined with 2Gy radiation therapy group, (5) Hsp70-HSVTK+ PEI-Mn0.5Zn0.5Fe2O4 combined with hyperthermia group (MZF-mediated magnetic hyperthermia), (6) Egr1-Hsp70-HSVTK + PEI-Mn0.5Zn0.5Fe2O4 combined with hyperthermia and 2Gy radiation therapy group. The concentration of PEI-Mn0.5Zn0.5Fe2O4 magnetic fluid was maintained at 10 mg/mL in the experimental group and hyperthermia (43°C for 1h) was performed by PEI-Mn0.5Zn0.5-Fe2O4 fluid under AMF (200kHz, output current 30A, SPG-06A) after overnight transfection (day 2). The radiation therapy group was given 2Gy X-ray irradiation (linear accelerator) after overnight transfection (day 2). The radiation combined hyperthermia group was given heat treatment immediately after receiving the irradiation (day 2). Cells in groups 4–6 were also treated with GCV at the concentration of 100mg/mL. The medium in each well was replaced on days 3 and 4. On day 5, 20μL of MTT were added onto the treated cells, and continue to be incubated for 4 hours. Then, the supernatant was replaced with 150μL of DMSO, and shook for 10 minutes, then was placed on the microplate reader to read the absorbance (A) value at 492nm. The cell proliferation rate (%) = OD value (experimental group)/OD value (negative group) × 100%.
Flow Cytometry for Detection Cell Cycles
Twenty-four hours before transfection, the cells were plated in a 50mL culture flask at a density of 6 × 10⁵ cells per flask (day 0) and 3 flasks each group. Then, the cells were divided into 6 groups and treated with the ways as described above. After 48 hours, they were harvested to prepare a single cell suspension, washed with PBS, then fixed with 70% cold ethanol for 24 hours. Before detection, the cells were washed twice with PBS, incubated with 50mg/L RNase at 37°C for 30 minutes, stained with 0.5mL PI solution (20mg/mL, 0.25mg/mL RNase A) at room temperature (avoid light) for 30 minutes, and immediately filtered with 300 mesh screen for machine analysis (FACS Vantage SE).
In vivo Anti-Hepatoma Therapy
The 5-week-old male and female BALB/c nu/nu mice were injected subcutaneously in the right forelimb with 2.5 × 10⁶ SMC7721 cells (day 0). When the xenografts tumor reached 80–120mm3, the Hsp70-HSVTK or Egr1-HSVTK or Egr1-Hsp70-HSVTK plasmid DNAs were subcutaneously introduced in using the PEI-Mn0.5Zn0.5-Fe2O4 method on days 21, 23 and 25. They were divided into 6 groups: (1) negative control group (0.9% saline), (2) 2Gy radiation therapy group, (3) hyperthermia group (4mg PEI-Mn0.5Zn0.5Fe2O4 fluid), (4) Egr1-HSVTK combined with 2Gy radiation therapy group, (5) Hsp70-HSVTK+ Mn0.5Zn0.5Fe2O4 combined with hyperthermia group, (6) Egr1-Hsp70-HSVTK + PEI-Mn0.5Zn0.5Fe2O4 combined with hyperthermia and 2Gy radiation therapy group (MZF-mediated magnetic hyperthermia). Negative group was injected in 0.2mL saline on days 22, 24 and 26. The radiation therapy group was given 2Gy/min X-ray irradiation (linear accelerator) on days 22, 24 and 26 and the distance from the skin was 1.0m. The tumor was exposed to the radioactive source, and the rest of the body was protected with a lead block in a suitable plastic mold. Hyperthermia (43°C for 1h) was performed by PEI-Mn0.5Zn0.5-Fe2O4 under AMF on days 22, 24 and 26. The radiation combined hyperthermia group was given heat treatment immediately after receiving the irradiation on days 22, 24 and 26. GCV (30 mg/kg per day) was injected intraperitoneally until day 14 in groups 4–6. During the treatment, the animal’s behavior change, weight, daily food intake, daily water intake, tumor surface change were observed. The tumor diameter was measured with calipers, and tumor volume (V) was calculated using the formula: V= abc/2 (where a is the longer diameter, b is the shorter one and c is the height). The results were expressed as percentages relative to tumor size of the negative group. Tumor inhibition rate=(Vave of negative group − Vave of treatment group)/ Vave of negative group×100% (Vave is the average volume of the tumor in the group). After the treatment, the tumor tissue was stripped, weighed, fixed with 4% formaldehyde, sectioned, and HE stained to observe the changes in cell structure. Also, the other tissues were stripped and HE stained to observe the changes in the treatment group. Care, treatment and euthanasia of the animals were performed in accordance with the Institutional Animal Care and Use Committee (IACUC) guidelines and approved by the IACUC (approval number:1,802,135, Southeast University, Nanjing, China). No mice showed signs of toxicity in response to the therapeutic approaches.
Statistical Analysis
Values were expressed as mean ± SD. The data were analyzed with the SPSS 20.0 program, with P < 0.05 taken as the criterion for statistical significance.
Results and Discussion
Characteristics of MZF-NPs
The self-prepared Mn0.5Zn0.5Fe2O4 nanoparticles are high electron-dense and uniform in size with average diameter 30–40 nm observed by HREM (Figure 2A). EDS confirms that the prepared nanoparticles only contain four elements of manganese, zinc, iron and oxygen, and PDF (Powder diffraction File) cards confirm their XRD patterns (Figure 2B and C). Before the modification, the nanoparticles are aggregated, due to the strong interactions between the particles. This aggregation effect is unfavorable for its application. After modification, PEI-Mn0.5Zn0.5Fe2O4 nanoparticles show little change in appearance and size. They are approximated spherical shape, improved dispersibility, and less agglomeration, indicating that the interaction between magnetic particles is smaller due to the existence of the PEI shell (Figure 2D). Nanomaterials of this size could avoid excretion by the kidneys and phagocytosis by phagocytic cells of the spleen, increasing circulation time and allowing nanoparticles to accumulate in the tumor.23
 |
Figure 2 (A) HREM image of Mn0.5 Zn0.5Fe2O4. (B) SEM-EDS analysis of Mn0.5 Zn0.5Fe2O4. (C) XRD analysis of Mn0.5 Zn0.5Fe2O4. (D) TEM image of the PEI-Mn0.5 Zn0.5Fe2O4. (E) FTIR of PEI- Mn0.5 Zn0.5Fe2O4 and Mn0.5 Zn0.5Fe2O4. (F) Adsorption of PEI on the surface of nanoparticles under different pH. (G) Scheme of PEI/MZF interaction with DNA. |
Not only the size but also surface modifications, shape, charge, and flexibility can affect the treatment results.24 The FTIR spectra of MZF particles with and without PEI is presented in Figure 2E. Compared the two curves, the dispersant-treated powder presents specific peaks in 713.5 cm-1,1486.8 cm-1, 1577.5 cm-1, 2844 cm-1and 3013 cm-1 dot, which corresponding to the peaks of –NH2– and –CH2–. –NH2– and –CH2– peaks exist in PEI but not in MZF, which proves that PEI is successfully adsorbed on the surface of MZF particles. Figure 2F shows the PEI adsorption amount on the surface of the nanoparticles, under different PH. When PEI is less than 20% (% of the mass), as more PEI adding, adsorption quantity of PEI also gradually increase. The adsorption capacity reached the highest value of 9.81mg/g when PEI was added 15% at pH 5.0. When pH was 7.0 and 9.0, PEI added 12.5%, the adsorption capacity reached the highest values of 8.53mg/g and 6.49mg/g, respectively. Thus, we chose 20% PEI (w/w) and pH5 as the preparation conditions for the modifications.
Why did we chose PEI? PEI was an effective cationic polymer gene carrier, with an active nitrogen atom (–NH2) every two carbon atoms in the molecule. These nitrogen atoms could be protonated to get a positive charge (–NH3+) under physiological conditions, which could help form complexes with negatively charged phosphate groups on DNA by electrostatic adsorption (the scheme see Figure 2G). In addition, the surface charge of PEI-DNA complex was significantly lower than that of PEI, which was conducive to the cell membrane fusion and reduce the toxicity of the vector. The ability of PEI binds to DNA depended on the ratio of the two (N/P) and the particle size of the complex. Nano-sized particles helped to achieve carrier targeting and cell penetration effectiveness.24 The self-prepared PEI-Mn0.5Zn0.5Fe2O4 nanoparticles were suitable for the carrier with average diameter 30–40 nm.
Toxicity of PEI-Mn0.5Zn0.5Fe2O4 Nanoparticles
PEI Cytotoxicity Test (MTT)
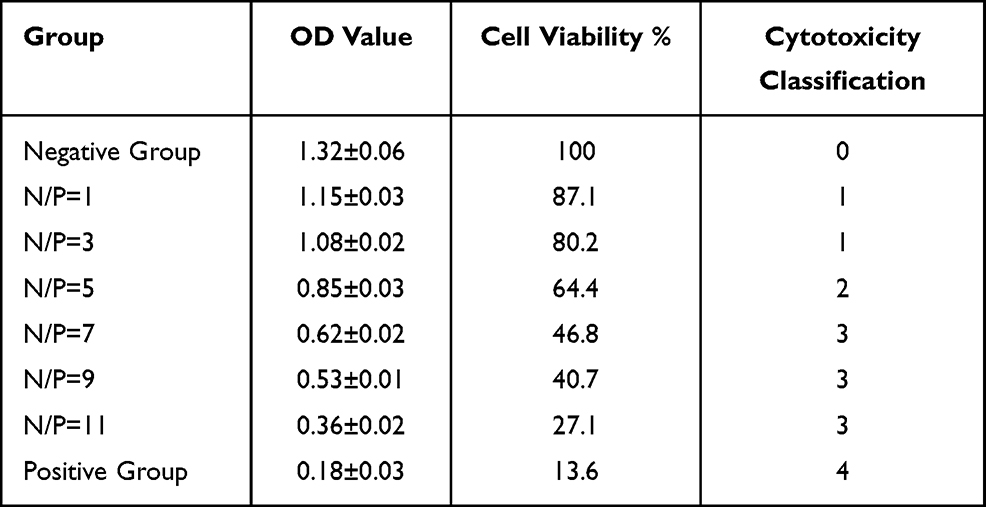
It is reported that as the N/P ratio increased, so did the toxicity of PEI/DNA complexes to the cells, often due to the increased adsorption of free cations to the cell membranes on the surface of PEI/DNA complexes. In this study, for the two compounds, PEI-MZF/DNA and PEI/DNA, as the N/P ratio increases from 1 to 9, the toxicity to the cells increases, as evidenced by a gradual decline in cell viability (Tables 1 and 2). However, for MZF-NPs, although the toxicity to cells increases with the increase of the N/P ratio, the cell survival rate remains above 54.8% in all tested N/P ratios, whereas the toxicity of PEI/DNA to cells increases significantly with the increase of the N/P ratio, and the cell survival rate decreases significantly, to a minimum of only 27%. A comparison of the two groups is shown in Figure 3. In the following study, we used PEI/MZF at a N/P ratio less than 5. Below this ratio, the cell proliferation rate is >75%, cytotoxicity classification is level 1, and is a qualified biological material.
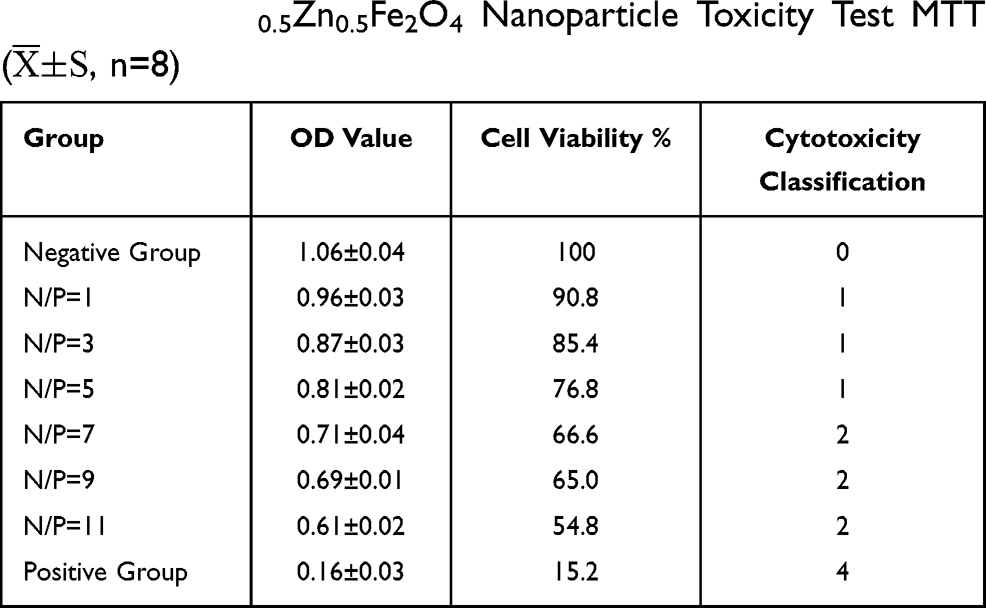 |
Table 1 PEI-Mn0.5Zn0.5Fe2O4 Nanoparticle Toxicity Test MTT ( |

 |

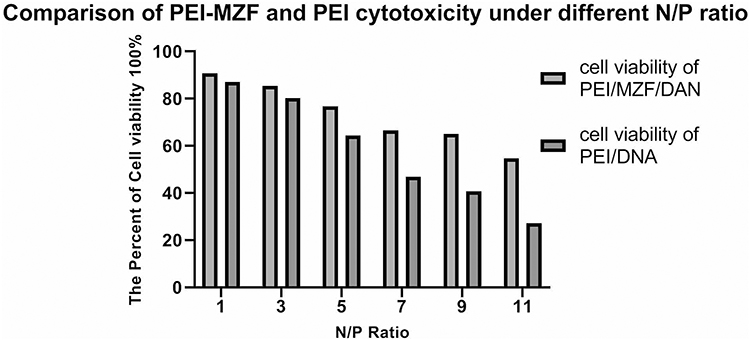 |
Figure 3 Comparison of PEI-MZF and PEI cytotoxicity under different N/P ratio The N/P ratio of PEI/MZF/DNA and PEI/DNA was 1, 3, 5, 7, 9, 11. |
Hemolysis Test
The absorbance values of negative control group (normal saline), positive control group (distilled water) and experimental group (PEI-MZF normal saline suspension) at 545nm are listed in Table 3, and the hemolysis rate is 0.608%, far less than 5%.
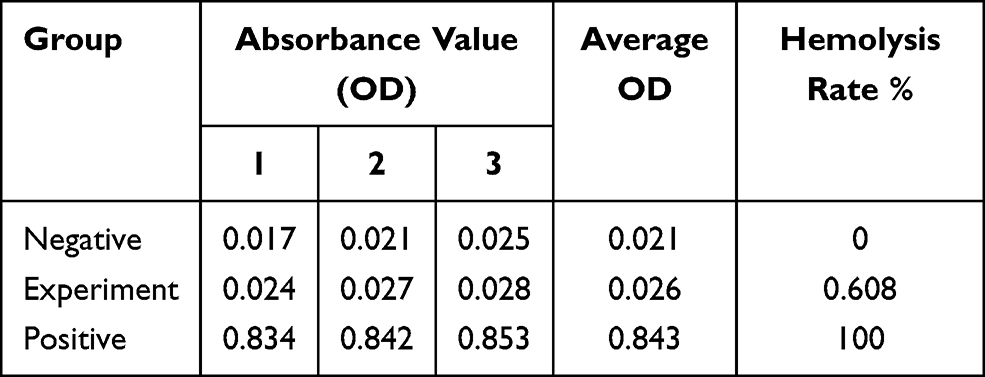 |
Table 3 Hemolysis Test Results |
The Median Lethal Dose (LD50) Test of Mice
Mice in experimental groups were injected with different doses of PEI-MZF nanoparticles suspension, and some mice showed symptoms of lethargy, loss of appetite, diarrhea and so on. Some died in the following days. Fifteen days after the administration, the deaths of the animals in each group were recorded, as listed in Table 4. The LD50 of the mice was 3.392g/kg calculated by Karter method, and the 95% confidence interval was 1.245~9.243g/kg, indicating that the nanoparticles have a wide range of safety values.
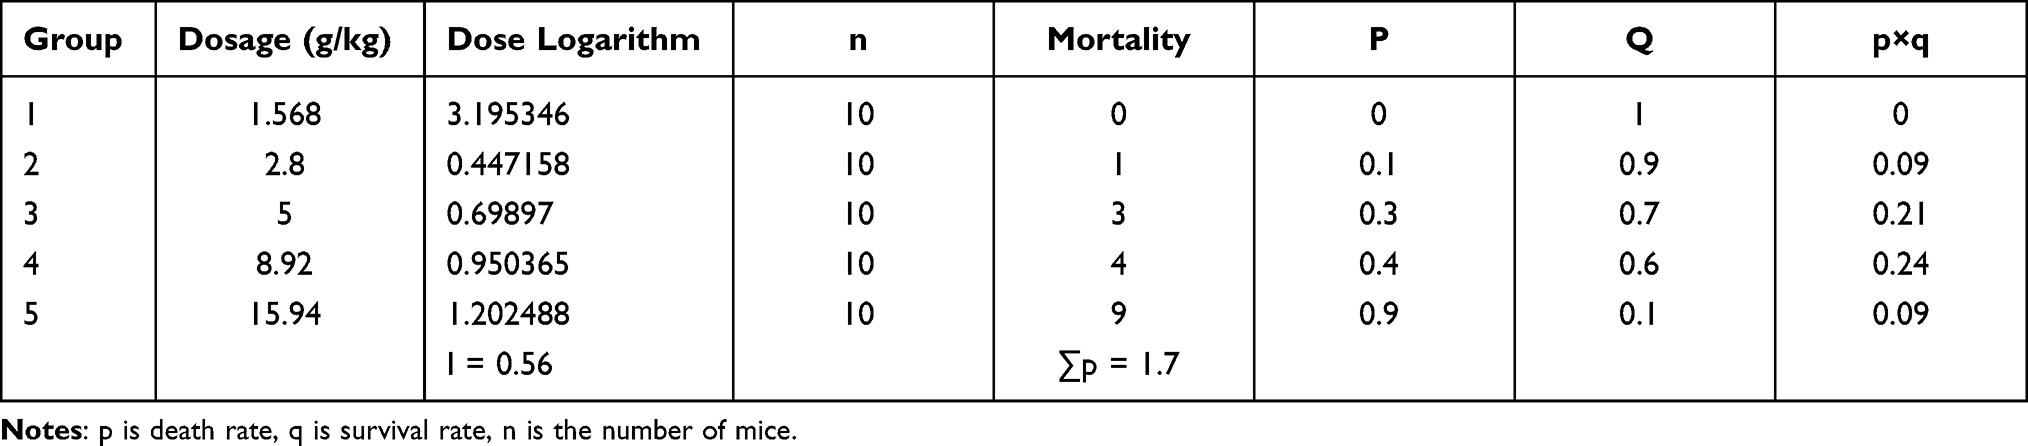 |
Table 4 Results of Acute Toxicity Test of Nanoparticles |
Mice Bone Marrow Micronucleus Test
Micronucleus (MN) in polychromatic erythrocytes in each group was detected, and no significant difference is found between the experimental group and the negative control group, as shown in Table 5. It can be considered that the material has no teratogenic or mutagenic effect.
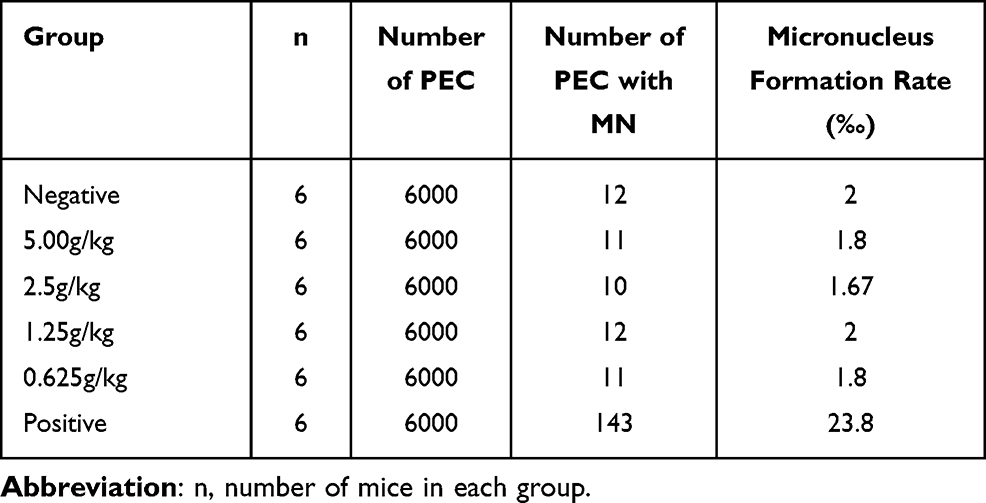 |
Table 5 Micronucleus Test Results |
The experimental results show that there is no hemolysis effect contacting with blood, and the hemolysis rate is 0.608%, far less than 5%, which meets the requirements of hemolysis test for medical materials. In this experiment, micronucleus formation rate is 2‰ when mice were given the highest concentration of 5g/Kg by micronucleus test. Micronucleus test show that there is no significant difference in the micronucleus formation rate of bone marrow in experimental group compared with that in the negative control group (P > 0.05), but there's significant difference compared with that in the positive control group (P < 0.05), so it could be considered that the material has no teratogenic or mutagenic effect. The LD50 is 3.392g/kg, and the 95% confidence interval is 1.245~9.243g/kg. LD50 in 0.5–5g/kg body weight is a low toxicity category, but such a large dose will not be used in the actual gene carrier. From the results of biocompatibility of PEI- MZF, PEI-Mn0.5Zn0.5Fe2O4 is non-toxic in vivo and in vitro, and has good biocompatibility.
Heating Test of PEI- Mn0.5Zn0.5Fe2O4 in vitro
Under the high frequency alternating magnetic field, the heating capacity of the magnetic fluid is positively related to the concentration. As the MZF concentration increases, the maximum temperature rises, but they have common rules: The temperature rises rapidly within 30 minutes, and rises slowly from 30 to 40 minutes. After 40 minutes, the temperature hardly rises and remains constant at a certain level (Figure 4). With different concentrations of magnetic fluid, the maximum temperature can rise to 39°C, 43.5°C, 47°C and 50°C respectively, and it can be kept for 20 minutes in a magnetic field. The temperature of 10g/L MZF solution can rise to 43.5°C, which is the ideal temperature for the treatment of tumors while not harming normal tissues. Later on, 10 g /L was selected for magnet hyperthermia.
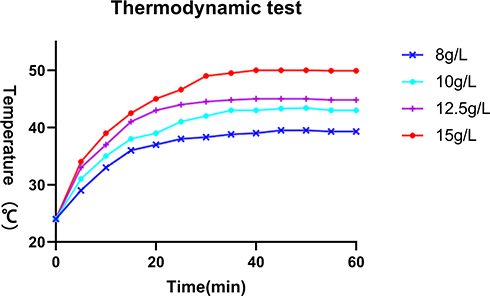 |
Figure 4 Thermodynamic test of different concentration of PEI- Mn0.5 Zn0.5Fe2O4in vitro. |
DNA Binding Assay of PEI-MZF-NPs
The binding capacity was evaluated based on the relative intensity of the free DNA band in each well with respect to the well with naked DNA. Figure 5 shows the retarded DNA due to nanoparticles binding at varying w/w ratios. As a result, the synthesized PEI-MZF-NPs could bind DNA effectively, resulting in complete retention of the DNA by the agarose gel. When the ratio of 20, DNA migration is completely retarded by PEI-MZF-NPs. Later on, the ratio of 20:1 (nanoparticle/DNA) was selected for gene transfection.
 |
Figure 5 Image of agarose gel electro-phoresis of plasmid DNA and complexed with PEI- Mn0.5 Zn0.5Fe2O4 (Lane1-5(PEI-MZF/DNA w/w): 0:1; 5:1; 10:1; 20:1; 30:1). |
Because of its high stability, chemical simplicity, and high transfection activity, PEI has been widely used to function as gene delivery carrier, either in branched (b-PEI) or linear (l-PEI) form.25 Several studies have attributed the transfection efficiency of PEI to the so-called proton sponge effect.26,27
Construction and Identification of Egr1- HSVTK
Recombinant plasmid of Egr1-HSVTK was confirmed by PCR amplification and gene sequence analysis, which can be seen from Figure 6A with 1153bp HSVTK specific band in lane 1 and Figure 6B with the same sequence as that of HSVTK template.
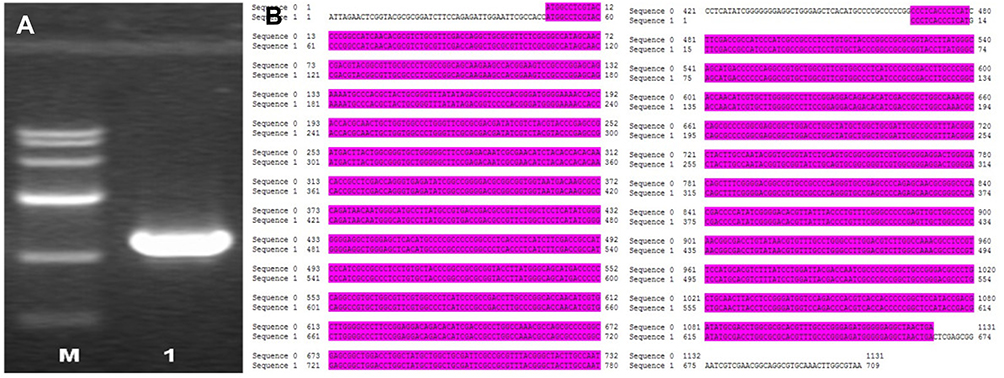 |
Figure 6 (A) PCR gel electrophoresis of Egr1-HSVTK transfected (lane 1: Marker IV (each band in turn from top to bottom is 7 K, 5.5 K, 3.5 K, 2 K, 1 K, 500 bp); lane 1: Egr1-HSVTK). (B) Sequencing and alignment of Egr1-HSVTK (sequence 0: HSVTK; sequence 1:Egr1-HSVTK-Egr1-f.ab1; software: Dnassit 2.0). |
Construction and Identification of Hsp70- Egr1- EGFG and Hsp70- Egr1- HSVTK
Recombinant plasmid of Hsp70-Egr1-EGFP was also confirmed by PCR amplification and gene sequence analysis, which can be seen from Figure 7A with 434 bp Hsp70 band in lane 1–4 and Figure 7B with the same sequence as that of Hsp70 template.
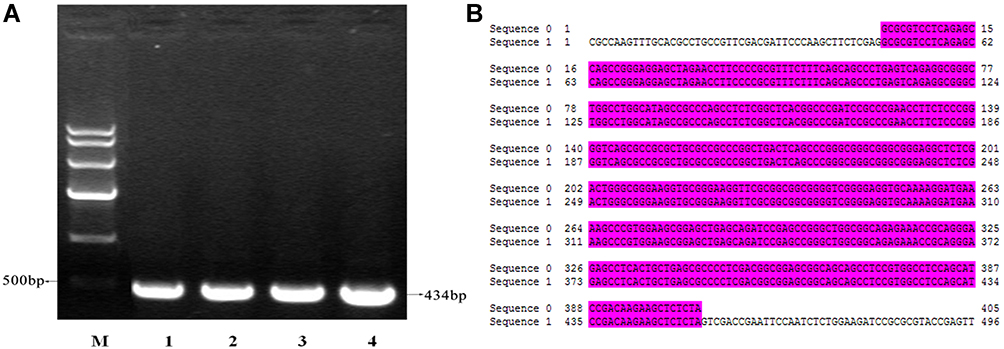 |
Figure 7 (A) PCR gel electrophoresis of Hsp70-Egr1-EGFP transfected (lane 1: Marker IV each band in turn from top to bottom is 7 K, 5.5 K, 3.5 K, 2 K, 1 K, 500 bp); lane 1–4: Hsp70-Egr1-EGFP①-④). (B) Sequencing and alignment of Hsp70-Egr1-EGFP (sequence 0: HSP70; sequence 1: Hsp70-Egr1-EGFP-f.ab1; software: Dnassit 2.0). |
Recombinant plasmid of Hsp70-Egr1- HSVTK was confirmed by restriction enzyme digestion analysis, which can be seen from Figure 8A (dual enzyme digestion) and Figure 8B (single enzyme digestion). If Hsp70 fragment was inserted correctly into Hsp70-Egr1 -HSVTK, the fragment length between EcoRI and Hind III should be about 434 bp, because the length of Hsp70 is about 434 bp. As shown in Figure 8A of restriction enzyme digestion of Hsp70-Egr1-HSVTK, Hsp70 promoter was cloned correctly.
 |
Figure 8 (A) Egr1-Hsp70- HSVTK was identified by EcoRI and HindIII dual restriction enzyme digestion (lane 1: Marker IV each band in turn from top to bottom is 7 K, 5.5 K, 3.5 K, 2 K, 1 K, 500 bp;lane 1–3: pCDNA3.1-Egr1- Hsp70-HSVTK①-③digested by EcoRI and HindIII.). (B) Egr1- Hsp70-HSVTK was identified by MluI restriction enzyme digestion (lane 1: Marker IV each band in turn from top to bottom is 7 K, 5.5 K, 3.5 K, 2 K, 1 K, 500 bp;lane 1–2: Hsp70-Egr1- HSVTK ①-②digested by MluI.). |
Theoretically, there was only one MluI restriction site in the original pCDNA3.1-EGFP, if Egr1 was successfully inserted into the plasmid, another MluI restriction site would be brought in, and the fragment length between the two sites of MluI should be about 1600 bp. Seen from Figure 8B, Egr1 has been successfully inserted. So it can be seen that the eukaryotic recombinant plasmid Hsp70-Egr1-HSVTK was successfully constructed.
In vitro Optimization of Thermo and Radiation-Driven Expression
Real time-PCR assay was used to detect TK gene expression in HEK293 cells. Amplification was monitored by the uptake of SYBR Green with automated estimation of Ct values throughout each reaction. The gene expression relative quantity was calculated as described above.
In order to study the radio-sensitivity of the promoter at different time point, TK gene expression in HEK293 cells after 2Gy X ray irradiation at 1 h, 6 h, 12 h, 24 h and 48 h was tested. As Figure 9 shown, the fluorescence intensity began to increase 1 hour later and peak at 6 hour time point (Figure 9). Before 6 hour, Egr1 promoter driven-TK expression increased with the extension of time, then gradually reduced. Compared the highest level with the other one, the expression of TK at 6 hour (4.53±0.29 mean fluorescence intensity) is 5.8 times of that at 48 h (0.33±0.15), 2.35 times of that at 1 h ((1.86±0.21), and 1.19 times of that at 12 h (3.72± 0.30). And then the expression level at 48 h reduced to 2/5 of that at 1 h. After induced by radiation, the expression of TK all increased compared to that of none induction. The one-way analysis of variance shows the expression of TK has statistically significant between 6h, 12h groups and 1h, 24h, 48h groups (P<0.05).
 |
Figure 9 TK expression induced by radiation at different time point. Compared the TK expression at 48h with that in other groups, P < 0.05. Compared the TK expression at 6h with that at other time point, P < 0.05. |
In order to study the gene expression induced by different doses of radiation, the cells transfected with Egr1-Hsp70-HSVTK/PEI-MZF complex were given 0 Gy, 1 Gy, 2 Gy, 4 Gy, 8 Gy, and 16 Gy X-ray, respectively. Six hours later, mean fluorescence intensity of TK in cells after radiation is higher than that without radiation, especially the group treated by 2 Gy radiation (Figure 10). As the radiation dose increases, the expression of TK first rises then slightly reduces. Compared the highest level with the other one, the expression level of TK after 2 Gy radiation (2.78±0.12 mean fluorescence intensity) is 4.96 times of that after 1Gy (0.56±0.02). The expression level of TK in cells treated for 8Gy and 16Gy is only 0.7 times of that after 2Gy. The One-way analysis of variance shows the expression of TK has statistically significant between each group (P < 0.05).
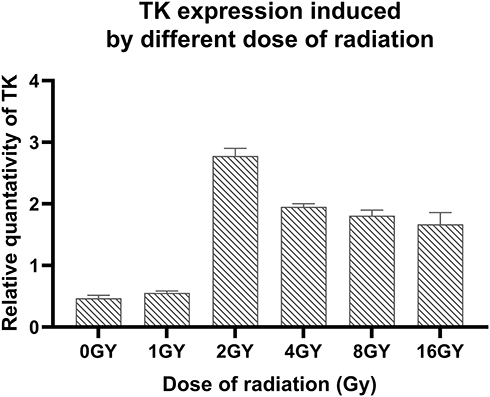 |
Figure 10 TK expression induced by different dose of radiation. Compared the TK expression with 0Gy radiation with that in other groups P < 0.05. Compared the TK expression after 2Gy radiation with that in other groups P < 0.05. |
In order to study the regulation efficiency between the single promoter and double promoter, cells transfected with Egr1-HSVTK, Hsp70-HSVTK and Egr1-Hsp70-HSVTK were treated with different methods: 2 Gy X-ray irradiation (radiation group), magnetic heat treatment under the alternating magnetic field (thermo group) and the 2 Gy radiation combination with thermo (comprehensive group) or without any treatment (control group), and then the TK gene expression was observed. Tested by the real-time PCR, TK gene expression level in the comprehensive group (1.19±0.03) is the highest, which is 2.4 times of that in the control group (0.49±0.03), 1.68 times of that in radiation group (0.71±0.04), and 1.4 times of that in the thermal group (0.84±0.04) (Figure 11). The gene level in thermal group is a little higher than that in radiation group, which is about 1.18 times. The one-way analysis of variance shows the expression level of TK has statistically significant between the experiment group and the control group (P < 0.05).
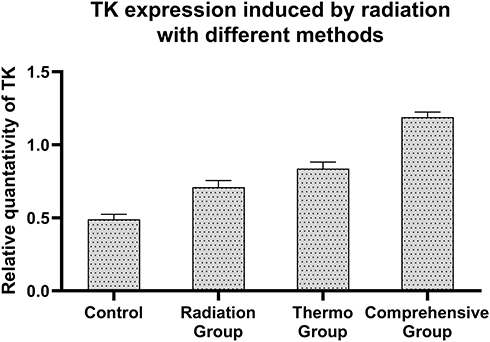 |
Figure 11 TK expression induced by different methods. Compared the TK expression without treatment, with that in other groups P < 0.05. Compared the TK expression with radiation and thermo, with that in other groups P < 0.05. |
Verification of Transfection and Expression of PEI-MZF/ Egr1/Hsp70-HSVTK in SMC7721cells
The transfected cells were harvested at time point of 12h. And HSVTK expression of the transfected cells were analyzed by RT-PCR. HSV-TK gene was used as a template to design primers, and the product size was 469bp. Figure 11 shows that TK gene fragments appear in all transfected SMMC7721 cells after RNA extraction and reverse transcription amplification. But the fragments of the TK gene were not found in the un-transfected cells and only GAPDH (the internal control fragment) was found (Figure 12). The results show that pEgr1-Hsp70-HSVTK can be successfully transfected into SMMC-7721 cells (purchased from Shanghai Institute of Biochemistry and Cell Biology, Chinese Academy of Sciences) by PEI-MZF and expressed in them through magnetic heat shock and radiotherapy. GAPDH (614bp) is the internal reference in PCR.
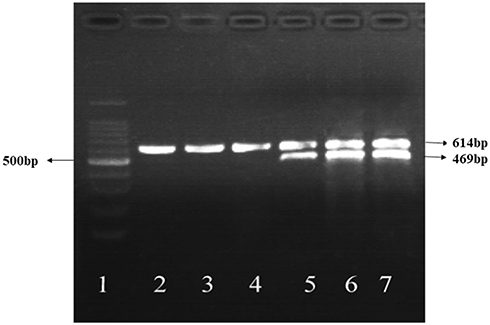 |
Figure 12 Expression of HSV-TK in SMC7721cells induced by different methods. 1 100bp Marker. 2 Negative control (not transfected). 3 Radiation group (not transfected). 4 Hyperthermia group (not transfected). 5 TK transfection by radiation induction group. 6 TK transfection by heat induction group. 7 TK transfection by radiation and heat shock induction group. |
The in vitro Anti-Hepatoma Effect of Hsp70-Egr1-HSVTK Using PEI-MZF Nanoparticles and Radiation
MTT Assay for Cell Proliferation
The in vitro antitumor effect of Mn0.5Zn0.5Fe2O4 hyperthermia, radiation therapy, Egr1-HSVTK combined with radiation therapy, Hsp70-HSVTK+PEI-Mn0.5Zn0.5Fe2O4 combined with hyperthermia, and Egr1-Hsp70-HSVTK + PEI-Mn0.5Zn0.5Fe2O4 combined with hyperthermia and radiation therapy to SMC7721 cells were determined by the MTT assay. The cell viability of each group was calculated according to the measured OD value and the formula, cell viability (%)= Experimental group A/Control group A×100%. The MTT results show that a large number of SMC7721 cells are killed by PEI/MZF/Egr1-Hsp70-HSVTK nano-complexes. As illustrated in Table 6 and Figure 13, low-dose radiation (2Gy) alone could not inhibit tumor growth well, but under the combined effect of heat, radiotherapy and gene therapy, tumor cells show significant growth inhibition. The cell proliferation rate of the triple therapy group is 17.12%, which is much lower than that of radiation alone (86.31%) and hyperthermia alone (58.33%), and also significantly lower than that of radiation combined genome (79.24%) and that of hyperthermia combined genome (44.96%). Compared with other groups, the difference is statistically significant (P < 0.05). In this study, the radiation and heat-induced dual promoter combined with heat and radiation, which can enhance the therapeutic efficacy, reduce the radiation dose, and reduce systemic side effects.
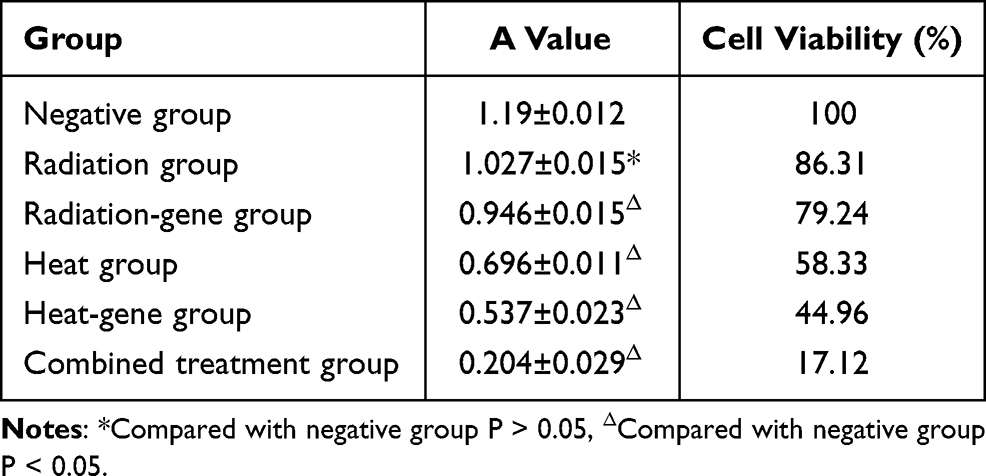 |
Table 6 The Cell Viability of SMMC-7721 cells After Treatment ( |

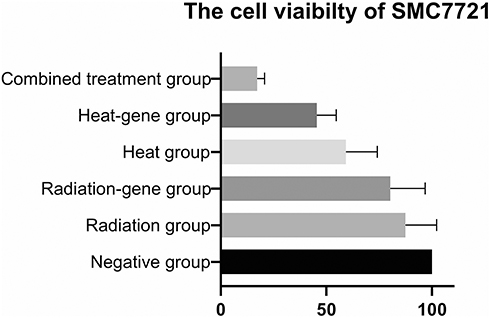 |
Figure 13 The cell viability of SMC7721 cells after treatment. |
Flow Cytometry for Detection Cell Cycles
The results of Annexin-PI double staining flow cytometry are listed in Table 7, which is the percentages of apoptotic SMC77212 cells disposed with Egr1-HSVTK, Hsp70-HSVTK and Egr1-Hsp70-HSVTK after 48 hours. It is indicated that the ratio of apoptosis cells and necrosis cells are very low in the negative control group. With different treatment ways, Annexin v-FITC staining cells increase. As well, the ratio of apoptosis cells increase, which is in a treatment-dependent manner. Annexin v staining cells in Egr1-Hsp70-HSVTK combined with radiation hyperthermia group (34.87%) rise significantly compared with hyperthermia alone group (20.22%), radiation genome group (15.16%) and hyperthermia genome group (27.94%), which is consistent with the cell inhibition rate of MTT assay. Moreover, the cell cycle of each treatment group is blocked in S or G2/M phase to varying degrees (Figure 14A and B).
 |
Table 7 Flow Cytometry of Cell Cycles and Apoptosis |
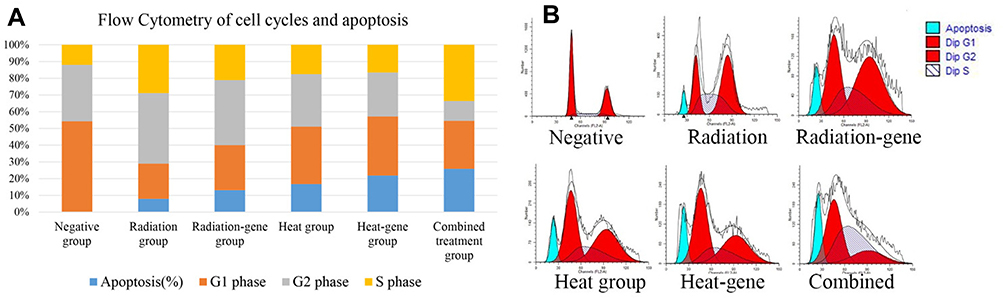 |
Figure 14 (A) Cell cycle results of SMMC7721 cells after treatment. (B) Flow cytometry results of SMMC7721 cells after treatment. |
The HSV-TK/GCV suicide gene system could transform GCV into toxic substances by gene expression products, and plays targeted killing effect on tumor cells. The low-dose radiation and hyperthermia mainly play a role by directly killing tumor cells and inducing tumor cell apoptosis. Therefore, in the mechanism research, the detection and analysis of cell cycle and apoptosis are essential. In this study, the cell cycle analysis of SMMC-7721 dealt with different treatments show that part of cells in the radiation (G2 phase 45.77% and S phase 31.34%), heat (G2 41.16% and S 37.72%), and/or combined gene therapy group (G2 15.91% and S 45.37%) are blocked in the G2 phase and the S phase, especially the S phase increased significantly, indicating that most of cells are blocked in S phase after treatment.
In vivo Anti-Tumor Therapy
Results of Mass and Volume Inhibition Rate Treated with Different Way
Since we previously demonstrated that PEI/MZF-Egr1-Hsp70-HSVTK complex suppressed the growth of HCC cells in vitro, the anti-tumor activity of the nanoparticles containing Egr1-Hsp70-HSVTK was evaluated in SMC7721-bearing mice. As seen in Figure 15, PEI/MZF-Egr1-Hsp70-HSVTK nanoparticles combined with heat and radiation (mass inhibition rate (Im) = 80.10% and volume inhibition rate (Iv) = 83.77%) significantly suppress tumor growth compared to saline and heat (Im = 52.96% and Iv = 59.40%), radiation (Im = 23% and Iv = 22.42%) group at 21st day after first treatment (Figure 15A). It is obvious that the tumor growth of the radiation group is not stunted, but the results need to be compared to the dose of clinical use, which seems to have an effect on tumor growth at much higher dose.
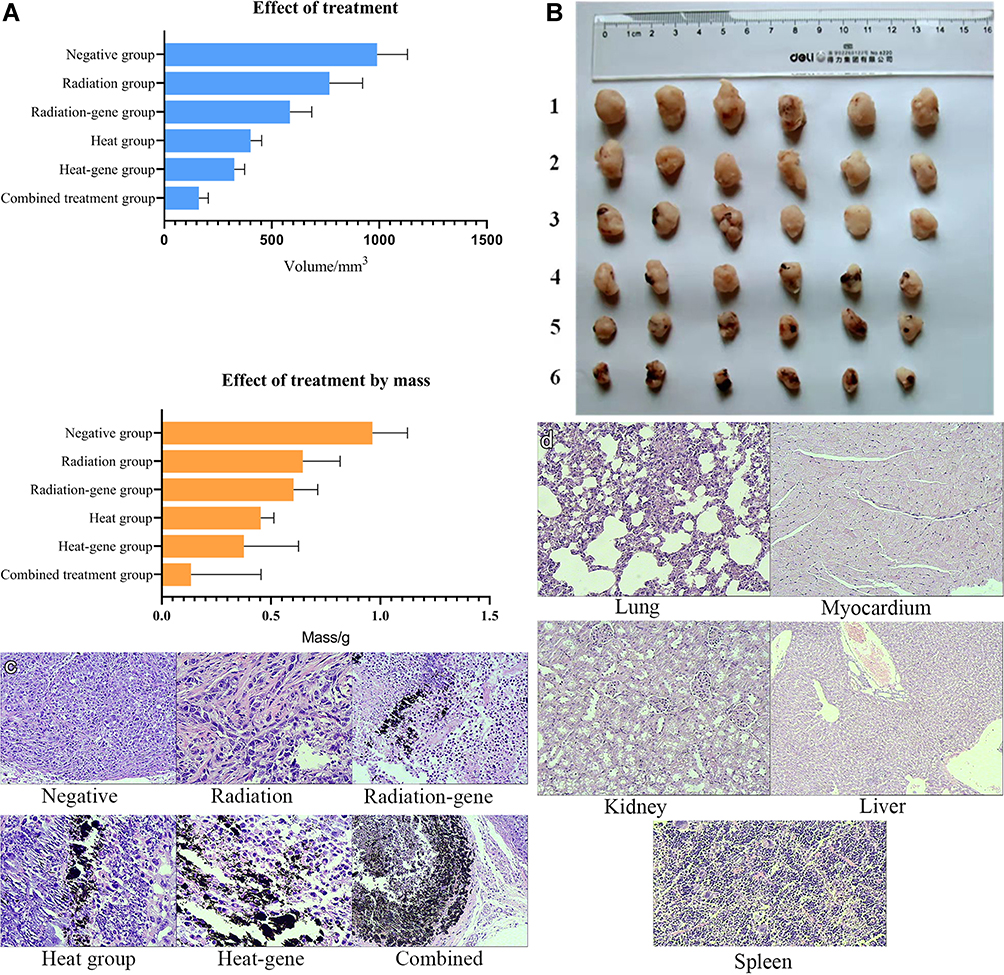 |
Figure 15 (A) Inhibitory rate of weight and mass in xenograft tumor after treatment. (B) Tumor morphological appearance after treatment. 1 Negative group. 2 Radiation group. 3 Radiation-gene group. 4 Mn0.5Zn0.5Fe2O4 hyperthermia group. 5 Heat-gene group. 6 The combined group. (C) The histo-morphology of tumors after treatment (100×). Negative group: The cells are tightly arranged, with rich cytoplasm, large and deeply stained nucleus, and active proliferation. Combined group: The cells are obviously necrotic, and magnetic material deposition can be seen between the tissue. (D) The histo-morphology of organs after treatment (100×). A lung B heart C kidney D liver E spleen. |
Morphological Changes
During the treatment, the nude mice tumor in groups 3, 5, and 6 involved in hyperthermia had bleeding, necrosis, and eschar formation on the surface. Some eschars could fall off, while such changes are rare in control group (Group 1) and the radiation group (Group 2). After treatment, the tumor tissues of each group were stripped and found that the tumors in the hyperthermia group were dark brown and gray-white in appearance (Figures 15B and C). The pathological sections confirmed that PEI-MZF magnetic nanoparticles were injected into the tissues, while the tumors in the control group were gray-white and more uniform in color. The cells in the control group are tightly arranged, the cytoplasm is rich, the nucleus is large and deeply stained, and the proliferation is active. While the cells in the combined therapy group are significant necrosis, and magnetic material deposition can be seen between the tissues (black). During the treatment time, the tumor in the control group gradually increased over time, the surface was smooth, and no hemorrhagic necrosis was seen. But the tumor in the hyperthermia group gradually decreased during the treatment, part of the tumor surface was uneven, sometimes hemorrhage and necrosis, and the changes are more obvious in Egr1-Hsp70-TK radiation and heating groups. Compared with the control group, the tumor volume and mass of each hyperthermia group are significantly different (p < 0.05), while the tumor volume and mass of the hyperthermia genome (group 5) and radiation hyperthermia genome (group 6) are significantly different (P < 0.05) (Figure 15C) compared with other treatment groups.
Histo-Pathological Changes
Pathological examination reveals that the tumor tissue is poor differentiated cancer; the cells of the negative control group have tightly arranged tumor cells, rich cytoplasm, large and deep stained nuclei, active cell proliferation, and no obvious necrosis. In the Egr1-Hsp70-TK radiation and PEI-MZF mediated hyperthermia group, the tumor tissues have obvious hemorrhage and necrosis, and the deposition of brown nano-magnetic material is seen (Figure 15C) between the cells. The tumor cells in group 6 are irregular in shape and loosely arranged, and a large number of necrotic areas can be seen. Similar findings are found in groups 3, 4, and 5. The main organs in group 6 were also taken for pathological section observation. There are no obvious pathological changes are found in the heart, liver, lung, spleen and kidney (see Figure 15D). The cells are arranged in an orderly manner, with abundant cytoplasm, proper nucleoplasm ratio, and no degeneration and necrosis. This indicated that the composite material has no significant effect on the tissues.
In conclusion, the tumor transplantation experiment also confirm that the tumor inhibition rate (Im= 80.10% and 83.54%) of the triple therapy group is much higher than that of the other treatment groups, and the tumor necrosis of the triple therapy group is more obvious than that of the other groups. The combined treatment has achieved a relatively ideal therapeutic effect and almost no effect on normal organs.
Conclusions
In this study, we developed an efficient, convenient, dual sensitive and low toxicity system of PEI-MZF/pEgr1-Hsp70-HSVTK nano-complex to active and improve HSVTK gene expression efficiency by combining radiation and thermo-radiation based on PEI-MZF. The results showed that the expression level of HSVTK gene induced by thermo and radiation was significantly higher than that of any single induction in cells. And PEI-MZF-NPs can be used as a novel non-viral gene vector and a hyperthermia strategy in the future. The self-made PEI-MZF, PEI-Mn0.5Zn0.5Fe2O4 were non-toxic in vivo and in vitro, and had good biocompatibility. In vitro and in vivo experiments, we found radiation alone or hyperthermia mediated by PEI-Mn0.5Zn0.5Fe2O4 or gene therapy or combination of hyperthermia, radiotherapy and gene therapy could inhibit the tumor growth and induce cell apoptosis, and cell cycle arrest. But the radiation and heat shock dual-promoter anti-tumor gene complex group had better tumor suppression effect, and its suppression rate was the highest. In summary, a radiation and heat-inducible gene expression system combination of radiation, hyperthermia and gene therapy described in this study provided a promising therapy approach that may have applications in the treatment of cancer by local or interventional way.
Acknowledgments
The authors sincerely thank the tutor, colleges in the lab, and the financial support from Natural Science Foundation of China (81171452) and foundation of Jiangsu Cancer Hospital (ZK201402& ZN201610).
Disclosure
The authors report no conflicts of interest in this work.
References
1. Kaufmann KB, Büning H, Galy A, et al. Gene therapy on the move. EMBO Mol Med. 2013;5(11):1642–1661. doi:10.1002/emmm.201202287
2. Zhang H, Liang C, Hou XX, et al. Study of the combined treatment of lung cancer using gene-loaded immunomagnetic albumin nanospheres in vitro and in vivo. Int J Nanomedicine. 2016;1:1039–1050. doi:10.2147/IJN.S98519
3. Stackhouse MA, Buchsbaum DJ. Radiation to control gene expression. Gene Ther. 2000;7(13):1085–1086.e. doi:10.1038/sj.gt.3301233
4. Ding M, Li R, He R, et al. p53 activated by AND gate genetic circuit under radiation and hypoxia for targeted cancer gene therapy. Cancer Sci. 2015;106(9):1163–1173. doi:10.1111/cas.12739
5. Wang Y, Mo L, Wei W, Shi X. Efficacy and safety of dendrimer nanoparticles with coexpression of tumor necrosis factor-α and herpes simplex virus thymidine kinase in gene radiotherapy of the human uveal melanoma OCM-1 cell line. Int J Nanomedicine. 2013;8:3805–3816. doi:10.2147/IJN.S48950
6. Talaat RM, Abo-Zeid TM, Abo-Elfadl MT, et al. Combined hyperthermia and radiation therapy for treatment of hepatocellular carcinoma. Asian Pac J Cancer Prev. 2019;20(8):2303–2310. doi:10.31557/APJCP.2019.20.8.2303
7. Hildebrandt B, Wust P, Ahlers O, et al. The cellular and molecular basis of hyperthermia. Crit Rev Oncol Hematol. 2002;43:33–56. doi:10.1016/S1040-8428(01)00179-2
8. Madio DP, Van Gelderen P, Despres D, et al. On the feasibility of MRI-guided focused ultrasound for local induction of gene expression. J Magn Reson Imaging. 1998;8:101–104. doi:10.1002/jmri.1880080120
9. Wang Y, Shengliang L, Zhang P, et al. Photothermal-responsive conjugated polymer nanoparticles for remote control of gene expression in living cells. Adv Mater. 2018;30(8). doi:10.1002/adma.201705418
10. Tang QS, Zhang DS, Cong XM, et al. Using thermal energy produced by irradiation of Mn-Zn ferrite magnetic nanoparticles (MZF-NPs) for heat-inducible gene expression. J Biomater. 2008;29:2673–2679. doi:10.1016/j.biomaterials.2008.01.038
11. Isomoto H, Ohtsuru A, Braiden V, et al. Heat-directed suicide gene therapy mediated by heat shock protein promoter for gastric cancer. Oncol Rep. 2006;15:629–635.
12. Zhang J, Zhang DS, Wang L, et al. A magnetic nano-vector of gene and drug for heat-inducible gene expression.
13. Zhang J, Zhang DS. The biocompatibility of the temperature sensitive pHsp-HSV-TK/As2O3 magnetic complex and its anti-tumor effect on HepG2 cells.
14. Öztürk S, Ergün BG, Çalık P. Double promoter expression systems for recombinant protein production by industrial microorganisms. Appl Microbiol Biotechnol. 2017;101(20):7459–7475. doi:10.1007/s00253-017-8487-y
15. Rao Y, Cai D, Wang H, et al. Construction and application of a dual promoter system for efficient protein production and metabolic pathway enhancement in Bacillus licheniformis. J Biotechnol. 2020;312:1–10. doi:10.1016/j.jbiotec.2020.02.015
16. Mirzaie V, Eslaminejad T, Babaei H, et al. Enhancing the butyrylcholinesterase activity in HEK-293 cell line by dual-promoter vector decorated on lipofectamine. Drug Des Devel Ther. 2020;14:3589–3599. doi:10.2147/DDDT.S260419
17. Gutiérrez CL, Muñoz C, San Martín M, et al. Chloroplast dual divergent promoter plasmid for heterologous protein expression in tetraselmis suecica (chlorophyceae, chlorodendrales). J Phycol. 2020;56(4):1066–1076. doi:10.1111/jpy.13013
18. Zhang K, Su L, Duan X, Liu L, Wu J. High-level extracellular protein production in Bacillus subtilis using an optimized dual-promoter expression system. Microb Cell Fact. 2017;16(1):32. doi:10.1186/s12934-017-0649-1
19. Liu G, Zhang Y, Xing M. Dual promoters enhance heterologous enzyme production from bacterial phage based recombinant Bacillus subtilis. Chin J Biotechonol. 2006;22(2):191–197. doi:10.1016/S1872-2075(06)60023-X
20. Finn, J., Lee, A., MacLacchlan,I., et al. An enhanced autogene-based dual promoter cytoplasmic expression system yeilds increased gene expression.Gene Ther, 2004;11:276-283. doi:10.1038/sj.gt.3302172
21. Fan W, Yung B, Huang P, et al. Nanotechnology for multimodal synergistic cancer therapy. Chem Rev. 2017;117:13566–13638. doi:10.1021/acs.chemrev.7b00258
22. Lin M, Zhang DS, Huang JX, et al. An evaluation on transfection efficiency of pHRE-Egr1-EGFP in hepatocellular carcinoma cells Bel-7402 mediated by PEI-MZF-NPs. J Nanomater. 2011:1–10. doi:10.1155/2011/910539
23. Tyrrell ZL, Shen Y, Radosz M. Fabrication of micellar nanoparticles for drug delivery through the self-assembly of block copolymers. Prog Polym Sci. 2010;35:1128–1143. doi:10.1016/j.progpolymsci.2010.06.003
24. Kamaly N, Yameen B, Wu J, Farokhzad OC. Degradable controlled-release polymers and polymeric nanoparticles: mechanisms of controlling drug release. Chem Rev. 2016;116(4):2602–2663. doi:10.1021/acs.chemrev.5b00346
25. Aigner A, Malek A, Czubayko F. PEG grafting of polyethylenimine (PEI) exerts different effects on DNA transfection and siRNA-induced gene targeting efficacy. J Drug Target. 2008;16(2):124–139.
26. Boussif O, Lezoualc’h F, Zanta MA, et al. A versatile vector for gene and oligonucleotide transfer into cells in culture and in vivo: poly-ethylenimine. PNAS. 1995;92(16):7297–7301. doi:10.1073/pnas.92.16.7297
27. Behr J-P. The proton sponge: a trick to enter cells the viruses did not exploit. CHIMIA Int J Chem. 1997;51(1–2):34–36.
 © 2022 The Author(s). This work is published and licensed by Dove Medical Press Limited. The full terms of this license are available at https://www.dovepress.com/terms.php and incorporate the Creative Commons Attribution - Non Commercial (unported, v3.0) License.
By accessing the work you hereby accept the Terms. Non-commercial uses of the work are permitted without any further permission from Dove Medical Press Limited, provided the work is properly attributed. For permission for commercial use of this work, please see paragraphs 4.2 and 5 of our Terms.
© 2022 The Author(s). This work is published and licensed by Dove Medical Press Limited. The full terms of this license are available at https://www.dovepress.com/terms.php and incorporate the Creative Commons Attribution - Non Commercial (unported, v3.0) License.
By accessing the work you hereby accept the Terms. Non-commercial uses of the work are permitted without any further permission from Dove Medical Press Limited, provided the work is properly attributed. For permission for commercial use of this work, please see paragraphs 4.2 and 5 of our Terms.