")
Back to Journals » International Journal of Nanomedicine » Volume 16
Efficient Determination of PML/RARα Fusion Gene by the Electrochemical DNA Biosensor Based on Carbon Dots/Graphene Oxide Nanocomposites
Authors Zhang ZY, Huang LX, Xu ZW, Wang P, Lei Y, Liu AL
Received 25 February 2021
Accepted for publication 28 April 2021
Published 20 May 2021 Volume 2021:16 Pages 3497—3508
DOI https://doi.org/10.2147/IJN.S308258
Checked for plagiarism Yes
Review by Single anonymous peer review
Peer reviewer comments 3
Editor who approved publication: Dr Yan Shen
Zi-Yang Zhang,1 Lin-Xiao Huang,1 Zhi-Wei Xu,1 Peng Wang,1 Yun Lei,1,2 Ai-Lin Liu1,2
1Department of Pharmaceutical Analysis, The School of Pharmacy, Fujian Medical University, Fuzhou, 350122, People’s Republic of China; 2Higher Educational Key Laboratory for Nano Biomedical Technology of Fujian Province, The School of Pharmacy, Fujian Medical University, Fuzhou, 350122, People’s Republic of China
Correspondence: Yun Lei; Ai-Lin Liu
Department of Pharmaceutical Analysis, The School of Pharmacy, Fujian Medical University, Fuzhou, 350122, People’s Republic of China
Tel +86 591 22862016
Email [email protected]; [email protected]
Purpose: The PML/RARα fusion gene as a leukemogenesis plays a significant role in clinical diagnosis of the early stage of acute promyelocytic leukemia (APL). Here, we present an electrochemical biosensor for PML/RARα fusion gene detection using carbon dots functionalized graphene oxide (CDs/GO) nanocomposites modified glassy carbon electrode (CDs/GO/GCE).
Materials and Methods: In this work, the CDs/GO nanocomposites are produced through π-π stacking interaction and could be prepared in large quantities by a facile and economical way. The CDs/GO nanocomposites were decorated onto electrode surface to improve the electrochemical activity and as a bio-platform attracted the target deoxyribonucleic acid (DNA) probe simultaneously.
Results: The CDs/GO/GCE was fabricated successfully and exhibits high electrochemical activity, good biocompatibility, and strong bioaffinity toward the target DNA sequences, compared with only the pristine CDs on GCE or GO on GCE. The DNA biosensor displays excellent sensing performance for detecting the relevant pathogenic DNA of APL with a detection limit of 83 pM (S/N = 3).
Conclusion: According to the several experimental results, we believe that the simple and economical DNA biosensor has the potential to be an effective and powerful tool for detection of pathogenic genes in the clinical diagnosis.
Keywords: acute promyelocytic leukemia, pathogenic genes, electrochemical biosensor, ex-situ method, carbon nanomaterials
Introduction
Acute promyelocytic leukemia (APL), M3 subtype of acute myelocytic leukemia (AML), is a genetic disease characterized by a balanced reciprocal translocation between chromosomes 15 and 17.1 Over 95% of all AMLs are characterized by chromosome reciprocal translocation, t (15; 17) (q22; q12). It involves the promyelocytic leukemia (PML) and retinoic acid receptor alpha (RARα), resulting in the expression of PML/RARα fusion gene. The translocation event, which fuses the PML gene with RARα gene, gives rise to the PML/RARα fusion gene that is the major trigger of APL.2 Besides, the single gene rearrangement plays an important role in leukemogenesis through antagonizing retinoic acid signaling and the regulatory pathways mediated by APL. Therefore, effective identification of PML/RARA fusion gene has been believed to be a key point on early diagnosis and prognostic monitoring of APL.3 Up to now the clinical diagnostic methods mainly include flow cytometry (FCM), real-time quantitative reverse transcription PCR (RT-PCR) and fluorescence in situ hybridization (FISH).4–6 Nevertheless, unfavorable outcomes in clinical diagnosis of APL would happen due to the limited sensitivity, time-consuming pretreatment and complicated operational process. Accordingly, it is urgent to develop a novel analytical method which is simple, rapid and cost-effective enough for the clinical detection of PML/RARα fusion gene.
In recent years, the electrochemical deoxyribonucleic acid (DNA) biosensor as a novel and powerful tool for nucleic acids sensing has attracted more and more attention,7 owing to several considerable advantages, such as high efficiency, low cost, excellent selectivity and high sensitivity.8–10 In the past decades, to achieve better selectivity and higher sensitivity, a large number of nanomaterials have been explored and have been widely applied in terms of designing the high-performance electrochemical biosensor,11–18 due to their excellent chemical, physical and biological properties.19
Among the candidate nanomaterials being utilized to modify electrode, graphene oxide (GO), one of the most important derivatives of graphene, exhibits fascinating properties including large surface area, ease of synthesis and good biocompatibility,20 and contains various oxygen functional groups providing binding sites for the covalent immobilization of DNA.21–23 To improve the high sheet resistance and poor electronic conductivity and enhance the electrochemical activity, various kinds of nanoparticles were used to functionalize GO, including metal oxides nanoparticles,24 metal nanoparticles25 and quantum dots (QDs).26 Numerous researches based on different GO-based nanocomposites used for the development of DNA biosensors have been reported in recent years,27–29 which can impart special and advantageous properties to electrochemical biosensors. It follows that the exploration of appropriate GO-based hybrid nanomaterials is beneficial to the development of ideal electrochemical sensing platforms with excellent performance for bioapplication. Among various nanoparticles used for the GO-based nanomaterials, carbon dots (CDs) are known as low toxic, stable, abundant, easy-to-prepare and cheap.29–31 Besides, CDs have displayed the excellent electrical conductivity and charge transport mobility,32–34 demonstrating the great potential as the modifiers of GO-supported hybrid materials for electrode modification. Therefore, there are several research groups that have prepared GO or reduced graphene oxide (rGO)-CDs composites with improving catalytic performance for electrochemical detection of small biological molecules, toxic heavy metal ions and endocrine interferent in recent years.35–37 For example, Chen et al utilized Pt nanoparticles-carbon dots/ionic liquid functionalized graphene oxide (PtNPs-CDs/IL-GO) nanocomposites to detect H2O2, in which sheets of CDs/IL-GO were decorated with PtNPs via the in-situ reduction of H2PtCl6 using chemical agent.38 Canevari et al reported an electrochemical biosensor based on reduced graphene oxide (rGO)-carbon nanoparticles hybrid for the detection of bisphenol A wherein carbon nanoparticles acted as a reducing agent of GO to obtain rGO.39 The integration of GO/rGO with electroactive nanoparticles facilitates electrochemical sensor with high sensitivity. However, the nanocomposites in these cases prepared by in-situ reduction methods could suffer from the uncontrollable size and morphology resulting in a wide size distribution. For the large-scale production of CDs/GO nanocomposites with a narrow size distribution and easily adjustable size and shape, Li and co-workers reported an N-doped carbon dots-graphene oxide hybrid for simultaneous stripping determination of cadmium and lead ions, wherein composites were produced by the ex-situ assembly of CDs onto the GO surface.40 It is obvious that CDs/GO nanocomposites made by ex-situ methods are superior in terms of cost, synthesis ease and stability, suggesting that the development of electrochemical sensor based on CDs/GO nanocomposites via this inexpensive and simple approach offers practical advantages both in cost and popularization. Simultaneously, other than having the impressive electrochemical performances, the three-dimensional spherical nanostructure of CDs with the high surface area to volume ratios could allow immobilization of the larger number of the DNA probe41 and the abundant carboxyl groups could support the better stability of immobilization of DNA probe compared with other nanoparticles,42 which are crucial for good stability and high performance of DNA biosensor. Recently, the electrochemical DNA biosensor using CDs/GO nanocomposite are seldom reported. Besides, the affordable and economical CDs/GO-based DNA biosensor should not use the expensive instrument, which could be adapted to the clinical detection in the underdeveloped, rural and remote area.
For the mass-production of the modification materials of electrode, we present an all carbon-based CDs/GO nanocomposites by a facile synthetic method for optimizing and enhancing the performance of the electrochemical DNA biosensor for PML/RARα fusion gene detection. The stepwise fabrication procedure of the electrochemical DNA biosensor is shown in Figure 1. The roomy surface of GO as a platform for the immobilization of target DNA and the strong conductivity of CDs enhance the sensitivity of DNA biosensor. In addition, methylene blue (MB) as an electrochemical indicator43 was employed to design electrochemical DNA biosensor.44 CDs/GO nanocomposites accelerate electron transfers between MB and the electrode, and expand the surface of the working electrode to load greater mass of the capture probe DNA. Different pulse voltammetry (DPV) was employed to study the interaction of MB with DNA. The alteration of current signals originating from the interaction of MB with single-strand DNA (ssDNA) and double-strand DNA (dsDNA) could be utilized to monitor the hybridization event. Besides, the specificity of the designed biosensor was carried out for distinguishing mismatch sequences from complementary sequences. Under optimal conditions, this DNA biosensor with CDs/GO nanocomposites provide a good linear range and the low limit of detection for PML/RARα fusion gene sequence.
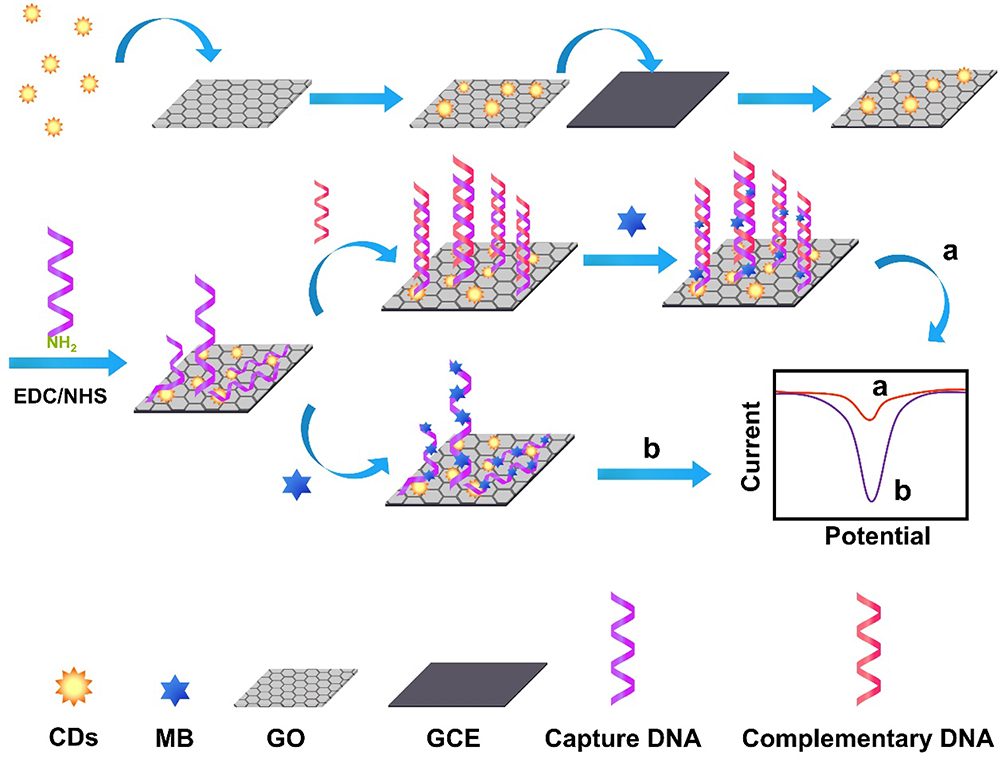 |
Figure 1 Schematic representation and measurement principle of the CDs/GO electrochemical biosensors.Abbreviations: CDs, carbon dots; MB, methylene blue; GO, graphene oxide; GCE, glassy carbon electrode. |
Materials and Methods
Materials and Reagents
Tris (hydroxymethyl) methyl aminomethane (Tris), ethylenediaminetetraacetic acid disodium salt (EDTA-2Na), dehydrated alcohol, potassium chloride (KCl), potassium ferricyanide (K3Fe(CN)6), potassium hexacyanoferrate (K4Fe(CN)6), potassium dihydrogen phosphate (KH2PO4), concentrated nitric acid (HNO3), sodium hydroxide (NaOH), sodium chloride (NaCl), sodium dihydrogen phosphate dihydrate (NaH2PO4·2H2O), di-sodium hydrogen phosphate dodecahydrate (Na2HPO4·12H2O) and phosphoric acid (H3PO4) were purchased from Sinopharm Chemical Reagent Co. Ltd. (Shanghai, China).
1-(3-Dimethylaminopropyl)-3-ethylcarbodiimide hydrochloride (EDC), N-hydroxysulfo succinimide (NHS) and methylene blue (MB) were obtained from Sigma-Aldrich (Shanghai, China). Graphene oxide was purchased from Nanjing XFNANO Technology Co., Ltd (Nanjing, China). Carbon fibers were obtained from Shanghai Tansu Manufactory. All reagents were of analytical reagent grade and without further purification.
The synthetic oligonucleotides were purchased from Takara (Dalian, China), their base sequences were:
• Capture probe DNA (22-base sequence):
5ʹ-NH2-GGTCTCAATGGCTGCCTCCCCG-3ʹ
• Complementary target DNA (22-base sequence):
5ʹ-CGGGGAGGCAGCCATTGAGACC-3ʹ
• Single-base mismatch target DNA (22-base sequence):
5ʹ-CGGGGAGGCACCCATTGAGACC-3ʹ
• Partially-base mismatched target DNA (22-base sequence):
5ʹ-CGGGGAGGCAGAGGAACGCGTT-3ʹ
All oligonucleotides stock solutions (100 μM) were prepared with Tris-EDTA (TE) buffer solution (10 mM Tris-HCl, 1.0 mM EDTA, pH 8.0) and keep at −20 ◦C. More dilute solutions of DNA were prepared with this stock solution. Besides, the phosphate buffered solutions (PBS, pH 7.4) were prepared by Na2HPO4-NaH2PO4 solution and NaCl solution and adjusted to pH 7.4 using NaOH and H3PO4. The solutions were used high quality deionized water in all of the experiments.
Apparatus
Electrochemical studies were conducted using the CHI660D electrochemical workstation (Chenhua Instruments, China) and the Autolab PGSTAT302F electrochemical analyzer (Metrohm, Netherlands). A conventional three–electrode system was employed, covering a modified working electrode, an Ag/AgCl/KCl (saturated) reference electrode, and a platinum wire counter electrode. The CDs solution was purified by the 1000 Dalton (1 kDa) dialysis bag (Spectrum, America) and was the ultrafiltered through the Millipore centrifugal filter devices with 3000 Dalton (3 kDa) molecular weight cutoff membranes (Millipore, America). Fluorescence spectra were obtained on the Cary Eclipse Fluorescence spectrophotometer (Agilent, America). UV-visible absorption (UV/Vis) spectra of CDs solution were recorded by a UV-2450 spectrometer (Shimadzu, Japan). Transmission electron microscopy (TEM) images were carried out using a Tecnai G2 F20 electron microscope (FEI, America) at an accelerating voltage of 200 kV. Scanning electron microscopy (SEM) images were taken by S4800 (HITACHI, Japan).
Synthesis of Carbon Dots and CDs/GO Nanocomposites
CDs was prepared by previously reported method.45 The detailed synthesis process of CDs is exhibited in the section of “Synthesis of carbon dots- Supplementary Information.”
CDs/GO nanocomposites were fabricated by sonication assembly method with GO nanosheets and CDs nanoparticles as precursors. The reaction procedure was as follows: The synthesized CDs powder was dissolved in deionized water at a concentration of 1 mg/mL. Then, an appropriate amount of GO nanosheet was mixed to the above CDs solution in an ultrasonic bath for 30 min. The different weight ratios (WCDs: WGO) of 1:3, 1:5, 1:10, 1:30 and 1:50 of the CDs/GO nanocomposites were prepared by the above-mentioned method.
Preparation of the DNA Biosensor with GO/CDs Nanocomposites
Firstly, the bare GCE was polished carefully with 0.3 μm and 0.05 μm Al2O3 powders followed by rinsing thoroughly with water. Then the electrode was washed in an ultrasonic bath sequentially with HNO3 solution (v/v=1:1), ethanol and doubly distilled water each for 3 min subsequently, and dried under nitrogen. Thereafter, the clean GCE was dropped with 8 μL CDs/GO nanocomposites solution and allowed to dry in an oven at 60°C for 30 min. After washing with water, the CDs/GO/GCE was immersed into 100 μL of phosphate buffer solution (10 mM, pH 7.4) containing 20 mM EDC and NHS for 30 min. Afterwards, 8 μL of 1 μM capture probe DNA solution was pipetted onto the surface of CDs/GO/GCE and incubated for 2 h at room temperature to construct the capture probe DNA/CDs/GO/GCE electrode. Then, the capture probe DNA modified electrode was immersed in a solution of 10 mM PBS (pH 7.4) containing 1 mM MB for 5 min. The MB accumulated electrode was thoroughly rinsed with TE buffer solution and dried for further measurement. Replicate measurements were performed by renewing the surface and repeating the above assay preparation procedure.
Experimental Measurement
In the electrochemical experiment, cyclic voltammetry (CV) and differential pulse voltammetry (DPV) were carried out on a CHI660D electrochemical workstation. Electrochemical impedance spectroscopy (EIS) measurements were performed with Autolab PGSTAT302F electrochemical analyzer, and the value of open-circuit voltage (OCV) for EIS measurements is 0.23 ± 0.01 V. The electrochemical system consisted of the Ag/AgCl (saturated KCl) as the reference electrode, a platinum wire as an auxiliary electrode, and bare or modified GCE (3 mm in diameter) as the working electrode, respectively. Hybridization was performed by immersing capture probe DNA/CDs/GO/GCE into a certain concentration of the different target DNA solution at 35°C for 45 min and washed with TE buffer solution, then, dried in nitrogen to obtain the different hybridized double-strand DNA/CDs/GO/GCE. The DPV was recorded from 0.4 to −0.6 V with amplitude of 0.05 V, pulse width of 0.05 s, and pulse period of 0.2 s. Replicate measurements were recorded by renewing the surface and repeating the above assay preparation procedure.
Results and Discussion
Characterization of CDs and CDs/GO Nanocomposites
The morphology of CDs was characterized by transmission electron microscopy (TEM). As shown in Figure 2A, TEM image shows that the CDs are monodispersed and spherical. The size distribution histogram reveals that the particle sizes of CDs mostly range from 1.12 to 3.54 nm and the average diameters is 2.26 ± 0.48 nm (Figure 2B). High-resolution TEM (HRTEM) images (Figure 2C) reveal the high crystallinity of the CDs in which the lattice spacing of 0.203 nm (the inset in Figure 2C) corresponds (102) crystal plane of graphitic (sp2) carbon. The CDs solution shows a broad UV-vis absorption with shoulder-type peak at 230 nm (Figure 2D), which is the π-π* transition absorption of conjugated structure of CDs. Besides, the peak of the fluorescence excitation spectrum at 340 nm was symmetrical to the emission peak at 455 nm and the stokes shift was 90 nm. Moreover, the inset in Figure 2D shows the aqueous solution of the CDs illuminated under the UV light (left, 365 nm) and the white (right, daylight lamp). It is obvious that the aqueous solution of the CDs under the irradiation of the UV light at 365 nm has a light-yellow fluorescence bright enough to be easily seen with the naked eye.
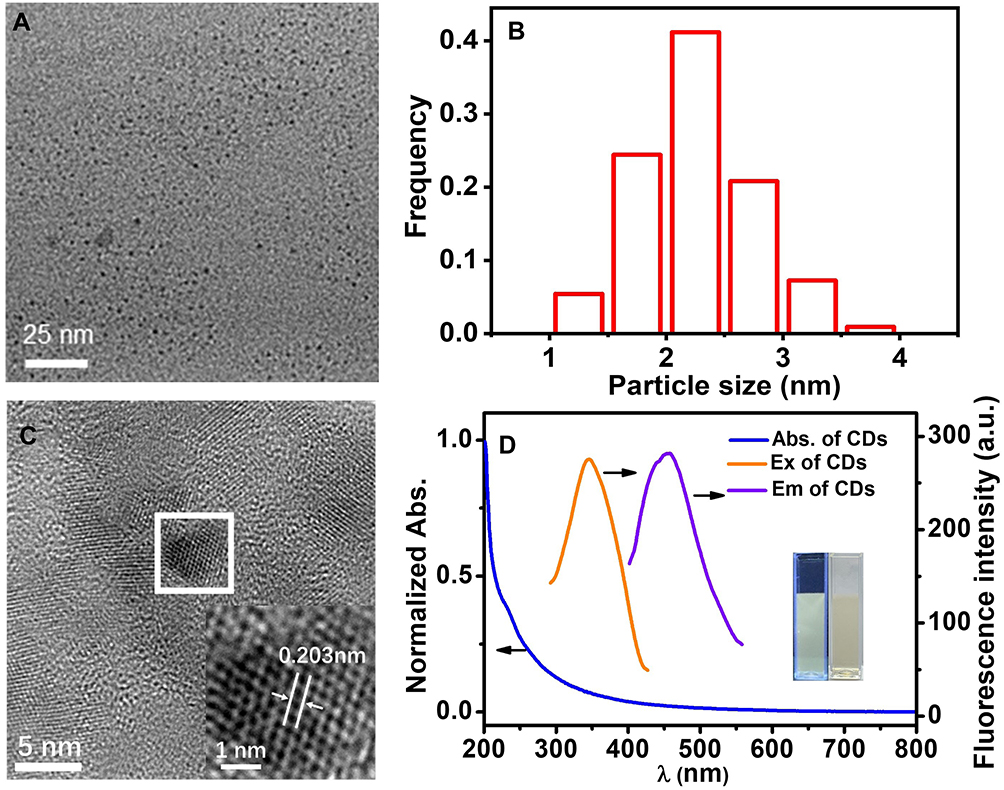 |
Figure 2 TEM (A) and HRTEM (C) images of the CDs; (B) Size distribution of the CDs; (D) Fluorescence spectra and UV/Vis absorption spectra of the CDs, inset in Figure 2C: HRTEM image of the single CDs, inset in Figure 2D: the photographs of the aqueous solution of the CDs (left) under UV light (365nm) and the CDs (right) under daylight lamp. |
CDs/GO nanocomposites were prepared by the ultrasonic blending method as described in the experimental section. To study the surface morphologies and the apparent characteristics of the different synthesized carbon nanomaterials, SEM and TEM were applied in detail. The SEM images (Figure 3A) reveal that GO obviously wrinkles that provides a large surface area, which facilitates loading the CDs material. Besides, Figure 3B presents the representative SEM image of CDs/GO nanocomposites. Upon mixed with CDs, the GO sheet becomes a uniformly close film, featuring as the obvious reduction of wrinkles. To further investigate the morphologies of GO and CDs/GO nanocomposites, both nanomaterials were imaged by TEM. As shown in Figure 3C, individual GO exhibits irregular two-dimension sheet-like structure with some crimple and fold effect. Compared with GO, the surface of CDs/GO is significantly rougher and a mass of spherical CDs are found to evenly distribute throughout the surface of GO through π-π stacking and electrostatic interactions (Figure 3D), owing to high surface area of GO and good dispersion provided by ultrasonic treatment.
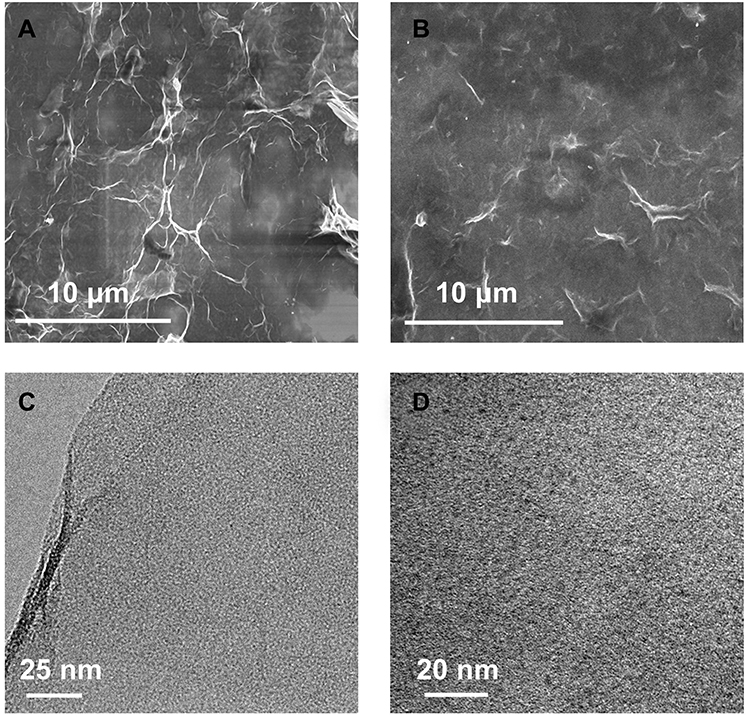 |
Figure 3 SEM images of the GO (A) and CDs/GO nanocomposites (B); TEM images of the GO (C) and CDs/GO nanocomposites (D). |
Electrochemical Behavior of Modified GCEs Based on CDs/GO Nanocomposites with Different Ratios
Since the incorporation of nanomaterials will affect the physical and chemical properties of the GO-based composites, the optimization of the precursor’s ratio is very crucial. In order to improve the electrochemical properties of CDs/GO nanocomposites modified electrode, the different weight proportion of CDs/GO nanocomposites should be examined. A typical CV plot of different electrodes modified with different weight proportions of CDs/GO were measured in 10 mM PBS buffer (pH=7.4) containing 10 mM [Fe(CN)6]4−/3− and 0.1 M KCl and shown in Figure 4A. The peak current responses of [Fe(CN)6]4−/3− on CDs/GO/GCE are considered as indicators to optimize the weight ratio of CDs to GO. It can be seen that the introduction of different weight contents of CDs has a significant effect on the current response for CDs/GO/GCE. All CV curves are characterized by a pair of redox peaks. And 0.32 μA of anodic peak current is observed for GO/GCE (curve a). The peak currents increase with the enhancement of the amounts of CDs. The estimated peak current responses corresponding to CDs/GO (1:50) and CDs/GO (1:30) are improved to 48.56% and 157.31% compared with GO (inset of Figure 4A). When the weight ratio of CDs is increased to 10% (CDs/GO (1:10)), CDs/GO/GCE presents a nearly 10-fold increase in the peak current compared to GO/GCE. Further increase of CDs weight ratio in CDs/GO hybrid leads to a slight increase in peak current for [Fe(CN)6]4−/3−, which are attributed to the excellent electrochemical conductivity of CDs.
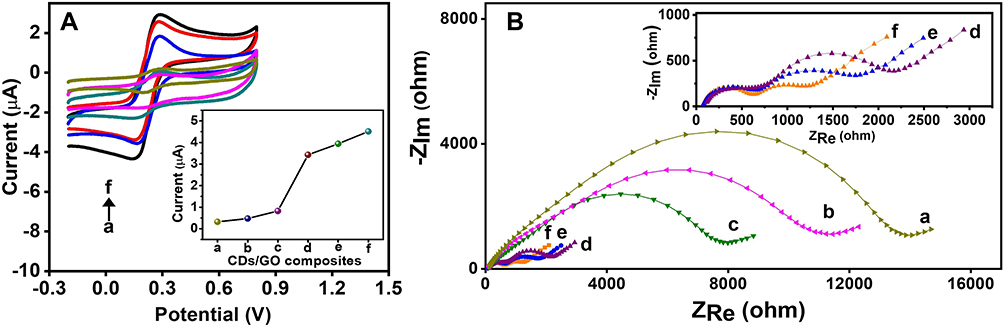 |
Figure 4 CV (A) and EIS (B) of CDs/GO nanocomposites modified GCE with different weight ratio of CDs to GO, including GO (a), 1:50 (b), 1:30 (c), 1:10 (d), 1:5 (e), 1:3 (f). Inset of Figure 4A: anodic peak current with different weight ratio of CDs/GO nanocomposites modified GCE. Inset of Figure 4B: the enlarged EIS of curve d, e and f. The above-mentioned electrochemical characteristics of the modified electrodes measured in PBS (10 mM, pH 7.4) containing 10 mM [Fe(CN)6]3,/4 − and 0.1 M KCl. |
Figure 4B shows electrochemical impedance spectroscopy (EIS) for various electrodes coated with all nanocomposites, in which all of the curves are similar and consist of a semicircular part in high-frequency region and a linear part in low-frequency region. The diameter of semicircle, representing electron-transfer resistance (Ret), gives details about the electron transfer kinetics of [Fe(CN)6]4−/3− at electrode/electrolyte interface. It can be seen that GO/GCE (curve a) exhibits the largest Ret (13,860 Ω), which is due to high resistance and poor conductivity of GO. Initially, the Ret value is slightly decreased as the proportion of CDs increases from (1:50) to (1:30), and sharply drops to 416 Ω for CDs/GO nanocomposites (1:10), then tends to a plateau with further increase in the CDs/GO compositional proportion. The results are consistent with the terminology of electrochemistry shown in Figure 4A. Based on the above results, it can be concluded that the incorporation of CDs to GO matrix enhances the electroconductivity of CDs/GO modified GCE. Meanwhile, relatively low weight ratio of GO in CDs/GO nanocomposites would lower the available surface area and the number of anchoring sites which is disadvantage for the immobilization of DNA molecules. To consider a compromise for two factors, the nanocomposites of CDs/GO (1:10) is chosen as the modification material of the electrode for sequence experiments.
Electrochemical Behavior of Different Carbon Nanomaterials Modified Electrodes by Using MB as Indicator
Methylene blue (MB), as a common electrochemical indicator with a positively charged aromatic structure, has strong affinity to the free guanine bases on DNA molecules. Besides, the duplex protected the guanine moiety from being attacked by MB, leading to the different binding amount of MB between MB and single-strand DNA (ssDNA) or double-strand DNA (dsDNA) at the electrode. Therefore, MB often uses as the discriminative reagent toward ssDNA and dsDNA.46 Figure 5 illustrates that the DPV responses of the ssDNA/GO/GCE, ssDNA/CDs/GCE and ssDNA/CDs/GO/GCE accumulated with 1 mM MB in 10 mM PBS (pH 7.4) after hybridization with complementary target DNA. Upon the incubation with complementary oligonucleotide sequence, the value of peak current responses of the dsDNA/GO/GCE (curve b), dsDNA/CDs/GCE (curve d) and dsDNA/CDs/GO/GCE (curve f) decreases, respectively, compared with the current signal of the ssDNA/GO/GCE (curve a), ssDNA/CDs/GCE (curve c) and ssDNA/CDs/GO/GCE (curve e), which is due to the inaccessibility of free guanine bases, indicating the hybridization event has occurred. The difference of peak current of the CDs/GO/GCE, GO/GCE and CDs/GCE modified with ssDNA and dsDNA were, respectively, 3.61 μA, 0.25 μA and 0.18 μA. The structure of CDs/GO nanocomposites can provide good conductivity of CDs and large planar surface of GO, which would promote electron transfer within the network and enhance hybridization efficiency of DNA. Owing to the aforementioned factors, the current difference (3.61 μA) of MB on CDs/GO/GCE is observably increased by 11-fold and 20-fold compared to that on CDs/GCE and GO/GCE, respectively. This dramatic difference of the peak currents between ssDNA/CDs/GO/GCE (curve e) and dsDNA/CDs/GO/GCE (curve f) by using MB as an electrochemical hybridization indicator suggest that the excellent synergetic effect of CDs/GO nanocomposites. These results indicate that the CDs/GO nanocomposites not only promote the hybridization of DNA on the electrode surface and enhance the difference of current signals, but also improve the performance of biosensors.
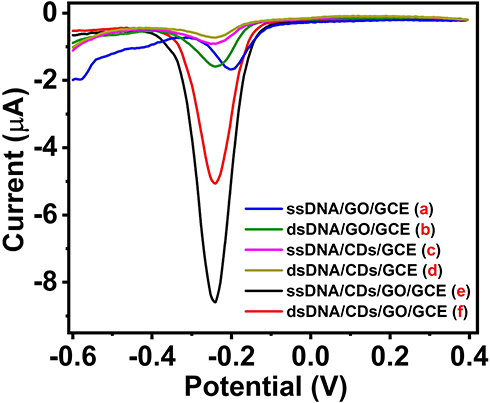 |
Figure 5 DPV curve of the different materials modified electrodes in a solution of 10 mM PBS (pH 7.4) containing 1 mM MB: ssDNA/GO/GCE (a), dsDNA/GO/GCE (b), ssDNA/CDs/GCE (c), dsDNA/CDs/GCE (d), ssDNA/CDs/GO/GCE (e) and dsDNA/CDs/GO/GCE (f). |
Electrochemical Studies of CDs/GO Modified GCE Biosensor Preparing Process
In order to characterize the preparing process of the electrochemical biosensor, different stages of CDs/GO (1:10) modified GCE biosensor were tested by ESI in a solution of 0.1 M KCl containing 10 mM [Fe(CN)6]3-/4-. In this study, [Fe(CN)6]3-/4- was used as the redox probe, and the semicircle diameter could represent electron transfer resistance (Ret). Figure S1 shows the Nyquist plots of impedance spectra at different stages of electrochemical biosensor. The ESI curve of the bare GCE (curve a) exhibits a straight line with subtle bending at higher frequency region. It is well known that GO sheet possesses many oxygen functional groups on its basal planes and edges, including hydroxyl (-OH), epoxy (-O-), carbonyl (-C=O), and carboxyl groups (-COOH). Among those oxygen functional groups, the -COO− on the surface of the nanocomposite material would develop an electrostatic repulsive force to [Fe(CN)6]3-/4- anion. In the case of CDs/GO/GCE, the value of Ret increases to 2057 Ω (curve b), indicating that the CDs/GO nanocomposites blocks the electron transfer on the surface partly because the abundant negative charges carboxyl group on its surface. After amine-labeled single-strand capture DNA with negative charges on its phosphate backbone was fixed to the CDs/GO surface via amido linkage, the Ret further rises to 3149 Ω (curve c). The Ret greatly increased when the ssDNA probe was immobilized because the negatively charged phosphate backbone of DNA immobilized on the GCE repelled the [Fe(CN)6].3-/4- After hybridization with the target DNA, the value of Ret climbs to 3982 Ω (curve d), because of the large amount of negatively charged DNA linked on the modified electrode. Therefore, these results collectively indicate that the different interfaces of the sensor obtained during the whole preparation process are successfully constructed and that the hybridization of DNA could occur on the surface of electrodes.
Optimization of Conditions for Biosensor
In order to improve the sensitivity of the biosensor, this work investigates the relevant experimental parameters, including the MB accumulation time, DNA hybridization temperature and hybridization time. Figure 6A shows that the current signal increased with the MB accumulation time increasing when the time is below 5 min. But, further increase of the MB accumulation time from 5 to 7 V, the peak current was constant. Therefore, 5 min was selected as the optimal MB accumulation time.
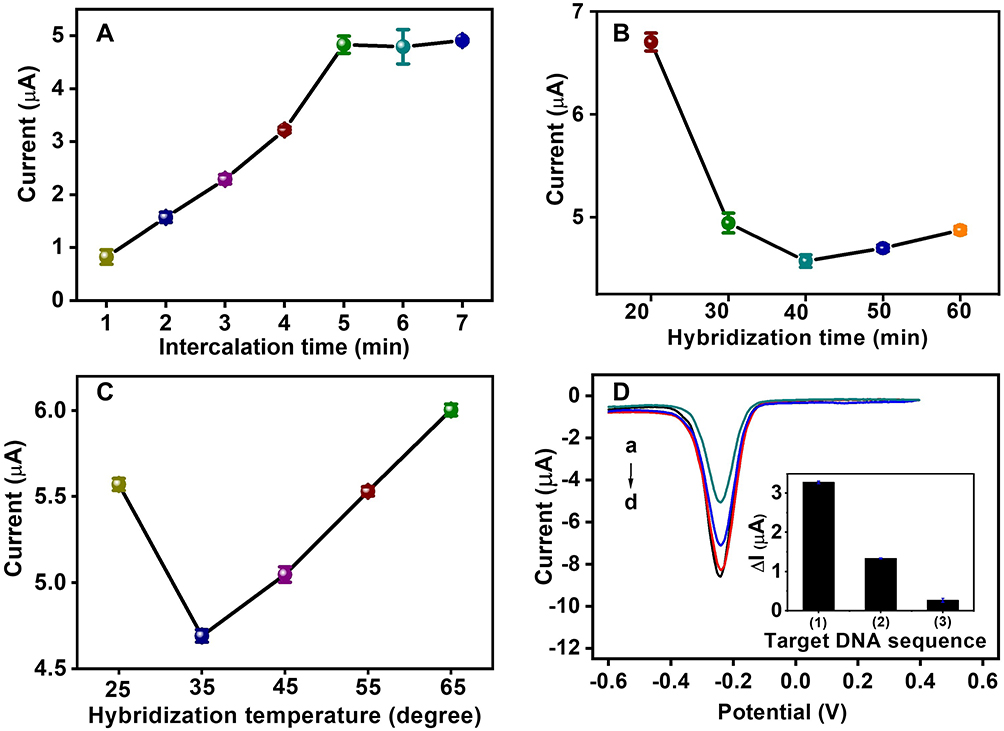 |
Figure 6 Optimization of experimental conditions: MB accumulation time (A), DNA hybridization time (B) and hybridization temperature (C). Specificity of the biosensor different target DNA (D): complementation target DNA (a); single-mismatched target DNA (b); mismatched target DNA (c); blank (d). Insert in Figure 6D: the difference of current signals (ΔI) of complementary target DNA (1), one base-mismatch target DNA (2) and non-complementary target DNA (3). ΔI= I-I blank. |
As we all know, the hybridization time and hybridization temperature act as very important parameters in the hybridization process. A series of experiments were performed to optimize these parameters. The peak current decreased with hybridization time from 20 to 40 min and reached minimum current at 40 min (Figure 6B). Beyond this hybridization time, the MB single almost reached constant. This result indicates that the hybridization reaction was complete after 40 min. Besides, as shown in Figure 6C, the hybridization temperature was investigated by DPV in the range from 25 to 65°C. The peak current decreased significantly with the increase of the hybridization temperature to 35°C. However, the peak current increased with further increased hybridization temperature from 35 to 65°C. To deduce the reason for current signal decrease, the overheating environment accelerates the denaturation of dsDNA, resulting in the decrease of the hybridization number, which would hinder the hybridization efficiency and decrease the electron transfer on electrode surface. Thus, the optimal hybridization time and hybridization temperature were set at 40 min and 35°C respectively.
Specificity of Biosensor
In order to verify the specificity of electrochemical biosensor, the DNA biosensor was examined using capture probe DNA for hybridization with several different target DNA sequences under the optimal conditions. The Figure 6D illustrates that the current signal of capture probe DNA/CDs/GO/GCE (curve d), complementary target DNA (curve a), one base-mismatch target DNA (curve b) and non-complementary target DNA (curve c). The peak current of complementary target DNA (curve a) is obviously lower than other base-mismatch sequence (curve b and curve c) under the optimal experimental conditions. The difference of current signal (ΔI) was obtained the current signal of the biosensor after hybridization with different mismatched target DNA (curve a, b, c) compared with the current signal of capture probe DNA/CDs/GO/GCE (curve d), which is presented as histogram in the inset in Figure 6D (ΔI= I-I blank, I: the current signal of the capture probe DNA/CDs/GO/GCE after hybridization with different mismatched target DNA, I blank: the current signal of capture probe DNA/CDs/GO/GCE). The ΔI of the biosensor after hybridization with complementary target DNA (1), one base-mismatch target DNA (2) and non-complementary target DNA (3) were, respectively, 3.28 μA, 1.33 μA and 0.26 μA. The ΔI of one-base mismatch and non-complementary DNA were 41% and 8% that of complementary target DNA, respectively, indicating that the developed DNA biosensor possessed excellent specificity.
Simultaneously, the stability and reproducibility of the biosensor was investigated, which could be found in the section of “Stability and reproducibility of the biosensor-Supplementary Information.”
Analytical Performance of Biosensor
Under the optimal experimental conditions, different concentrations of complementary target DNA in PBS (10 mM, pH 7.4) were detected by DPV in order to detect the linear relationship of the electrochemical DNA biosensor based on the CDs/GO nanocomposites modified GCE. Besides, the linear relationship was studied between different concentration of DNA target sequence and ΔI. The results are displayed in Figure 7, the ΔI increased accordingly with the increase of the complementary target DNA concentration from 1.00×10⁻¹¹ M to 2.25×10⁻⁹ M. Moreover, when the concentration is greater than 2.25×10⁻⁹ M, the peak current intensity is almost stable (Figure 7A), indicating that the probe fixed on the electrode surface has been hybridized completely. Besides, as shown in Figure 7B, the ΔI has a good linear relationship with the different concentrations of target DNA from 2.50×10⁻¹⁰ M to 2.25×10⁻⁹ M. The regression equation was expressed as lg ΔI = 0.04672 + 1.113 C (C is the concentration of target DNA in the solution) and a good linear correlation coefficient of 0.9885 (Inset in Figure 6B). The detection limit was 8.30×10⁻¹¹ M based on the ratio of signal-to-noise of 3.
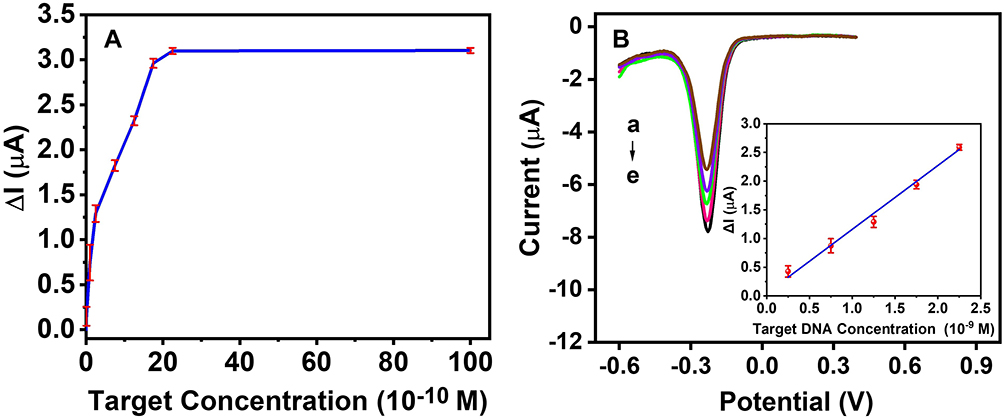 |
Figure 7 (A) The linear relationship between the different concentration of DNA target and ΔI. (B) DPV curves after hybridization with different target concentration (×10−9 M: (a) 2.25, (b) 1.75, (c) 1.25, (d) 0.75, (e) 0.25. Insert in Figure 7B shows that the linear relationship between the logarithmic of different concentration of DNA target and ΔI. |
Those results showed that the electrochemical biosensor based on CDs/GO modified GCE with relatively high sensibility, which was attributed to the abundant carboxyl group on GO surface to increasing of combination with the capture DNA and the improved conductivity caused by CDs in the nanocomposite material. While the detection range is not very wide, the DNA biosensor would provide a good basis of further detection research in practical samples.
Conclusion
In summary, a novel electrochemical DNA biosensor platform was fabricated for the detection of PML/RARα fusion gene. Moreover, this biosensor was based on CDs/GO nanocomposites modified GCE interface, and MB as an electrochemical indicator. Besides, the CDs/GO nanocomposites were prepared by the facile ex-situ synthetic method, and this method had the advantages of simplicity, low cost and environmental. Under optimal condition, owing to the large specific area and good conductivity of the CDs/GO nanocomposites, the nanocomposites modified DNA biosensor offers appealing advantages, such as higher sensitivity, lower detection limit and better reproducibility as compared to pure CDs and GO modified. Furthermore, the excellent specificity of the new electrochemical DNA biosensor for the detection of target DNA sequence has been demonstrated. Therefore, the work has application potential in clinical diagnostic testing for APL or other genetic diseases, and promote the development of other rapid, economical and convenient electrochemical biosensors.
Acknowledgements
The authors gratefully acknowledge the financial support of the Natural Science Foundation of China (21775023). Joint Funds for the Innovation of Science and Technology, Fujian Province (2019Y9005) and the Natural Science Foundation of Fujian Province of China (2019J01301).
Disclosure
The authors report no conflict of interests in this work.
References
1. Grimwade D, Ivey A, Huntly BJP. Molecular landscape of acute myeloid leukemia in younger adults and its clinical relevance. Blood. 2016;127(1):29–41. doi:10.1182/blood-2015-07-604496
2. Zhao J, Liang JW, Xue HL, et al. The genetics and clinical characteristics of children morphologically diagnosed as acute promyelocytic leukemia. Leukemia. 2019;33(6):1387–1399. doi:10.1038/s41375-018-0338-z
3. Sanz MA, Fenaux P, Tallman MS, et al. Management of acute promyelocytic leukemia: updated recommendations from an expert panel of the European LeukemiaNet. Blood. 2019;133(15):1630–1643. doi:10.1182/blood-2019-01-894980
4. Chen XY, Wood BL. Monitoring minimal residual disease in acute leukemia: technical challenges and interpretive complexities. Blood Rev. 2017;31(2):63–75. doi:10.1016/j.blre.2016.09.006
5. Grimwade LF, Fuller KA, Erber WN. Applications of imaging flow cytometry in the diagnostic assessment of acute leukaemia. Methods. 2019;112:39–45. doi:10.1016/j.ymeth.2016.06.023
6. Osumi T, Tsujimoto S, Tamura M, et al. Recurrent RARB translocations in acute promyelocytic leukemia lacking RARA translocation. Cancer Res. 2018;78(16):4452–4458. doi:10.1158/0008-5472.CAN-18-0840
7. Arvand M, Sanayeei M, Hemmati S. Label-free electrochemical DNA biosensor for guanine and adenine by ds-DNA/poly(L-cysteine)/Fe3O4 nanoparticles-graphene oxide nanocomposite modified electrode. Biosens Bioelectron. 2018;102:70–79. doi:10.1016/j.bios.2017.11.002
8. Zheng Y, Wang XY, He SQ, et al. Aptamer-DNA concatamer-quantum dots based electrochemical biosensing strategy for green and ultrasensitive detection of tumor cells via mercury-free anodic stripping voltammetry. Biosens Bioelectron. 2019;126:261–268. doi:10.1016/j.bios.2018.09.076
9. Maghsoudi AS, Hassani S, Mirnia K, et al. Recent advances in nanotechnology-based biosensors development for detection of arsenic, lead, mercury, and cadmium. Int J Nanomed. 2021;16:803–832. doi:10.2147/IJN.S294417
10. Srisomwat C, Yakoh A, Chuaypen N, et al. Amplification-free DNA sensor for the one-step detection of the Hepatitis B virus using an automated paper-based lateral flow electrochemical device. Anal Chem. 2021;93(5):2879–2887. doi:10.1021/acs.analchem.0c04283
11. Nguyet NT, Yen LTH, Doan VY, et al. A label-free and highly sensitive DNA biosensor based on the core-shell structured CeO2-NR@Ppy nanocomposite for Salmonella detection. Mater Sci Eng C. 2019;96:790–797. doi:10.1016/j.msec.2018.11.059
12. Su S, Cao WF, Liu W, et al. Dual-mode electrochemical analysis of microRNA-21 using gold nanoparticle-decorated MoS2 nanosheet. Biosens Bioelectron. 2017;94:552–559. doi:10.1016/j.bios.2017.03.040
13. Divya KP, Karthikeyan R, Sinduja B, et al. Carbon dots stabilized silver–lipid nano hybrids for sensitive label free DNA detection. Biosens Bioelectron. 2019;133:48–54. doi:10.1016/j.bios.2019.03.027
14. Huang JY, Zhao L, Lei W, et al. A high-sensitivity electrochemical aptasensor of carcinoembryonic antigen based on graphene quantum dots-ionic liquid-nafion nanomatrix and DNAzyme-assisted signal amplification strategy. Biosens Bioelectron. 2018;99:28–33. doi:10.1016/j.bios.2017.07.036
15. Moulick A, Milosavljevic V, Vlachova J, et al. Using CdTe/ZnSe core/shell quantum dots to detect DNA and damage to DNA. Int J Nanomed. 2017;12:1277–1291. doi:10.2147/IJN.S121840
16. Chen M, Hou CJ, Huo DQ, Fa HB, Zhao YN, Shen CH. A sensitive electrochemical DNA biosensor based on three-dimensional nitrogen-doped graphene and Fe3O4 nanoparticles. Sens Actuator B-Chem. 2017;239:421–429. doi:10.1016/j.snb.2016.08.036
17. Miao P, Tang YG, Wang L. DNA modified Fe3O4@Au magnetic nanoparticles as selective probes for simultaneous detection of heavy metal ions. ACS Appl Mater Interfaces. 2017;9(4):3940–3947. doi:10.1021/acsami.6b14247
18. Zhang W, Dai ZC, Liu X, et al. High-performance electrochemical sensing of circulating tumor DNA in peripheral blood based on poly-xanthurenic acid functionalized MoS2 nanosheets. Biosens Bioelectron. 2018;105:116–120. doi:10.1016/j.bios.2018.01.038
19. Wongkaew N, Simsek M, Griesche C, Baeumner AJ. Functional nanomaterials and nanostructures enhancing electrochemical biosensors and lab-on-a-chip performances: recent progress, applications, and future perspective. Chem Rev. 2019;119(1):120–194. doi:10.1021/acs.chemrev.8b00172
20. Torres D, Perez-Rodriguez S, Sebastian D, Pinilla JL, Lazaro MJ, Suelves I. Graphene oxide nanofibers: a nanocarbon material with tuneable electrochemical properties. Appl Surf Sci. 2020;509:144774. doi:10.1016/j.apsusc.2019.144774
21. Georgakilas V, Tiwari JN, Kemp KC, et al. Noncovalent functionalization of graphene and graphene oxide for energy materials, biosensing, catalytic, and biomedical applications. Chem Rev. 2016;116(9):5464–5519. doi:10.1021/acs.chemrev.5b00620
22. Fauzi ASA, Hamidah NL, Sato S, et al. Carbon-based potentiometric hydrogen sensor using a proton conducting graphene oxide membrane coupled with a WO3 sensing electrode. Sens Actuator B Chem. 2020;323:128678. doi:10.1016/j.snb.2020.128678
23. Lee J, Kim J, Kim S, Min DH. Biosensors based on graphene oxide and its biomedical application. Adv Drug Deliv Rev. 2016;105:275–287. doi:10.1016/j.addr.2016.06.001
24. Jume BH, Gabris MA, Nodeh HR, Rezania S, Cho J. Biodiesel production from waste cooking oil using a novel heterogeneous catalyst based on graphene oxide doped metal oxide nanoparticles. Renew Energy. 2020;162:2182–2189. doi:10.1016/j.renene.2020.10.046
25. Zhu JM, Ye ZL, Fan XY, et al. A highly sensitive biosensor based on Au NPs/rGO-PAMAM-Fc nanomaterials for detection of cholesterol. Int J Nanomed. 2019;14:835–849. doi:10.2147/IJN.S184013
26. Fan Q, Li JH, Wang JY, et al. Ultrasensitive Fe3+ ion detection based on carbon quantum dot-functionalized solution-gated graphene transistors. J Mater Chem C. 2020;8(14):4685–4689. doi:10.1039/d0tc00635a
27. Rasheed PA, Sandhyarani N. Carbon nanostructures as immobilization platform for DNA: a review on current progress in electrochemical DNA sensors. Biosens Bioelectron. 2017;97:226–237. doi:10.1016/j.bios.2017.06.001
28. Baig N, Sajid M, Saleh TA. Recent trends in nanomaterial-modified electrodes for electroanalytical applications. Trends Analyt Chem. 2019;111:47–61. doi:10.1016/j.trac.2018.11.044
29. Khodadadi A, Faghih-Mirzaei E, Karimi-Maleh H, et al. A new epirubicin biosensor based on amplifying DNA interactions with polypyrrole and nitrogen-doped reduced graphene: experimental and docking theoretical investigations. Sens Actuator B Chem. 2019;284:568–574. doi:10.1016/j.snb.2018.12.164
30. Xia CL, Zhu SJ, Feng TL, Yang MX, Yang B. Evolution and synthesis of carbon dots: from carbon dots to carbonized polymer dots. Adv Sci. 2019;6(23):1901316. doi:10.1002/advs.201901316
31. Lima CS, Hola K, Ambrosi A, Zboril R, Pumera M. Graphene and carbon quantum dots electrochemistry. Electrochem Commun. 2015;52:75–79. doi:10.1016/j.elecom.2015.01.023
32. Zhong X, Li X, Ying Z, Chai YQ, Yuan R. Synthesizing anode electrochemiluminescent self-catalyzed carbon dots-based nanocomposites and its application in sensitive ECL biosensor for microRNA detection. Sens Actuator B Chem. 2020;305:127490. doi:10.1016/j.snb.2019.127490
33. Hoang VC, Dave K, Gomes VG. Carbon quantum dot-based composites for energy storage and electrocatalysis: mechanism, applications and future prospects. Nano Energy. 2019;66:104093. doi:10.1016/j.nanoen.2019.104093
34. Algarra M, Gonzalez-Calabuig A, Radotic K, et al. Enhanced electrochemical response of carbon quantum dot modified electrodes, applications and future prospects. Talanta. 2018;178:679–685. doi:10.1016/j.talanta.2017.09.082
35. Cai ZT, Ye YB, Wan X, et al. Morphology-dependent electrochemical sensing properties of iron oxide-graphene oxide nanohybrids for dopamine and uric acid. Nanomaterials. 2019;9(6):835. doi:10.3390/nano9060835
36. Li RY, Zhu HY, Li ZJ, Liu JK. Electrochemical determination of acetaminophen using a glassy carbon electrode modified with a hybrid material consisting of graphene aerogel and octadecylamine-functionalized carbon quantum dots. Microchim Acta. 2018;185(2):145. doi:10.1007/s00604-018-2688-7
37. Yang LQ, Huang N, Lu QJ, et al. A quadruplet electrochemical platform for ultrasensitive and simultaneous detection of ascorbic acid, dopamine, uric acid and acetaminophen based on a ferrocene derivative functional Au NPs/carbon dots nanocomposite and graphene. Anal Chim Acta. 2015;903:69-80. doi:10.1016/j.aca.2015.11.021
38. Chen DD, Zhuang XM, Zhai J, Zheng YY, Lua H, Chen LX. Preparation of highly sensitive Pt nanoparticles-carbon quantum dots/ionic liquid functionalized graphene oxide nanocomposites and application for H2O2 detection. Sens Actuator B-Chem. 2018;255:1500-1506. doi:10.1016/j.snb.2017.08.156
39. Canevari TC, Rossi MV, Alexiou ADP. Development of an electrochemical sensor of endocrine disruptor bisphenol A by reduced graphene oxide for incorporation of spherical carbon nanoparticles. J Electroanal Chem. 2019;832:24-30. doi:10.1016/j.jelechem.2018.10.0441
40. Li LB, Liu D, Shi AP, You TY. Simultaneous stripping determination of cadmium and lead ions based on the N-doped carbon quantum dots-graphene oxide hybrid. Sens Actuator B-Chem. 2018;255:1762-1770. doi:10.1016/j.snb.2017.08.1901
41. Huang QT, Lin XF, Zhu JJ, Tong QX. Pd-Au@carbon dots nanocomposite: facile synthesis and application as an ultrasensitive electrochemical biosensor for determination of colitoxin DNA in human serum. Biosens Bioelectron. 2017;94:507–512. doi:10.1016/j.bios.2017.03.048
42. Jamaluddin RZAR, Tan LL, Chong KF, Heng LY. An electrochemical DNA biosensor fabricated from graphene decorated with graphitic nanospheres. Nanotechnology. 2020;31(48):85501. doi:10.1088/1361-6528/abab2e
43. Rafiee-Pour HA, Behpour M, Keshavarz M. A novel label-free electrochemical miRNA biosensor using methylene blue as redox indicator: application to breast cancer biomarker miRNA-21. Biosens Bioelectron. 2016;77:202–207. doi:10.1016/j.bios.2015.09.025
44. Sani NDM, Ariffin EY, Sheryn W, et al. An electrochemical DNA biosensor for carcinogenicity of anticancer compounds based on competition between methylene blue and oligonucleotides. Sensors. 2019;19(23):5111. doi:10.3390/s19235111
45. Liu C, Bao L, Tang B, et al. Fluorescence-converging carbon nanodots-hybridized silica nanosphere. Small. 2016;12(34):4702–4706. doi:10.1002/smll.201503958
46. Lin KC, Yin CY, Chen SM. An electrochemical biosensor for determination of hydrogen peroxide using nanocomposite of poly (methylene blue) and FAD hybrid film. Sens Actuator B Chem. 2011;157(1):202–210. doi:10.1016/j.snb.2011.03.050
 © 2021 The Author(s). This work is published and licensed by Dove Medical Press Limited. The full terms of this license are available at https://www.dovepress.com/terms.php and incorporate the Creative Commons Attribution - Non Commercial (unported, v3.0) License.
By accessing the work you hereby accept the Terms. Non-commercial uses of the work are permitted without any further permission from Dove Medical Press Limited, provided the work is properly attributed. For permission for commercial use of this work, please see paragraphs 4.2 and 5 of our Terms.
© 2021 The Author(s). This work is published and licensed by Dove Medical Press Limited. The full terms of this license are available at https://www.dovepress.com/terms.php and incorporate the Creative Commons Attribution - Non Commercial (unported, v3.0) License.
By accessing the work you hereby accept the Terms. Non-commercial uses of the work are permitted without any further permission from Dove Medical Press Limited, provided the work is properly attributed. For permission for commercial use of this work, please see paragraphs 4.2 and 5 of our Terms.