")
Back to Journals » International Journal of Nanomedicine » Volume 10 » Issue 1
Efficient delivery of ursolic acid by poly(N-vinylpyrrolidone)-block-poly (ε-caprolactone) nanoparticles for inhibiting the growth of hepatocellular carcinoma in vitro and in vivo
Authors Zhang H, Zheng D, Ding J, Xu H , Li X , Sun W
Received 6 November 2014
Accepted for publication 28 December 2014
Published 11 March 2015 Volume 2015:10(1) Pages 1909—1920
DOI https://doi.org/10.2147/IJN.S77125
Checked for plagiarism Yes
Review by Single anonymous peer review
Peer reviewer comments 4
Editor who approved publication: Professor Lei Yang
Hao Zhang,1,* Donghui Zheng,2,* Jing Ding,3 Huae Xu,4 Xiaolin Li,1 Weihao Sun1
1Department of Geriatric Gastroenterology, First Affiliated Hospital with Nanjing Medical University, Nanjing, People’s Republic of China; 2Department of Nephrology, Huai’an Hospital Affiliated with Xuzhou Medical College and Huai’an Second Hospital, Huai’an, People’s Republic of China; 3Department of Respiratory Medicine, Affiliated Nanjing Children Hospital with Nanjing Medical University, 4Department of Pharmacy, First Affiliated Hospital with Nanjing Medical University, Nanjing, People’s Republic of China
*These authors contributed equally to this article
Abstract: Previous reports have shown that ursolic acid (UA), a pentacyclic triterpenoid derived from Catharanthus trichophyllus roots, could inhibit the growth of a series of cancer cells. However, the potential for clinical application of UA is greatly hampered by its poor solubility, whereas the hydrophobicity of UA renders it a promising model drug for nanosized delivery systems. In the current study, we loaded UA into amphiphilic poly(N-vinylpyrrolidone)-block-poly (ε-caprolactone) nanoparticles and performed physiochemical characterization as well as analysis of the releasing capacity. In vitro experiments indicated that UA-NPs inhibited the growth of liver cancer cells and induced cellular apoptosis more efficiently than did free UA. Moreover, UA-NPs significantly delayed tumor growth and localized to the tumor site when compared with the equivalent dose of UA. In addition, both western blotting and immunohistochemistry suggested that the possible mechanism of the superior efficiency of UA-NPs is mediation by the regulation of apoptosis-related proteins. Therefore, UA-NPs show potential as a promising nanosized drug system for liver cancer therapy.
Keywords: apoptosis, liver cancer, drug delivery, antitumor
Introduction
Hepatocellular carcinoma remains one of the most common cancers, accounting for nearly 90% of primary liver cancer cases worldwide.1,2 Despite the advancement of current therapies, the resistance to conventional chemotherapy has led to low response rates and poor overall survivals. Given the poor diagnosis and high frequency of recurrence, there is an urgent need to overcome the current limitations of chemotherapeutics to improve the therapeutic effect.
Previous studies have showed that ursolic acid (UA), a pentacyclic triterpenoid derived from Catharanthus trichophyllus roots, can restrain the growth of a series of cancer cells.3,4 Recent studies have shown the antitumor effect of UA through induction of apoptosis and inhibition of angiogenesis.5,6 However, the limitation of UA clinically is attributed mainly to poor solubility and lack of ability to target tumor sites. In one study, in vivo applications of UA were significantly impaired by its low solubility, which consequently led to poor pharmacokinetics.7 As well, side effects of UA were unavoidable due to its lack of tumor targeting. Both of the limitations could be overcome by the introduction of nanoparticle-based delivery systems.
We previously demonstrated in our lab that UA-loaded mPEG-PCL (methoxy poly[ethylene glycol]-poly[ε-caprolactone]) nanoparticles inhibit the proliferation of gastric cancer cells through apoptotic induction.8 Ishida et al have reported that although integration of polyethylene glycol (PEG) in the surface of nanoparticles lengthens the circulation time by allowing evasion of the macrophage system, their retention in vivo is still severely impaired.9 As we previously reported, poly(N-vinylpyrrolidone) (PVP), a good alternative to PEG,10,11 enhances the in vivo circulation time in that it evades the reticuloendothelial system more efficiently.12 It was reported that PVP conjugated with tumor necrosis factor-α (TNF-α) showed longer blood circulation time than did PEG-conjugated TNF-α.11 Recently, it was reported that the capability of PVP to prevent protein adsorption was correlated with its coating and molecule weight.13,14 It was found that the nanoparticles coated by PVP, with molecular weight of 2,500 and 4,800 Da, were rapidly removed from blood due to complement components and immunoglobulins adsorption.14
In this report, we loaded UA into poly(N-vinylpyrrolidone)-block-poly (ε-caprolactone) (PVP-b-PCL) nanoparticles and performed physiochemical characterization. In vitro and in vivo antitumor effects of the UA-loaded PVP-b-PCL nanoparticles (UA-NPs) were evaluated. Meanwhile, the expression of apoptosis-related proteins was examined to elucidate the possible mechanisms underlying the antitumor effect of UA-NPs. Lastly, we also studied the in vivo distribution of UA-NPs.
Materials and methods
Materials
UA was purchased from National Institutes for Food and Drug Control (Beijing, People’s Republic of China). CCK-8 was purchased from Dojindo Laboratories (Tokyo, Japan). Mouse H22 hepatocellular carcinoma cells were purchased from Shanghai Institute of Cell Biology (Shanghai, People’s Republic of China). Cells were maintained in Roswell Park Memorial Institute (RPMI) 1640 (Life Technologies Corp, Carlsbad, CA, USA) that contained 10% fetal bovine serum (FBS) (Life Technologies Corp), 100 U/mL penicillin, and 100 U/mL streptomycin, in a humidified atmosphere with 5% CO2 at 37°C.
Male ICR mice with an average weight of around 20 g were purchased from the animal center of Nanjing Medical University (Nanjing, People’s Republic of China). The experimental protocol was approved by the Animal Experiment Committee of Nanjing Medical University.
Methods
Formulation of nanoparticles and characterization of nanoparticles
PVP-b-PCL was synthesized as described in our previous report.12 UA-NPs were prepared according to our previous study, with minor modification.15,16 Briefly, 20 mg PVP-b-PCL and 5 mg UA were dissolved in 3 mL acetone and then slowly titrated into 30 mL double-distilled water, under gentle stirring at room temperature. It was then transferred into a dialysis bag with a cutoff of 12 kDa for 2 hours, followed by filtering through a 220 nm membrane. Blank nanoparticles were prepared without adding UA. All of the nanoparticles were lyophilized with F-68 as cryoprotectant.
Scanning electron microscopy (SEM) (S4800; Hitachi, Tokyo, Japan), transmission electron microscopy (TEM) (JEM-100S; JEOL, Tokyo, Japan), and Fourier transform infrared spectra (FTIR) were applied to characterize the UA-NPs. The size of nanoparticles was measured by dynamic light scattering (DLS) with a Brookhaven BI-9000AT system (Brookhaven Instruments Corp, Holtsville, NY, USA). Zeta potential was measured by the laser Doppler anemometry (Zeta Plus Zeta Potential Analyzer; Brookhaven Instruments Corp).
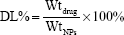
High-performance liquid chromatography (HPLC) (Shimadzu LC-10AD; Shimadzu Corp, Kyoto, Japan) was applied to quantify the concentration of UA with a mobile phase of methanol (spectral grade) (Merck KGaA, Darmstadt, Germany)/water/triethylamine (90/10/0.5 [v/v/v]). The loading efficiency was evaluated by calculating the equations:
|
|
and
|
|

where DL% is the drug loading content (%), Wtdrug is weight of the drug in nanoparticles, WtNPs is weight of the nanoparticles, EE% is the encapsulation efficiency (%) and Indrug is the initial amount of drug.
In vitro release of UA-NPs was evaluated by dialysis method as reported previously.17,18 First, 10 mg powder of UA-NPs was dissolved in 1 mL phosphate-buffered saline (PBS) and transferred into a dialysis bag. The bag was completely immersed in 40 mL PBS at room temperature for 5 days. At each time point, 1 mL solution inside the bag was taken out for HPLC measurement of UA concentration. A cumulative release curve of free UA was made by adding the equivalent dose of UA. UA was first dissolved into a small amount of dimethyl sulfoxide (DMSO) (200 μL) and then mixed with 1 mL PBS.
X-ray diffraction (XRD) diagrams of UA and UA-NPs were performed on a Rigaku (Tokyo, Japan) D/Max-RA diffractometer (using Cu Ka radiation 30 kV, 50 mA).19 Differential scanning calorimetry (DSC) was performed, according to previous study.20
Cellular uptake study
To investigate the mechanism of cellular uptake of our NPs, we firstly modified our NPs with a fluorescein isothiocyanate (FITC) fluorescent probe via bioconjugation, as previously described.15,16 Then the fluorescent labeled NPs were incubated with H22 cells at 37°C for 4 hours. Cells treated with phenylarsine oxide (10 μM) to block potential clathrin-mediated endocytosis prior to NPs incubation were taken for comparison under the same condition. Fluorescence intensity of FITC in respect of uptake of NPs was quantitatively determined via flow cytometry assay (FACSVerse™; BD Biosciences, Franklin Lakes, NJ, USA) and analyzed by FlowJo software (version 7.6.2; Tree Star, Ashland, OR, USA).
In vitro cytotoxicity of UA-NPs
Cytotoxicity testing was performed by CCK-8 assays on H22 cells. The water-soluble tetrazolium salt, WST-8, is reduced by cellular dehydrogenase activities and will generate a yellow-color formazan dye that is directly proportional to the number of living cells. Briefly, each well was seeded with around 5,000 cells in a 96-well plate and then treated with escalated doses of UA and UA-NPs for 48 hours. At the end of treatment, 20 μL CCK-8 was incubated with the cells for 1 hour at 37°C, and then the absorbance was detected by a microplate reader with a wavelength at 450 nm. The experiment was repeated three times for data analysis.
Flow cytometry analysis
After being treated with UA and UA-NPs at the equivalent doses of 20 and 40 μM, cells were collected and centrifuged to remove the supernatant. Then cells were suspended in a mixed solution of annexin V-FITC and propidium iodide (PI), followed by incubation for 15 minutes at 25°C. Each tube was measured by the FACS cytometer, with an excited wavelength of 488 nm and an emission wavelength of 530 nm and 617 nm for annexin V-FITC and PI, respectively.
In vivo antitumor efficacy
Cell suspension with 1×10⁷ H22 cells was injected subcutaneously into the left axilla of mice. Experiments started at the time that most mice tumors reached a volume of about 100 mm3. Mice were randomly divided into four groups with eight mice per group. From day 1, UA and UA-NPs were respectively administered intraperitoneally for 10 days at a daily dose of 50 mg/kg similar to both saline group and blank nanoparticle group. During the experiment, tumor volume (T) was measured every 2 days and calculated with the equation:
T = (W2 × L)/2, | (3) |
where W is the widest diameter and L is the longest diameter. At the end of experiment, mice were sacrificed, and tumors were excised for the immunohistochemistry and Western blot studies. The tissues were also investigated via hematoxylin and eosin (H&E) pathological staining to observe the toxicity of the drugs.
Relative tumor volume (RTV) was measured according to the equation:
RTV = Vn/V0, | (4) |
where Vn is the volume at the experimental day and V0 is the volume at the first day. Therapeutic efficacy (T/C%) was calculated according to the equation:
T/C% = TRTV/CRTV, | (5) |
where TRTV is RTV of the experimental group, while CRTV is RTV of the control group. During the process, mice were weighed at each observation point.
CT imaging
We used a clinical Gemstone Spectral 64-Detector CT (Discovery CT 750 HD; GE Healthcare, Little Chalfont, UK), enabling single-source ultrafast kVp switching and observation of images for the separation of materials such as iron, iodine, and water. On Day 13, mice were first anesthetized with an intraperitoneal administration of 20 mg/kg ketamine and 10 mg/kg xylazine. Then, images were collected, in the cranial to caudal direction, of the whole body. Computed tomography (CT) data was further analyzed using Hounsfield units (HU), for tumor measurement.
Immunohistochemistry
Immunohistochemistry was performed according to the previous study.21 The extracted tumors were fixed in 4% buffered paraformaldehyde solution for 24hours, then were paraffin embedded and sectioned at 5 μm thickness. The expression of apoptosis-related proteins in tumor tissues, such as COX-2, Bax, Bcl-2, and Caspase-3, were measured by immunohistochemistry, according to the manufacturer’s instructions.
Western blot assay
Western blot assay was performed according to previous study.22 Total proteins were extracted from the tumors of mice treated with different agents. Gel electrophoresis was applied to separate the specified proteins, which were then electrotransferred into polyvinylidene fluoride membranes (Millipore Corp, Billerica, MA, USA). After that, the membranes were blocked by 5% milk and incubated with primary antibodies anti-COX-2, anti-Bax, anti-Bcl-2, and anti-Caspase-3 (Cell Signaling Technology, Inc., Beverly, MA, USA) and GAPDH (Sigma-Aldrich Corp, St Louis, MO, USA) overnight at 4°C. Horseradish peroxidase (HRP)-conjugated antibodies were then incubated with the membranes after washing. An enhanced chemiluminescence (ECL) kit was applied to visualize the band, in darkness.
In vivo biodistribution
To determine the biodistribution of the drug, the relative absorption potentials of UA and UA-NPs in various tissues were measured. Mice were randomly divided into two groups with each group containing 20 mice and then fasted overnight with free access to water. Four mice were injected intraperitonealy with UA (50 mg/kg) and UA-NPs (50 mg/kg), respectively, for each time point to collect tissue organs. The mice were dissected to collect tissues from the heart, liver, spleen, lung, kidney, and tumor at the predetermined time (1, 4, 12, 24, or 48 hours, respectively). The tissues were first homogenized on ice in 2 mL PBS, and then diluted 100 times. The HPLC system was employed to analyze the diluted homogenates.
Results and discussion
Characterization of UA-NPs
Gel permeation chromatography (GPC) and nuclear magnetic resonance (NMR) characterization of PVP-b-PCL was reported in our previous study.12 The solutions of UA-NPs appeared blue in color due to the light scattering of nanoparticles (Figure 1A). The morphology of UA-NPs was observed by TEM and SEM, with almost spherical shape at a size of around 100 nm (Figure 1B). DLS measurement indicated that the mean size of UA-NPs was about 120 nm, while the surface charge of UA-NPs was slightly negative (Table 1 and Figure S1). The characteristic peak of UA at a wavelength of 1,688 cm−1 could be easily located in the spectrum of UA-NPs, demonstrating that UA was successfully encapsulated (Figure 1C). As determined by HPLC, the highest loading content of UA was about 12%, with a highest encapsulation efficiency of more than 80% (Table 1). The satisfied loading efficiency might be attributed to the affinity between the hydrophobic UA and polycaprolactone (PCL) core.23
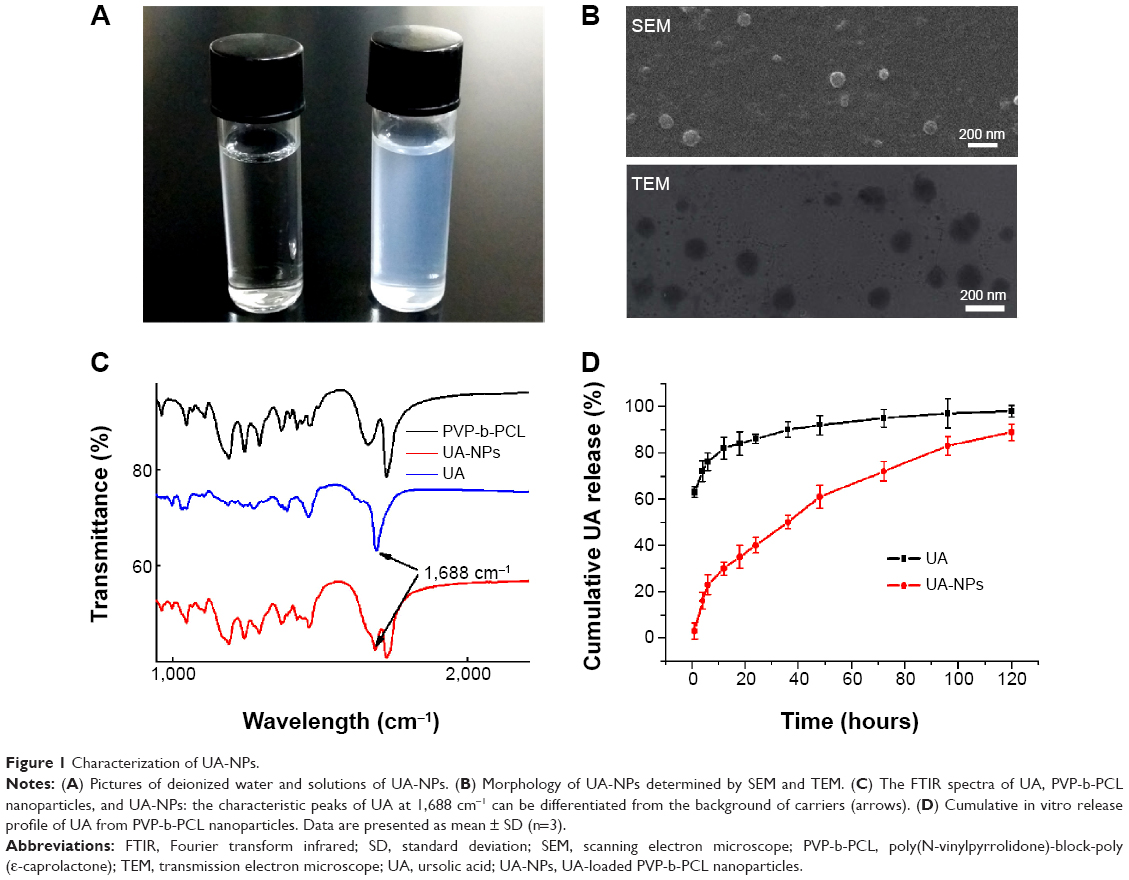 | Figure 1 Characterization of UA-NPs. |
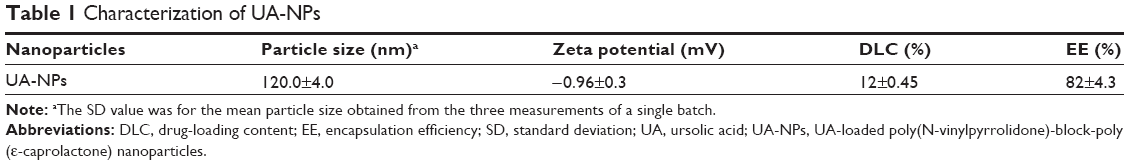 | Table 1 Characterization of UA-NPs |
Figure 1D shows a quick UA release, of about 28%, within the first 8 hours, which may have resulted from the inevitable affiliation of certain drugs to the surface of UA-NPs. In the following process, UA was released in a controlled manner from the nanoparticles. In contrast, the burst release of free UA reached a more than 65% of total UA. It is clear that UA-NPs, characterized by a sustained releasing pattern, could be a promising novel formulation of UA for future applications.
The state of encapsulated drug in the nanoparticles is one of the main factors in determining the release profile of drug delivery systems. XRD diagrams of pure UA and UA-NPs are shown in Figure 2. Notably, there was no diffraction peak of UA in the XRD diagram of UA-NPs, which means UA was molecularly dispersed in the inner core of the PVP-b-PCL nanoparticles.
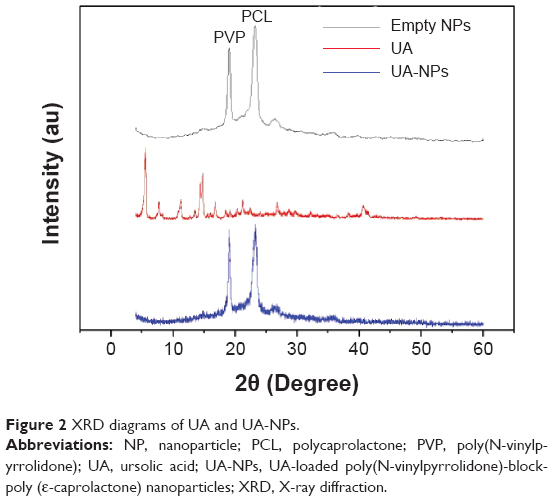 | Figure 2 XRD diagrams of UA and UA-NPs. |
As shown in Figure 3, pure UA is characterized by an endothermic melting peak at 287°C, while no UA melting peak was found in the DSC curves of UA-NPs. Therefore, the encapsulated UA in the PVP-b-PCL nanoparticles was disorderly dispersed as a crystalline state in the polymer matrix.
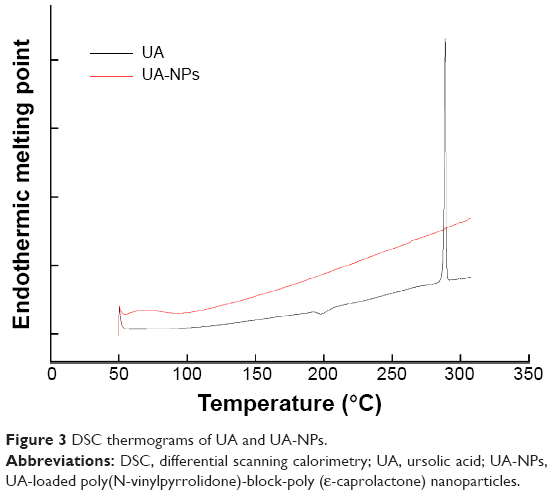 | Figure 3 DSC thermograms of UA and UA-NPs. |
Enhanced proliferation inhibition and apoptotic induction of UA-NPs in H22 cells
As shown in Figure 4A, both UA and UA-NPs dose-dependently reduced the viability of H22 cells in a similar pattern. Moreover, as the concentration increased, UA-NPs induced more cell death than the equivalent doses of UA. As calculated from the data, the half maximal inhibitory concentration (IC50) of UA-NPs was 32.89±3.23 μM, significantly lower than that of free UA (59.84±4.12 μM). Figure 4B indicates that blank nanoparticles were almost nontoxic to H22 cells even at the highest dose of 800 μg/mL.
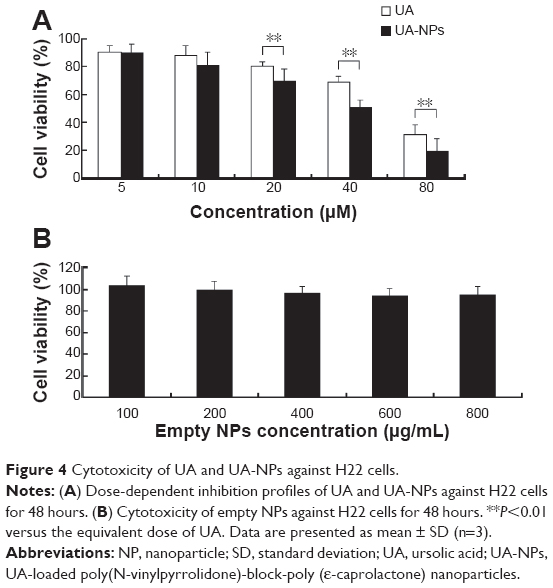 | Figure 4 Cytotoxicity of UA and UA-NPs against H22 cells. |
We examined apoptotic rates of H22 cells caused by UA and UA-NPs, using fluorescent annexin V-FITC/PI double staining with flow cytometry. Annexin V and PI were applied to discriminate cellular apoptosis from necrosis, due to the difference in penetrative ability of the two dyes into the apoptotic and necrotic cells.24 As shown in Figure 5, a significant increase of early and late apoptotic cells was detected in H22 following the treatment. Moreover, both UA and UA-NPs induced apoptosis in H22 cells in a dose-dependent manner. Notably, the number of either early or late apoptotic cells induced by UA-NPs was significantly larger than that of cells treated with the equivalent dose of free UA.
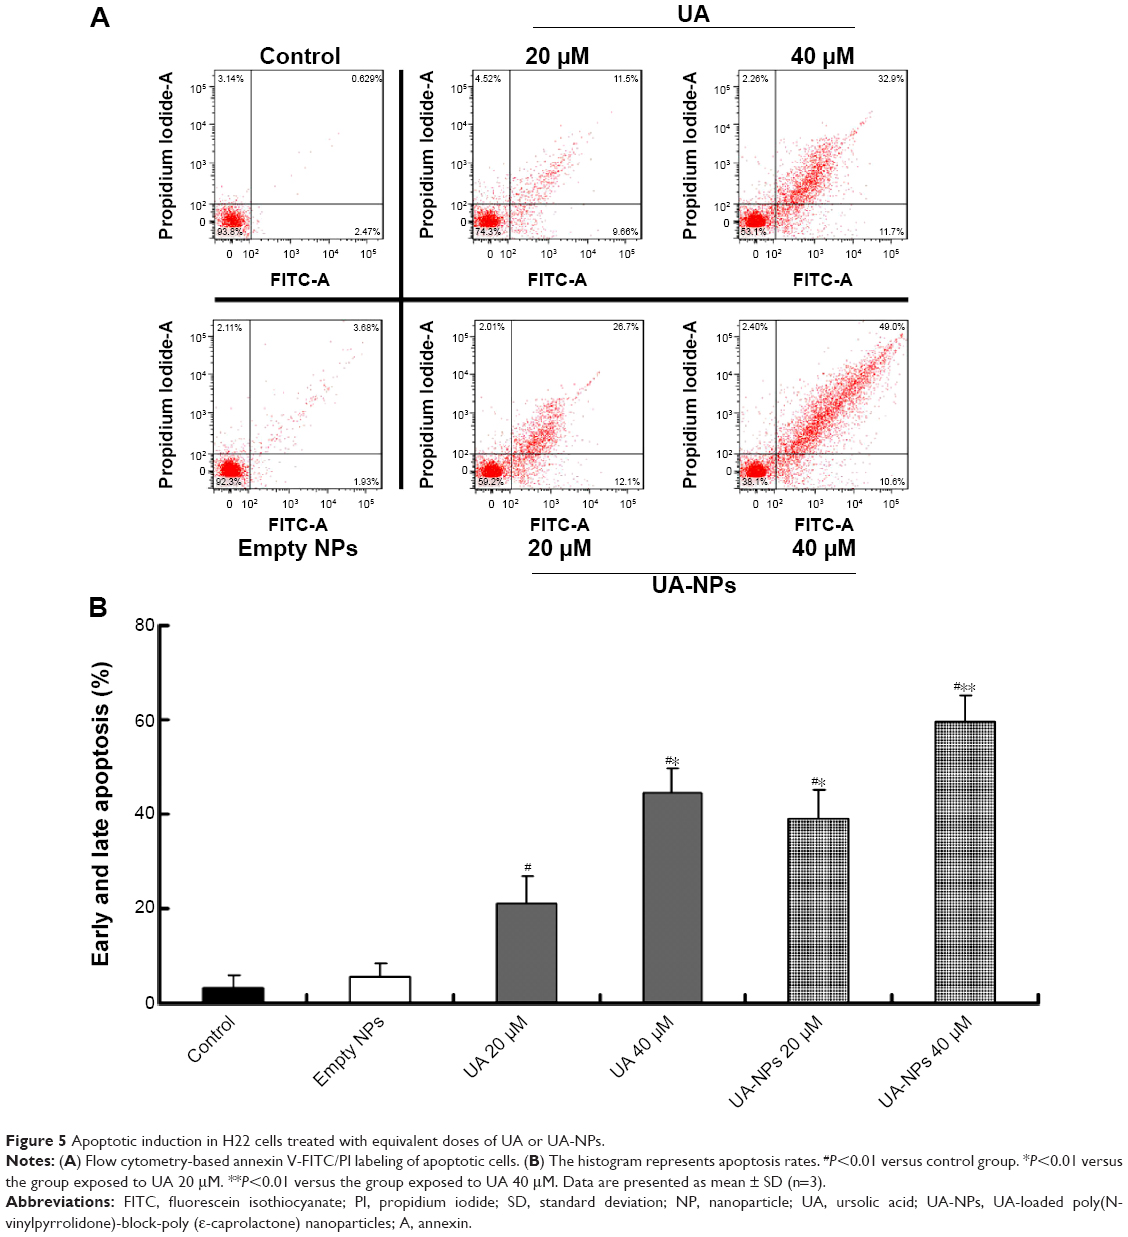 | Figure 5 Apoptotic induction in H22 cells treated with equivalent doses of UA or UA-NPs. |
Uptake efficiency of the nanoparticles was quantitatively determined via flow cytometry assay (Figure S2). Fluorescence intensity of FITC-labeled nanoparticles inside cells was presented. After blocking the clathrin endocytosis process via phenylarsine oxide, there was a significant reduction in uptake efficiency, which demonstrated that clathrin-dependent endocytosis was important for the cellular uptake.
There is evidence that the cellular uptake pathways of free drug and drug-loaded nanoparticles are not the same. Some reports show that the passive diffusion of free drug into cells contributes to the low efficiency of cellular uptake, while the uptake of nanoparticles by cells through endocytosis greatly increases the uptake efficiency of drugs.25,26 However, a recent publication reported that 50 nm nanoparticles enter largely by passive diffusion and are found in the cytoplasm, whereas 100 nm nanoparticles enter primarily via clathrin- and also caveolin-mediated endocytosis and are found in endosomes.27 The contradiction here needs further study to elucidate the possible mechanisms of cellular uptake of nanoparticles. Nevertheless, since the T/C% is closely related to the intracellular accumulation of drugs, drug-loaded nanoparticles could reach relatively higher concentration in tumor cells due to endocytosis.
In our previous reports, we constructed different kinds of drug-loaded mPEG-PCL nanoparticles and studied the cellular uptake of the nanoparticles. We demonstrated that compared with free drug, increased accumulation, by cellular endocytosis of nanoparticles, led to enhanced cytotoxicity of drug-loaded nanoparticles over that of free drug.15,16 This advantage may mainly derive from the efficient cellular uptake of drug-loaded nanoparticles and the controlled delivery of UA in tumor cells.28
In vivo evaluation of UA-NPs in H22-transplanted mice
Figure 6A indicates the tumor growth curves of mice treated with different agents. Both free UA and UA-NPs delayed tumor growth in a dose-dependent manner, while UA-NPs led to a more retarded growth from day 5. There was a significant difference between the tumor volumes of mice treated with UA-NPs and free UA (P<0.05). The curves of derived parameters from tumor volume, including RTV and T/C%, demonstrated the superior antitumor effects of UA-NPs compared with free UA by showing the similar trends of tumor volume (Figure 6B and C). As shown in Figure 6D, bodyweight change curves show that UA induced severe weight loss by the end of the experiment. We noticed that two mice in the UA group had necropsy at the centers of their tumor, and they were in a very weak state (mobility and “color of fur”). This was not very obvious until the second week of the experiment. These results partially indicate that free UA led to more toxicity than UA-NPs at the equivalent administered dose.
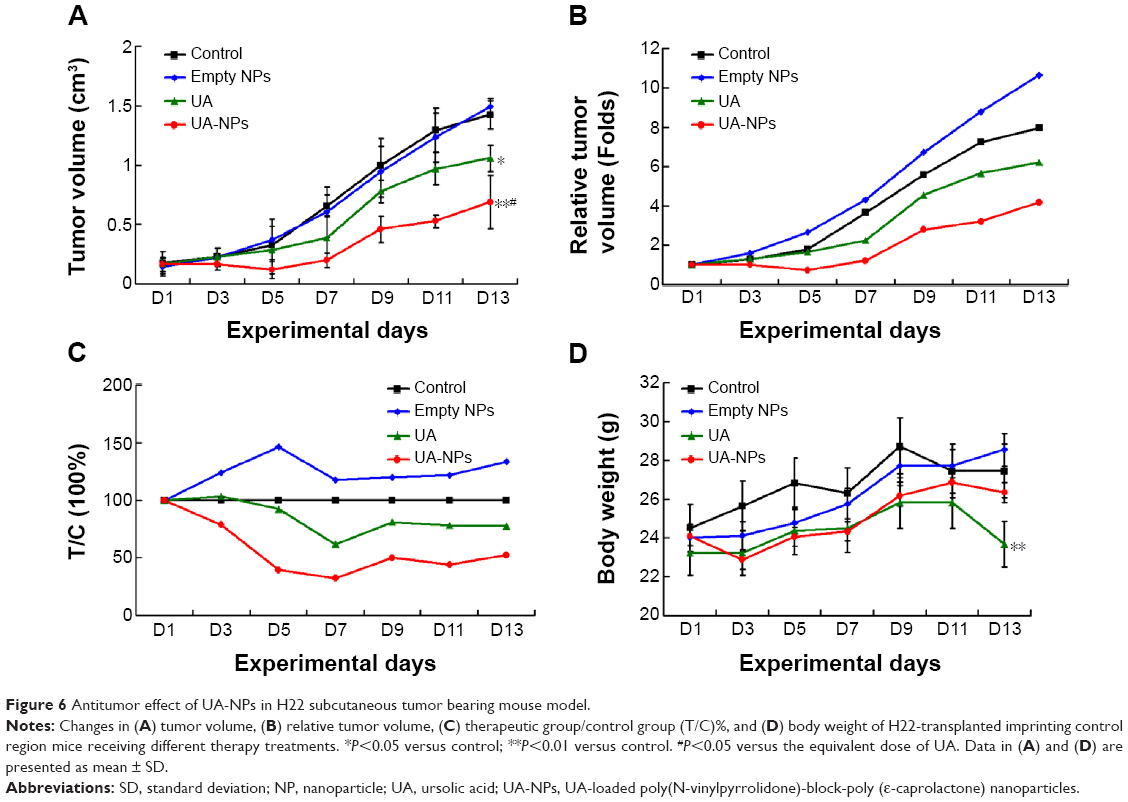 | Figure 6 Antitumor effect of UA-NPs in H22 subcutaneous tumor bearing mouse model. |
As shown in Figure 7, corresponding CT images of mice were collected at 13 days posttreatment to estimate the therapeutic efficacy. Volume of the tumor lesions was presented by three-dimensional reconstruction (Figure 7A): UA and UA-NPs remarkably reduced the tumor burden in contrast with the control group. The transversal view (Figure 7B) shows that UA treatment resulted in the remission of a majority of tumor lesions, while that of UA-NPs group exhibited near total depletion. In summary, CT findings confirmed that our UA-NPs treatment platform resulted in pronounced antitumor potency.
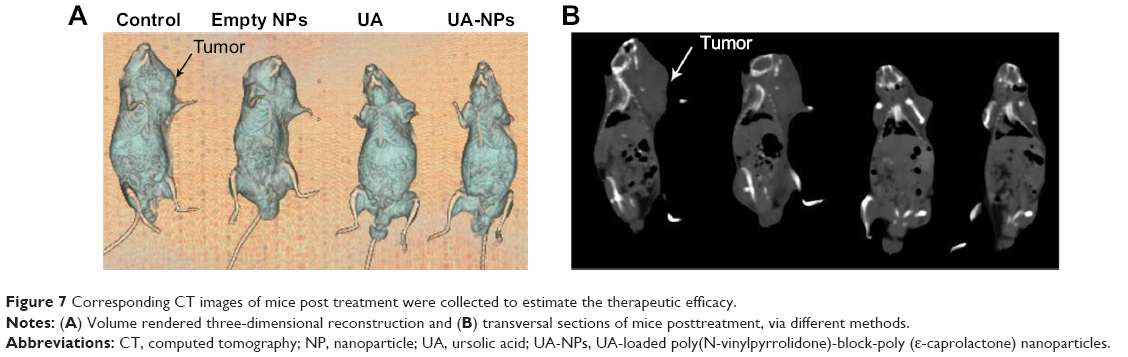 | Figure 7 Corresponding CT images of mice post treatment were collected to estimate the therapeutic efficacy. |
The possible mechanisms underlying the enhanced in vivo antitumor efficacy of UA-NPs may be related to the following aspects. First, the enhanced permeability and retention (EPR) effect enables the accumulation of drug-loaded nanoparticles in the tumor site during the circulation when administered systemically – which is also called passive targeting.29 Moreover, as to the cellular uptake, drug-loaded nanoparticles can efficiently penetrate cell membrane through endocytosis, which subsequently leads to a higher intracellular drug concentration, thereby exerting its pharmacological activity more effectively.30 Second, the preferred size for kidney filter is below 10 nm.31 Nanoparticles with the size more than 10 nm may circulate much longer in vivo. Additionally, the relatively better kinetic stability of nanoparticles also contributes to the prolonged circulation time in vivo, through further enhancing of the EPR effect.32
Effect of UA-NPs on the expressions of Caspase-3, Bcl-2, Bax, and COX-2
The expressions of COX-2, Bcl-2, Bax, and Caspase-3 in H22 cells or tumor tissues were examined by Western blotting and immunohistochemical staining. The subcutaneous hepatocellular carcinoma tumor models were treated with empty nanoparticles, UA, and UA-NPs, respectively. UA and UA-NPs upregulated the expressions of Caspase-3 and Bax, but downregulated the expressions of Bcl-2 and COX-2 (Figure 8). Most importantly, there were significant differences between the protein expressions in cells treated with UA-NPs and free UA (P<0.05). In other words, UA-NPs had a more significant effect on protein expression than did free UA. The results from the tumor tissues were in accordance with the results from cells (Figure 9).
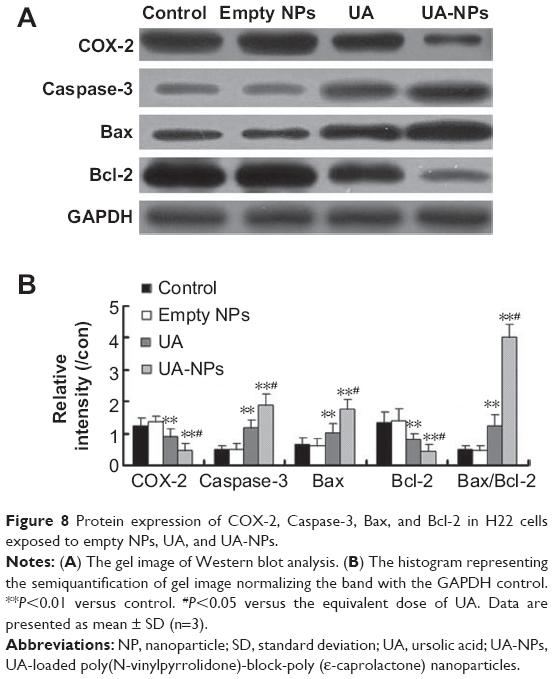 | Figure 8 Protein expression of COX-2, Caspase-3, Bax, and Bcl-2 in H22 cells exposed to empty NPs, UA, and UA-NPs. |
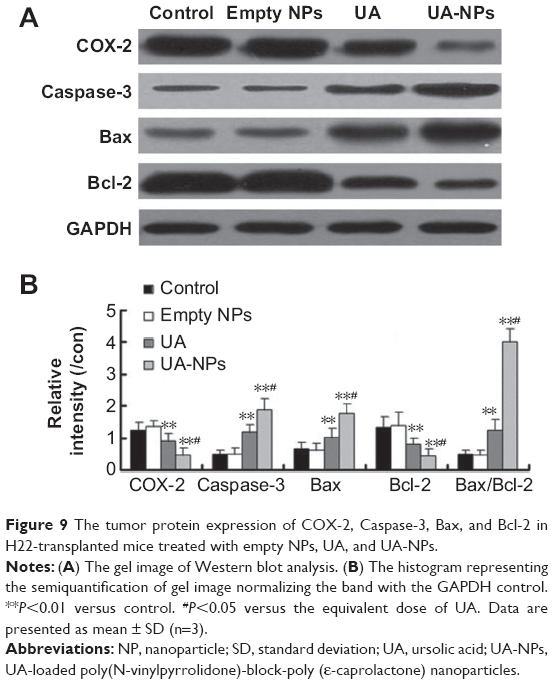 | Figure 9 The tumor protein expression of COX-2, Caspase-3, Bax, and Bcl-2 in H22-transplanted mice treated with empty NPs, UA, and UA-NPs. |
Immunohistochemistry experiments showed that the proteins with positive stain mainly localized to the cytoplasm and membrane (Figure 10). The number of cells with positive Caspase-3 and Bax stain treated with UA-NPs was significantly higher than those of cells treated with free UA. Similarly, UA-NPs inhibited the expression of Bcl-2 and COX-2 in tumor tissues more significantly relative to the inhibition caused by free UA.
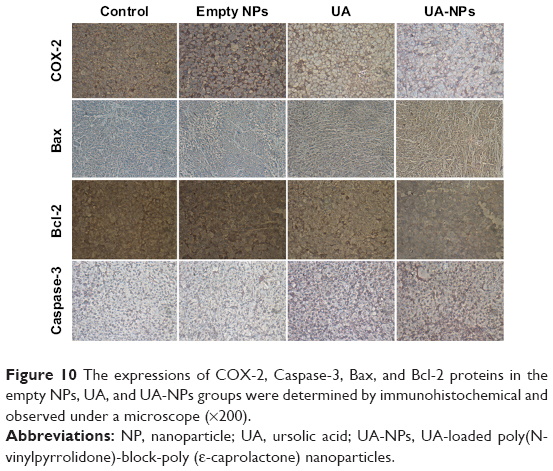 | Figure 10 The expressions of COX-2, Caspase-3, Bax, and Bcl-2 proteins in the empty NPs, UA, and UA-NPs groups were determined by immunohistochemical and observed under a microscope (×200). |
In vitro and in vivo protein quantification may provide some evidence for the superior antitumor efficacy of UA-NPs, which still remains unclear. Apoptosis is a physiological cell death program that is a vital pathway in maintaining tissue homeostasis.33 The current study examined the expression of COX-2 and apoptotic proteins. Previous study reported that COX-2, the rate-limiting enzyme for prostaglandin synthesis, plays a key role in regulating the apoptosis-related proteins.34 The increased prostaglandins catalyzed by overexpression of COX-2 have been shown to be involved in cell proliferation, apoptosis resistance, and angiogenesis.34 It is well known that the Bcl-2 family of proteins constitutes an important control mechanism in the regulation of apoptosis. Bcl-2 is an apoptosis inhibitor, and high Bcl-2 levels are required to maintain intracellular gene transfer and other changes required to block apoptosis.35 Caspase family proteases are downstream targets of Bcl-2 in the mitochondrial apoptosis signaling pathway.36
In our previous report, UA delivered in mPEG-PCL nanoparticles effectively induced cellular apoptosis by inhibiting the expression of COX-2 and then regulating the downstream apoptotic proteins. In the current study, UA-loaded PVP-b-PCL nanoparticles showed a longer circulation time and a better tumor accumulation in the in vivo bio-distribution study. This formulation also led to a significantly lower expression of COX-2 both in vitro and in vivo. The evaluation of apoptotic proteins indicated that compared with free UA, the levels of proapoptotic proteins Bax and Caspase-3 increased, while the expression of antiapoptotic Bcl-2 proteins decreased more significantly under the treatment of UA-NPs. Therefore, the current results provide a possible explanation for the superiority of UA-NPs – the efficient uptake of UA-NPs leads to an enhanced inhibition of COX-2 expression and the subsequent regulation of apoptotic proteins, thereby inducing apoptosis more effectively.
In vivo biodistribution analysis
Figure 11 shows the distribution of free UA and UA-NPs in different tissues at various times. Free UA mainly accumulated in the liver, kidney, and tumor in the initial 12 hours (Figure 11A), then was followed by quick redistribution from these tissues. It is clear that most of the free UA was cleaned up from the major tissues after 48 hours. However, the concentration of UA delivered by nanoparticles gradually accumulated in the liver and tumor over time. At the end of the observation period (48 hours postinjection), the peak UA concentration of UA-NPs was achieved in liver and tumor (Figure 11B). To analyze the potential toxicity of our UA-NPs in vivo, both spleen and liver of mice were harvested during the experiment and investigated via H&E pathological staining, as shown in Figure S3. There was no apparent abnormality or inflammation lesion in any of the four organs, which presents solid evidence to the long term biocompatibility of UA-NPs. These results indicate that delivery of UA by nanoparticles can alter the in vivo biodistribution and prolong the retention time of UA.
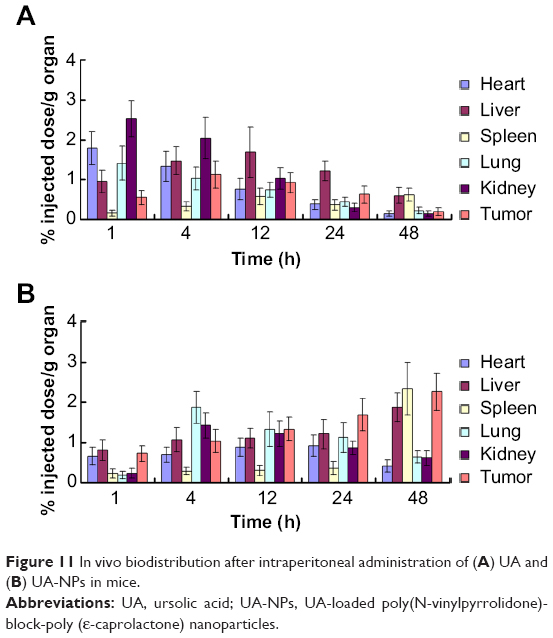 | Figure 11 In vivo biodistribution after intraperitoneal administration of (A) UA and (B) UA-NPs in mice. |
Conclusion
In the current study, UA was loaded into nanoparticles, with amphiphilic PVP-b-PCL block copolymer as the drug carrier. In vitro antitumor evaluation indicated that UA-NPs inhibited the growth of liver cancer cells and induced cellular apoptosis more efficiently than did free UA. Moreover, UA-NPs significantly delayed tumor growth and showed higher accumulation in tumor sites compared with the equivalent dose of UA. Additionally, both Western blotting and immunohistochemistry results suggest that the possible mechanism for the increased efficiency of UA-NPs was mediation by the regulation of apoptosis-related proteins. Therefore, UA-NPs show the potential to be a promising nanosized drug system for liver cancer therapy.
Acknowledgments
This work was supported by the National Natural Science Foundation of China (grant numbers 81372659, 81001077, and 81270817), and a project funded by the Priority Academic Program Development of Jiangsu Higher Education Institutions.
We thank Ms Maureen Aliru from University of Texas MD Anderson Cancer Center for proofreading the manuscript.
Disclosure
The authors report no conflicts of interest in this work.
References
Siegel R, Naishadham D, Jemal A. Cancer statistics, 2013. CA Cancer J Clin. 2013;63(1):11–30. | ||
Parkin DM, Bray F, Ferlay J, Pisani P. Estimating the world cancer burden: Globocan 2000. Int J Cancer. 2001;94(2):153–156. | ||
Shanmugam MK, Dai X, Kumar AP, Tan BK, Sethi G, Bishayee A. Ursolic acid in cancer prevention and treatment: molecular targets, pharmacokinetics and clinical studies. Biochem Pharmacol. 2013;85(11):1579–1587. | ||
Gao N, Cheng S, Budhraja A, et al. Ursolic acid induces apoptosis in human leukaemia cells and exhibits anti-leukaemic activity in nude mice through the PKB pathway. Br J Pharmacol. 2012;165(6):1813–1826. | ||
Shanmugam MK, Ong TH, Kumar AP, et al. Ursolic acid inhibits the initiation, progression of prostate cancer and prolongs the survival of TRAMP mice by modulating pro-inflammatory pathways. PLoS One. 2012;7(3):e32476. | ||
Limami Y, Pinon A, Leger DY, et al. HT-29 colorectal cancer cells undergoing apoptosis overexpress COX-2 to delay ursolic acid-induced cell death. Biochimie. 2011;93(4):749–757. | ||
Caldeira de Araújo Lopes S, Vinícius Melo Novais M, Salviano Teixeira C, et al. Preparation, physicochemical characterization, and cell viability evaluation of long-circulating and pH-sensitive liposomes containing ursolic acid. Biomed Res Int. 2013;2013:467147. | ||
Zhang H, Li X, Ding J, et al. Delivery of ursolic acid (UA) in polymeric nanoparticles effectively promotes the apoptosis of gastric cancer cells through enhanced inhibition of cyclooxygenase 2 (COX-2). Int J Pharm. 2013;441(1–2):261–268. | ||
Ishida T, Ichihara M, Wang X, et al. Injection of PEGylated liposomes in rats elicits PEG-specific IgM, which is responsible for rapid elimination of a second dose of PEGylated liposomes. J Control Release. 2006;112(1):15–25. | ||
Leiva A, Quina FH, Araneda E, Gargallo L, Radić D. New three-arm amphiphilic and biodegradable block copolymers composed of poly(epsilon-caprolactone) and poly(N-vinyl-2-pyrrolidone). Synthesis, characterization and self-assembly in aqueous solution. J Colloid Interface Sci. 2007;310(1):136–143. | ||
Kaneda Y, Tsutsumi Y, Yoshioka Y, et al. The use of PVP as a polymeric carrier to improve the plasma half-life of drugs. Biomaterials. 2004;25(16):3259–3266. | ||
Zhu Z, Li Y, Li X, et al. Paclitaxel-loaded poly(N-vinylpyrrolidone)-b-poly(epsilon-caprolactone) nanoparticles: preparation and antitumor activity in vivo. J Control Release. 2010;142(3):438–446. | ||
Wu Z, Chen H, Liu X, Zhang Y, Li D, Huang H. Protein adsorption on poly(N-vinylpyrrolidone)-modified silicon surfaces prepared by surface-initiated atom transfer radical polymerization. Langmuir. 2009;25(5):2900–2906. | ||
Gaucher G, Asahina K, Wang J, Leroux JC. Effect of poly(N-vinyl-pyrrolidone)-block-poly(D,L-lactide) as coating agent on the opsonization, phagocytosis, and pharmacokinetics of biodegradable nanoparticles. Biomacromolecules. 2009;10(2):408–416. | ||
Li X, Zhen D, Lu X, et al. Enhanced cytotoxicity and activation of ROS-dependent c-Jun NH2-terminal kinase and caspase-3 by low doses of tetrandrine-loaded nanoparticles in Lovo cells – a possible Trojan strategy against cancer. Eur J Pharm Biopharm. 2010;75(3):334–340. | ||
Li X, Lu X, Xu H, et al. Paclitaxel/tetrandrine coloaded nanoparticles effectively promote the apoptosis of gastric cancer cells based on “oxidation therapy”. Mol Pharm. 2012;9(2):222–229. | ||
Li X, Li R, Qian X, et al. Superior antitumor efficiency of cisplatin-loaded nanoparticles by intratumoral delivery with decreased tumor metabolism rate. Eur J Pharm Biopharm. 2008;70(3):726–734. | ||
Ding D, Wang J, Zhu Z, et al. Tumor accumulation, penetration, and antitumor response of cisplatin-loaded gelatin/poly(acrylic acid) nanoparticles. ACS Appl Mater Interfaces. 2012;4(3):1838–1846. | ||
Zhang L, Hu Y, Jiang X, Yang C, Lu W, Yang YH. Camptothecin derivative-loaded poly(caprolactone-co-lactide)-b-PEG-b-poly(caprolactone-co-lactide) nanoparticles and their biodistribution in mice. J Control Release. 2004;96(1):135–148. | ||
Hu Y, Xie J, Tong YW, Wang CH. Effect of PEG conformation and particle size on the cellular uptake efficiency of nanoparticles with the HepG2 cells. J Control Release. 2007;118(1):7–17. | ||
Ma X, Jin S, Zhang Y, Wan L, Zhao Y, Zhou L. Inhibitory effects of nobiletin on hepatocellular carcinoma in vitro and in vivo. Phytother Res. 2014;28(4):560–567. | ||
Xu H, Hou Z, Zhang H, et al. An efficient Trojan delivery of tetrandrine by poly(N-vinylpyrrolidone)-block-poly(ε-caprolactone) (PVP-b-PCL) nanoparticles shows enhanced apoptotic induction of lung cancer cells and inhibition of its migration and invasion. Int J Nanomedicine. 2014;9:231–242. | ||
Li R, Li X, Xie L, et al. Preparation and evaluation of PEG-PCL nanoparticles for local tetradrine delivery. Int J Pharm. 2009;379(1):158–166. | ||
Chen S, Cheng AC, Wang MS, Peng X. Detection of apoptosis induced by new type gosling viral enteritis virus in vitro through fluorescein annexin V-FITC/PI double labeling. World J Gastroenterol. 2008;14(14): 2174–2178. | ||
Davda J, Labhasetwar V. Characterization of nanoparticle uptake by endothelial cells. Int J Pharm. 2002;233(1–2):51–59. | ||
Rosen H, Abribat T. The rise and rise of drug delivery. Nat Rev Drug Discov. 2005;4(5):381–385. | ||
Thorley AJ, Ruenraroengsak P, Potter TE, Tetley TD. Critical determinants of uptake and translocation of nanoparticles by the human pulmonary alveolar epithelium. ACS Nano. 2014;8(11):11778–11789. | ||
Le Garrec D, Gori S, Luo L, et al. Poly(N-vinylpyrrolidone)-block-poly(D,L-lactide) as a new polymeric solubilizer for hydrophobic anticancer drugs: in vitro and in vivo evaluation. J Control Release. 2004;99(1):83–101. | ||
Morille M, Montier T, Legras P, et al. Long-circulating DNA lipid nanocapsules as new vector for passive tumor targeting. Biomaterials. 2010;31(2):321–329. | ||
Zhang L, Yang M, Wang Q, et al. 10-Hydroxycamptothecin loaded nanoparticles: preparation and antitumor activity in mice. J Control Release. 2007;119(2):153–162. | ||
Yuan F, Leunig M, Huang SK, Berk DA, Papahadjopoulos D, Jain RK. Microvascular permeability and interstitial penetration of sterically stabilized (stealth) liposomes in a human tumor xenograft. Cancer Res. 1994;54(13):3352–3356. | ||
Farokhzad OC, Langer R. Impact of nanotechnology on drug delivery. ACS Nano. 2009;3(1):16–20. | ||
Zhang L, Zhang S. Modulating Bcl-2 family proteins and caspase-3 in induction of apoptosis by paeoniflorin in human cervical cancer cells. Phytother Res. 2011;25(10):1551–1557. | ||
Miyata Y, Koga S, Kanda S, Nishikido M, Hayashi T, Kanetake H. Expression of cyclooxygenase-2 in renal cell carcinoma: correlation with tumor cell proliferation, apoptosis, angiogenesis, expression of matrix metalloproteinase-2, and survival. Clin Cancer Res. 2003;9(5):1741–1749. | ||
Jendrossek V. The intrinsic apoptosis pathways as a target in anticancer therapy. Curr Pharm Biotechnol. 2012;13(8):1426–1438. | ||
Snigdha S, Smith ED, Prieto GA, Cotman CW. Caspase-3 activation as a bifurcation point between plasticity and cell death. Neurosci Bull. 2012;28(1):14–24. |
Supplementary materials
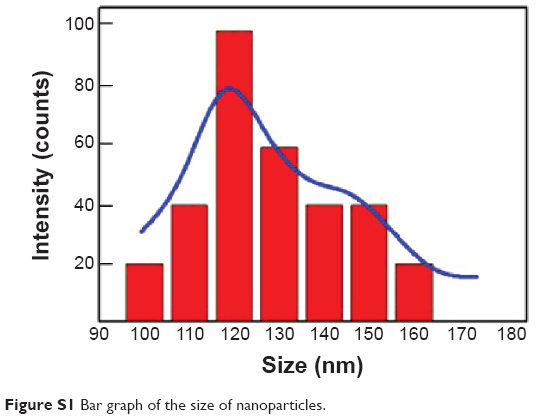 | Figure S1 Bar graph of the size of nanoparticles. |
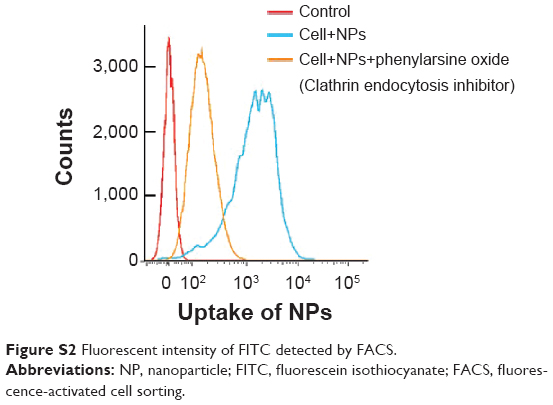 | Figure S2 Fluorescent intensity of FITC detected by FACS. |
 | Figure S3 H&E staining of different tissues in mice from different groups of mice. |
 © 2015 The Author(s). This work is published and licensed by Dove Medical Press Limited. The full terms of this license are available at https://www.dovepress.com/terms.php and incorporate the Creative Commons Attribution - Non Commercial (unported, v3.0) License.
By accessing the work you hereby accept the Terms. Non-commercial uses of the work are permitted without any further permission from Dove Medical Press Limited, provided the work is properly attributed. For permission for commercial use of this work, please see paragraphs 4.2 and 5 of our Terms.
© 2015 The Author(s). This work is published and licensed by Dove Medical Press Limited. The full terms of this license are available at https://www.dovepress.com/terms.php and incorporate the Creative Commons Attribution - Non Commercial (unported, v3.0) License.
By accessing the work you hereby accept the Terms. Non-commercial uses of the work are permitted without any further permission from Dove Medical Press Limited, provided the work is properly attributed. For permission for commercial use of this work, please see paragraphs 4.2 and 5 of our Terms.