")
Back to Journals » Degenerative Neurological and Neuromuscular Disease » Volume 8
Efficacy of stem cell therapy in ambulatory and nonambulatory children with Duchenne muscular dystrophy – Phase I–II
Authors Dai A, Baspinar O , Yeşilyurt A, Sun E, İnci Aydemir C, Öztel ON , Capkan DU, Pinarli F , Agar A , Karaöz E
Received 21 April 2018
Accepted for publication 20 July 2018
Published 26 October 2018 Volume 2018:8 Pages 63—77
DOI https://doi.org/10.2147/DNND.S170087
Checked for plagiarism Yes
Review by Single anonymous peer review
Peer reviewer comments 2
Editor who approved publication: Prof. Dr. Thomas Müller
Alper Dai,1 Osman Baspinar,2 Ahmet Yeşilyurt,3 Eda Sun,4 Çiğdem İnci Aydemir,5 Olga Nehir Öztel,5 Davut Unsal Capkan,6 Ferda Pinarli,3 Abdullah Agar,7 Erdal Karaöz4,5,8
1Gaziantep University Medical Faculty, Pediatric Neurology Department, Gaziantep, Turkey; 2Gaziantep University Medical Faculty, Pediatric Cardiology Department, Gaziantep, Turkey; 3Diskapi Yildirim Beyazit Research and Education Hospital, University of Health Sciences, Center for Genetic Diagnosis, Ankara, Turkey; 4İstinye University, Center for Stem Cell Research and Application, İstanbul, Turkey; 5Liv Hospital – Center for Regenerative Medicine and Stem Cell Research and Manufacturing, İstanbul, Turkey; 6Deva Hospital, Department of Radiology, Gaziantep, Turkey; 7University of Travnik, Travnik, Bosnia and Herzegovina; 8İstinye University, Medical Faculty, Histology and Embryology Department, İstanbul, Turkey
Purpose: Duchenne muscular dystrophy (DMD) is an X-linked recessive pediatric disorder that ultimately leads to progressive muscle degeneration. It has been known that cell-based therapies were used to promote muscle regeneration. The main purpose of this study was to investigate the effects of allogeneic Wharton jelly-derived mesenchymal stem cells therapy in Duchenne muscular dystrophy.
Patients and methods: Four ambulatory and five nonambulatory male patients were assessed as having acceptance criteria. Gene expression and immunohistochemical analysis were performed for dystrophin gene expression. The fluorescent in situ hybridization method was used for detection of chimerism and donor–recipient compatibility. Complement dependent lymphocytotoxic crossmatch test and detection of panel reactive antigen were performed. All patients were treated with 2 × 10⁶ cells/kg dose of allogeneic Wharton jelly-derived mesenchymal stem cells via intra-arterial and intramuscular administration. Stability was maintained in patient follow-up tests, which are respiratory capacity tests, cardiac measurements, and muscle strength tests.
Results: The vastus intermedius muscle was observed in one patient with MRI. Chimerism was detected by fluorescent in situ hybridization and mean gene expression was increased to 3.3-fold. An increase in muscle strength measurements and pulmonary function tests was detected. Additionally, we observed two of nine patients with positive panel reactive antigen result.
Conclusion: All our procedures are well tolerated, and we have not seen any application-related complications so far. Our main purpose of this study was to investigate the effects of allogeneic mesenchymal stem cell therapy and determine its suitability and safety as a form of treatment in this untreatable disorder.
Keywords: Duchenne muscular dystrophy, mesenchymal stem cells, panel reactive antigen, treatment
Introduction
Duchenne Muscular Dystrophy (DMD) is an X-linked recessive pediatric disorder resulting in the absence of dystrophin, which ultimately leads to progressive muscle degeneration. DMD occurs in 1/3,500 males births as a result when there is no dystrophin in the sarcolemma.1 The clinical findings of DMD patients show progressive loss of functional abilities of movement, breath, and eventually the ability to circulate blood clinical signs.2 It is known that, there is no cure for DMD with conventional therapies, although several strategies such as corticosteroids, which have limited activity and cause numerous adverse effects (weight gain, cataracts, osteoporosis, and reduction of height), exon skipping drug, gene therapies, utrophin upregulation, and myosin inhibition, are being tested for treatment; none have yet proven to be adequate.3
Cell-based therapies have a mission to repair the functions of damaged tissues or organs. These therapies emerge in the regenerative medicine as an impressive process for many diseases.4 Stem cells are preferable for therapeutic applications, due to their capacity for self-renewal, differentiation potential, antiinflammatory, antiapoptotic, antiangiogenic, regenerative, and immunomodulatory abilities.5–7 There are also many clinical trials including minimizing the effects of some autoimmune and neurodegenerative diseases to prove that stem cell transplantation was well tolerated and did not cause permanent sequels.8 Additionally, it has been known that cell-based therapies were used to promote muscle regeneration with the hope that the host cells repopulated the muscle and improved muscle function and pathology as an attractive method to treat muscular dystrophy.9
Mesenchymal stem cells (MSC) can be derived from different types of adult stem cells, that is, Wharton jelly, bone marrow, and adipose tissue.10 Especially, Wharton jelly-derived MSCs (WJ-MSCs) have an ability to inhibit muscle cell death by suppressing apoptosis.11 Kwon et al have pointed out that human WJ-MSCs is a promising therapeutic agent for treatment of myopathies and other skeletal muscle diseases via paracrine activity.12
The main purposes of this study were to both investigate the effects of allogeneic WJ-MSC treatment for DMD in ambulatory and nonambulatory children and to assess the safety and efficacy of allogeneic WJ-MSC administration.
Materials and methods
Study design and treatment
Four ambulatory and five nonambulatory male patients between the age group of 7 and 14 years (mean age: 10 years and 6 months) who fulfilled the diagnostic criteria of DMD by multiplex ligation-dependent probe amplification were included in the study (Table 1). One of the parents decided to withdraw their child prematurely from the study due to social issues. None of the patients received glucocorticoid treatment before inclusion in the study. Patient assessment included evaluation of age of onset; ambulation status; NIH stages; cardiac, liver, and renal functions; Gower’s maneuver; and general muscle function (Vignos scale and Brooke scale). Serum creatine kinase (CK) levels were evaluated using standard clinical procedures and selected mRNA and protein targets were determined before and after stem cell treatment. Detailed inclusion and exclusion criteria are listed in Table 2. The primary and the secondary endpoints of this clinical trial are investigated as development of NIH stage III or IV side effects due to treatment, completion of the 9-month follow-up period, leaving from the study, an unexpected progression of the disease, and loss of the patient.
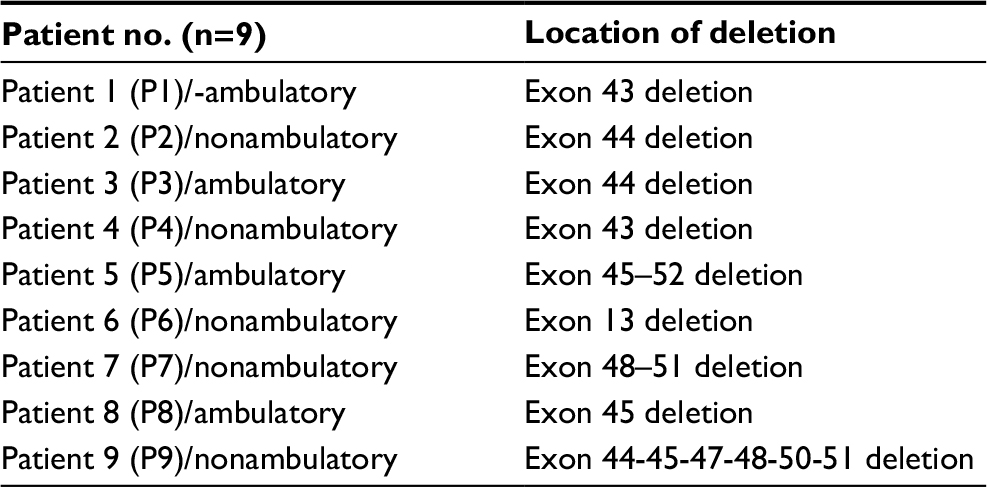 | Table 1 Genotype characteristics of patients |
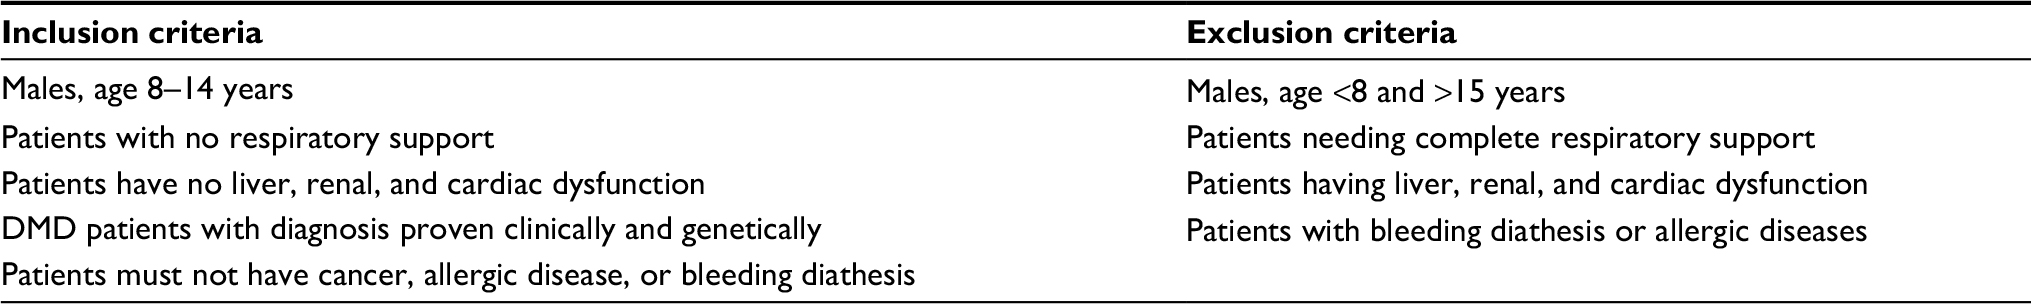 | Table 2 Patient inclusion and exclusion criteria Abbreviation: DMD, Duchenne muscular dystrophy. |
Cellular therapies were administrated as four doses of intramuscular and four doses of intra-arterial into right brachiocephalic and left subclavian artery by using angiography. In cellular therapies, the injection routes are very critical for the effective function of stem cells. Because of the antiinflammatory effect, intramuscular injection is suggested by Jahromi et al.13 Besides, the intra-arterial path has a wider systemic effect than the other injection ways.14
Clinical scores were obtained from each patient, prior to cell therapy and at 2 and 9 months after treatment by means of the following tests: respiratory function by using spirometric parameters such as FVC and FEV1, ejection fraction (EF) was evaluated with echocardiography, detection of panel reactive antigen (PRA), gene expression and immunohistochemical analysis of dystrophin, and fluorescent in situ hybridization (FISH) method for detection of X–Y chimerism. The study was approved by the Ethical committee of Ministry of Health Republic of Turkey (protocol number: 56733164), was performed in accordance with the Helsinki Declaration, and has been registered at ClinicalTrials.gov (identifier: NCT02484560).
Stem cell production and quality control
MSCs were isolated, expanded, and analyzed in Good Manufacturing Practices (GMP)-certified laboratory conditions. Umbilical cords were obtained from consenting patients delivering full-term infants by Caesarian section (n=1), who faced no complications throughout pregnancy. Cords were rinsed using PBS (Invitrogen/Gibco, Paisley, UK), briefly; umbilical cord vessels were then removed manually from cord segments, and the remaining tissue was minced into 3–5 mm pieces before placing them in a tissue culture dish. The explants were cultured in MSC NutriStem® XF Basal Medium and MSC NutriStem® XF Supplement Mix (Biological Industries, Cromwell, CT, USA) cell culture media supplied with 2% human serum (SeraCare, Milford, MA, USA) and 50 U/mL penicillin–streptomycin (Biological Industries). Cells were grown in a humidified atmosphere containing 5% CO2 at 37°C and were subcultured until the third passage. For MSC characterization, the cells were harvested at their third passages, and quality control tests were performed for the clinical use. These tests are summarized in Table 3 with their justifications, techniques, and reference values (See Figures S1 and S2).
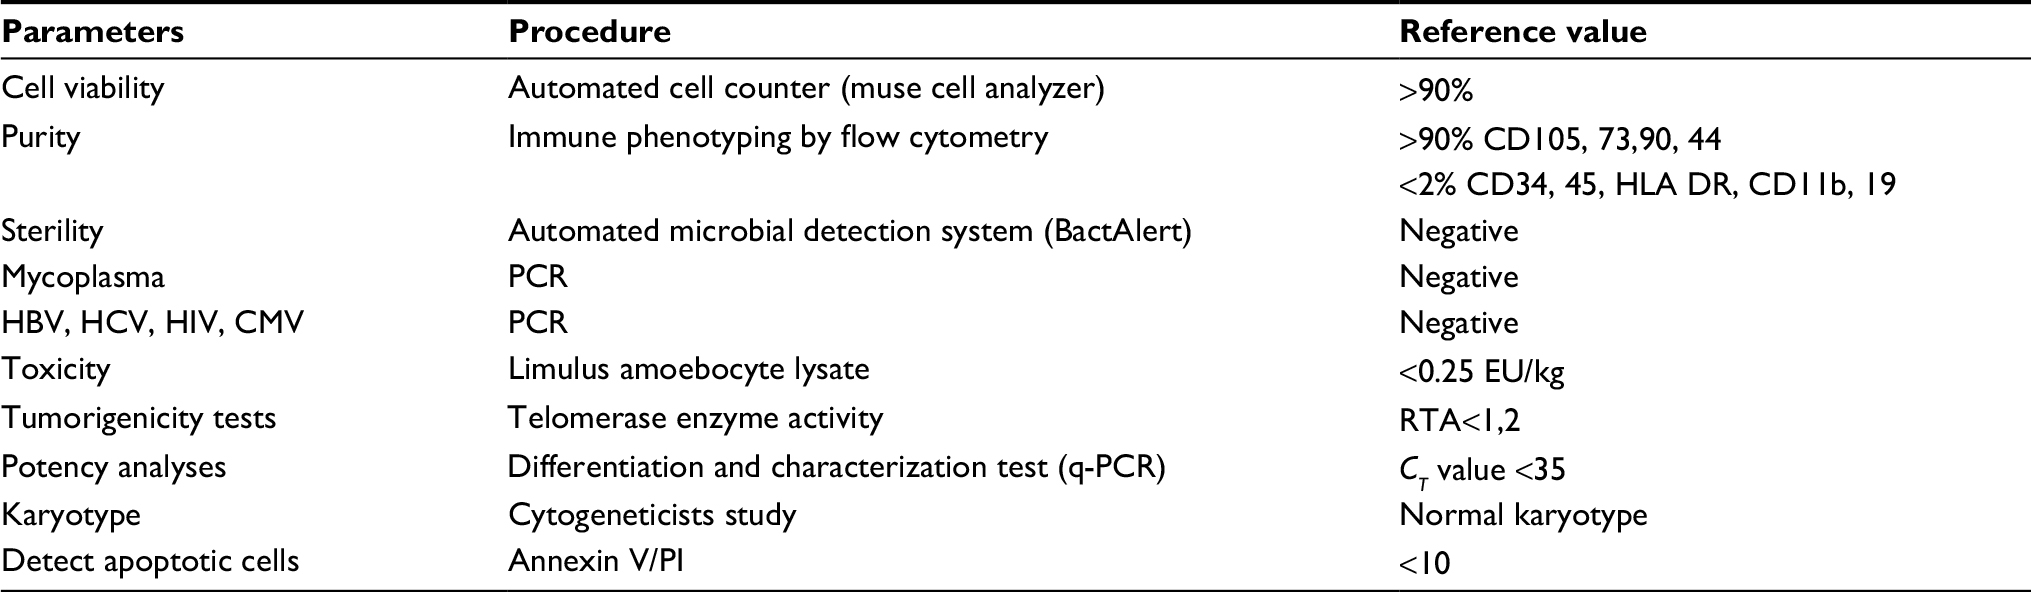 | Table 3 Quality control tests of GMP laboratory and reference value charts Abbreviations: CMV, cytomegalovirus; GMP, good manufacturing practices; HBV, hepatitis B virus; HCV, hepatitis C virus; HIV, human immunodeficiency virus; RTA, relative telomerase activity. |
Cell transplantations
All patients were treated with 2 × 10⁶ cells/kg/dose of allogeneic WJ-MSC therapy. A total of eight cycles of stem cell therapy were given every 2 weeks, for a total of 4 months. Patients received a total of four doses of MSC injection; systemic applications were performed every 2 weeks following multiple intramuscular injections, which are local injections every 2 weeks (Table S1).
Patient follow-up
The efficacy and validity of the treatment were evaluated by various parameters before and after treatment including four phases of testing.
The first phase was clinical scoring based on video recording. Five nonambulatory patients were assessed with gross motor function measurement test. Four ambulatory patients were evaluated with NorthStar ambulatory assessment, rising from the floor, 10-m run test, and 6-minute walk test.
The second phase of testing was muscular strength scoring tests, including electromyography (EMG), Myopinch, Myogrip, and Moviplate which assessed finger, hand, and arm strength. Measurements of scoliosis for each patient were done and compared after therapy was completed. Serum CK levels were also obtained from all patients.
MRI was used in the third phase of testing. Muscle fat fraction was analyzed through sectioning of both upper and lower extremities. Cardiac evaluation was assessed with echocardiography including ejaction fraction (EF) and fraction shortening times. Respiratory function tests were measured both before and after treatment to evaluate respiratory function.
In the fourth phase of the assessments, muscle biopsies were done twice before and after the eighth cycle of the treatment which is the second month after the beginning of treatment. Genetic studies, including real-time PCR for dystrophin, and analysis of cell series were used on muscle biopsy tissue which was collected from vastus lateralis.One of the ways of showing the regenerative effects of stem cells is by demonstrating their potential of fusing with normal muscle cells. This is indicated through the atypical cells pattern of signaling via the FISH method. Those tests were done at the Department of Genetic, at Yıldırım Beyazıt University/Ankara.
Donor–recipient compatibility
Complement-dependent lymphocytotoxin crossmatch test
Donor-specific antibodies in serum samples of DMD patients were measured by Luminex antibody screening and complement-dependent cytotoxicity (CDC) crossmatch after cell infusion. Posttransplant donor-specific CXM was performed by the standard CDC technique. In brief, the donor’s MSCs and patient’s lymphocytes which were isolated from peripheral blood were added and the mixture was incubated at room temperature for 30 minutes. Detection of cytotoxic antibody activities against donor’s stem cells was provided by incubation with rabbit complement for 60 minutes. Lysis of target stem cells was determined by acridine orange exclusion, and more than 20% lysed cell rate was described as positive for CXM test. If the result was positive, the test was repeated after preincubation of the patient’s serum with dithiothreitol (DTT) for 30 minutes. DTT, a reducing agent for immunoglobulin M (IgM) activity, was used for distinguishing immunoglobulin G (IgG) antibodies from the IgM antibody. Accordingly, a negative CXM after DTT reduction demonstrated the presence of IgM antibodies.
Detection of PRA
In addition to CDC assay, human leukocyte antigen (HLA) antibody screening in the sera of patients who underwent cell transplantation was performed by the Luminex-based assay at two different times. Patient sera were first tested for the presence of HLA antibodies with the use of Lifecodes Screen Class I and II (Immucor, Stamford, CT, USA) on a Luminex platform. The patients with positive results from screen test were further tested with the use of Lifecodes Class I/Class II single antigen assay on a Luminex platform according to the manufacturer’s instructions. In brief, multiplexed microbeads, each coated with cloned HLA antigens, were incubated with patient serum for 30 minutes and washed to remove unbound antibody. Antihuman immunoglobulin antibody conjugated to phycoerythrin was added for 30 minutes and washed. The results were analyzed using MAchIt software (Immucor). Levels of normalized mean fluorescence intensity ≥1,000 were positive.
Sample collection
All samples were obtained after informed and written parental consent and under institutionally approved protocols. Before the treatment, muscle biopsies were collected from all patients. Posttreatment sample collections were done at the second month for muscle, 365th and 720th days for blood tests. Muscle biopsies were performed through an incision in the skin using 2 mm Tru-Cut needles. The muscle biopsy was divided into two parts. One was used for histological investigations and the other was transferred to lysis solution (Applied Biosystems) and kept at –20°C. For RNA analysis, the Tissue Tek was trimmed away and the muscle tissue was transferred to the lysis solution.
Gene expression analysis
Total tissue RNA was extracted from muscle biopsy using an RNA isolation kit (High Pure RNA Isolation Kit, Roche, Mannheim, Germany). cDNA was synthesized from total RNA using the Transcriptor High Fidelity cDNA Synthesis Kit (Roche). The expression levels of Dystrophin gene were assessed, and Actin-Beta (b-Actin) was used as a housekeeping gene to normalize RNA expression. Gene expression analyses were performed by using Probe–primer assays (IDs are DMD 113365 and ACTB 143636, Roche Diagnostic as Real-time Ready Catalog Assays). Real-time PCR was performed using the Fast Start Essential DNA Probes Master (Roche) and a Light Cycler 480 Instrument (Roche) in conditions of 95°C for denaturation in 10 minutes, 45 cycles at 95°C for 20 seconds and 60°C for 40 seconds. The mRNA level in each sample was calculated using the “DDCT” (DCT [treated sample] – DCT [untreated sample]) methodology.15 Each experiment was performed in triplicate.
Immunohistochemical detection of dystrophin
The immunostaining protocol described in our group’s previous publication was performed with Dystrophin (RB-9024-RT) antibody for this study.16
FISH method from biopsy tissue sample for detection of X–Y chimerism
In the event of recipient and donor genders being different, it is possible to detect chimerism via the FISH method. In this study, using X and Y chromosome centromeric alpha satellite DNA probes (AneuVysion Multicolor DNA Probe Kit – Abbott Molecular), chimerism existence and its percentage were detected from biopsies of tissues after treatment. These tests were evaluated as double blind; 100 cells were counted from three samples of each case.
Measurement of muscle strength
The maximal isometric strength of extremity knee extenders, knee flexors, hip flexors, shoulder abductors, elbow flexors, and elbow extensors was measured using a Powertrak Hand-Held Dynamometer (JTech Medical, Midvale, UT, USA). The measurements were taken twice, with an interval of 6 months.
EMG
EMG measurements were done according to the manufacturer’s instructions by Neuropack X1/EMG/EP measuring system, MEB-2300. The median nerve sensory action potential amplitude, latency, and sensory conduction velocity were measured before and after the treatment.
Statistical analyses
Results were presented as mean ± SEM. GraphPad Prism 5 software was used for statistical analyses. The data were analyzed by one-way ANOVA with Tukey’s multiple comparison tests. The level of significance was set at P<0.05 for all statistical analyses.
Results
Quality control tests performed for stem cell characterization resulted within reference values. Cell surface marker staining and differentiation experiments results are shown in Figures S1 and S2.
No serious side effects were observed in any of the patients. Patients were monitored and evaluated by physicians on site consistently throughout the study. Childhood Health Assessment Questionnaire was also assessed to get more information for possible side effects. No negative feedback was obtained. Pulmonary function test (FVC and FEV1) showed significant improvements for all patients (Figure 1). EF scores were found lower than the beginning scores for eight of nine patients (Figure 2). A significant decline in values was observed even 1 year after the initial treatment (Figure 3). The average level of CK reduction was 19.09%. There is only one remarkable MRI result from an ambulatory patient, with exon 44 deletion. In this case, a new myoblastic signal activity has been shown in bilateral vastus intermedius muscles in the skeletal muscle (Figure 4). Although there is no stained area observed in pretreatment term, we have observed dystrophin-expressing cells following the MSC treatment by dystrophin staining in muscle biopsies (P<0.05; Figure 4A, B). Additionally, in all patients, the average increase was observed as 20.125% in a dystrophin expression (P<0.01). Electrophysiological assessments of the participants were done by the same person according to recommended protocols. According to EMG results, a statistically significant difference between pre- and posttreatment was found only in the amplitudes of the right and left suralis (Figure S3). The PRA tests were applied after each transplantation. Antibodies in low titers were determined following stem cell treatment in two patients, and antibody expressions were not observed in the rest of the patients (Table 4). Successful outcome after allogeneic WJ-MSC treatment has been associated with donor chimerism by FISH (Figure 7, Table 5). Finally, the participants’ muscle strength measurements were made by the Hand-Held dynamometer; statistically, there was no significant difference between pre- and post-measures (data not shown).
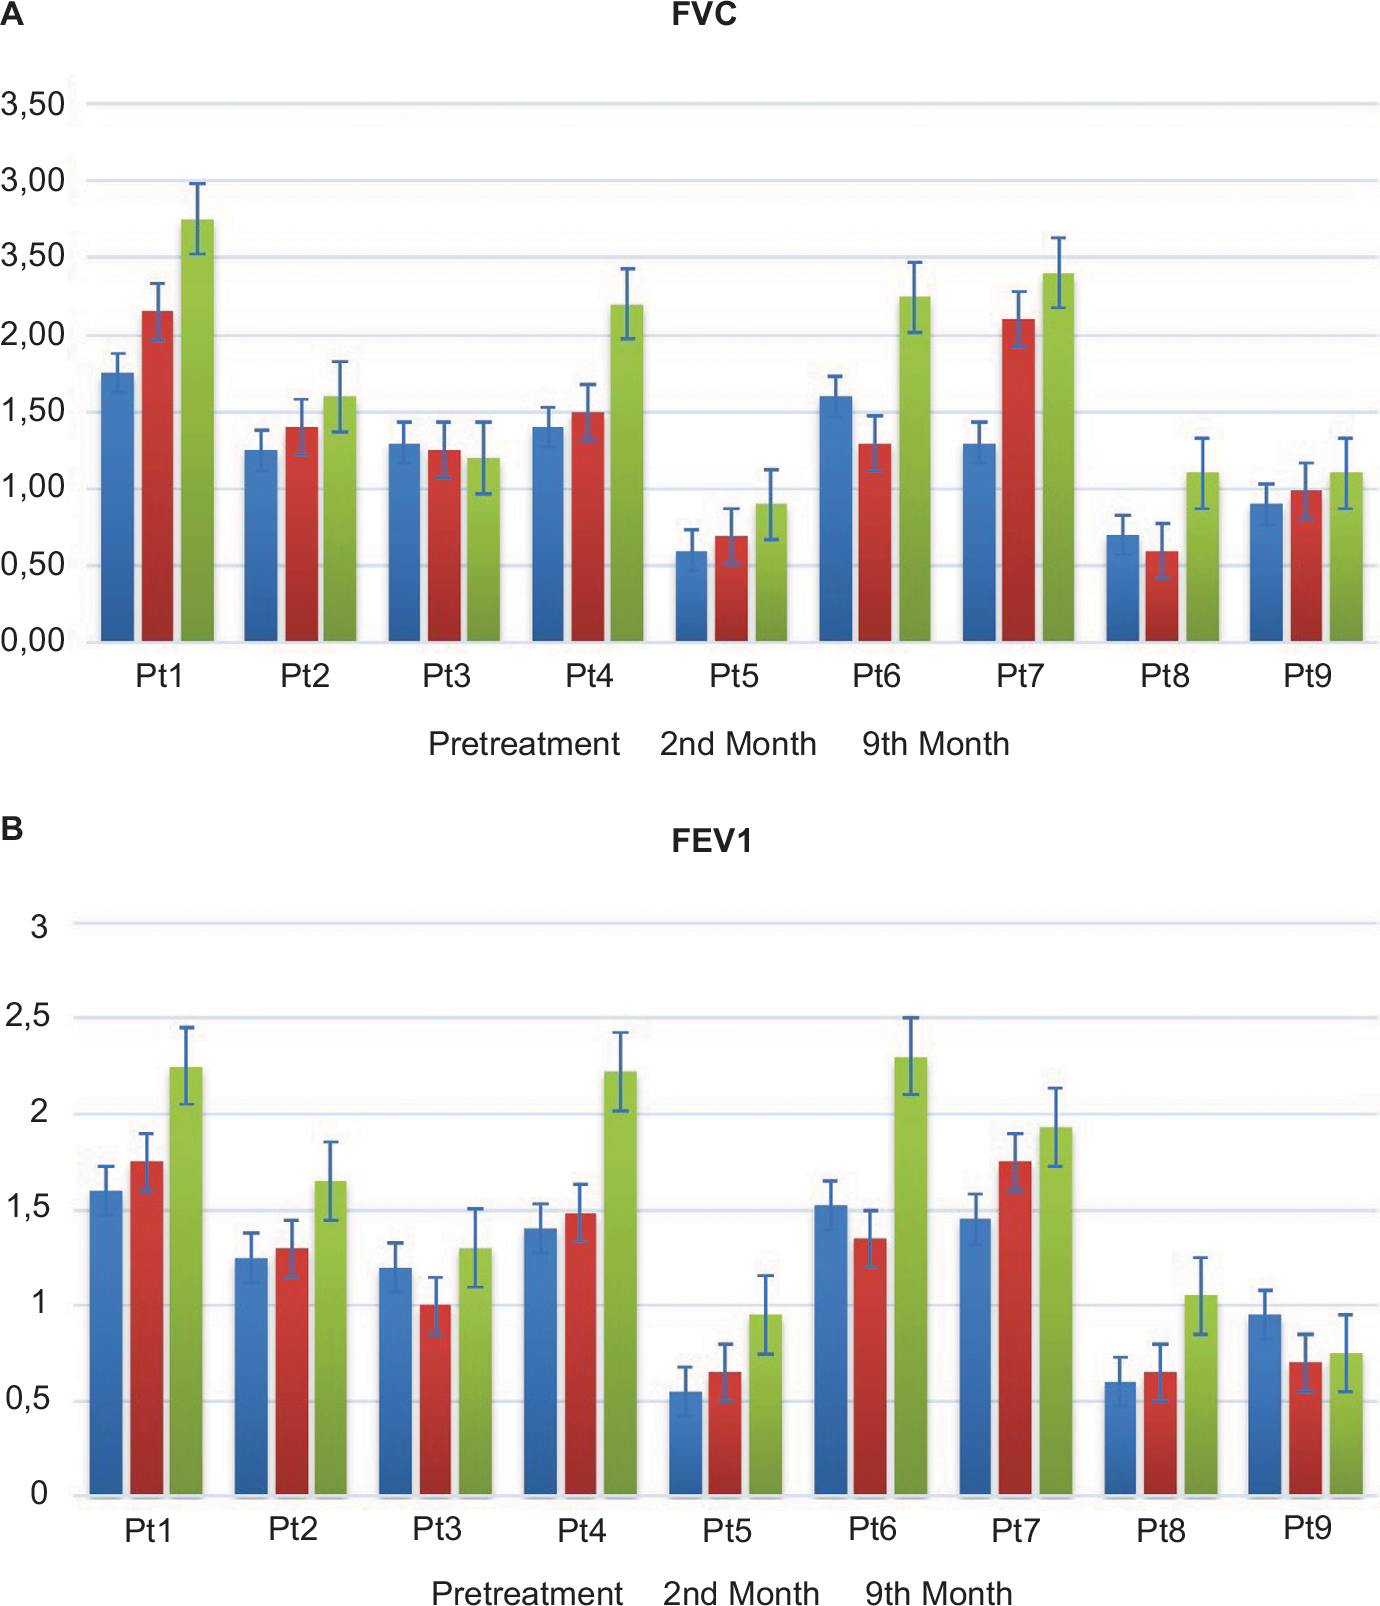 | Figure 1 The result of pulmonary function tests. Notes: (A) Results of the FVC test: first columns (blue) show the pretreatment terms and second columns (red) show the posttreatment terms. (B) Results of the FEV1 test: first columns (blue) show the pretreatment terms and second columns (red) show the posttreatment terms. Abbreviation: Pt, patient. |
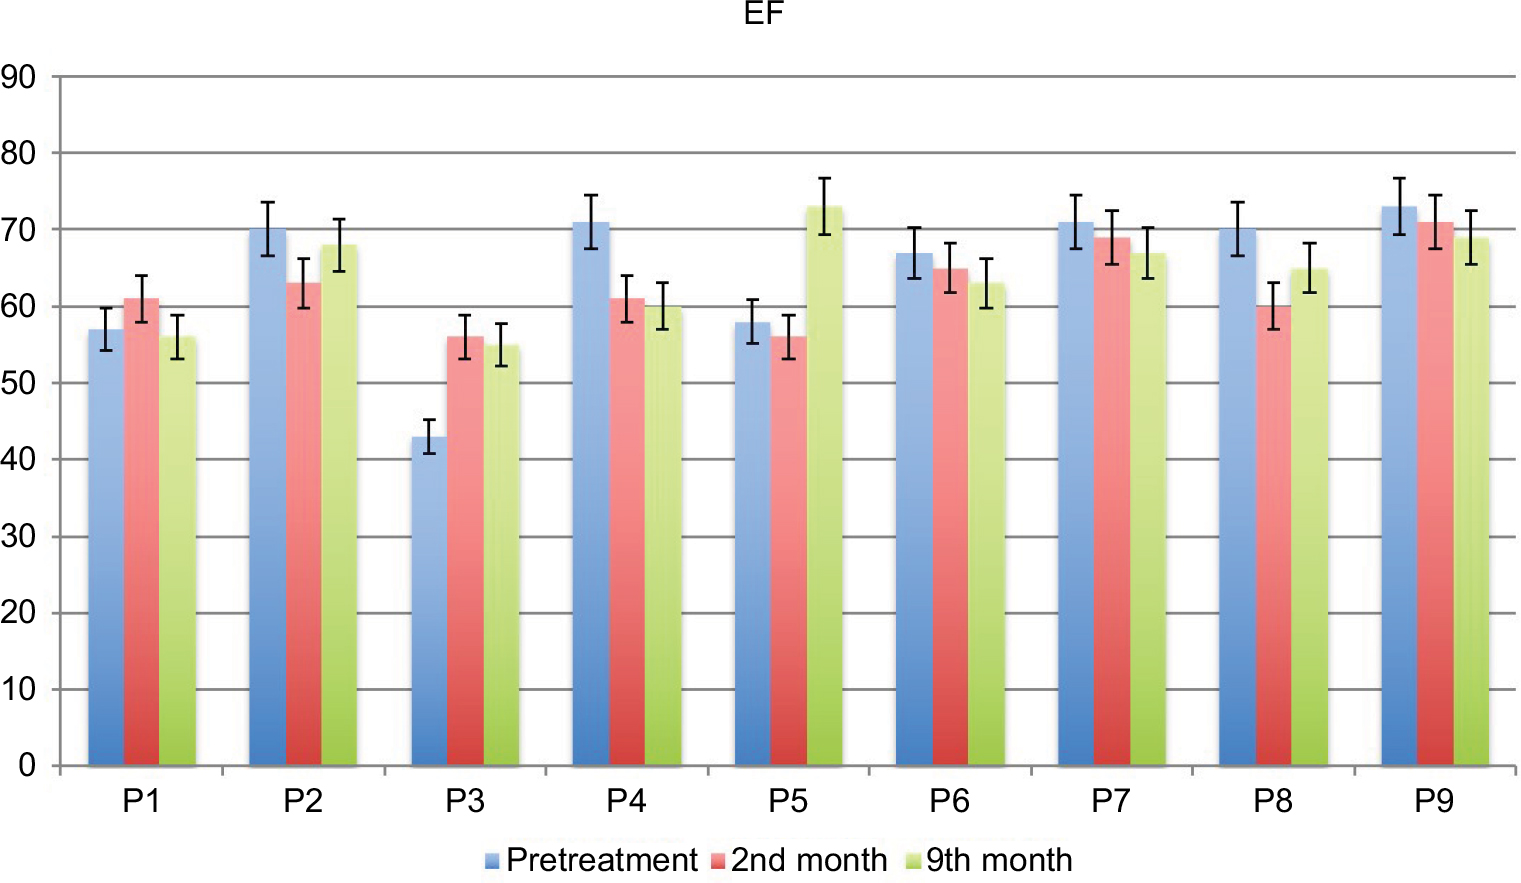 | Figure 2 The percentage of EF results in DMD patients pre- and post-terms of treatment. Abbreviations: DMD, Duchenne muscular dystrophy; EF, ejection fraction; P, patient. |
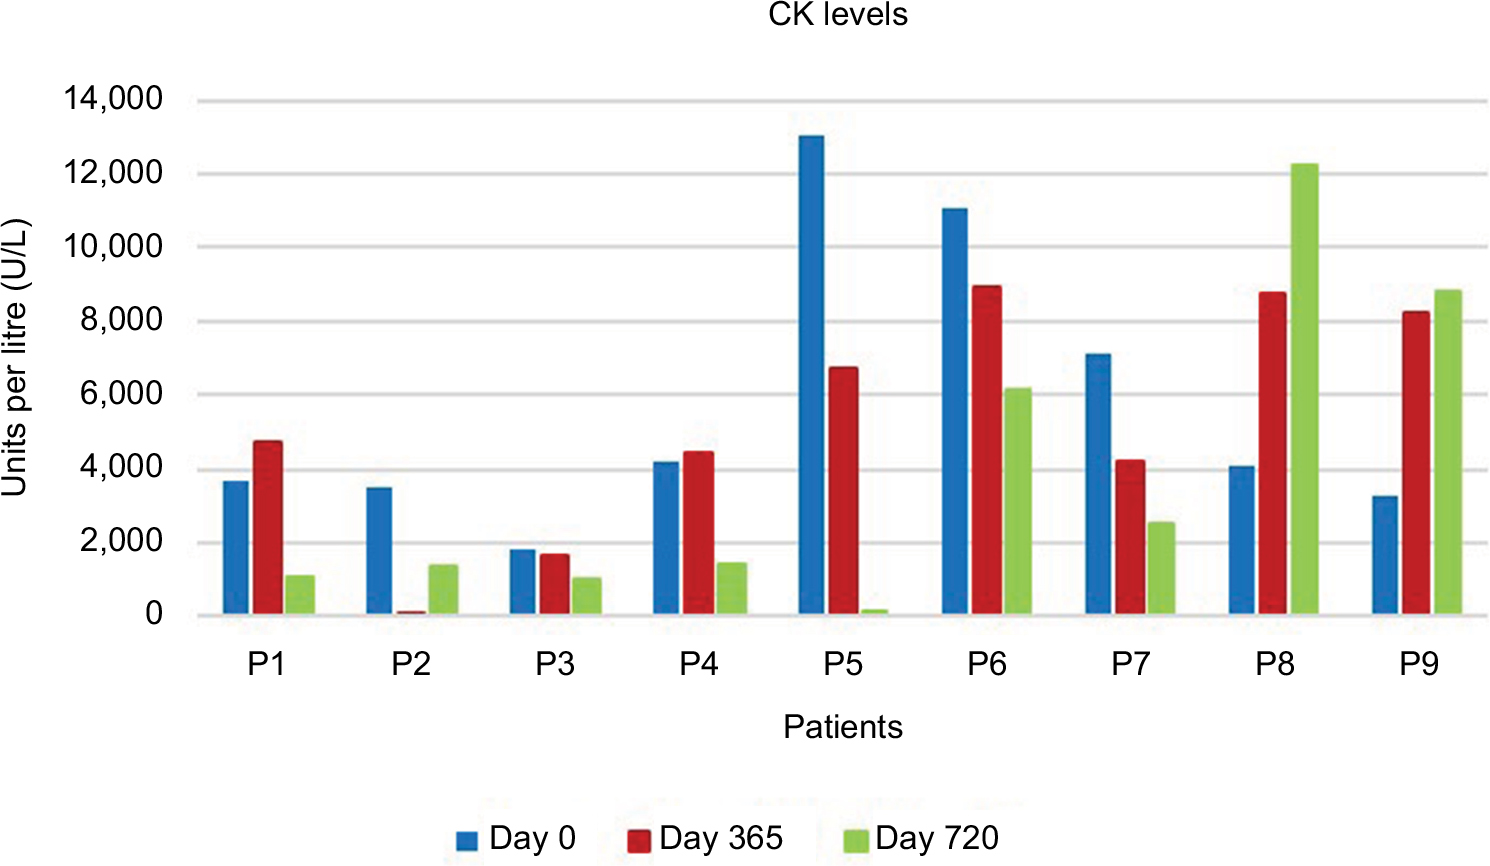 | Figure 3 The results of CK for nine patients after MSC injection. The first columns (blue) show the pretreatment terms and the second columns (red) and the third columns (green) show the first and second year terms after the start of the treatment. Abbreviations: CK, creatine kinase; MSC, mesenchymal stem cell; P, patient. |
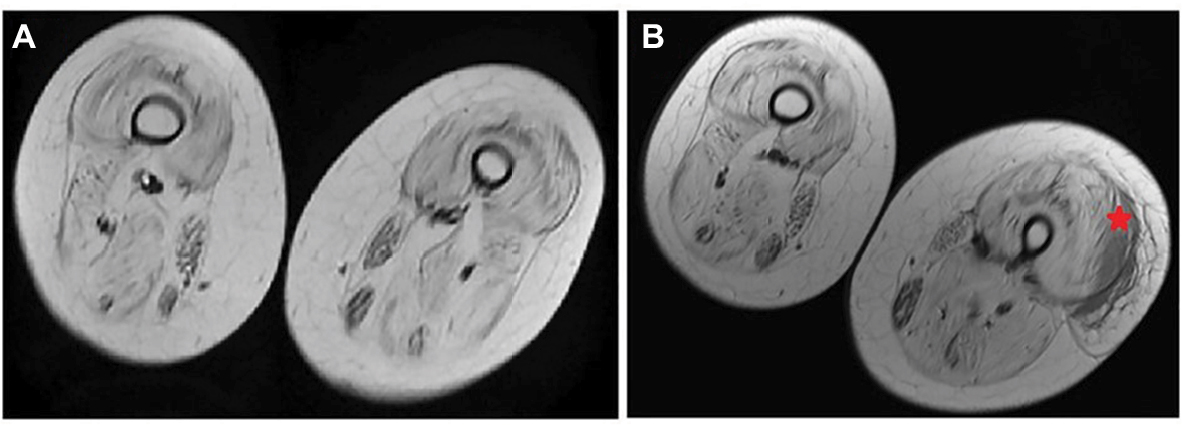 | Figure 4 Radiological findings of T1-weighted MRI of the vastus intermedius muscle in one patient before and after MSC treatment. Note: The star mark indicates the new myoblastic signal activity. Abbreviations: MRI, magnetic resonance imaging; MSC, mesenchymal stem cells. |
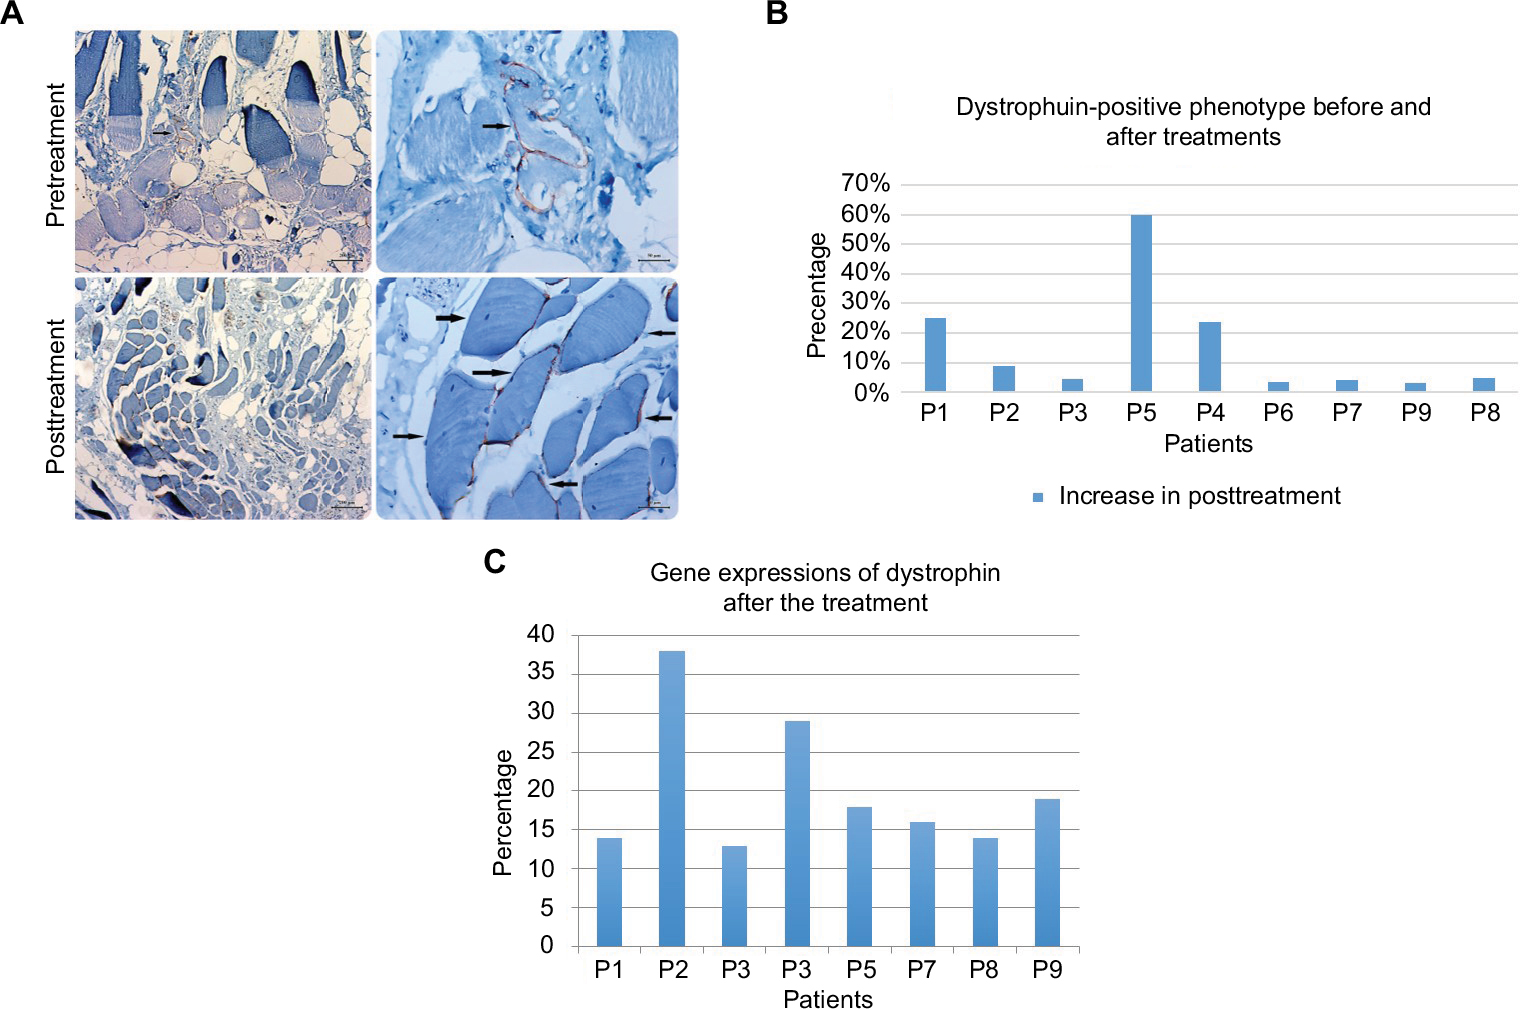 | Figure 5 The restoration of dystrophin. Comparison of immunohistochemistry staining intensity of dystrophin. Notes: The arrows indicate the regenerated muscles. (A) The percentage of muscle fibers that shows dystrophin-positive phenotype cells pre- and post-terms of treatment increased (P<0.05) (B). RT-qPCR analysis indicated the percentage of an increase in dystrophin expression in terms of pre- and posttreatment (C). Abbreviation: P, patient. |
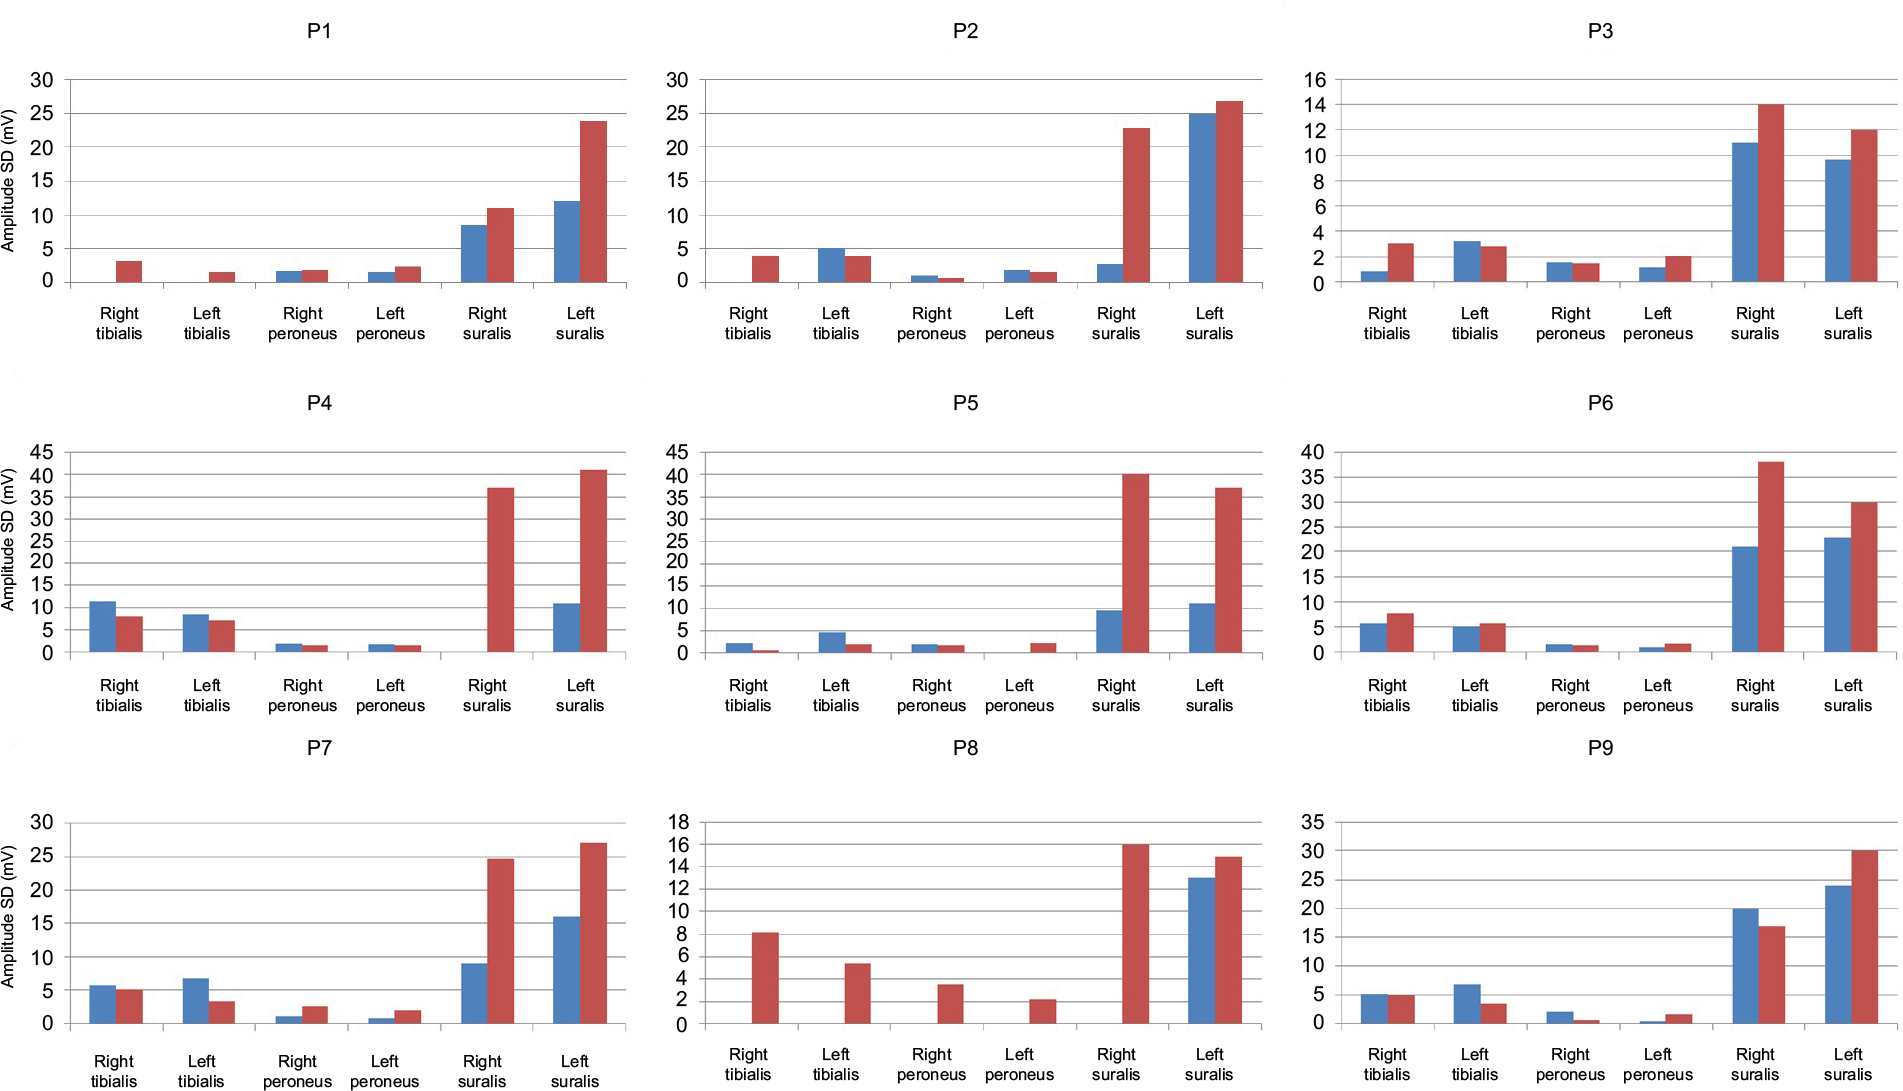 | Figure 6 Amplitude values of pre- and post-terms of treatment according to EMG analysis results. Note: First columns (blue) show the pretreatment terms and second columns (red) show the posttreatment terms. Abbreviations: EMG, electromyography; P, patient. |
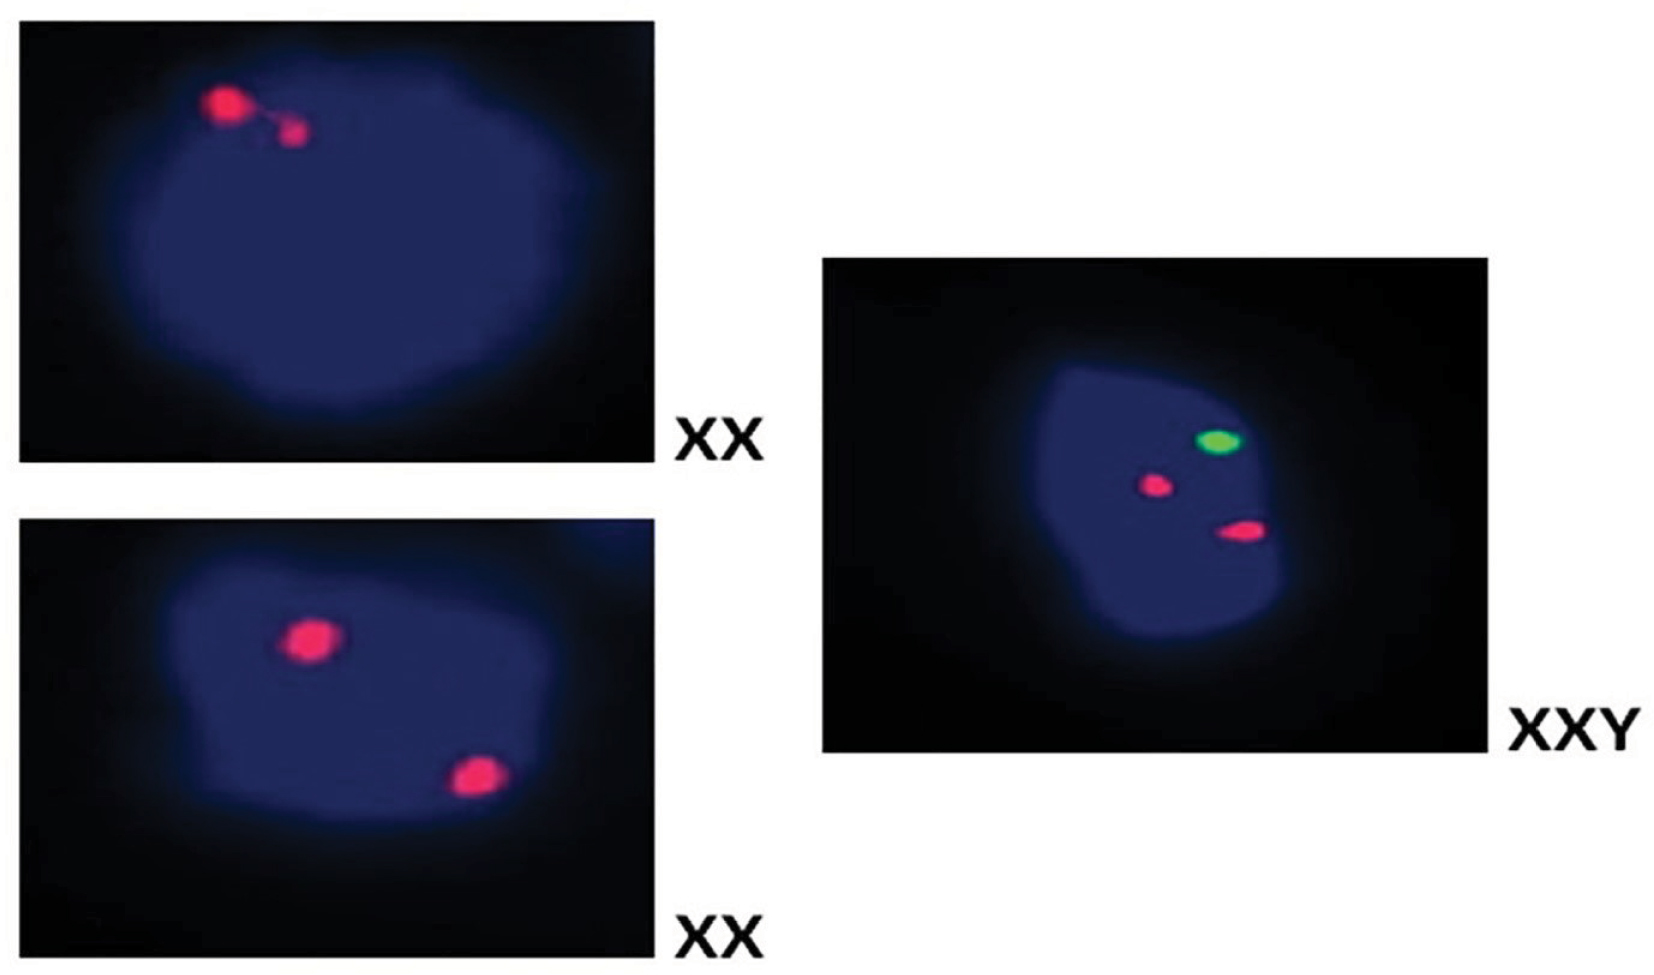 | Figure 7 FISH image that shows the fusion of donor and patient cells after treatment. Abbreviation: FISH, fluorescent in situ hybridization. |
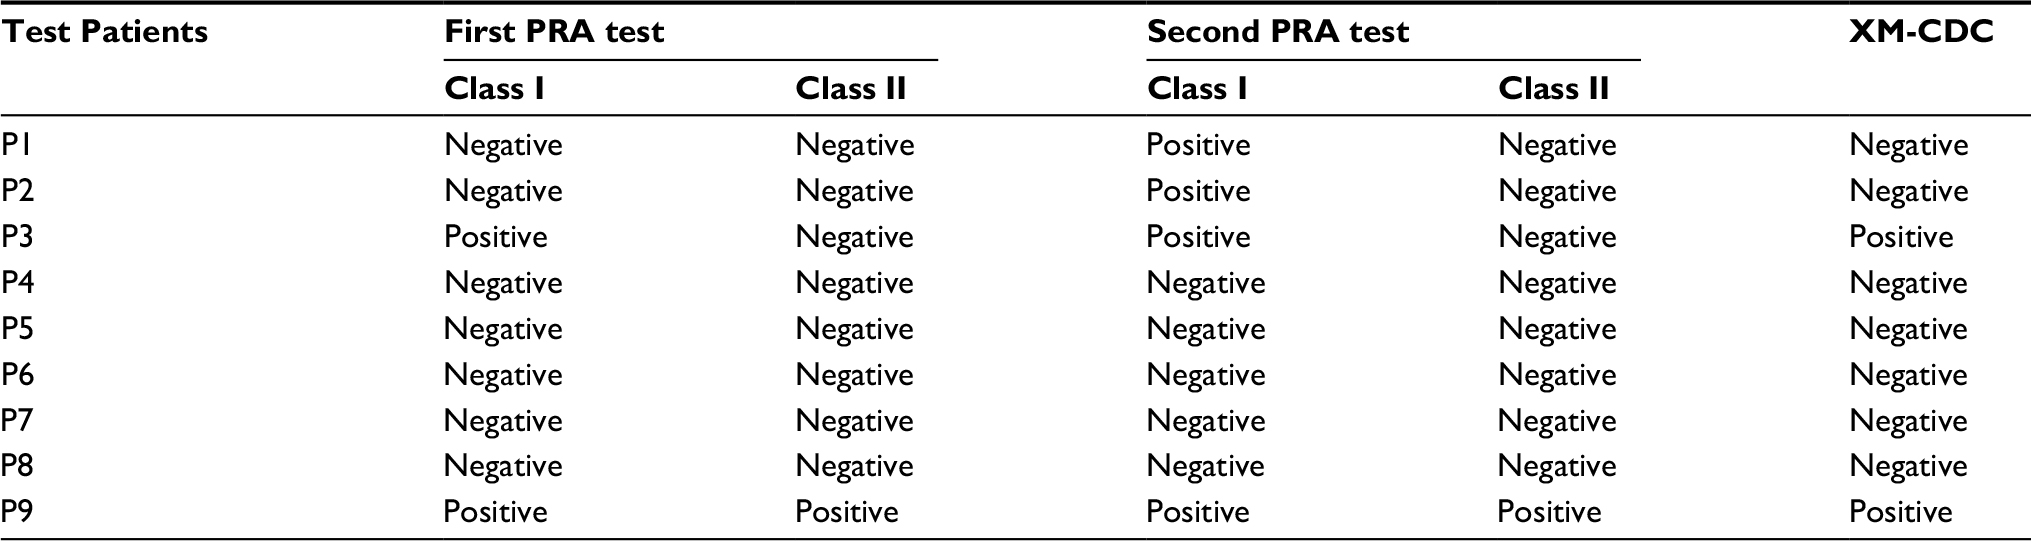 | Table 4 DSA antibody results with CDC, PRA, and single antigens Abbreviations: CDC, complement-dependent cytotoxicity; DSA, donor-specific antibodies; PRA, panel reactive antigen; P, patient. |
 | Table 5 The average number of chimeric and fusion cells in FFPE tissue blocks of biopsy muscle sample FISH studies of patients (based on 100 cell count) Abbreviations: FISH, fluorescent in situ hybridization; P, patient; FFPE, formalin-fixed, paraffin-embedded. |
In addition to the common findings of all patients, the individual patient’s outcome and follow-up results have been given below in detail.
Outcome and follow-up
Patient 1
Based on measurements taken after the first injection, the patient’s FVC had increased up to 23% in the second month and raised to 57% at the end of the ninth month. The FEV1 level had increased up to 9% in the second month and after the ninth month, it raised to 41%. The EF level had increased up to 7% at the end of the second month but it declined down to 1% at the end of the ninth month. At the level of CK, although an increase of 28% was measured at the end of the first year after the beginning of the treatment, a dramatic decrease of 70% was measured at the end of the second year. When we measured changes in the amount of dystrophin after treatment, we found a 25% increase in protein level and a 14% increase in gene expression level. As a result of PRA tests, neither Class I nor Class II antibody expressions were observed. EMG results indicate that amplitudes increased 31% in the right suralis and 100% in the left suralis. FISH results showed six chimeric cells and two fusion cells in 100 cells (Figures 1–7).
Patient 2
After the first injection, patient number 2’s FVC had increased up to 12% in the second month and raised to 28% at the end of the ninth month. Accordingly, the FEV1 level had increased up to 4% and 32% in the same period of FVC. The EF level had dropped down to 10% at the end of the second month and 3% at the end of the ninth month. After the initiation of the treatment, a dramatic reduction of 97% at the end of the first year and 62% at the end of the second year were measured by means of CK levels. Once we measured changes in the amount of dystrophin after treatment, we found a 9% increase in protein level and a 38% increase in gene expression level. According to the PRA tests, neither Class I nor Class II antibody expressions were observed. EMG results indicate amplitudes increased 752% in the right suralis and 8% in the left suralis. FISH results showed eight chimeric cells and one fusion cell in 100 cells (Figures 1–7).
Patient 3
From the initiation of the treatment, respiratory tests were measured. The patient’s FVC had dropped down to 4% in the second month and declined to 7% at the end of the ninth month. The FEV1 level had dropped up to 16% in the second month and after the ninth month it raised to 8%. The EF level had increased up to 30% at the end of the second month and it increased up to 27% at the end of the ninth month. The reductions of 8% at the end of the first year and 44% at the end of the second year were measured in CK levels after the initiation of the treatment. A myoblastic signal activity showed in bilateral vastus intermedius muscles in the skeletal muscle MRI. The amount of dystrophin was increased with 4% increase in protein and 13% increase in the gene expression level. PRA tests showed that the score for Class I was 2.2% and Class II antibody expressions were negative. EMG results indicate that amplitudes increased 27% in the right suralis and 24% in the left suralis. FISH results showed five chimeric cells and two fusion cells in 100 cells (Figures 1–7).
Patient 4
In respect to the respiratory tests, the patient’s FVC had increased up to 7% in the second month and raised to 57% at the end of the ninth month after the first MSC injection. The FEV1 level had increased up to 6% in the second month and after the ninth month it raised to 58%. The EF level had dropped down to 14% at the end of the second month and 15% at the end of the ninth month. Although an increase of 6% was measured for CK level at the end of the first year after the beginning of the treatment, a dramatic decrease of 66% was measured at the end of the second year. We measured changes in the amount of dystrophin after treatment and we found a 60% raise in protein level and a 29% increase in gene expression level. Based on the PRA tests, neither Class I nor Class II antibody expressions were observed. According to the EMG results, the amplitude improved from 0 to 37 in the right suralis and increased 273% in the left suralis. FISH results showed seven chimeric cells and four fusion cells in 100 cells (Figures 1–7).
Patient 5
From the first injection, the patient’s FVC had increased up to 15% in the second month and raised to 50% at the end of the ninth month. The FEV1 level had increased up to 18% in the second month and to 73% at the end of the ninth month. The level of EF had dropped down to 3% at the end of the second month and it increased up to 26% at the end of the ninth month. After the initiation of the treatment, dramatic reductions of 49% at the end of the first year and 99% at the end of the second year were measured in CK levels. By the time we measured changes in the amount of dystrophin after treatment, we found a 24% increase in protein level and an 18% increase in gene expression level. In consequence of PRA tests, neither Class I nor Class II antibody expressions were observed. EMG results indicate that amplitudes increased 326% in the right suralis and 236% in the left suralis. FISH results showed five chimeric cells and two fusion cells in 100 cells (Figures 1–7).
Patient 6
Though the patient’s FVC had dropped down to 18% in the second month, it increased up to 41% at the end of the ninth month after the first injection. The FEV1 had dropped down to 3% at the end of the second month and was 6% at the end of the ninth month. At the CK level, after the initiation of the treatment the reductions of 20% at the end of the first year and 45% at the end of the second year were measured. When we measured changes in the amount of dystrophin protein after treatment, we found an increase of 24%. According to the results of PRA tests, neither Class I nor Class II antibody expressions were observed. EMG results indicate that amplitudes increased 81% in the right suralis and 30% in the left suralis. FISH results showed five chimeric cells and three fusion cells in 100 cells (Figures 1–7).
Patient 7
Depending on the measurements taken after the first injection, the patient’s FVC had increased up to 62% in the second month and to 85% at the end of the ninth month. In parallel to the results of FVC, FEV1 level had increased up to 21% in the second month and after the ninth month it raised to 33%. However, the EF level had declined down to 3% at the end of the second month and 6% at the end of the ninth month. At the CK level, after the initiation of the treatment the reductions of 41% at the end of the first year and 64% at the end of the second year were measured. The amount of dystrophin variations was found 4% higher in protein level and 16% higher in gene expression level compared with pretreatment. According to PRA tests, neither Class I nor Class II antibody expressions were observed. EMG results indicate amplitudes increased 172% in the right suralis and 69% in the left suralis. FISH results showed six chimeric cells and three fusion cells in 100 cells (Figures 1–7).
Patient 8
In spite of the patient’s FVC’s dropping down to 14% in the second month after the first injection, it increased up to 57% at the end of the ninth month. The FEV1 level had increased up to 8% in the second month and after the ninth month it raised dramatically to 75%. The EF level has declined down to 14% at the end of the second month and 7% at the end of the ninth month. Unfortunately, CK level had raised up to 113% at the end of the first year and 197% at the end of the second year. Despite the increase in the CK levels, we still found a 3% increase in protein level and a 14% increase in gene expression level. Neither Class I nor Class II antibody expressions were observed in PRA tests. According to the EMG results, the amplitude improved from 0 to 11 in the right suralis and increased 15% in the left suralis. FISH results showed ten chimeric cells and five fusion cells in 100 cells (Figures 1–7).
Patient 9
From the first injection, the patient’s FVC had increased up to 10% in the second month and to 22% at the end of the ninth month. The FEV1 level had dropped down to 26% in the second month and 21% after the ninth month. The EF level has declined down to 3% at the end of the second month and 5% at the end of the ninth month. Scarcely, CK level has been found raised up to 153% at the end of the first year and 171% at the end of the second year from the initiation of the treatment. Even the changes in the amount of dystrophin after treatment were increased to 5% in protein level and 19% in the gene expression level. In parallel to the CK levels, the PRA score for Class I was 4.3% and Class II was 7.3%. EMG results indicate that amplitudes decreased 15% in the right suralis and increased 25% in the left suralis. FISH results showed nine chimeric cells and five fusion cells in 100 cells (Figures 1–7).
Discussion
Based on the immune privilege property of the MSCs, it is not a situation we expect to develop a reaction in patients with MSC transplant.17 So, 100% compliance was not a benchmark. In the later stages of the treatment, PRA Class I and II antigens have been tested, which is routinely performed on the blood of people awaiting biological tissue transplantation, in our patients’ cohort. In contrast, we have detected antibodies in two of nine patients with tests that we have applied. Normally, MSCs express MHC-1 at low levels and are negative for MHC-2. However, other studies have shown that MSCs exposed to IFN-γ or differentiated into mature cell types can express significantly more MHC Class I and MHC Class II.18 It is obvious that MSCs are not immune privileged completely; MSCs could be worth to be noted as “immune evasive”.19
The immune evasive effects of stem cells are evident when the clinical results are evaluated, especially the levels of CK.19 Zang et al20 showed that the therapy of DMD with allogeneic umbilical cord blood hematopoietic stem cell transplantation may reset up the blood-making function, decrease the serum CK level, restore the dystrophin in muscles, and improve the locomotive function of the pediatric DMD patients. In our study consisting of nine patients, seven patients’ mean CK levels were found as ~3.3-fold low. Two patients who were excluded from the second group were positive for the PRA test, so their clinical data were not significant (Figure S4). In order to avoid this possible immunological response, we have highly advised that it would be more appropriate to select the appropriate MSC donor after assessing the immune-suppressive effect of the MSCs on patient samples with the “Crossmatch” application.21 Following the PRA-positive results in our patients, we have determined the most suitable donor with the crossmatch method that we developed. Thus, we found that our patients had negative for PRA test results. In addition to CK levels of these two PRA-positive patients, there was much less change in the course of the disease than in the patients with PRA negative. Therefore, after observing these two PRA test results, MSC donors have changed for these two patients. Thus, doing these tests before the application is essential for better clinical results and more efficient treatment. In this study, we evaluated MSCs’ potent regeneration capacity due to their paracrine functions, differentiation capabilities, that may have a positive effect on genetic problem via microsomal gene transfer and/or cell-to-cell fusion in four ambulatory and five nonambulatory male patients with DMD.
It is well known that the most important factor in muscle degeneration in DMD is the progressive reduction of dystrophin level.22 In our gene expression study, in eight of nine patients, an increase of up to 38% in a dystrophin expression via real-time PCR method was observed, which is the first time in a patient-oriented clinical serial study. Our immunohistochemical results also supported these results. This regulation could be explained by cellular fusion ability of MSCs with DMD muscle cells or a muscle progenitor. As shown in the FISH result, we observed both XX and XY chromosome sets in an identical cell. XX is referred as MSC donor’s chromosome set and XY is referred as host’s set. This cellular fusion can be explained by the ability of exosomes to fuse with the plasma membrane of recipient cells to modulate gene expression, cell phenotypes, and represent mRNA /miRNA.23
Respiratory failure is a major contributor to immobility and mortality in progressive muscular dystrophies.24 The follow-up of respiratory function is important for predicting the prognosis.25,26 According to our findings, there is no sign of remission in terms of respiratory functions. Thus, we investigate that MSC treatment has stopped the progression of the disease. More recently, Kim et al indicated that serum CK level is a reliable screening test even in patients with advanced DMD and is a strong predictor of pulmonary functions.26 This study has also supported our findings.
Cardiomyopathy is prominent in DMD patients and contributes significantly to mortality. This is particularly true following respiratory interventions that reduce death rate and increase ambulation and consequently cardiac load. Cardiomyopathy shows an increasing prevalence with age and disease progression, and >95% of patients exhibit dilated cardiomyopathy by the time they reach adulthood.27 EF scores were found lower than the beginning scores in eight of nine patients. One patient with insufficient cardiac result has shown increased EF time after receiving intra-coronary WJ-MSC treatment.
Muscle MRI has been used for the detection of qualitative assessment for muscle changes.28 Only one patient (patient number 3) has shown remarkable new myoblastic signal activity noted in bilateral vastus intermedius muscles. This result also supported that MSCs have a potential to regenerate the injured muscle tissues and turn into muscle fibers as promising candidates for stem cell therapy to treat DMD.
In the quantitative analysis of muscle strength, hand-held dynamometer measurements did not show a significant difference, but amplitude values were found to increase in EMG results. A significant increase in the amplitude value indicating that the muscle develops is promising.
Traditional spirometric parameters such as FVC and FEV1 are global indexes of the respiratory function. Values >80% of their ratio (FEV1/FVC), the Tiffeneau index, can indicate the presence of restrictive lung disease. The diagnosis has to be confirmed by reduced values of total lung capacity (TLC). A drop in FVC (>20%), when the patient goes from sitting to supine position, is a more specific sign of diaphragmatic weakness.29
TLC, functional residual capacity, and residual volume are absolute lung volumes that cannot be measured by simple spirometry. They require either a nitrogen washout technique or body plethysmography. Wheelchair-bound DMD patients can meet great difficulties in entering a body plethysmograph.2
Conclusion
In conclusion, all our procedures were well tolerated by our patients. Parallel to this, we have not seen any application-related complications so far. Although patients’ life quality was increased in the first year, this positive progress decreased over time. Therefore, additional doses were required. We believe that we decelerated the progression of this untreatable disorder.
Acknowledgments
We thank Vasıf Haftacı from Isparta City Hospital for technical support and comments that greatly improved the manuscript. Moreover, we would like to thank Bahadır Edizer from Gaziantep University, Faculty of Medicine, for his support during the project. Also, we thank Liv Hospital that sponsored this research.
Author contributions
All authors contributed toward data analysis, drafting, and revising the paper and agree to be accountable for all aspects of the work.
Disclosure
The authors report no conflicts of interest in this work.
References
Sienkiewicz D, Kulak W, Okurowska-Zawada B, Paszko-Patej G, Kawnik K. Duchenne muscular dystrophy: current cell therapies. Ther Adv Neurol Disord. 2015;8(4):166–177. | ||
Lomauro A, D’Angelo MG, Aliverti A. Assessment and management of respiratory function in patients with Duchenne muscular dystrophy: current and emerging options. Ther Clin Risk Manag. 2015;11:1475–1488. | ||
Ichim TE, Alexandrescu DT, Solano F, et al. Mesenchymal stem cells as anti-inflammatories: implications for treatment of Duchenne muscular dystrophy. Cell Immunol. 2010;260(2):75–82. | ||
Mao AS, Mooney DJ. Regenerative medicine: current therapies and future directions. Proc Natl Acad Sci USA. 2015;112(47):14452–14459. | ||
He S, Nakada D, Morrison SJ. Mechanisms of stem cell self-renewal. Annu Rev Cell Dev Biol. 2009;25:377–406. | ||
Adas G, Koc B, Adas M, et al. Effects of mesenchymal stem cells and VEGF on liver regeneration following major resection. Langenbecks Arch Surg. 2016;401(5):725–740. | ||
Karaöz E, Çetinalp Demircan P, Erman G, Güngörürler E, Eker Sarıboyacı A. Comparative analyses of immunosuppressive characteristics of bone-marrow, Wharton’s Jelly, and adipose tissue-derived human mesenchymal stem cells. Turk J Haematol. 2017;34(3):213–225. | ||
Sun H, Bénardais K, Stanslowsky N, et al. Therapeutic potential of mesenchymal stromal cells and MSC conditioned medium in amyotrophic lateral sclerosis (ALS)--in vitro evidence from primary motor neuron cultures, NSC-34 cells, astrocytes and microglia. PLoS One. 2013;8(9):e72926. | ||
Meregalli M, Farini A, Colleoni F, Cassinelli L, Torrente Y. The role of stem cells in muscular dystrophies. Curr Gene Ther. 2012;12(3):192–205. | ||
Kern S, Eichler H, Stoeve J, Klüter H, Bieback K. Comparative analysis of mesenchymal stem cells from bone marrow, umbilical cord blood, or adipose tissue. Stem Cells. 2006;24(5):1294–1301. | ||
Wang Q, Yang Q, Wang Z, et al. Comparative analysis of human mesenchymal stem cells from fetal-bone marrow, adipose tissue, and Wharton’s jelly as sources of cell immunomodulatory therapy. Hum Vaccin Immunother. 2016;12(1):85–96. | ||
Kwon S, Ki SM, Park SE, et al. Anti-apoptotic effects of human Wharton’s jelly-derived mesenchymal stem cells on skeletal muscle cells mediated via secretion of XCL1. Mol Ther. 2016;24(9):1550–1560. | ||
Hamidian Jahromi S, Estrada C, Li Y, Cheng E, Davies JE. Human umbilical cord perivascular cells and human bone marrow mesenchymal stromal cells transplanted intramuscularly respond to a distant source of inflammation. Stem Cells Dev. 2018;27(6):415–429. | ||
das AK, Bin Abdullah BJ, Dhillon SS, Vijanari A, Anoop CH, Gupta PK. Intra-arterial allogeneic mesenchymal stem cells for critical limb ischemia are safe and efficacious: report of a phase I study. World J Surg. 2013;37(4):915–922. | ||
Livak KJ, Schmittgen TD. Analysis of relative gene expression data using real-time quantitative PCR and the 2(-Delta DeltaC(T)) method. Methods. 2001;25(4):402–408. | ||
Karaöz E, Doğan BN, Aksoy A, et al. Isolation and in vitro characterisation of dental pulp stem cells from natal teeth. Histochem Cell Biol. 2010;133(1):95–112. | ||
Ichiryu N, Fairchild PJ. Immune privilege of stem cells. Methods Mol Biol. 2013;1029:1–16. | ||
Le Blanc K, Tammik C, Rosendahl K, Zetterberg E, Ringdén O. HLA expression and immunologic properties of differentiated and undifferentiated mesenchymal stem cells. Exp Hematol. 2003;31(10):90–896. | ||
Ankrum JA, Ong JF, Karp JM. Mesenchymal stem cells: immune evasive, not immune privileged. Nat Biotechnol. 2014;32(3):252–260. | ||
Zhang C, Feng HY, Huang SL, et al. [Therapy of Duchenne muscular dystrophy with umbilical cord blood stem cell transplantation]. Zhonghua Yi Xue Yi Chuan Xue Za Zhi. 2005;22(4):399–405. | ||
Koktathong K, Vejbaesya S, Bejrachandra S, Pattanapanyasat K. Flow cytometric crossmatch for kidney transplantation. J Med Assoc Thai. 2005;88(6):769–774. | ||
Mariol MC, Ségalat L. Muscular degeneration in the absence of dystrophin is a calcium-dependent process. Curr Biol. 2001;11(21):1691–1694. | ||
Consalvi S, Sandoná M, Saccone V. Epigenetic reprogramming of muscle progenitors: inspiration for clinical therapies. Stem Cells Int. 2016;2016:6093601–11. | ||
Kuru S. Respiratory management in muscular dystrophies. Brain Nerve. 2011;63(11):1229–1236. | ||
Bang TS, Choi WH, Kim SH, et al. Analysis of pulmonary function test in Korean patients with Duchenne muscular dystrophy: comparison of foreign and Korean reference data. Ann Rehabil Med. 2016;40(5):851–861. | ||
Kim EY, Lee JW, Suh MR, et al. Correlation of serum creatine kinase level with pulmonary function in Duchenne muscular dystrophy. Ann Rehabil Med. 2017;41(2):306–312. | ||
Johnstone VP, Viola HM, Hool LC. Dystrophic cardiomyopathy-potential role of calcium in pathogenesis, treatment and novel therapies. Genes. 2017;8(4):108. | ||
Polavarapu K, Manjunath M, Preethish-Kumar V, et al. Muscle MRI in Duchenne muscular dystrophy: evidence of a distinctive pattern. Neuromuscul Disord. 2016;26(11):768–774. | ||
Fromageot C, Lofaso F, Annane D, et al. Supine fall in lung volumes in the assessment of diaphragmatic weakness in neuromuscular disorders. Arch Phys Med Rehabil. 2001;82(1):123–128. |
Supplementary materials
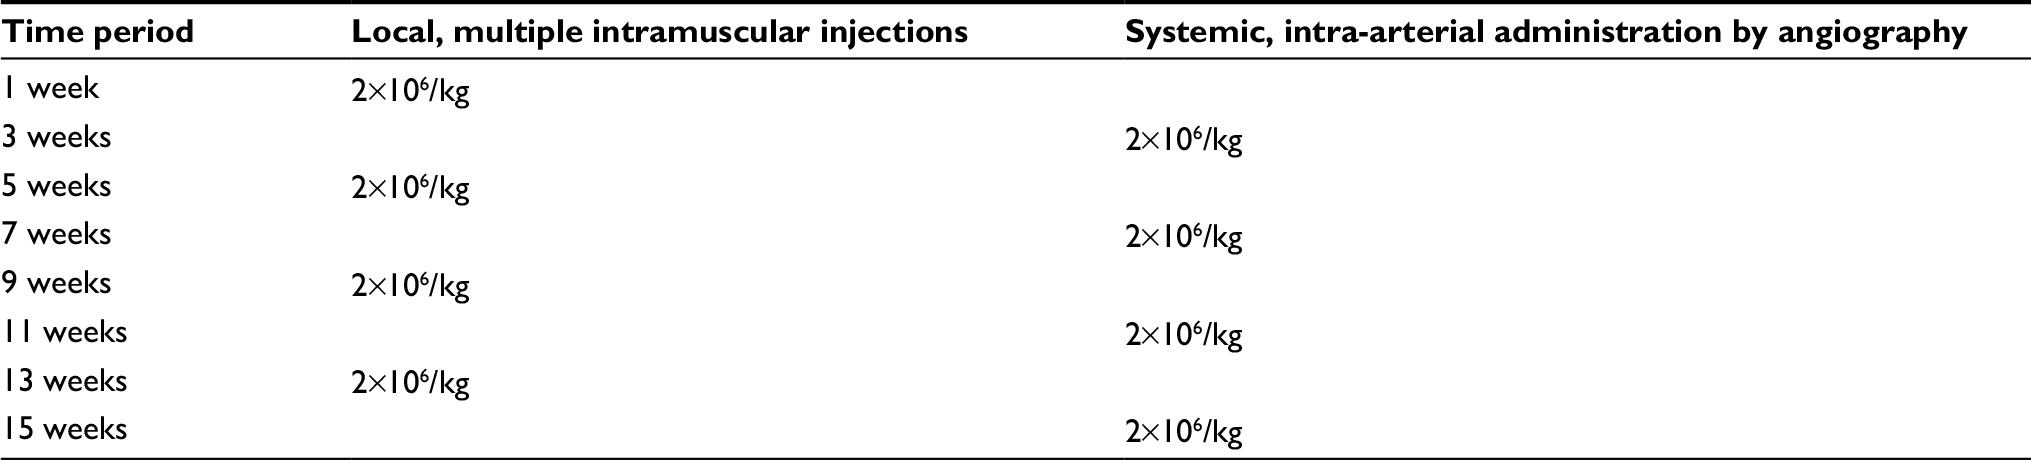 | Table S1 Cycle of stem cell therapy administration |
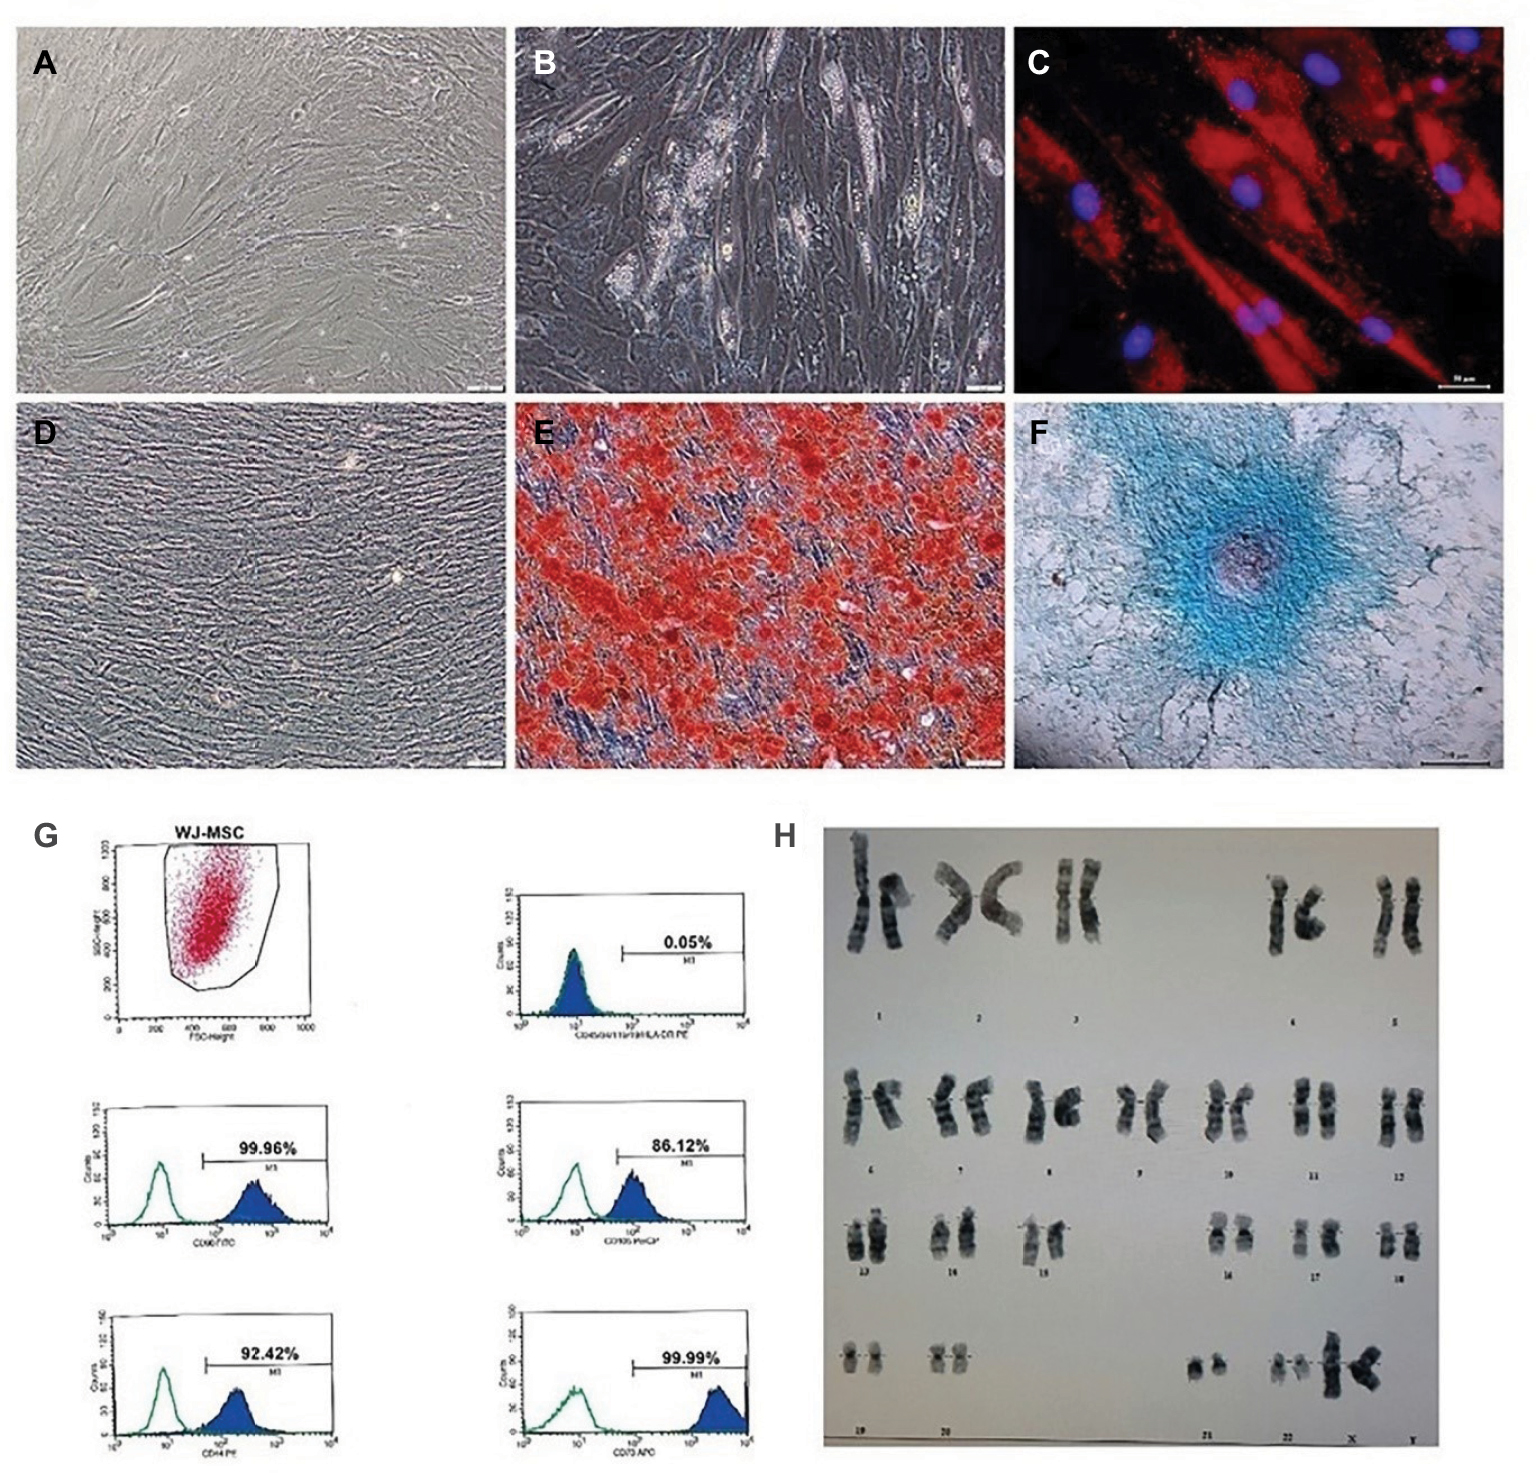 | Figure S1 Differentiation of WJ-MSCs into different cell types. Notes: Adipogenic differentiation of all WJ-MSC from donors was demonstrated by immunofluorescence with oil red (dapi: blue, oil red o: red) (A–C). Osteogenic differentiation of all WJ-MSC from donors was performed by Alizarin red staining (D, E). Chondrogenic differentiation of all WJ-MSC from donors was demonstrated by alcian blue staining (F). (G) Flow cytometry analysis of cell-surface markers in WJ-MSCs at P3. WJ-MSCs expressed MSC markers including CD90, CD105, CD44 and CD73; but not CD45, CD34, CD11b, CD19, HLA-DR. (H) Giemsa-banding karyogram of WJ-MSCs at P3. Normal female (46,XX) karyotypes are shown in the test result. Abbreviation: WJ-MSC, Wharton jelly-derived mesenchymal stem cells. |
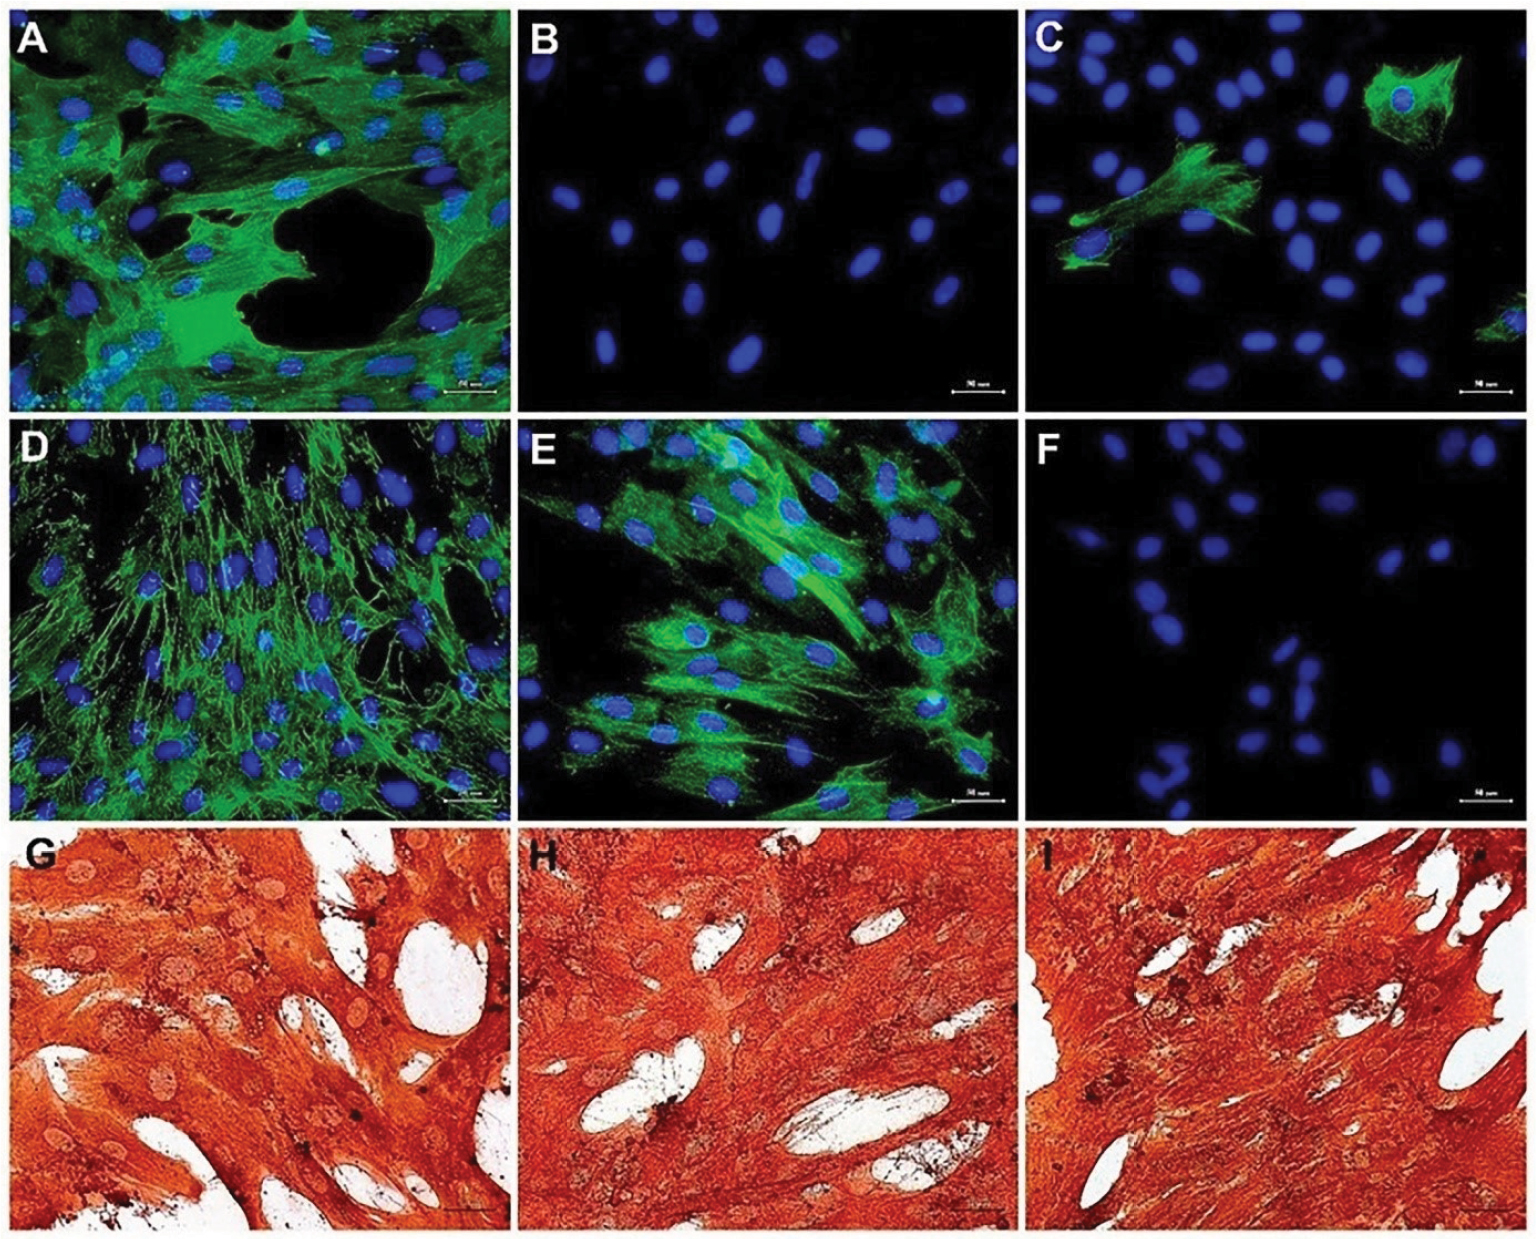 | Figure S2 Immunophenotype of cultured WJ-MSCs. Studies based on immunoperoxidase reactivity were performed with passage 3 cultures of WJ-MSCs. Notes: Representative staining patterns are shown for ASMA (A), CD34 (B), DESMIN (C), Fibronectin (D), NESTIN (E), CD45 (F), CD105 (G), CD44 (H), and Vimentin (I). Nuclei were counterstained with hematoxylin (Scale bars: 50 µm). Abbreviation: WJ-MSC, Wharton jelly-derived mesenchymal stem cells; ASMA, Alfa Smooth Muscle Actin. |
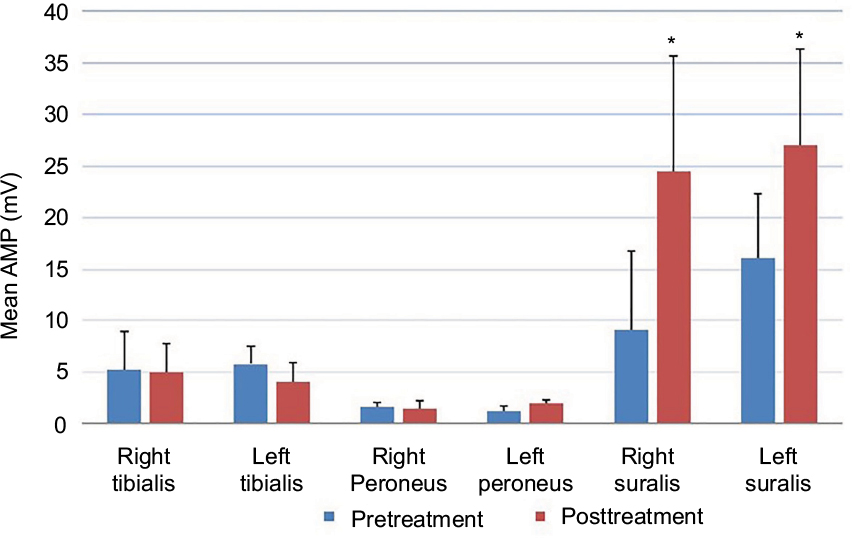 | Figure S3 AMP values of pre- and post-terms of treatment according to EMG analysis results. Notes: First columns (blue) show the pretreatment terms and second columns (red) show the posttreatment terms. Significant differences in right suralis and left suralis were detected (*P<0.05). Abbreviations: AMP, amplitude; EMG, electromyography. |
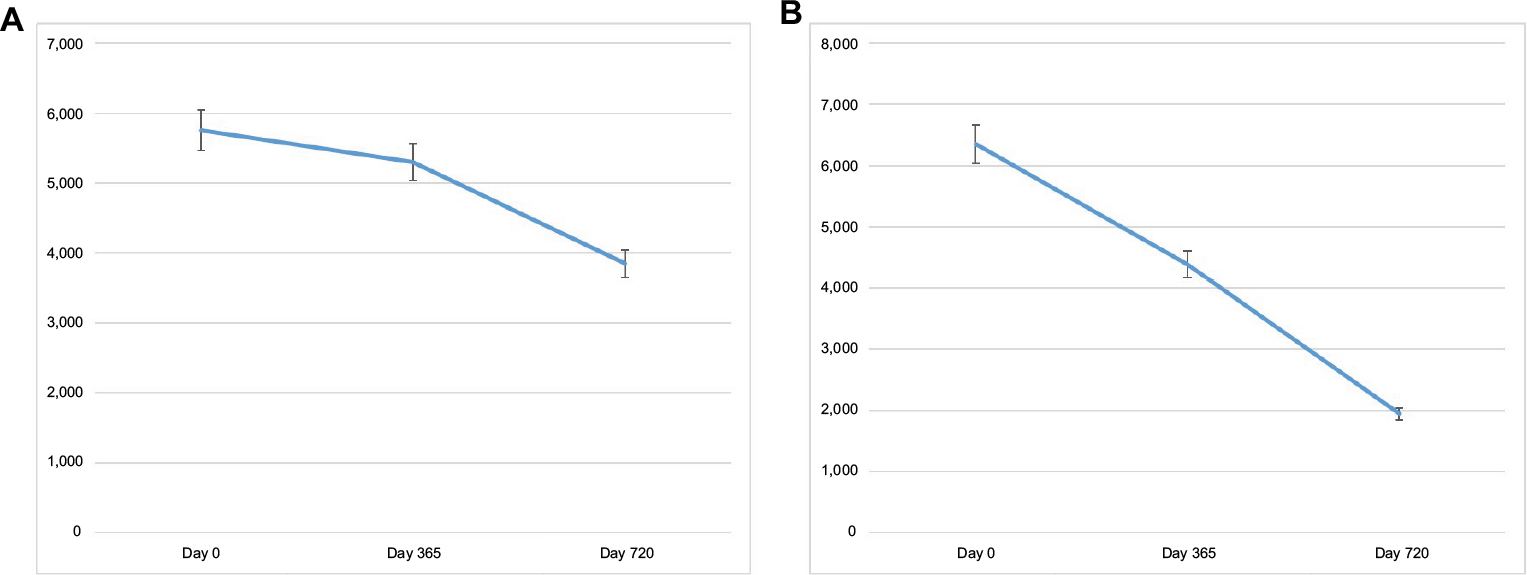 | Figure S4 The mean level of CK in nine patients with DMD after MSC injection (A). Mean level of CK in seven patients with DMD after MSC injection (B). Abbreviations: CK, creatine kinase; DMD, Duchenne muscular dystrophy; MSC, mesenchymal stem cells. |
 © 2018 The Author(s). This work is published and licensed by Dove Medical Press Limited. The full terms of this license are available at https://www.dovepress.com/terms.php and incorporate the Creative Commons Attribution - Non Commercial (unported, v3.0) License.
By accessing the work you hereby accept the Terms. Non-commercial uses of the work are permitted without any further permission from Dove Medical Press Limited, provided the work is properly attributed. For permission for commercial use of this work, please see paragraphs 4.2 and 5 of our Terms.
© 2018 The Author(s). This work is published and licensed by Dove Medical Press Limited. The full terms of this license are available at https://www.dovepress.com/terms.php and incorporate the Creative Commons Attribution - Non Commercial (unported, v3.0) License.
By accessing the work you hereby accept the Terms. Non-commercial uses of the work are permitted without any further permission from Dove Medical Press Limited, provided the work is properly attributed. For permission for commercial use of this work, please see paragraphs 4.2 and 5 of our Terms.