")
Back to Journals » Cancer Management and Research » Volume 13
Efficacy and Safety of Individualized Schedule of Sunitinib by Drug Monitoring in Patients with Metastatic Renal Cell Carcinoma
Authors Zhu X, Zhang X, Sun G, Liu Z , Zhang H, Yang Y, Ni Y, Dai J, Zhu S, Chen J, Zhao J , Wang Z, Zeng H , Shen P
Received 3 July 2021
Accepted for publication 17 August 2021
Published 31 August 2021 Volume 2021:13 Pages 6833—6845
DOI https://doi.org/10.2147/CMAR.S327029
Checked for plagiarism Yes
Review by Single anonymous peer review
Peer reviewer comments 2
Editor who approved publication: Professor Kattesh Katti
Xudong Zhu,1,2,* Xingming Zhang,1,2,* Guangxi Sun,1,2,* Zhenhua Liu,1,2,* Haoran Zhang,1,2 Yaojing Yang,1,2 Yuchao Ni,1,2 Jindong Dai,1,2 Sha Zhu,1,2 Junru Chen,1,2 Jinge Zhao,1,2 Zhipeng Wang,1,2 Hao Zeng,1,2 Pengfei Shen1,2
1Department of Urology, West China Hospital, Sichuan University, Chengdu, 610041, People’s Republic of China; 2Institute of Urology, West China Hospital, Sichuan University, Chengdu, 610041, People’s Republic of China
*These authors contributed equally to this work
Correspondence: Pengfei Shen
Department of Urology, West China Hospital, Sichuan University, No. 37 Guoxue Xiang, Chengdu, 610041, Sichuan, People’s Republic of China
Email [email protected]
Hao Zeng
Department of Urology, West China Hospital, Sichuan University, No. 37 Guoxue Xiang, Chengdu, 610041, Sichuan, People’s Republic of China
Email [email protected]
Purpose: To investigate the survival benefit and safety of individualized schedules for sunitinib in patients with metastatic renal cell carcinoma (mRCC) through plasma concentration monitoring.
Methods: A total of 105 patients with mRCC were enrolled. The schedule was adjusted in two ways: therapeutic drug monitoring (TDM) and toxicity-adjusted schedule (TAS). One group of patients were without any schedule adjustment (maintained schedule, MAS). Progression-free survival (PFS), overall survival (OS), tumor response, and adverse events (AEs) were compared. The relationship between AEs and steady-state concentration or consecutive monitoring curves was explored. Further monitoring of individualized schedules was also conducted.
Results: Based on the plasma concentration, the schedules of 18 patients were adjusted in the TDM group. The schedules were adjusted in 37 patients due to severe AEs in the TAS group, while 50 patients were without any schedule adjustment. The median PFS and OS were better in the TDM group than the other two groups (p = 0.001 and p = 0.004, respectively). Univariate and multivariate analyses indicated that TDM could decrease the risk of death independently (p = 0.026). Moreover, the incidence of grades 3/4 AEs decreased from 88.9% to 33.3% in the TDM group (p = 0.001). Sunitinib concentration in 150– 200ng/mL was regarded as a “transitional zone” due to severe AEs mainly happened when concentration elevated over it. After TDM, further plasma concentration monitoring indicated that individualized schedules enabled sunitinib concentration to fluctuate in a much safer range.
Conclusion: Treatment-related toxicities could be minimized through plasma concentration monitoring. Patients with adjusted schedules by therapeutic drug monitoring could achieve better survival benefits.
Keywords: sunitinib, plasma concentration, metastatic renal cell carcinoma, individualized schedule adjustment, clinical outcomes
Introduction
Sunitinib is an oral multi-targeted inhibitor of tyrosine kinases, including vascular endothelial growth factor receptor (VEGFR) and platelet-derived growth factor receptor (PDGFR).1 Although immune checkpoint inhibitor-based combination therapy has become standard of care for patients with metastatic renal cell carcinoma (mRCC), sunitinib is still recommended as the first-line therapy, especially in patients with favorable International mRCC Database Consortium (IMDC)/Memorial Sloan Kettering Cancer Center (MSKCC) risk.2 However, it showed that up to 38% of patients had drug interruption due to intolerance of the recommended dosage schedule (50mg per day, 4 weeks on/2 weeks off, 4/2w).1 In Asian patients, higher bioavailability led to improved survival; however, severe Adverse Events (AEs) were more prevalent resulting in more frequent dosing schedule adjustment, interruption, and even discontinuation.3–7 To maintain the dosage and intensity of sunitinib exposure to further maximize the efficacy of antitumor activity, dosage or schedule adjustment of Sunitinib for patients with mRCC was in urgent need.
Several clinical studies were conducted to evaluate whether adjusted dosage or schedules could balance drug tolerance and clinical outcomes. A Phase 2 trial failed to show superiority in drug tolerance and survival benefit of a continuous schedule with dosing reduced to 37.5mg.8 Compared with the standard 4/2w schedule, 2 weeks on and 1 week off (2/1w schedule) was summarized as non-inferior or superior survival benefit according to retrospective and prospective studies from different medical centers.9–17 An individualized dosing schedule based on the severity of AEs was proved to be feasible and effective to manage toxicity and improve clinical outcomes.9,10 In other studies, therapeutic drug monitoring (TDM) was conducted to establish an individualized dosing schedule based on pharmacokinetic variability and this kind of pharmacokinetically guided dosing schedule showed superiority.10–13
However, in previous studies, the strategies of dosing schedule adjustment by TDM mainly focused on dose escalation or reduction. To our knowledge, few had modified the schedule to achieve an optimal “individualized level”, which meant variant on and off days. And medication points monitored were less and sparse.12,13 In the present study, consecutive monitoring was conducted to investigate the relationship between plasma concentration of sunitinib and AEs and clinical outcomes prospectively. And then the schedule of sunitinib was personally recommended according to the plasma concentration of sunitinib. Safety profiles and clinical outcomes were finally evaluated and retrospectively compared between patients with an adjusted schedule based on TDM and those with toxicity-adjusted schedule (TAS) and maintained schedule (MAS).
Materials and Methods
Study Design and Patients
The medical records of eligible patients treated with sunitinib as the first-line anticancer therapy to enroll were retrospectively reviewed between Apr 2012 and Oct 2019 at West China Hospital, Sichuan University. Inclusion criteria were 18 years of age or older, adequate organ function, pathological evidence of renal cell carcinoma (RCC), no previous systemic therapy for metastatic renal-cell carcinoma, measurable disease by Response Evaluation Criteria in Solid Tumors (RECIST, version 1.1),14 and life expectancy of 12 weeks or more. Exclusion criteria included: a history of malignancy other than RCC within 3 years, renal decompensation requiring hemodialysis or peritoneal dialysis, clinically relevant cardiac disorders within 12 months, a medical history including seizure disorder and uncontrolled hypertension (systolic blood pressure ≥160 mmHg or diastolic blood pressure ≥100 mmHg despite optimal medical therapy). Clinicopathologic data, survival outcomes, and AEs were collected. Regular evaluations included physical examination, radiologic assessment, and laboratory tests to assess AEs and efficacy by physicians every 4–6 weeks.
Treatment
All patients were administered with 50mg sunitinib at the beginning and the initial schedule of 4/2w or 2/1w was chosen based on the physician’s experience and the patient’s performance status. After the commencement of sunitinib, patients receiving TDM got synchronous and consecutive blood collection in the first cycle and even in the second cycle. Then, individualized schedule was established according to their sunitinib plasma concentration curves regardless of AEs happened or not. It was defined as the TDM group. For patients started with 4/2w who did not receive TDM, the schedule was adjusted to 2/1w if severe AEs and/or worsening intolerance happened. These patients were defined as the TAS group. Other patients without any schedule adjustment from initial 4/2w or 2/1w were defined as the MAS group.
Therapeutic Drug Monitoring
At first, steady-state blood samples were collected before (0h) oral administration on day 14.15 The relationship between steady-state concentration (CSS) and severity of AEs was explored to figure out the safe plasma concentration range of sunitinib. Then, blood samples of patients with a 4/2w schedule were collected at 0h on the first day in the first and the second cycles of treatment and 0h on day 2, 4, 7, 10, 14, 21, 28, 35 and 42. For patients with a 2/1w schedule, blood samples were collected at 0h of day 1, 4, 7, 10, 14, 17, 21 in the first cycle, and 0h on day 28, 35, and 42 in the second cycle. Blood samples were centrifuged at 3000 rpm for 5 minutes and plasma was isolated and stored at −20°C until analysis. The plasma concentrations of sunitinib and SU12662 were determined by high-pressure liquid chromatography/mass spectrometry (LC-MS/MS).
The schedule was adjusted individually by the tendency of sunitinib plasma concentration curves. The first cycle of the individualized schedule was regarded as a washout period. In the second cycle, blood samples were collected on 0h of day 1 and then every two or three days (ie, 0h of days 1, 4, and 7) to determine the concentration fluctuation of sunitinib in certain patients.
Outcomes and Assessment
The primary endpoints were progression-free survival (PFS) and overall survival (OS). Tumor response and AEs were the second endpoints. The treatment efficacy was assessed by RECIST 1.1. Toxicity was graded by Common Terminology Criteria for Adverse Events (CTCAE), version 4.0.16 Severe AEs were defined as those of grade ≥3 as classified by the CTCAE.
Statistical Analysis
Data were statistically described and analyzed using GraphPad Prism 8.0.1 and SPSS version 22.0 (SPSS Inc., Chicago, IL, USA). To evaluate normal distribution, we used the one-sample Kolmogorov–Smirnov test. Continuous variables such as baseline characteristics were compared by Kruskal–Wallis tests. Categorical variables of each group were compared by Chi-squared or Fisher's exact test. Kaplan-Meier survival curves were plotted and the log-rank test was used to analyze statistical significance. Cox’s proportional hazard model was used to assess the relative risk. P < 0.05 was considered statistically significant.
Results
Patient Characteristics
Between Apr 1, 2012, and Oct 28, 2019, a total of 105 patients were reviewed in this study (Table 1). The median follow-up time was 37.0 months (range 1.0–122.0 months). In the overall population, the median age was 59.0 years old (range 20.0–81.0 years). Over two-thirds of the patients were men; most patients (85.7%) were diagnosed with clear cell type histologically and most patients (87.6%) underwent nephrectomy before systemic therapy. In the TDM group, although without statistical differences, more patients (66.7%) had an intermediate risk of IMDC, and fewer patients (5.6%) had a high risk. Over 60% of metastatic lesion sites were within a single organ. After sunitinib failure, patients in the TDM group (33.3%) had more opportunities for sequential therapy than the other two groups.
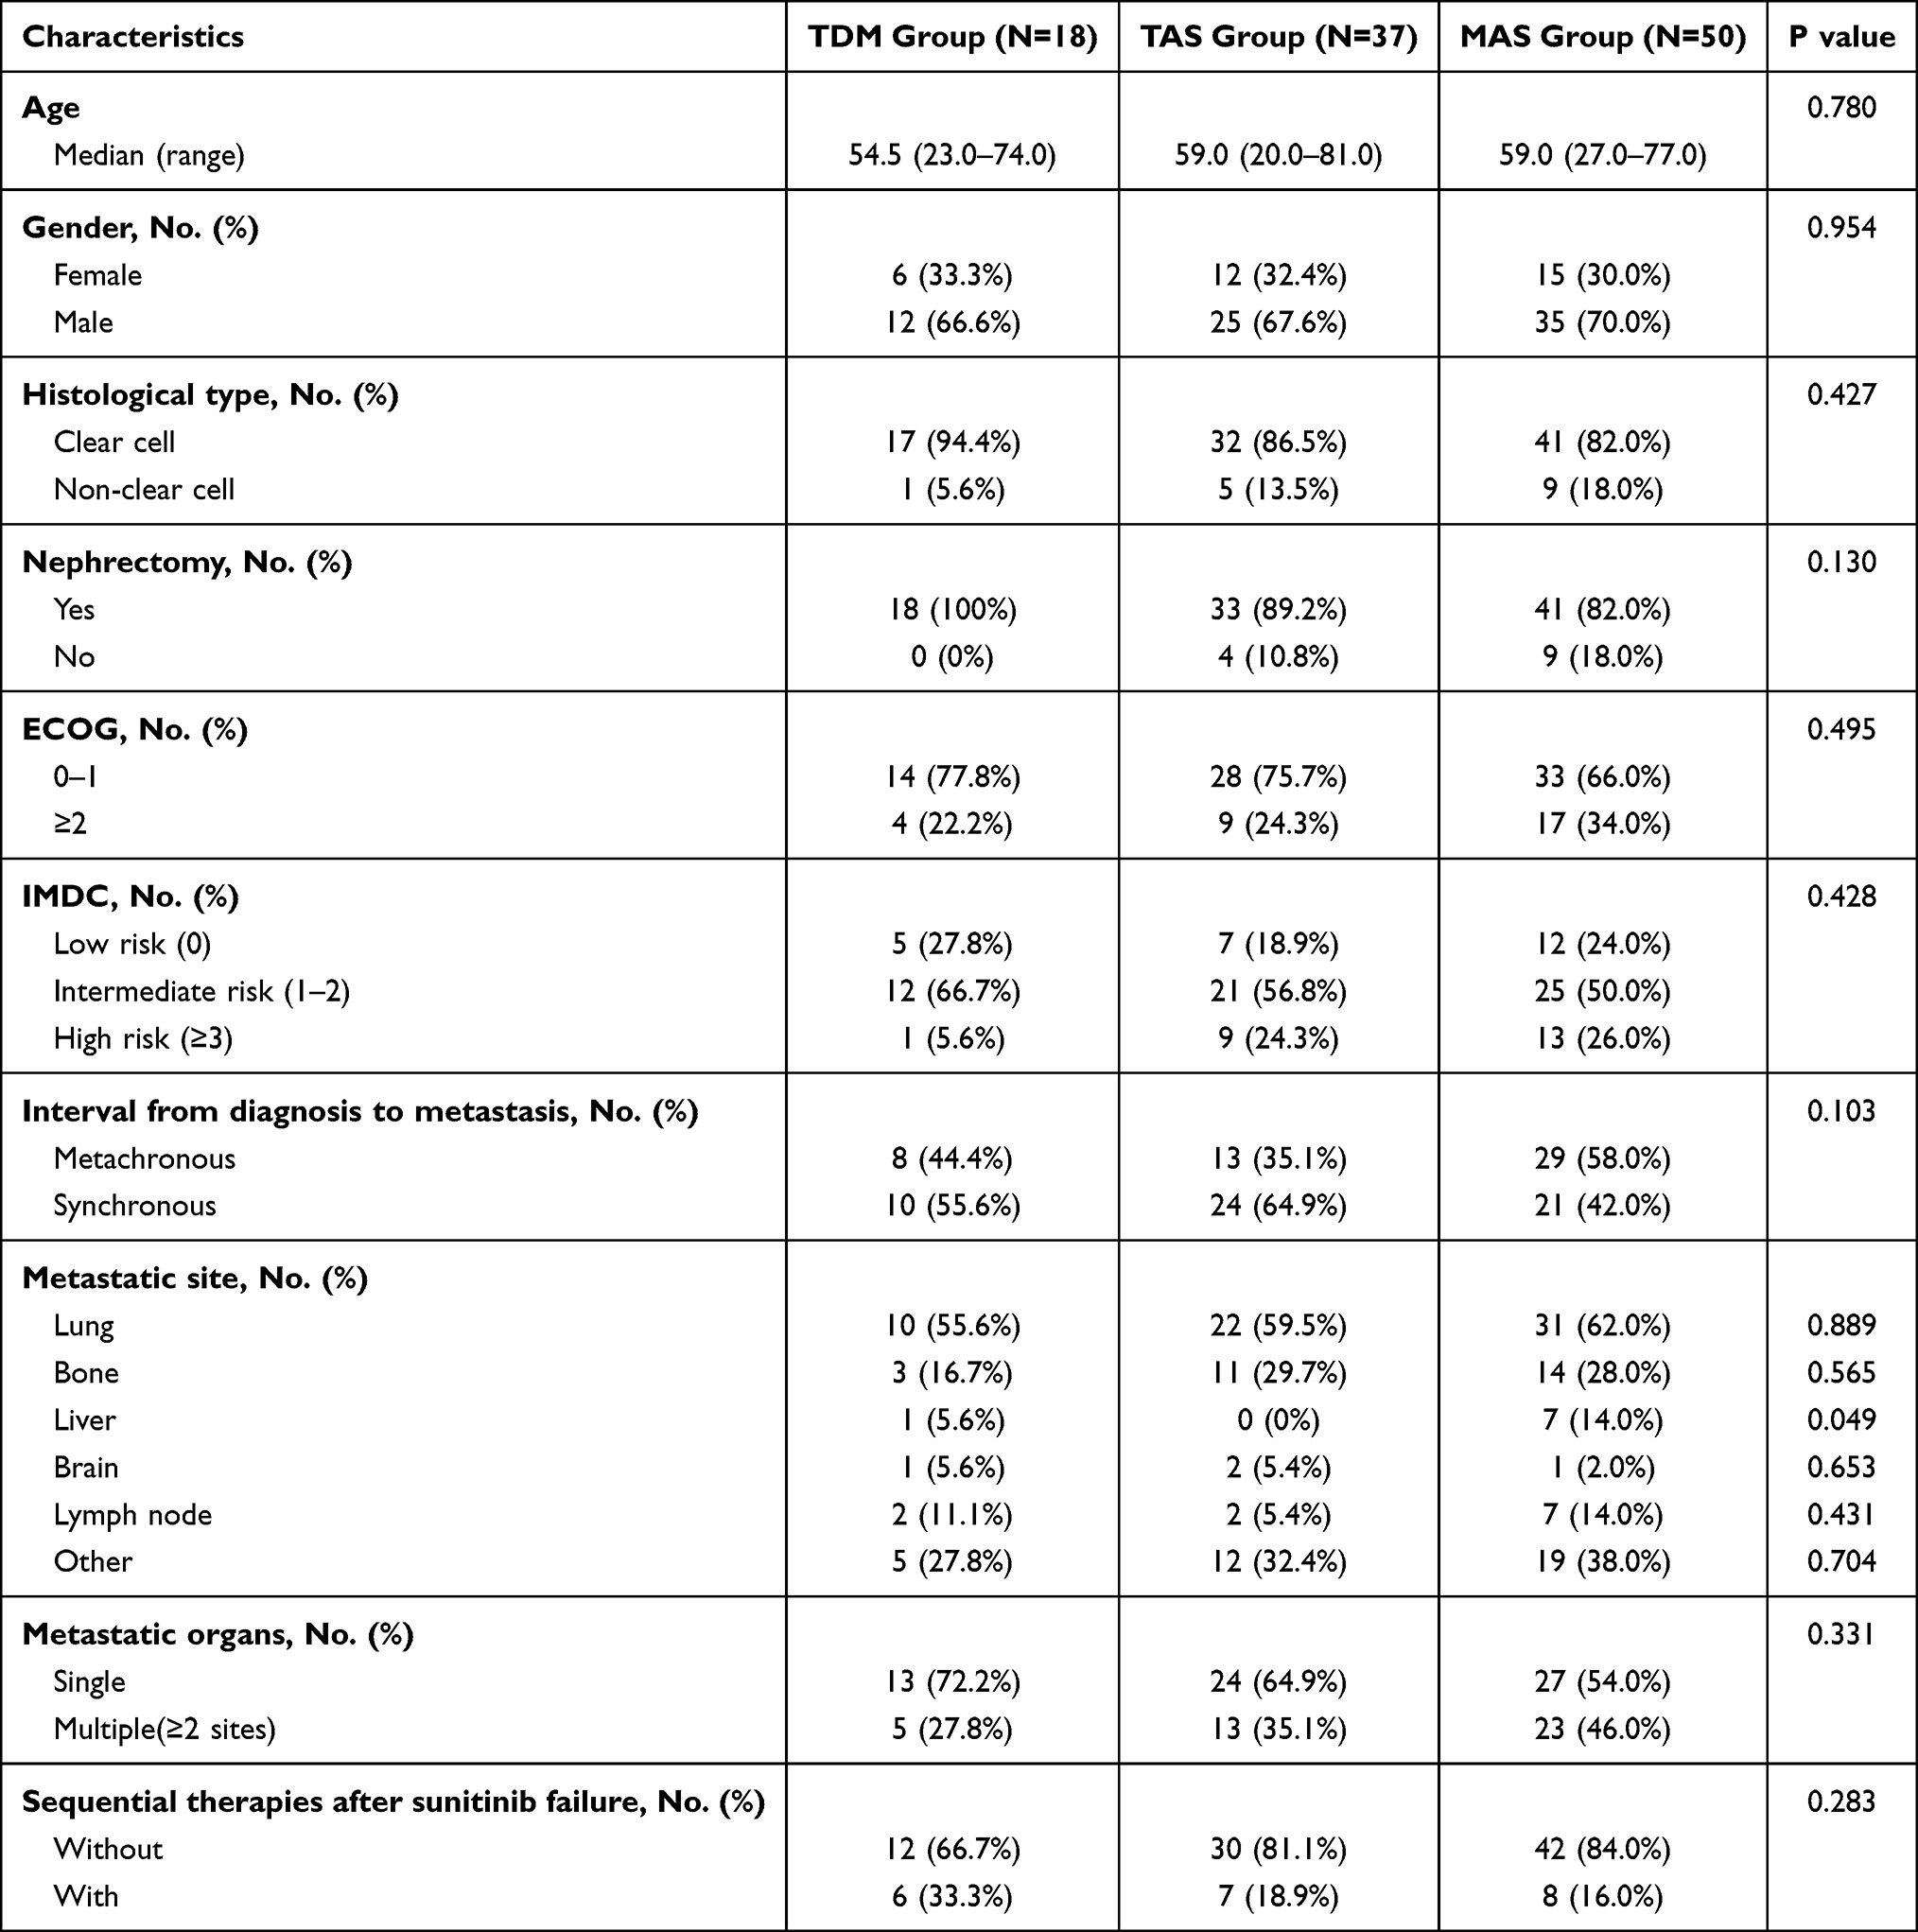 |
Table 1 Baseline Characteristics of Metastatic Renal Cell Carcinoma Patients Treated with Sunitinib Stratified by Schedule Adjustment Methods |
Seventy-three (69.5%) patients were initiated with a 4/2w schedule and 32 (30.5%) patients were initiated with a 2/1w schedule (Figure 1). In the beginning, 35 patients received CSS determination of sunitinib in their first cycle to explore the relationship between the occurrence of AEs and CSS. Another 8 patients with an initial 4/2w schedule and 10 patients with an initial 2/1w schedule received consecutive sunitinib plasma concentration monitoring in their first and second cycles. Individualized schedules were established according to concentration curves in these 18 patients.
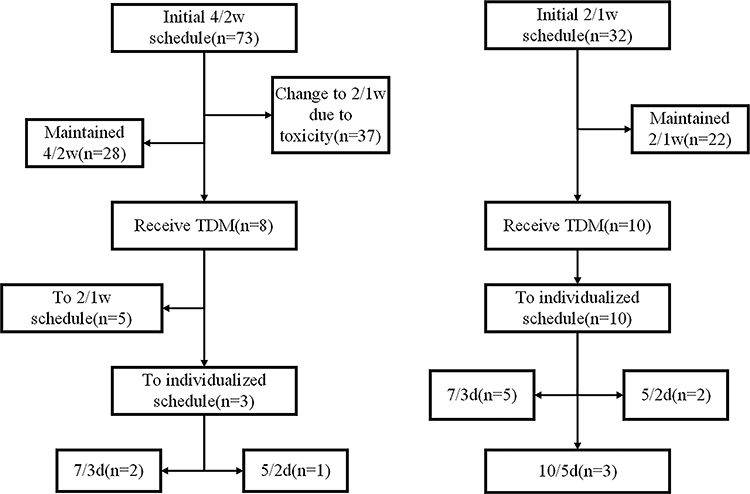 |
Figure 1 The different therapy schedules of mRCC patients in different groups. |
Plasma Concentration of Sunitinib (SU 11248) and Correlation with AEs
Sunitinib (SU11248) plasma concentration on day 14 and severity of AEs in 35 patients during the first cycle of treatment was shown in Figure 2. Hollow circle meant no severe AE happened. A filled cycle meant severe AEs happened and the size of circles was proportional to the frequency of severe AEs. SU11248 plasma concentration varied dramatically from 100.62ng/mL to 357.47ng/mL with a median of 241.60ng/mL. In steady-state, the concentration of 14.3% (5/35) patients was below 150ng/mL with only one of them suffered from severe AEs. And concentration of 22.9% (8/35) patients were between 150ng/mL and 200ng/mL, which resulted in three of them suffered from more severe AEs. Then, 62.9% (22/35) patients got CSS over 200ng/mL and most of them had severe AEs. However, only 8.6% (3/35) of patients tolerated relatively well with CSS over 200ng/mL.
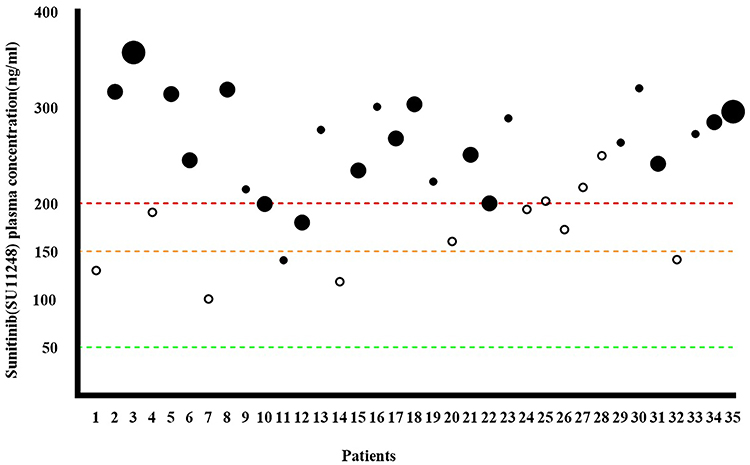 |
Figure 2 The plasma concentration of Sunitinib (SU11248) on day 14 and the severity of AEs during the first cycle of treatment. |
The SU11248 plasma concentration tendency of 8 patients initiated with a 4/2w schedule was shown in Figure 3A. The peak concentration appeared great difference in different individuals ranging from 136.37ng/mL to 413.73ng/mL. The median CSS was 289.97ng/mL (118.66~318.84ng/mL). Approximately on day 4 and day 7, the median concentration reached a level of 150ng/mL and 200ng/mL respectively. After day 4, the concentration of SU11248 kept high in the plasma until the cessation of drug administration in the first cycle. In two off weeks, the median concentration of SU11248 decreased to 29.32ng/mL (17.17~50.27ng/mL) at end of the first week and 9.69ng/mL (5.07~15.88ng/mL) at end of the second week.
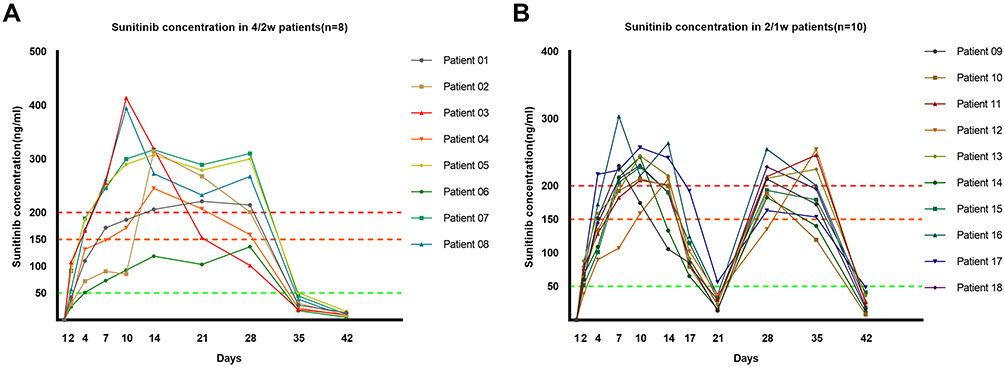 |
Figure 3 The plasma concentration tendency of Sunitinib (SU11248) at initial therapy. (A) The tendency of SU11248 plasma concentration of patients with an initiated 4/2w schedule; (B) the tendency of SU11248 plasma concentration of patients with an initiated 2/1w schedule. |
The tendency of SU11248 plasma concentration of 10 patients initiated with 2/1w schedule in the first and second cycles was shown in Figure 3B. The peak concentration ranged from 158.8ng/mL to 303.2ng/mL. Similarly, the median concentration reached a level of 150ng/mL on day 4 and 200ng/mL on day 7. The median CSS was 200.42ng/mL (105.56–263.38ng/mL) in the first cycle and 187.03ng/mL (119.38–254.41ng/mL) in the second cycle. On day 21, the median concentration decreased to 26.95ng/mL (13.89~56.42ng/mL). During the second cycle of schedule 2/1w, data on day 28,35 and 42 indicated a similar tendency in SU11248 plasma concentration.
In Table 2, 37.5% (6/16) patients got severe AEs when plasma concentration was in 150~200ng/mL. And severe AEs occurred when plasma concentration elevated over 200ng/mL in 62.5% (10/16) patients. None of these patients suffered from intolerable AEs when plasma concentration was below 150ng/mL. According to the relationship between the plasma concentration and the occurrence of severe AEs, we thought the optimal concentration of sunitinib in our cohort was 150~200ng/mL.
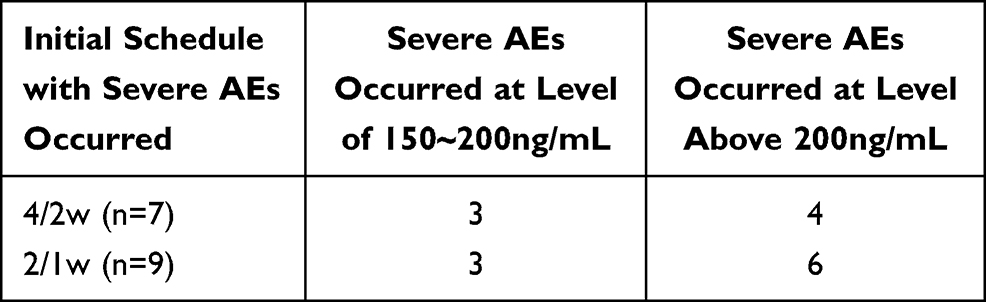 |
Table 2 Correlation Between Onset of Severe AEs and SU11248 Plasma Concentration |
Schedule Adjustment
Since CSS from 35 patients indicated that the frequency of severe AEs increased when SU11248 plasma concentration reached over 200ng/mL, individualized schedules were established according to this threshold. However, a highly different tolerance between individuals should be considered and the range of 150–200ng/mL should be taken into account rather than a level of 200ng/mL. Thus, based on curves, drug administration was paused when concentration reached 200ng/mL in patients with better tolerance and 150ng/mL with worse tolerance. Four patients initiated with a 4/2w schedule adjusted their schedules to 2/1w and 4 patients to individualized schedules (7 days on and 3 days off, 7/3d; 5 days on and 2 days off, 5/2d). In the TDM group, all 10 patients with an initial 2/1w schedule crossed to individualized schedules such as 10 days on and 5 days off (10/5d), 7/3d, and 5/2d (Table 3).
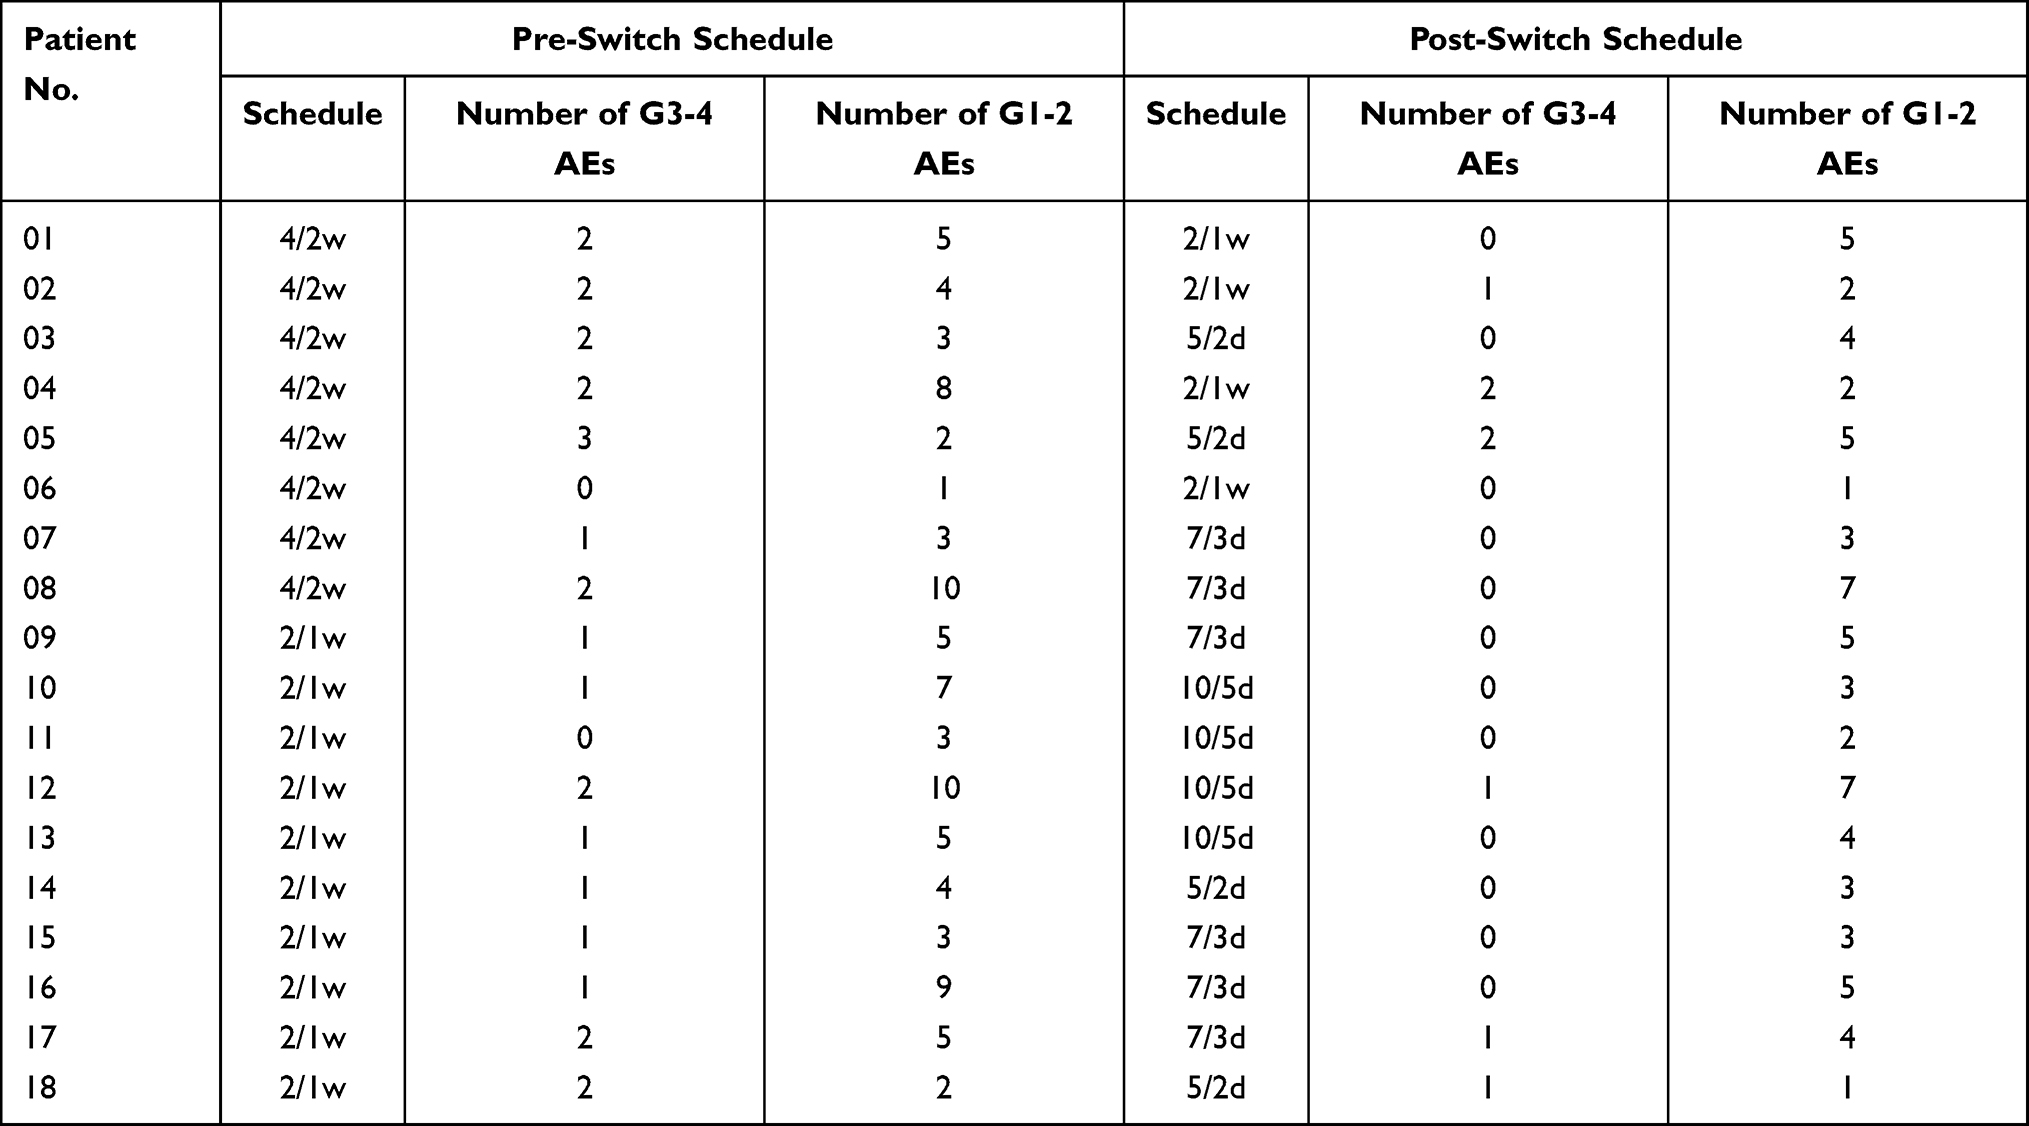 |
Table 3 Schedule Adjustment and AEs Relief in the TDM Group |
For non-TDM patients,37 of them with initial 4/2w schedule crossed to 2/1w schedule due to severe AEs. Throughout this study, only 28 patients were continued with a 4/2w schedule and 22 patients were continued with a 2/1w schedule.
Tumor Response and Survival Outcomes
The tumor responses within the three groups were compared in Table 4. Complete response (CR) was achieved in 3 patients, one in the TDM group and 2 in the TAS group. A total of 27 patients achieved partial response (PR); 6 patients were in the TDM group, 9 in the TAS group, and 12 in the MAS group. Twenty-three patients showed progression of the disease (PD) in all cohorts, but no patient showed PD in the TDM group. PD was significantly different among the three groups (p=0.043), while no statistical differences were observed in CR, PR, and SD. The objective response rate (ORR) reached 38.9% (7/18) in the TDM group, which was higher than that in the TAS (29.7%) and MAS (24.0%) group. The disease control rate (DCR) of the TDM group reached an amazing 100%. In the TAS and the MAS group, the DCR reached 75.7% and 72.0%, respectively.
At the time of the last follow-up, 89.5% (94/105) of patients had disease progression or death with a median PFS of 12.0 months. And 65.7% (69/105) patients had died before Oct 28, 2019, with a median OS of 31.0 months in the whole cohort. In the TDM group, the median PFS was much longer than that in the TAS and the MAS groups (23.0 vs 15.0 vs.10.0 months, respectively; p=0.002) (Figure 4A). Similarly, patients in the TDM group had longer median OS compared with the other two groups (Not reached vs 37.0 vs 21.5 months, p=0.005) (Figure 4B).
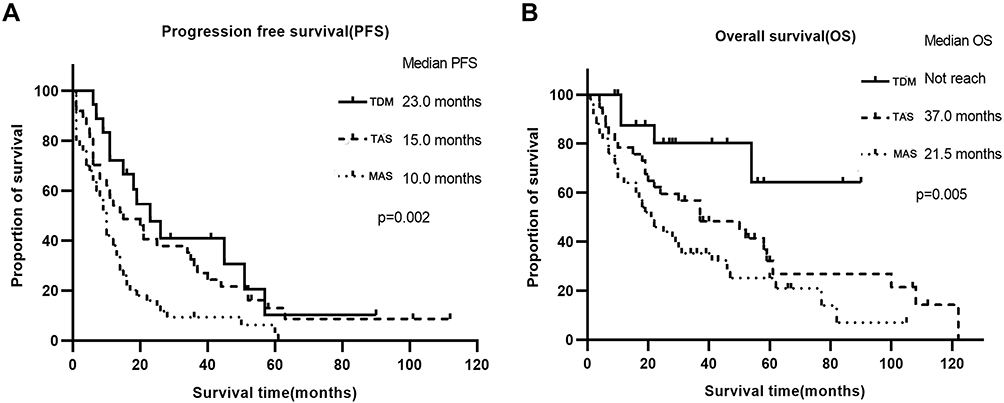 |
Figure 4 The survival outcomes in different groups. (A) The median PFS and their differences among the three groups; (B) the median OS and their differences among the three groups. |
Potential risk factors for PFS and OS in mRCC patients treated with sunitinib were further explored and listed in Table 5. In univariate analysis, Eastern Cooperative Oncology Group (ECOG) 2, IMDC
 3, and upfront nephrectomy were related to PFS. Further multivariate analysis indicated that ECOG≥2 and upfront nephrectomy were independent prognostic factors for PFS. TDM seemed to decrease the risk of disease progression without statistical significance (hazard ratio [HR] 0.60,95% confidence interval [CI] 0.32–1.09, p=0.094). As for OS, the univariate analysis suggested that ECOG
 2, IMDC≥3, upfront nephrectomy, and TDM were associated with OS statistically. Further multivariate analysis showed that ECOG
 2 was an independent factor predicting a poor prognosis (HR 3.42, 95% CI 1.92–6.09, p=0.001) and upfront nephrectomy could predict a favorable prognosis independently (HR 0.46, 95% CI 0.23–0.90, p=0.024). Remarkably, TDM strongly predicted a favorable prognosis independently (HR 0.31, 95% CI 0.11–0.87, p=0.026).
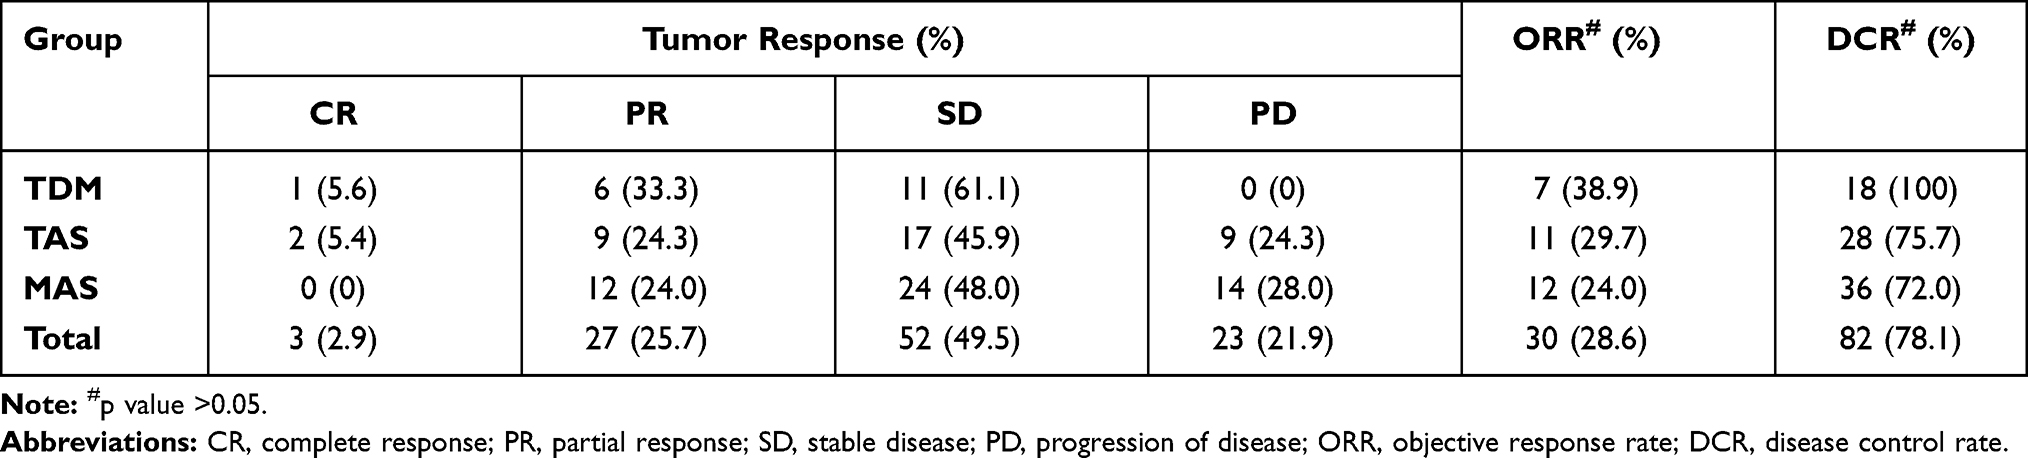 |
Table 4 The Best Therapeutic Tumor Response Among Three Groups |
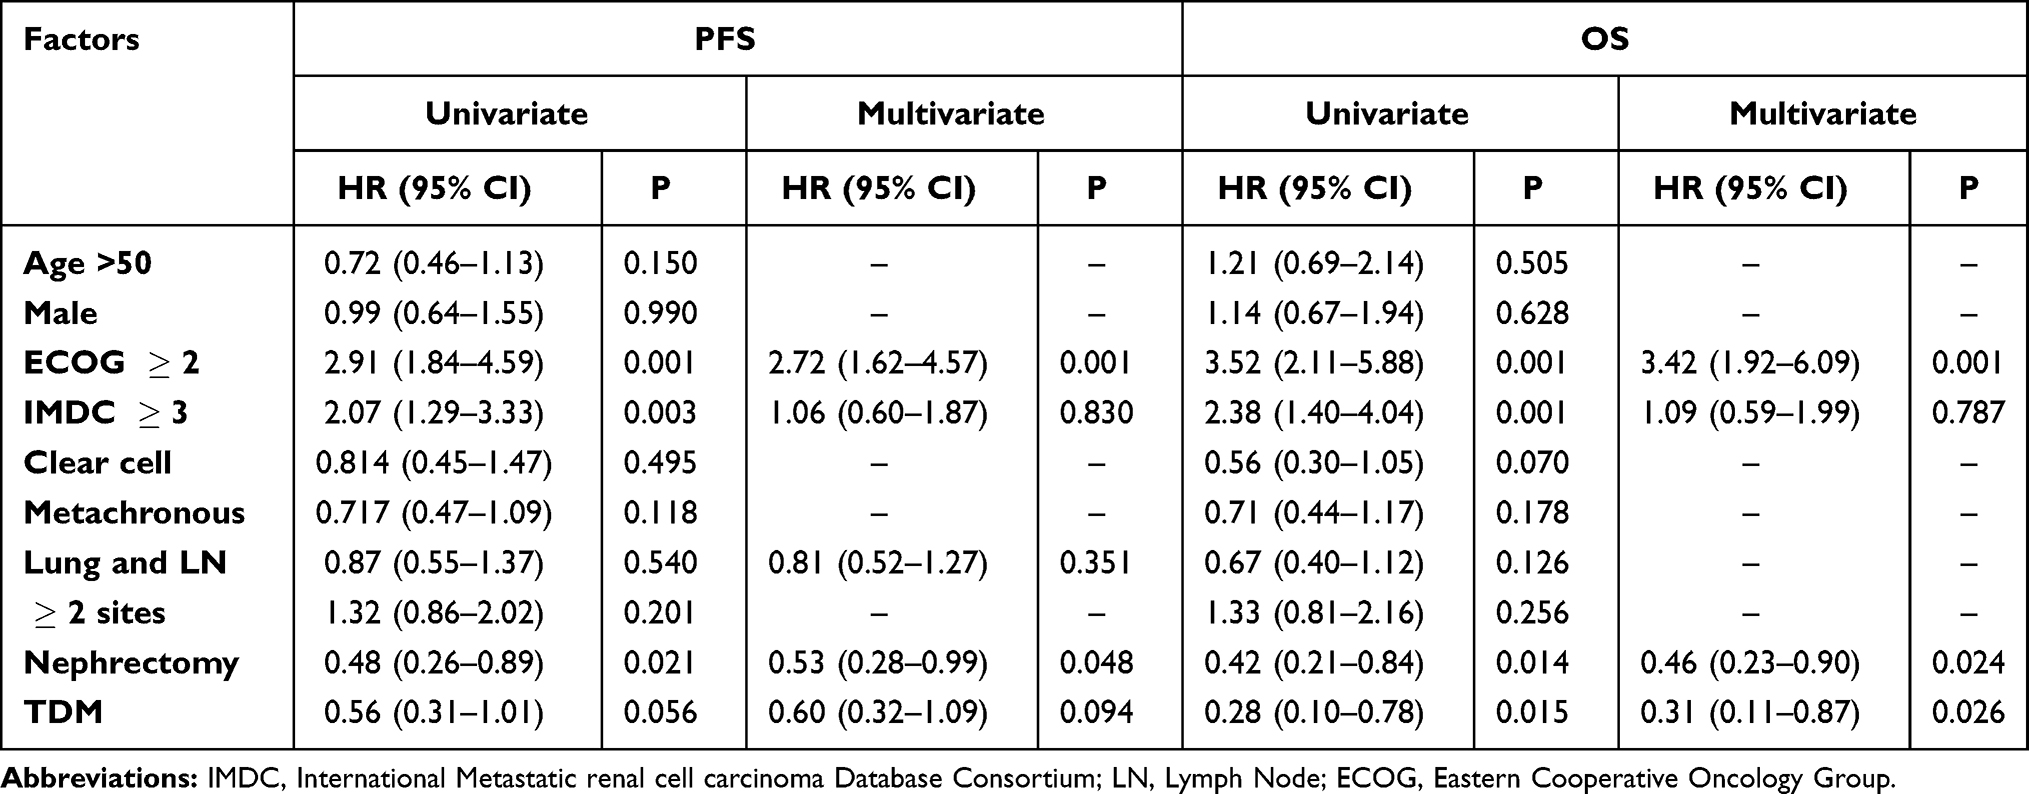 |
Table 5 Univariate and Multivariate Analyses for PFS and OS |
Safety
All the AEs were summarized in Table 6. Overall, the incidence of all grades AEs was 96.2%; the incidence of severe AEs was 66.7%. In the pre-switch period, the incidence of severe AEs was up to 88.9% in the TDM group, while they were 73.0% and 54.0% in the TAS group and the MAS group respectively. After the schedule was adjusted by TDM or toxicity, the incidence of severe AEs decreased from 88.9% to 33.3% and 73.0% to 37.8%, respectively. And the differences between the two periods were statistically significant both in the TDM and the TAS group (p=0.001 and p=0.002).
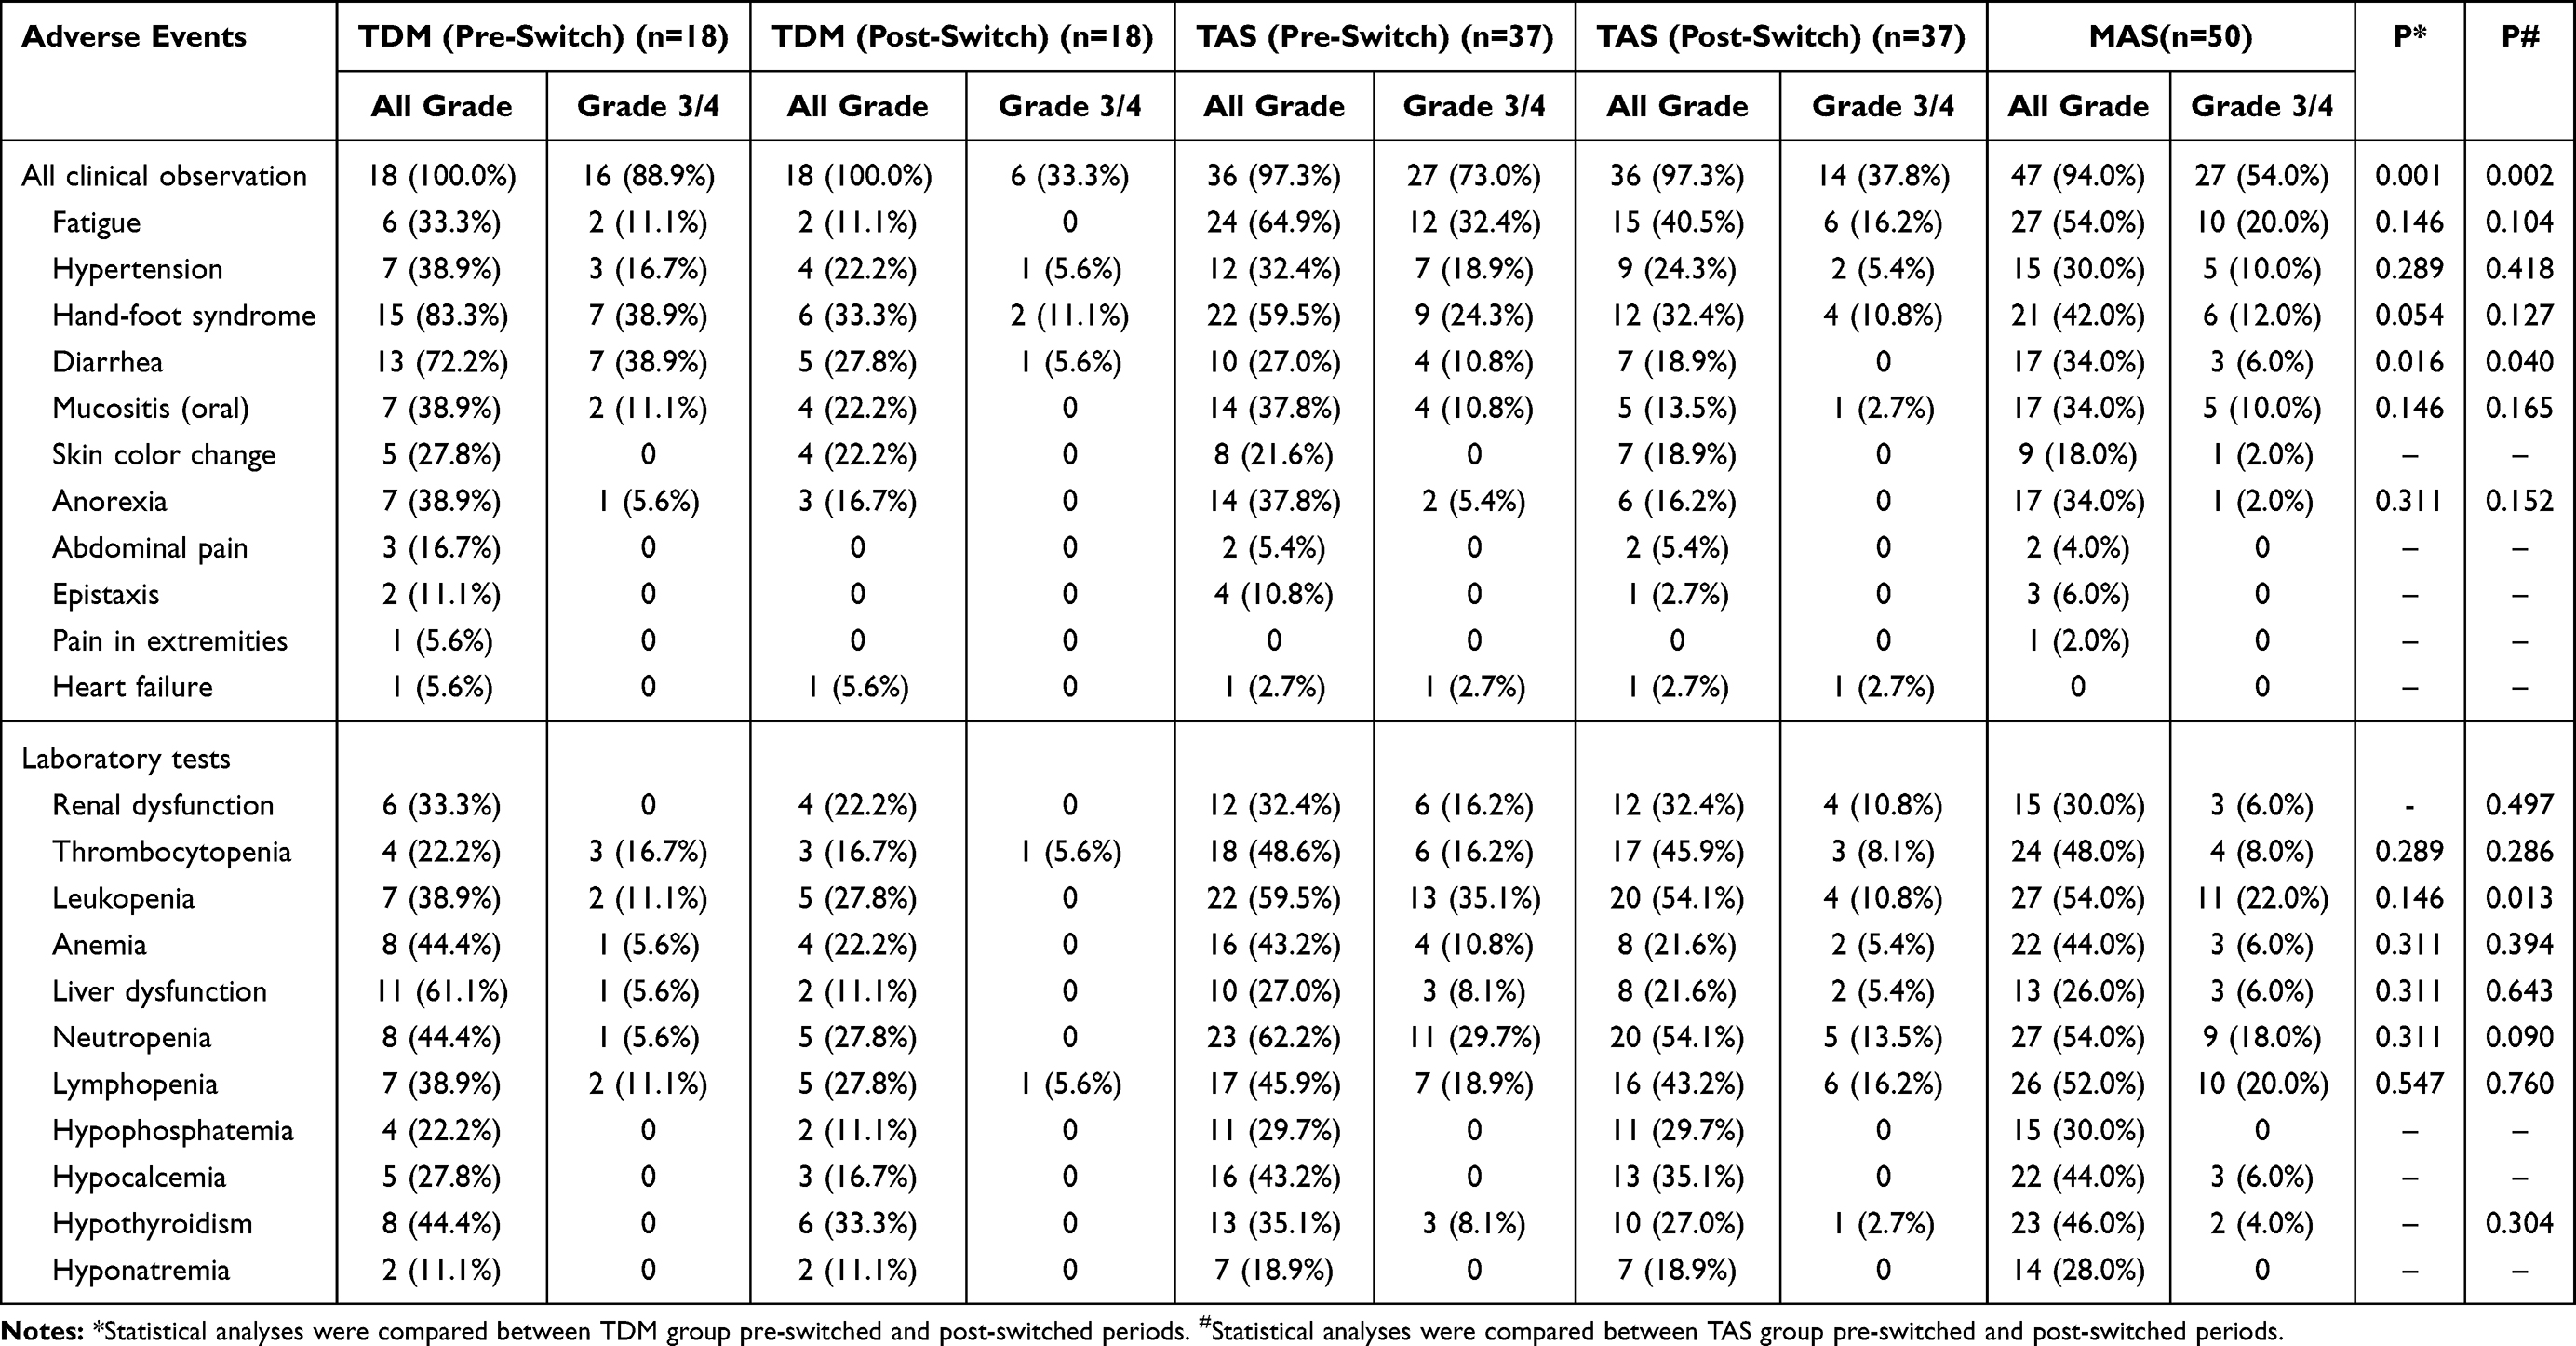 |
Table 6 Treatment Related Adverse Events Among Three Groups |
Particularly, the incidences of diarrhea of all grades and grades 3/4 were as high as 72.2% and 38.9% in the TDM group before schedule adjustment. After schedule adjustment, the incidences of all grades and grade 3/4 diarrhea dramatically decreased to 27.8% and 5.6% with statistical significance (p=0.016). Though without statistical significance (p=0.054), the hand-foot syndrome also relieved a lot. The incidence of all grades hand-foot syndrome decreased from 83.3% to 33.3% and from 38.9% to 11.1% of grade 3/4. Except for impressive liver dysfunction recovery (61.1% to 11.1%), the toxicity relief of laboratory tests was comparable between the TDM and the TAS group. Compared with the TAS group, most patients receiving TDM experienced less and lighter laboratory AEs both in pre-switch and post-switch periods.
Details of AEs relief of each patient in the TDM group were listed in Table 3. In the individualized schedules, AEs were relieved largely in nearly all of them. Severe AEs disappeared in 62.5% (10/16) patients after the 2/1w schedule or schedules with shorter on and off days established. The frequency of grade 1–2 AEs also decreased in most patients.
Further Monitoring
Four patients received further sunitinib plasma concentration monitoring in the individualized schedules. Comparison of concentration curves of one patient (patient 07) from 4/2w to 7/3d was shown in Figure 5A. In the 4/2w curve, the plasma concentration of sunitinib was kept above the level of 200ng/mL over 3 weeks and below the level of 50ng/mL last week. The peak concentration of 7/3d was below the level of 200ng/mL and trough concentration was kept above the level of 50ng/mL. Three initial 2/1w patients received further monitoring. Patient 12 adjusted the schedule from 2/1w to 10/5d and curves of the two schedules were compared in Figure 5B. The concentration in schedule 10/5d was kept between 50ng/mL and 150ng/mL in the whole cycle of 15 days. Of patients 16 (2/1w-7/3d) and 14 (2/1w-5/2d), individualized schedules also enabled sunitinib plasma concentration to keep between 50ng/mL and 150ng/mL during the whole cycle of treatment (Figure 5C and D).
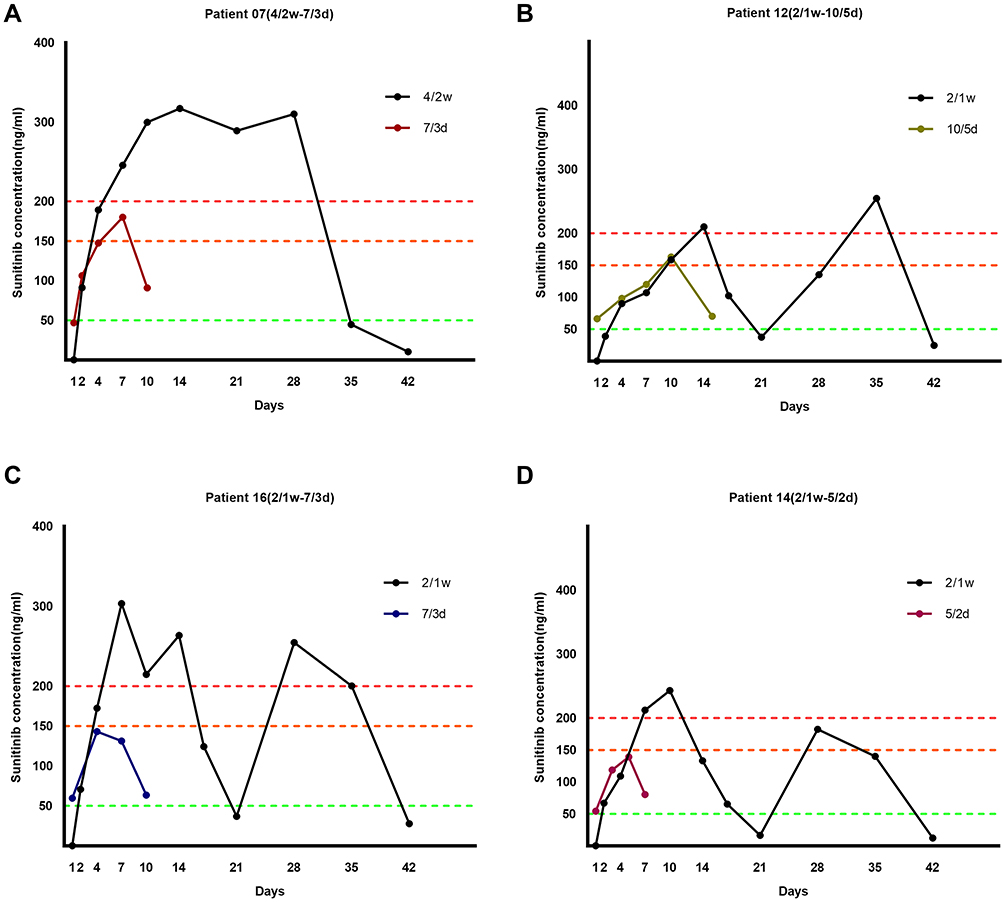 |
Figure 5 Further sunitinib plasma concentration monitoring in the individualized schedules. (A) The comparison of concentration curves of patient 07 adjusted from 4/2w to 7/3d; (B) the comparison of concentration curves of patient 12 adjusted the schedule from 2/1w to 10/5d; (C) the comparison of concentration curves of patient 16 adjusted the schedule from 2/1w to 7/3d; (D) the comparison of concentration curves of patient 14 adjusted the schedule from 2/1w to 5/2d. |
Discussion
In our previous study, patients with a 4/2w-2/1w switch schedule seemed to achieve the best survival benefits and experienced an improved safety profile among three groups of patients.17 It demonstrated that adjusting the schedule based on severe toxicities could help to improve clinical outcomes and quality of life (QoL). However, nearly 40% of patients with 4/2w-2/1w would still suffer from severe AEs after adjustment, which indicated rigid drug administration could not be fit for all patients. To further reduce intolerance of sunitinib, some studies even tried individualized schedules according to the severity of AEs, such as 1w on/1w off,9 while these clinical practices lacked scientific and objective surrogate markers. In the present study, TDM was utilized as a superior method to optimize the drug administration schedule. The real-time sunitinib plasma concentration curves could facilitate physicians to set the optimal individual schedules for each patient with variant on and off days.
According to pharmacokinetic research, AUC, and peak sunitinib plasma concentration in Asian patients were predicted to increase by 15% for both sunitinib and total drug (SU11248+SU12662) compared to other ethnicities.7 Higher bioavailability indicated higher AEs incidence and better survival benefits simultaneously. That meant Asian patients could benefit from a shorter drug administration period. Preclinical research of pharmacokinetic analysis showed that tumor growth could be inhibited effectively only when total drug concentration reached above 50ng/mL.18 In the present study, the average sunitinib plasma concentration was obviously beyond 100ng/mL and the concentration of SU11248 was much higher than that of SU12662, which meant plasma concentration was mainly affected by SU11248. Since Khosravan et al reported that SU12662 data did not improve the predictive effectiveness and was associated with longer run times,19 we explored the relationship between clinical outcomes and SU11248 merely.
As for CSS of sunitinib, another parallel research of Japanese patients showed total drug concentration ranged from 38.3~196.9ng/mL.12 Data in the present study was much higher than this figure and concentration in another study.20 When CSS reached over 150ng/mL, severe AEs occurred in Chinese patients subsequently. So, we assumed a higher concentration “safe window” in Chinese patients. A level of 150~200ng/mL could be regarded as a “transitional zone” on which clinical decision-making of schedule adjustment was based. Drug administration of sunitinib should be paused once concentration reached this range on a certain day in the cycle of treatment. Our results indicated that the ratio between whether suffer from severe AEs or not when CSS was between 150ng/mL and 200ng/mL was nearly half to half. The occurrence of severe AEs could be a crucial factor when considering 150ng/mL or 200ng/mL as the threshold. According to our data, the time when sunitinib concentration reached 150~200ng/mL varied a lot in different individuals but rather soon (within one week in 10 of 18 patients). As a result, the previous clinical practice such as 4/2w-2/1w did not fit these patients. Variant schedules were considered such as 10/5d, 7/3d, and 5/2d. Further monitoring of individualized schedules in four patients manifested ideal sunitinib plasma concentration fluctuation.
A recent phase 2 clinical trial of efficacy and safety of sunitinib given on an individualized schedule as first-line therapy for mRCC patients revealed that individualized sunitinib therapy was a feasible, safe, and effective method to manage toxicity.9 However, severe AEs happened and impacted QoL indeed before feasible schedule adjustment could be conducted. Thus, one of the advantages of TDM was to avoid severe AEs in the first cycle of treatment. Dose reduction or drug interruption was less likely to occur in TDM patients. In correlation between the onset of severe AEs and sunitinib plasma concentration reaching the range of 150~200ng/mL, inconsistency was seen in 62.5% (10/16) patients. No severe AEs occurred when the concentration was below 150ng/mL. It demonstrated that severe AEs might “lag” in comparison with plasma concentration increase. To this aspect, active and synchronous TDM rather than waiting for severe AEs onset would be superior. However, large-scale and routine TDM is inconvenient so far due to poor compliance resulted from intensive blood collection and limited devices for testing. Simplification of TDM and fewer medication points in blood collection to achieve the same predictive effectiveness should be considered.
Our research was the first time to explore consecutive sunitinib plasma concentrations in Chinese mRCC patients in the real world and compare these three different schedule adjustment methods with long-term outcomes. Although we had a small sample size, we demonstrated that TDM could bring patients better QoL and a superior prognosis. By further monitoring of individualized schedules, powerful proof of advantages in adjusting schedules through plasma concentration monitoring was given. Although different alternative dosing schedules for sunitinib have been investigated in clinical practice currently, TDM remains competitive. We attempted to find out potential factors that may guide a suitable sunitinib dosing schedule modification in clinical practice. Besides, patients in our study had relatively poor ECOG status and the ratio of poor IMDC risk was relatively high.
Limitations of this study do exist. The first was a retrospective study design itself. Unavoidable biases occurred when patients were selected for the TDM or TAS or MAS group. Larger and prospective research is needed to provide stronger evidence. Second, consecutive blood collection every three or four days seemed to be annoying for some patients receiving TDM, especially those who lived far away from the hospital. Compliance of patients may decline. Third, limited medical records and recall or reporting from physicians and patients in the collection and evaluation of AEs also caused biases.
Overall, TDM in consecutive medication points improved safety profile and clinical outcomes significantly in Chinese patients with mRCC. The time when sunitinib plasma concentration reaches a level of 150~200ng/mL is considered as a critical factor in the clinical decision-making of an individualized schedule. Further prospective studies are required to verify the current conclusion. Our study provides a piece of evidence that consecutive TDM is a promising attempt in routine clinical practice and patients who are administered with sunitinib will be able to benefit from this method.
Abbreviations
VEGFR, Vascular endothelial growth factor receptor; PDGFR, platelet-derived growth factor receptor; mRCC, metastatic renal cell carcinoma; IMDC, International mRCC Database Consortium; MSKCC, Memorial Sloan Kettering Cancer Center; AEs, adverse events; TDM, therapeutic drug monitoring; TAS, toxicity-adjusted schedule; MAS, maintained schedule; RCC, renal cell carcinoma; RECIST, Response Evaluation Criteria in Solid Tumors; CSS, steady-state concentration; LC-MS/MS, liquid chromatography/mass spectrometry; PFS, progression-free survival; OS, overall survival; CTCAE, Common Terminology Criteria for Adverse Events; CR, complete response; PR, partial response; PD, progression of the disease; DCR, disease control rate; ECOG, Eastern Cooperative Oncology Group; QoL, quality of life; HR, hazard ratio; CI, confidence interval.
Data Sharing Statement
The data that support the findings of this study are available from the corresponding author upon reasonable request.
Ethical Statement
This study was conducted according to the principles expressed in the Declaration of Helsinki and had been reviewed and approved by a responsible Institutional Review Board (IRB) of West China Hospital, Sichuan University, The approval ID was: 2012 clinical trial approval No. 15. Every relevant detail has been explained to the patient himself, and written consent forms were obtained from each patient.
Author Contributions
All authors made substantial contributions to conception and design, acquisition of data, or analysis and interpretation of data; took part in drafting the article or revising it critically for important intellectual content; gave final approval of the version to be published; and agree to be accountable for all aspects of the work.
Funding
This work was supported by the Science and Technology Support Program of Sichuan Province (2021YFS0119), National Natural Science Foundation of China (NSFC 81974398, 81872107, and 81902577) and 1.3.5 project for disciplines of excellence, West China Hospital, Sichuan University (No.0040205301E21).
Disclosure
All authors declared that there were no potential conflicts of interest.
References
1. Motzer RJ, Hutson TE, Tomczak P, et al. Sunitinib versus interferon alfa in metastatic renal-cell carcinoma. N Engl J Med. 2007;356(2):115–124. doi:10.1056/NEJMoa065044
2. Motzer RJ, Jonasch E, Michaelson MD, et al. NCCN guidelines insights: kidney cancer, version 2.2020. J Natl Compr Canc Netw. 2019;17(11):1278–1285. doi:10.6004/jnccn.2019.0054
3. Li XS, Wu X, Zhao PJ, et al. Efficacy and safety of sunitinib in the treatment of metastatic renal cell carcinoma. Chin Med J. 2011;124(18):2920–2924.
4. Kim HS, Hong MH, Kim K, et al. Sunitinib for Asian patients with advanced renal cell carcinoma: a comparable efficacy with different toxicity profiles. Oncology. 2011;80(5–6):395–405. doi:10.1159/000330361
5. Yoo C, Kim JE, Lee JL, et al. The efficacy and safety of sunitinib in Korean patients with advanced renal cell carcinoma: high incidence of toxicity leads to frequent dose reduction. Jpn J Clin Oncol. 2010;40(10):980–985. doi:10.1093/jjco/hyq073
6. Motzer RJ, Hutson TE, Tomczak P, et al. Overall survival and updated results for sunitinib compared with interferon alfa in patients with metastatic renal cell carcinoma. J Clin Oncol. 2009;27(22):3584–3590. doi:10.1200/JCO.2008.20.1293
7. Houk BE, Bello CL, Kang D, Amantea M. A population pharmacokinetic meta-analysis of sunitinib malate (SU11248) and its primary metabolite (SU12662) in healthy volunteers and oncology patients. Clin Cancer Res. 2009;15(7):2497–2506. doi:10.1158/1078-0432.CCR-08-1893
8. Motzer RJ, Hutson TE, Olsen MR, et al. Randomized Phase II trial of sunitinib on an intermittent versus continuous dosing schedule as first-line therapy for advanced renal cell carcinoma. J Clin Oncol. 2012;30(12):1371–1377. doi:10.1200/JCO.2011.36.4133
9. Bjarnason GA, Knox JJ, Kollmannsberger CK, et al. The efficacy and safety of sunitinib given on an individualised schedule as first-line therapy for metastatic renal cell carcinoma: a phase 2 clinical trial. Eur J Cancer. 2019;108:69–77. doi:10.1016/j.ejca.2018.12.006
10. Sabanathan D, Zhang A, Fox P, et al. Dose individualization of sunitinib in metastatic renal cell cancer: toxicity-adjusted dose or therapeutic drug monitoring. Cancer Chemother Pharmacol. 2017;80(2):385–393. doi:10.1007/s00280-017-3362-1
11. Cabel L, Blanchet B, Thomas-Schoemann A, et al. Drug monitoring of sunitinib in patients with advanced solid tumors: a monocentric observational French study. Fundam Clin Pharmacol. 2018;32(1):98–107. doi:10.1111/fcp.12327
12. Takasaki S, Kawasaki Y, Kikuchi M, et al. Relationships between sunitinib plasma concentration and clinical outcomes in Japanese patients with metastatic renal cell carcinoma. Int J Clin Oncol. 2018;23(5):936–943. doi:10.1007/s10147-018-1302-7
13. Numakura K, Fujiyama N, Takahashi M, et al. Clinical implications of pharmacokinetics of sunitinib malate and N-desethyl-sunitinib plasma concentrations for treatment outcome in metastatic renal cell carcinoma patients. Oncotarget. 2018;9(38):25277–25284. doi:10.18632/oncotarget.25423
14. Eisenhauer EA, Therasse P, Bogaerts J, et al. New response evaluation criteria in solid tumours: revised RECIST guideline (version 1.1). Eur J Cancer. 2009;45(2):228–247. doi:10.1016/j.ejca.2008.10.026
15. Goodman VL, Rock EP, Dagher R, et al. Approval summary: sunitinib for the treatment of imatinib refractory or intolerant gastrointestinal stromal tumors and advanced renal cell carcinoma. Clin Cancer Res. 2007;13(5):1367–1373. doi:10.1158/1078-0432.CCR-06-2328
16. (U.S) NCI. Common Terminology Criteria for Adverse Events V4.0. Bethesda, MD: U.S Dept of Health and Human Services, National Institutes of Health, National Cancer Institute; 2009.
17. Zhang X, Sun G, Zhao J, et al. Improved long-term clinical outcomes and safety profile of sunitinib dosing schedule with 4/2 switched To 2/1 in patients with metastatic renal cell carcinoma. J Cancer. 2018;9(18):3303–3310. doi:10.7150/jca.25693
18. Mendel DB, Laird AD, Xin X, et al. In vivo antitumor activity of SU11248, a novel tyrosine kinase inhibitor targeting vascular endothelial growth factor and platelet-derived growth factor receptors: determination of a pharmacokinetic/pharmacodynamic relationship. Clin Cancer Res. 2003;9(1):327–337.
19. Khosravan R, Motzer RJ, Fumagalli E, Rini BI. Population pharmacokinetic/pharmacodynamic modeling of sunitinib by dosing schedule in patients with advanced renal cell carcinoma or gastrointestinal stromal tumor. Clin Pharmacokinet. 2016;55(10):1251–1269. doi:10.1007/s40262-016-0404-5
20. Faivre S, Delbaldo C, Vera K, et al. Safety, pharmacokinetic, and antitumor activity of SU11248, a novel oral multitarget tyrosine kinase inhibitor, in patients with cancer. J Clin Oncol. 2006;24(1):25–35. doi:10.1200/JCO.2005.02.2194
 © 2021 The Author(s). This work is published and licensed by Dove Medical Press Limited. The full terms of this license are available at https://www.dovepress.com/terms.php and incorporate the Creative Commons Attribution - Non Commercial (unported, v3.0) License.
By accessing the work you hereby accept the Terms. Non-commercial uses of the work are permitted without any further permission from Dove Medical Press Limited, provided the work is properly attributed. For permission for commercial use of this work, please see paragraphs 4.2 and 5 of our Terms.
© 2021 The Author(s). This work is published and licensed by Dove Medical Press Limited. The full terms of this license are available at https://www.dovepress.com/terms.php and incorporate the Creative Commons Attribution - Non Commercial (unported, v3.0) License.
By accessing the work you hereby accept the Terms. Non-commercial uses of the work are permitted without any further permission from Dove Medical Press Limited, provided the work is properly attributed. For permission for commercial use of this work, please see paragraphs 4.2 and 5 of our Terms.