")
Back to Journals » Eye and Brain » Volume 10
Effects of tDCS-like electrical stimulation on retinal ganglion cells
Authors Strang CE , Ray MK, Boggiano MM, Amthor FR
Received 27 January 2018
Accepted for publication 1 May 2018
Published 27 August 2018 Volume 2018:10 Pages 65—78
DOI https://doi.org/10.2147/EB.S163914
Checked for plagiarism Yes
Review by Single anonymous peer review
Peer reviewer comments 3
Editor who approved publication: Professor Margaret Wong-Riley
Christianne E Strang, Mary Katherine Ray, Mary M Boggiano, Franklin R Amthor
Department of Psychology, The University of Alabama at Birmingham, Birmingham, AL, USA
Purpose: Transcranial direct current stimulation (tDCS) has been studied in humans for its effects on enhancement of learning, amelioration of psychiatric disorders, and modification of other behaviors for over 50 years. Typical treatments involve injecting 2 mA current through scalp electrodes for 20 minutes, sometimes repeated weekly for two to five sessions. Little is known about the direct effects of tDCS at the neural circuit or the cellular level. This study assessed the effects of tDCS-like currents on the central nervous system by recording effects on retinal ganglion cell responsiveness using the rabbit retina eyecup preparation.
Materials and methods: We examined changes in firing to On and Off light stimuli during and after brief applications of a range of currents and polarity and in different classes of ganglion cells.
Results: The responses of Sustained cells were consistently suppressed during the first round of current application, but responses could be enhanced after subsequent rounds of stimulation. The observed first round suppression was independent of current polarity, amplitude, or number of trials. However, the light responses of Transient cells were more likely to be enhanced by negative currents and unaffected or suppressed by first round positive currents. Short-duration currents, that is, minutes, as low as 2.5 µA produced a remarkable persistency of firing changes, for up to 1.5 hours, after cessation of current.
Conclusion: The results are consistent with postulated tDCS alteration of central nervous system function, which outlast the tDCS session and provide evidence for the isolated retina as a useful model to understand tDCS actions at the neuronal level.
Keywords: tDCS mechanisms, CNS, in vitro model, neural coding, neuromodulation
Introduction
Since the 1960s,1 the technique of low current transcranial direct current stimulation (tDCS) has been investigated in humans as a safe, noninvasive neuromodulation technique for numerous conditions. Single-session and repeated treatments of tDCS have been found to enhance cognitive and motor functions and ameliorate psychiatric disorders, such as depression, substance abuse, schizophrenia, and binge eating disorder.2–7 In retina, transcorneal electrical stimulation has been reported to affect ganglion cell survival and axonal growth8,9 and to preserve retinal function in a number of retinal degeneration models.10–13
tDCS is regarded as safe and is free of lasting adverse effects that plague many pharmaceutical interventions. For example, tDCS trials are underway in pregnant women for depression who, because of potential harm to the fetus, cannot take antidepressants.14
A typical tDCS treatment involves administering 1–2 mA of current through saline-soaked sponge-covered electrodes placed on the head for 20 minutes.15 Unlike transcranial magnetic stimulation, tDCS is not thought to directly evoke action potentials in the brain but instead to modulate ongoing activity.16–18 Generally, brain areas near the anode are activated, whereas brain regions close to the cathode are inhibited.19 The effects of 20-minute tDCS treatments have postsession behavioral effects and, with repeated sessions, beneficial changes that can last for weeks or months. The effects depend on electrode placement and current polarity.5
However, despite the widespread testing and use of tDCS to alter human behavior and ameliorate clinical conditions, little is known about either the short- or long-term direct effects of tDCS on intact, normally functioning neural circuits. Studies using cultured central nervous system (CNS) tissue have shown that electric fields can influence the outgrowth and branching of neurites.20 The mechanisms proposed for tDCS effects include alteration of neurotransmitter levels,21 functional connectivity,21 and modulation of synaptic plasticity.22 Neuroplastic effects are supported by the finding that N-methyl-D-aspartate receptor blockade reduces tDCS effects on human motor cortex.23 Brain-derived neurotrophic factor (BDNF) has also been found to be required for tDCS-induced long-term potentiation in mouse primary motor slices.24
Direct neurophysiological effects of tDCS have been investigated by Ozen et al in cortical and hippocampal slices.25 They reported that current stimulation increased synchronous firing in these slices in a current intensity-dependent manner, with thresholds for effects occurring at field strengths as low as 1 mV/mm. The effects of weak (<1 µA) tDCS stimulation in intact subcortical structures such as the red nucleus in anesthetized animals26 was found to have a polarity-dependent effect on the excitability of preterminal axonal branches of interposito-rubral neurons for up to 1 hour post-tDCS.26 However, most slice and deeply anesthetized preparations may not be ideal for assessing tDCS effects because the maintained firing rates of neurons are low and not naturally stimulus driven. If tDCS works by weakly modulating ongoing maintained or natural stimulus-driven firing, such preparations may not reveal its modulatory effects.
The mammalian retina may be a useful in vitro model27 to examine tDCS effects on a CNS neural circuit. The retina consists of heterogeneous cell types organized in functionally structured layers that are highly conserved across species, an arrangement that is analogous to the heterogeneous cell types across cortical or cerebellar layers. The mammalian retina is a well-characterized neural tissue that can be removed virtually intact, with the only sectioning being that of the ganglion cell axons many millimeters from the cell body. Because light is the normal input to the retina and can be easily supplied in the in vitro preparation, the retina can be kept operating in a nearly normal state of light responsiveness and natural physiological neural firing for 8 hours or more after isolation. Retinal ganglion cells are exquisitely sensitive to current modulation because they integrate graded potentials created by the entire neural processing chain from photoreceptors through bipolar cells.28 The use of live animals to study the mechanisms of tDCS has disadvantages because one is limited to studying effects on behavior and this precludes the numerous mechanistic manipulations and direct measurements possible in in vitro models such as brain slices or the retinal preparation.
The current study used the isolated retina–eyecup preparation to examine tDCS-like current effects on the neurophysiology of a CNS structure. The isolated retina allows good localized control of current amplitude and polarity. This study first explored a range of positive and negative current amplitudes to change cell responses to On and Off light stimuli. The present study also used current amplitudes, polarity, and duration near thresholds found to modulate ganglion cell firing to light stimulation. We found that short-duration, low-amplitude currents produced a remarkable persistency of firing changes, up to 1.5 hours after cessation of current. Our findings support the use of the isolated retina preparation to explore the mechanisms of the acute and neuroplastic effects of tDCS purported to underlie lasting beneficial changes in humans. The retina model of brain tDCS effects may also help advance our understanding of CNS pathophysiology and treatment, as well as provide data on the response of the retina itself to electrical stimulation.
Materials and methods
All animals were maintained in accordance with the National Institute of Health Guide for the Care and Use of Laboratory Animals (NIH Publications No. 80-23, revised 1996), and the Global Statement on the Use of Animals in Research (Federation of European Neuroscience Societies, Japan Neuroscience Society, International Brain Research Organization, and Society for Neuroscience). All experimental procedures were approved by The University of Alabama at Birmingham (UAB) Institutional Animal Care and Use Committee. UAB is accredited by the American Association for Accreditation of Laboratory Animal Care. Retina preparations and electrophysiology methods were similar to those reported by Risner et al.29
Retina preparation
New Zealand albino rabbits (1.6–4.2 kg) of both sexes were dark adapted and anesthetized with urethane (2 g/kg i.p.; Sigma-Aldrich, St. Louis, MO, USA). The eyes were enucleated under dim red light and the animal euthanized with 1 mL Fatal Plus (i.v.; Vortech Pharmaceuticals, Dearborn, MI, USA). After removal, each eye was hemisected in refrigerated oxygenated bicarbonate-buffered (95% O2 and 5% CO2) Ames medium (Sigma-Aldrich), and the lens and vitreous removed. The resulting eyecup containing the retina was everted onto a domed chamber (Figure 1) where it was superfused with heated (35–38 °C) bicarbonate-buffered Ames medium (about 3.5 mL/min). Ganglion cell somas were visualized using Azure B (Sigma-Aldrich) solution, a few drops of which were added to the superfusate flowing over the retina at the beginning of recording.30 Under these conditions, retinas can remain responsive for 8 or more hours without rundown.
 | Figure 1 Recording configuration. Notes: The isolated eyecup preparation configuration consisted of the rabbit eyecup everted over a dome immersed in an Ames superfusion bath saturated with 95% O2, 5% CO2 flowing at 3 mL/min. Three-dimensional view (A) and diagram (B) of the electrode or electrode array recording from ganglion cells at the retinal surface. The stimuli were projected from a CRT monitor through the microscope objective (not shown). A silver–silver chloride ring at the bottom chamber served as the reference electrode for both recording and current injection. A stainless-steel wire immersed in the superfusion bath over the retina, ~3 mm above the recording electrode and surface of the retina, served as the other current injection electrode. Because the resistance of the saline superfusion solution is probably an order of magnitude less than the retina, most of the current (arrows) was tangential to the retina, and the effective currents through the retina were lower than the measured currents. Thus, the biggest effect of changes in current polarity was to change the direction of tangential current flow across the retina, with a lesser change in the direction of flow through the retina. Abbreviation: CRT, cathode ray tube. |
Ganglion cell recordings
Carbon-fiber glass-insulated electrodes with silver-plated tips or multielectrode array elements with tungsten or stainless-steel electrode wires were used to obtain recordings of light responses from ganglion cells in central and mid-peripheral inferior retina, typically from just below the visual streak of the rabbit retina. Some experiments used multielectrode arrays. One reason for using multielectrode arrays was that a larger number of cells could be tested for the very first current application epoch. A second reason was to observe changes in correlated firing induced by current application. One postulated effect of current application in neural networks is the reduction of membrane potential in an interneuron. The effect of this might be to increase correlated firing in neurons25 that receive input from the interneuron biased toward depolarization. The microelectrode array experiments allowed assessment of the effects of current application on correlated firing.31
Spike extractions from the analog recordings were performed by thresholding template convolved traces using MATLAB (Mathworks, Natick, MA, USA). Thresholded spikes were integrated, graphed, and analyzed for statistical significance using programs written for MATLAB. Ganglion cell activity (average spikes per second) that occurred within the 1,000 ms following the light spot stimulus was defined as the On epoch, and activity that occurred within the 1,000 ms after light spot offset was defined as the Off epoch. Activity occurring prior to spot onset was used to define the maintained (or baseline) epoch firing rate. This study reports only data runs where spike height and stability were maintained throughout the experiment, other than the obvious effects on spike time patterning at the onset and offset of current application.
Light stimuli, as described below, were projected from a cathode ray tube (CRT) monitor through the microscope objective onto the retinal surface. Current responses as a function of retinal location were not investigated because preliminary tests lacked strong evidence for loci-differential responding. Extracellularly recorded signals of spiking ganglion cells were amplified conventionally and digitally stored via a Measurement Computing data acquisition board (Measurement Computing Corp., Norton, MA, USA) and analyzed offline as described below.
Direct current application
The recording and electrical stimulus configurations are shown in Figure 1A. One current application electrode was a stainless-steel wire immersed in the superfusion bath over the retina placed near the recording electrode. This electrode was driven by a constant current source as either the anode or the cathode with respect to the reference electrode at the bottom of the recording chamber. As shown in Figure 1A, the reference electrode was a silver–silver chloride ring at the chamber bottom that served as both the ground/reference electrode for recording and as the return anode or cathode for current application. Current amplitude was controlled by a standard constant current source. Current was ramped up and down slowly from zero to the experimental settings (2.5–10 microamperes; µA) to avoid generating large artifacts in the recording electrode. Both polarities of the stainless-steel wire in the superfusion bath near the microelectrode with respect to the anode/ground ring were used. Preliminary experiments showed that high amplitude currents (~100 µA) tended to result in strong postcurrent suppression. Therefore, we used lower, near threshold currents for most data runs in this study.
The placement of the electrodes was designed to force a significant percentage of the current to flow through the retina. However, as shown in the diagram in Figure 1B, the majority of the current flow (arrows) was likely to have been tangential to the retina because the resistance of the saline superfusion solution could be an order of magnitude less than the retina. Thus, the effective currents through the retina were lower than the measured currents between electrodes, and the effect of switching current polarity was likely mostly a change in the direction of tangential current flow across the retina, with a lesser change in the direction of flow through the retina. In animal models, tangential currents have affected synaptic efficacy, based on the orientation of the axon with respect to the electric field.32
Obviously, even less control of the direction of current flow exists in human tDCS application because of the shunting of current flow by the scalp and supracortical space. Estimates have been made for tDCS effects being produced in humans at cortical electric fields on the order of millivolts per mm.15,25,33 We did not attempt to measure the electric field strength in the retina experiments. Instead, we empirically determined the minimum current amplitude that produced effects on the retinal ganglion cell responsiveness. The current shunting was much less in the isolated preparation than in human tDCS because of the shorter distance between electrodes and the tissue. The isolated eyecup current configuration yielded effective stimulation at currents orders of magnitude lower than those used in human tDCS (µA in retina vs mA over the scalp).
Visual stimuli display and receptive field mapping
White light stimuli were displayed on a standard CRT monitor (Samsung, model SyncMaster 15GLi, Seoul, South Korea) with 640×480 resolution and 60 or 85 Hz refresh rate. The displayed image was projected onto the retinal surface via reflection by a dichroic mirror in the optical pathway of the microscope (Nikon, model Optiphot-2, Tokyo, Japan), so that the visible spectrum, except far red, was focused by a 20× water objective (Nikon, 0.4 NI) on the retina. One mm on the retina corresponded to 500 pixels on the video monitor.
The background luminance (0 intensity) on the monitor before projection onto the retina was effectively black at 0.2 cd/m2, and the maximum luminance levels (255 intensity) as measured on the video screen before projection onto the retina was 29.3 cd/m2. The display of the stimuli on the monitor was driven by a custom-developed application (Zstim, Alex Zotov programmer, Vision Science Research Center, UAB) running on a Windows 7 Professional operating system (Microsoft, Redmond, WA, USA). Stimulus timing was verified by a photocell taped to the computer monitor.
Ganglion cells types were classified by the responses to light stimulation. First, the receptive field for each ganglion cell was “hand-mapped” by flashing small spots of light across the computer screen to determine the spatial extent of the receptive field. Cells were then stimulated with 1-second flashes of spots of various sizes and intensities and moving spots swept through the ganglion cell receptive field to determine the type of cell. Cell type was defined based on the stimulus size and intensity that evoked the strongest dominant (center) response with minimal, no antagonistic, or suppressive surround response. Ganglion cells with dominant transient or sustained responses to stimulus onset were identified as On cells. Ganglion cells with dominant transient or sustained responses to stimulus offset were defined as Off cells. The period of time during which the light stimulus was turned on was defined as the On epoch. The 1-second time period following light off was defined as the Off epoch. Assessment of class subdivisions such as transient versus sustained was made from latency and firing rate criteria derived from the peristimulus time histograms.34 To clearly differentiate cell types, On/Off indices were computed for each cell from the ratio of the number of spikes that occurred during light stimulation (On epoch) versus the number of spikes that occurred in the equivalent time period following light offset. Cells with an On–Off index > 1 for responses to spots up to 300 mm were defined as On cells. Transient/Sustained indices were used to further classify the light responses. The formula (B2 − C2)/(B2 + C2) with B2 = 1st 300 ms of the On response and C2 = 2nd 300 ms of the On response was used to determine whether the On component was transient or sustained. The formula (D2 − E2)/(D2 + E2) with D2 = 1st 300 ms of the Off response and E2 = 2nd 300 ms of the Off response was used to determine whether the Off component was transient or sustained. Cells with a Transient/Sustained index > 0.3 were considered to be Transient cells. Cells with a Transient/Sustained index < 0.3 were considered to be Sustained cells.
Experimental protocol and data analysis
The light-evoked responses of ganglion cells were recorded before, during, and after direct current application. Data runs consisted of a stimulus set of 15–30 rectangular light spots and annuli of various sizes and intensities presented in shuffled (pseudorandom) order. Each stimulus set took ~1 minute to present. Typically, 10–20 stimulus sets were presented prior to current application to establish baseline activity, approximately the same number during current application, then 25–50 sets to examine postcurrent effects. For each experimental stimulus in a stimulus set, recordings of ganglion cell activity typically included three epochs: 225 ms prior, 1,000 ms during, and 2,000 ms following light stimulus offset. The data runs used either anodal or cathodal polarity at a set current level for a set duration. Current levels ranged from 2.5 µA to 100 µA, application duration ranged from 5 to 10 minutes, and postcurrent effects were examined for up to 1.5 hours.
The figures presented represent responses elicited by the stimulus in the set that produced the highest firing rate. The rectangular stimulus was large enough to partly invade the surround of many ganglion cells and thus produced surround responses in antagonistic center-surround ganglion cells.
Peristimulus time histograms in the figures were normalized for the number of trials in each condition. Because the effects of the current application could linger for more than 1 hour, most figures depict the first data run in each retina unless otherwise noted. T-tests (MATLAB) and repeated-measures analysis of variance followed by Sidak’s corrections for multiple comparisons (Graphpad Prism 7, La Jolla Ca) determined differences between pre, during, and postcurrent epochs for each data run. Alpha was set at 0.05 for significance. Exact p values are reported.
Results
The results are from 21 cells with full data runs (baseline, during, and after current application) from single and multielectrode array recordings obtained from 11 retinas. Physiologically identified cell types included 11 Sustained On cells, four Transient On cells, three Sustained Off cells, and three Transient Off cells.
Example of changes in responsiveness during and following the application of current
An example of changes in the responsiveness of an Off-center ganglion cell before, during, and after +5 µA of current (superfusion wire positive with respect to bath ground) is shown in Figure 2. Figure 2A shows raster plots of the light evoked responses (spikes) to one of the spots in the stimulus set for each trial before light onset (green area), during light (blue area), and after light offset (pink area). Ten stimulus sets were presented to establish the baseline responses, followed by 10 stimulus sets with current applied (grey). Normalized average responses to the same stimulus were plotted as peristimulus time histograms in Figure 2B–D, with the average firing during the maintained, On, and Off epochs indicated by black, blue, and red, respectively.
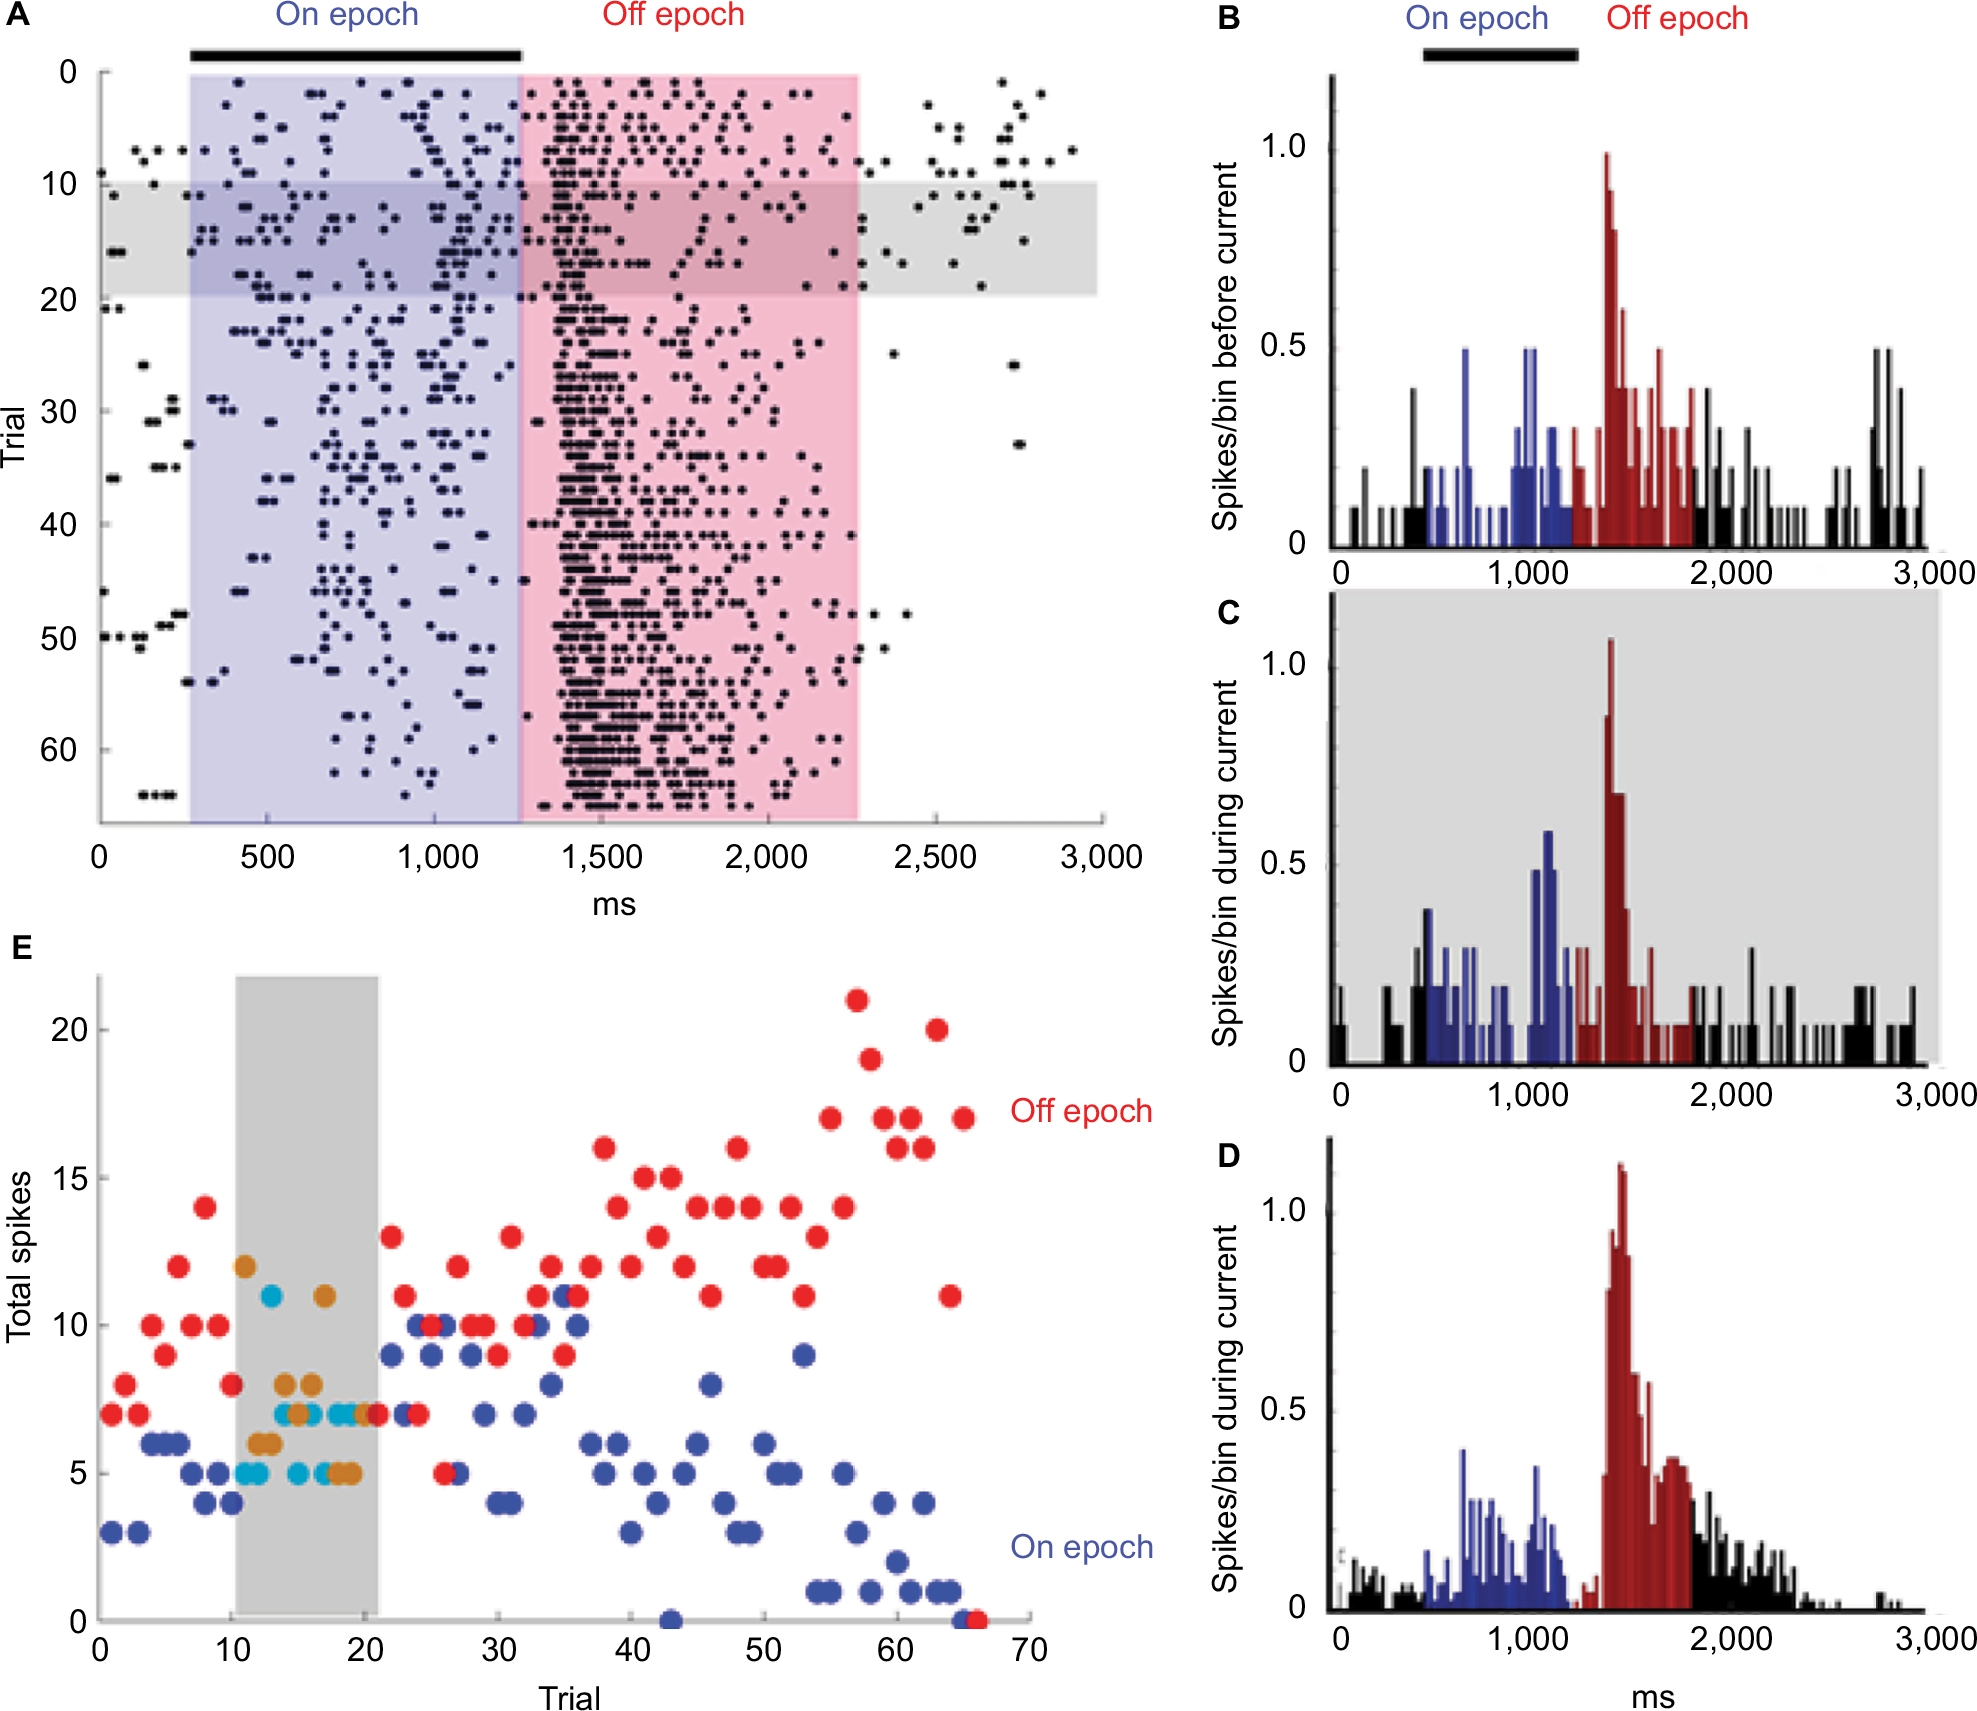 | Figure 2 An example of changes in responsiveness during and following the application of current. Notes: (A) Raster plots of the responses (spikes) to one of the spots in the stimulus set from a Sustained Off-center ganglion cell. The black bar represents the light stimulus (turned on after 250 ms of baseline recording). The On epoch was the period during the light stimulus (blue area) and the Off epoch was the period after light offset (red area). Each dot represents a single spike and each row represents one trial. Starting at the top, the first 10 trials were recorded before current was applied (horizontal grey bar). The next 10 trials show the responses during the +5 µA of current application. The additional 45 trials took place after the current was turned off. (B–D) Normalized average peristimulus histogram responses. (B) The responses to light stimuli (black bar) before +5 µA current application. (C) The responses to light stimuli during +5 µA current application. Firing during the On epochs (blue histograms) was slightly enhanced (p = 0.022), whereas firing during the Off epochs (red histograms) were unaffected. (D) However, after current cessation, the total firing during the On epoch declined (p = 0.024) and the firing during the Off epoch increased (p = 0.005) and became more sustained. (E) The total number of spikes during the light stimulus (On epoch, blue dots) and the total number of spikes in the 1,000 ms following the offset of the light stimulus (Off epoch; red dots) plotted for each trial over the duration of the experiment. These time series plots show that there was little effect on total firing during current application but that after current cessation the On response steadily declined and the Off response gradually increased over time. |
The raster plots in Figure 2A show that the responses to the offset of 200 μm spot stimulus (light red) became progressively more delayed and sustained over the 30 minutes recording period after current cessation. The histograms in Figure 2B–D show that normalized responses enhanced during the On epoch (p = 0.022), whereas the Off epoch was unaffected (panel C vs B). After current cessation, On responses were reduced (p = 0.024), while firing at light offset was stronger (p = 0.005) and more sustained. Time series plots in Figure 2E depicting the total responses per trial, also revealed that for this cell, the firing during the On epoch declined during the postcurrent time while the total number of spikes during the Off epoch increased. A change in the center-surround balance could be investigated as a potential mechanism for this result in future studies.
The responses of Sustained On cells to current application
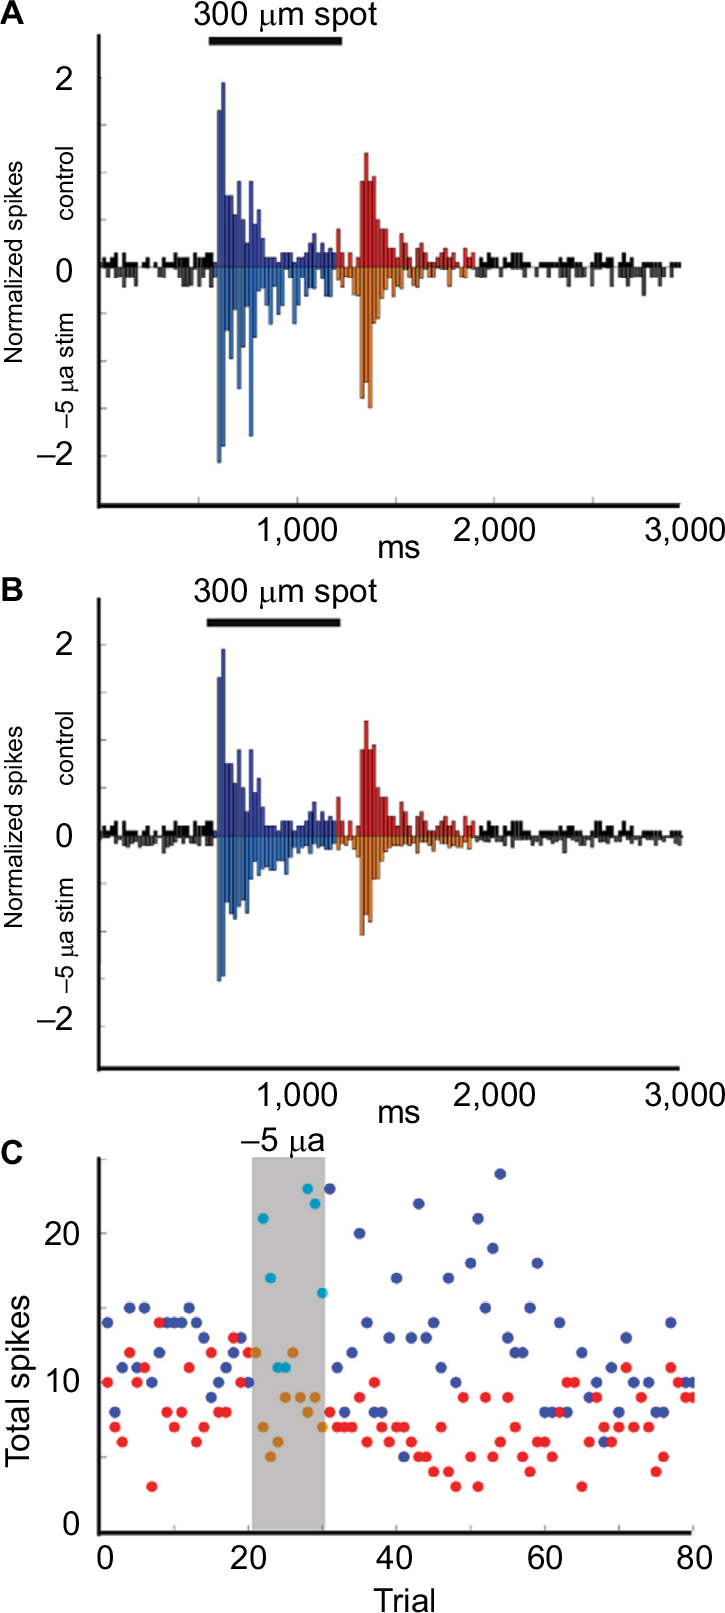
We recorded the changes in light responses for 11 Sustained On ganglion cells. Currents ranged from −5 µA to +5 µA and from 5 to 10 trials. The light-evoked responses of these cells were suppressed during and after the first stimulation for all but one of these cells, regardless of the amplitude or polarity of the current (Table 1). Figure 3 is a representative example. The histograms in Figure 3A and B show the normalized firing rate in response to the onset and offset of a 100 mm light stimuli during control trials (upper plot A, B) as compared with the responses during (inverted plot A) (p = 0.007) and after (inverted plot B) (p = 4.78E−9) application of 2.5 µA current for five trials. Time series plots in Figure 3C show that the total number of spikes in response to each light stimulus decreased during and after stimulation. Interestingly, if cells received subsequent rounds of stimulation or were recorded after the retina had been previously stimulated, the responses were likely to be enhanced after the second round of current application (Figure 4).
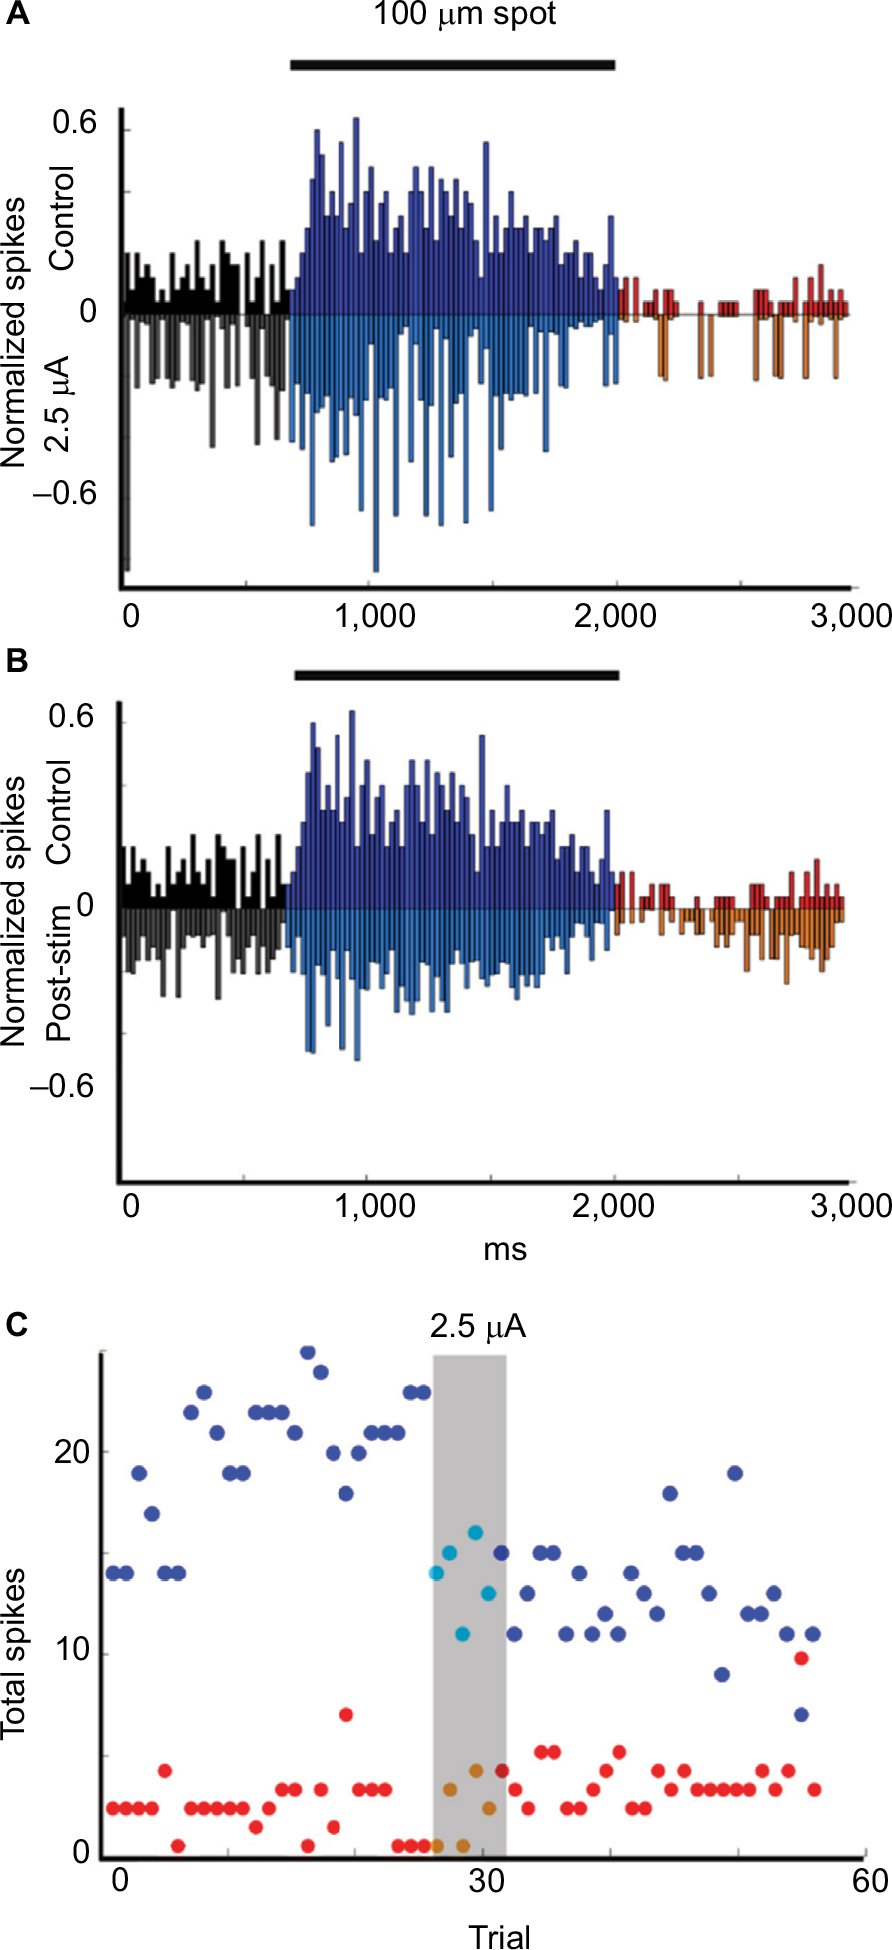 | Figure 3 Example of Sustained On cell responses to current application. Notes: (A, B) Upside-down plots show the normalized firing rate in response to the onset and offset of a 100-μm light stimuli during control trials (upper plot A, B) compared with the responses during (inverted plot A) and after (inverted plot B) application of 2.5 µA current application for five trials. Black = baseline firing, Blue = firing during On epoch, Red = firing during Off epoch. (C) Time series plots of the total number of On epoch spikes for each stimulus (blue dots), Off spikes for each stimulus (red dots) over the duration of the experiment show that the total firing for the On epoch was significantly decreased for each trial during (p = 0.007) and after (p = 4.78E−9) stimulation with 2.5 µA current. |
 | Figure 4 Effects of low current. Notes: Effects of low current (+2.5 and −2.5 µA) on responses and variation with spot size for a Sustained On cell recorded after the retina had received previous stimulation. (A) Time series plots of the spike totals by trial show increased firing in response to a bright (contrast 255) 200 μm spot during (first grey bar) and after current application. The response elevation was significant for both the On (blue dots, p = 0.0001) and Off (red dots, p = 0.0001) epochs. The elevation was more pronounced for the On responses and, while reduced after 20 minutes, the elevation lasted until application of −2.5 µA current (second grey bar). After subsequent application of −2.5 µA current, On light-evoked firing was indistinguishable from control levels. (B) Mirror image peristimulus time histogram plots show the responses prior to current application (top of the histograms), compared with responses after current application (bottom of histograms). Black = baseline firing, Blue = firing during On epoch, Red= firing during off epoch. After +2.5 µA current, both peak and Sustained On responses were enhanced and responses during the Off epoch were delayed and more sustained. After −2.5 µA current, both sets of responses were reduced. Bar over histograms is time during lights on. (C) Graphs depicting responses during the On epoch to stimuli of different sizes and intensities of stimuli show that the excitatory effects of +2.5 µA current application were greatest for the responses to the largest and brightest spots. In contrast, the responses to all stimuli were suppressed after −2.5 µA current application. |
 | Table 1 Summary of cell responses by cell type Notes: a+, increased stimulus-evoked firing; 0, no effect; -, decreased stimulus-evoked firing. |
The responses of Transient On cells to current application
We recorded the effects of currents ranging from −5 µA to +5 µA on the light-evoked responses of four Transient On cells. Application of +2.5 or +5 µA current for five trials suppressed the responses during current application, without affecting responses after cessation of the currents (n = 2). In contrast, when −5 µA current was applied for 10 trials (n = 2), responses were enhanced in response to current application, suggesting that either negative current flow or an increased level of stimulation is necessary for enhancement of light responses. Figure 5 is an example of increased firing in response to the application of −5 µA current over 10 trials. The normalized light-evoked firing rates increased during (p = 2.98E−9) and after (p = 4.44E−22) current application, whereas firing after light offset was suppressed during (p = 1.39E−4) and after (p = 2.86E−20) current application (Figure 5A and B). Time series plots (Figure 5C) indicate that the changes in firing occurred in the first trial after current onset and remained for at least 30 trials (~30 minutes) before returning to baseline levels.
 | Figure 5 Example of Transient On cell responses to current application. Notes: (A, B) Upside-down plots show the normalized firing rate in response to the onset and offset of a 300-μm light stimuli during control trials (upper plot A, B) compared with the responses during (inverted plot A) and after (inverted plot B) application of −5 µA current for 10 trials. Black = baseline firing, Blue = firing during On epoch, Red = firing during Off epoch. (C) Time series plots of the total number of On epoch spikes for each stimulus (blue dots), Off spikes for each stimulus (red dots) over the duration of the experiment show that the total firing for the On epoch was significantly increased for each trial during (p = 2.98E−9) and after (p = 4.44E−22) stimulation with −5 µA current, whereas the firing during the Off epoch was significantly decreased during (p = 1.39E−4) and after (p = 2.86E−20) stimulation. |
The responses of Sustained Off and Transient Off cells to current application
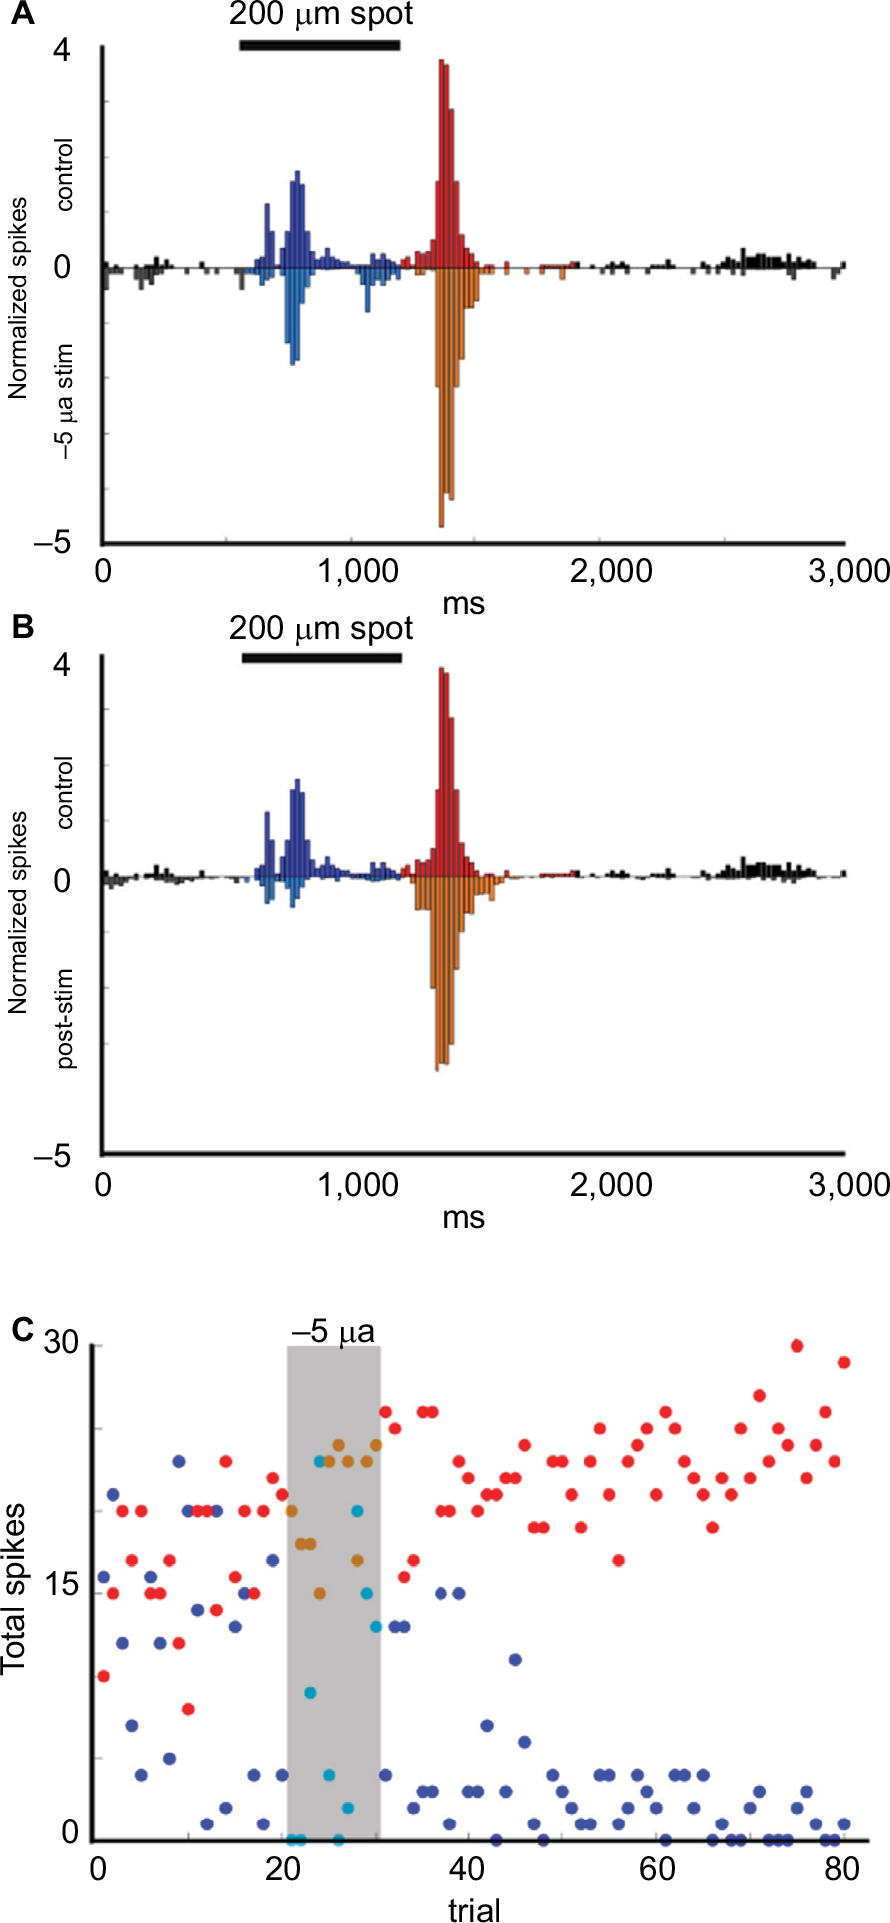
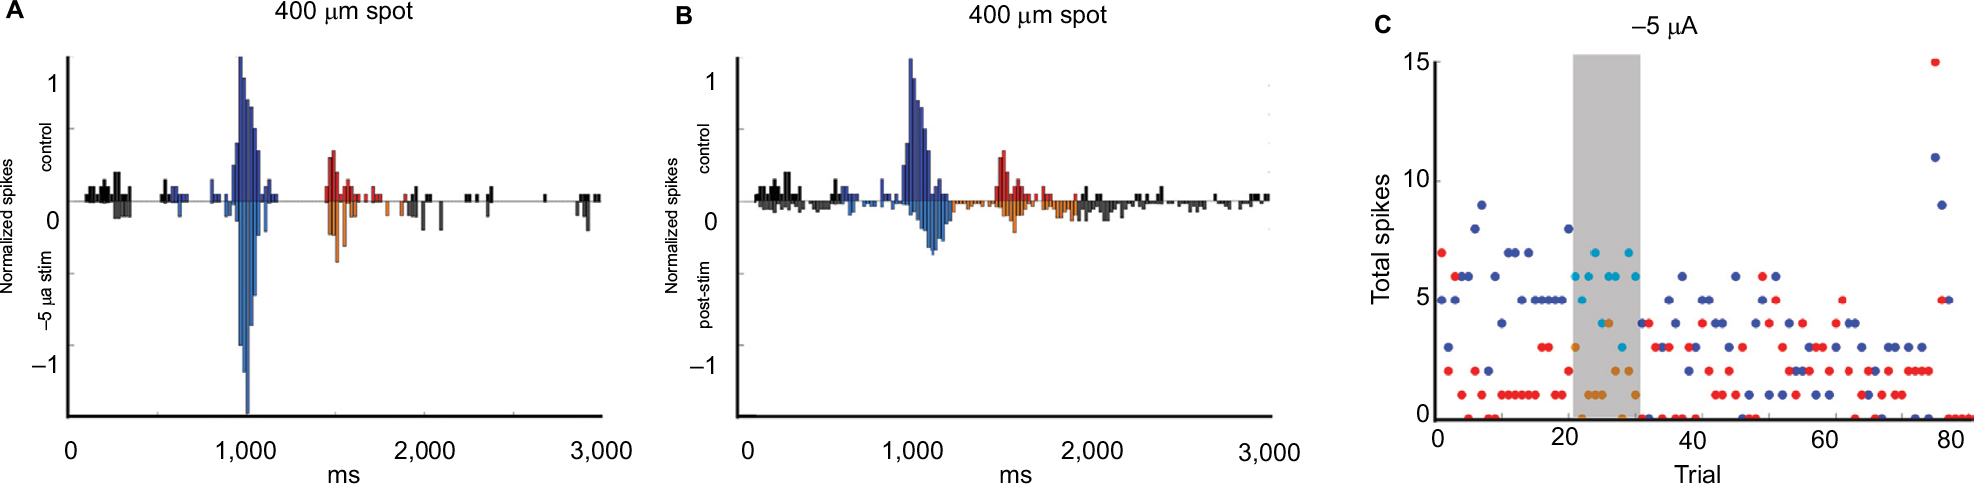
We recorded the responses of three Sustained Off cells and three Transient Off cells. The responses of both cell types varied with current amplitude and duration. Sustained Off cell firing in response to light offset was suppressed during and after the first-round current application (n = 2) independent of the polarity. Transient Off cell firing was enhanced during the application of −5 µA current (n = 2) but firing evoked by light offset could be either enhanced or suppressed. Application of positive or negative current enhanced the responses during the Off epoch of cells recorded subsequent to the first round of current stimulation (n = 2). Firing rate during the On epoch was consistently suppressed for all six Sustained and Transient Off cells.
Figure 6A and B show the suppression of responses during and after stimulation with −5 µA current for 10 trials (p = 2.09E−24 and p = 5.45E−33, respectively). Figure 6C shows time series plots of the total number spikes per trial. Off epoch responses began to recover toward baseline after ~40 minutes, whereas On epoch responses remained suppressed through the end of the recording period.
 | Figure 6 Example of Sustained Off cell responses to current application. Notes: (A, B) Upside-down plots show the normalized firing rate in response to the onset and offset of a 300 μm light stimuli during control trials (upper plot A, B) compared with the responses during (inverted plot A) and after (inverted plot B) application of −5 µA current for 10 trials. Black = baseline firing, Blue = firing during On epoch, Red = firing during Off epoch. (C) Time series plots of the total number of On epoch spikes for each stimulus (blue dots) and Off epoch spikes for each stimulus (red dots) over the duration of the experiment show that firing during both the On and Off epochs was significantly decreased after −5 µA current stimulation (p = 2.09E−24 and p = 5.45E−33, respectively). There was wide variability in total firing during the Off epoch in the trials immediately prior to electrical stimulation. However, current application immediately reduced the total number of spikes and reduced the apparent variability. Off epoch firing and variability increased after an additional 40 trials, whereas firing during the On epoch remained suppressed. |
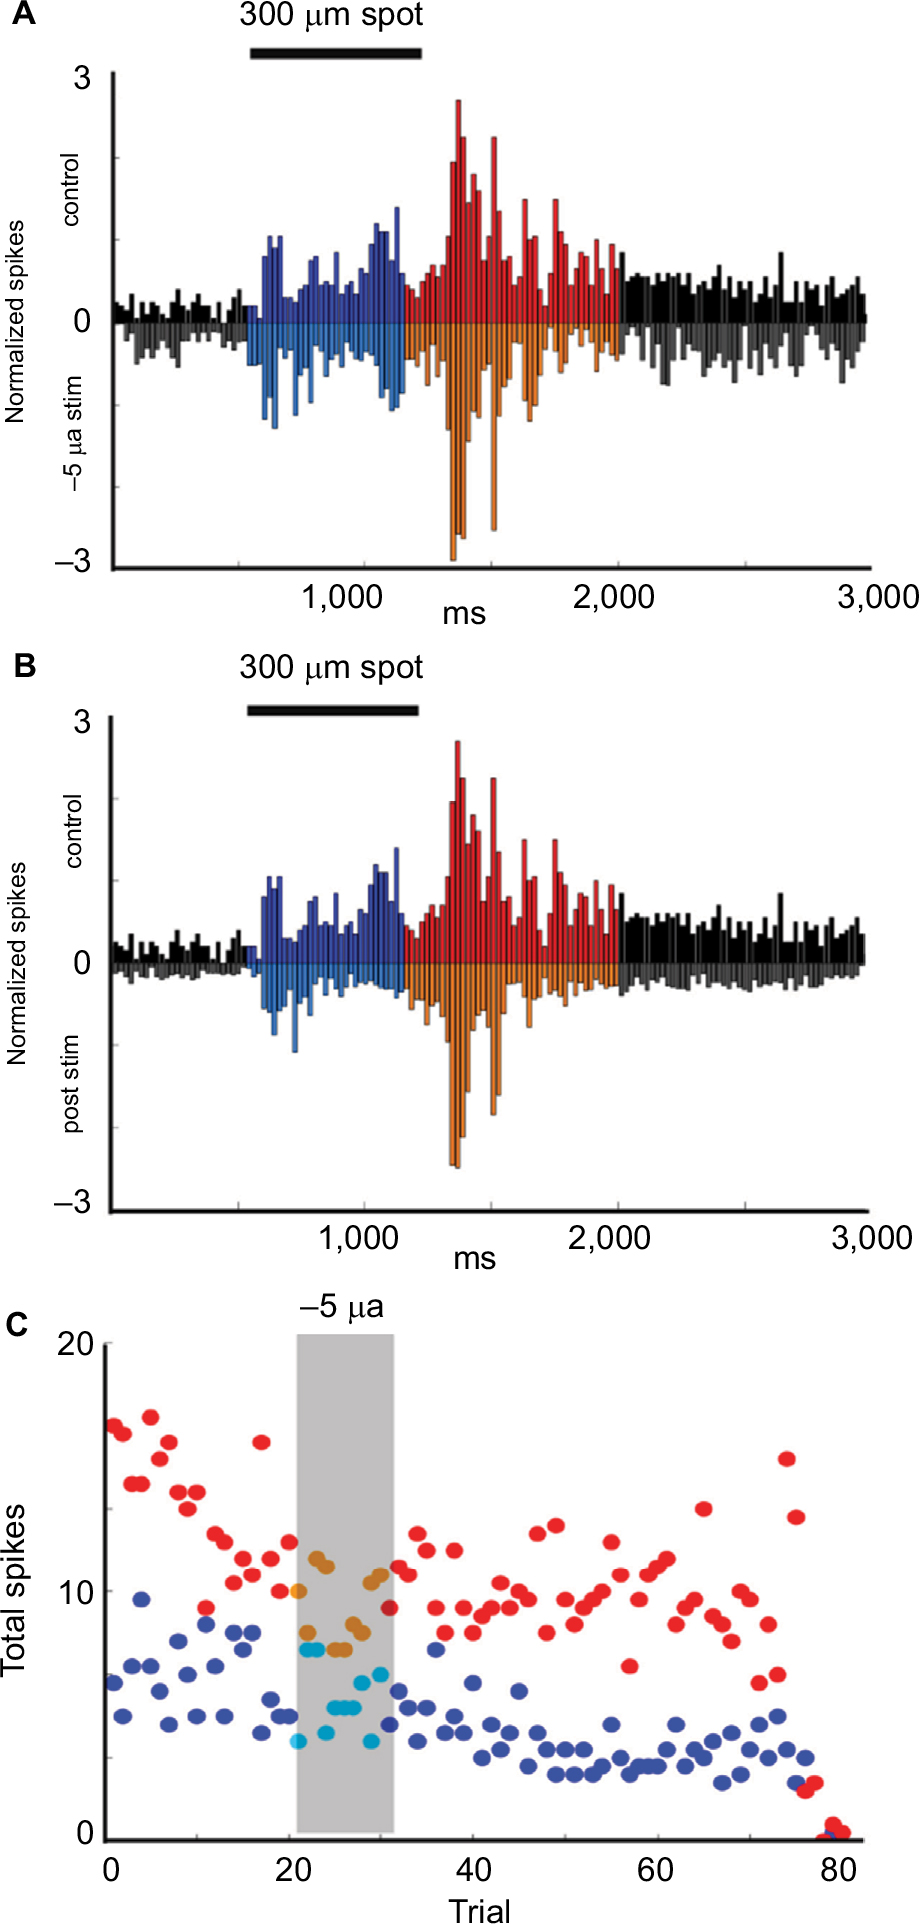
Figure 7A and B show the enhancement of responses during and after stimulation with −5 µA current for 10 trials. Figure 7C shows the time series plots. Firing evoked by light offset was enhanced during current application (p = 3.60E−13) and continued to increase (p = 3.92E−21) through the end of the recording period, while firing during the On epoch was suppressed (p = 1.83E−14).
 | Figure 7 Example of Transient Off cell responses to current application. Notes: (A, B) Upside-down plots show the normalized firing rate in response to the onset and offset of a 200 μm light stimuli during control trials (upper plot A, B) compared with the responses during (inverted plot A) and after (inverted plot B) application of −5 µA current for 10 trials. Black = baseline firing, Blue = firing during On epoch, Red = firing during Off epoch. (C) Time series plots of the total number of On epoch spikes for each stimulus (blue dots). Off spikes for each stimulus (red dots) over the duration of the experiment show that the total firing during the Off epoch was significantly increased both during (p = 3.60E−13) and after stimulation (p = 3.92E−21). On epoch firing was unaffected during current application and for ~20 trials after stimulation with –5 µA current, after which the firing was almost eliminated (p = 1.83E−14). |
Effects of repeated current application
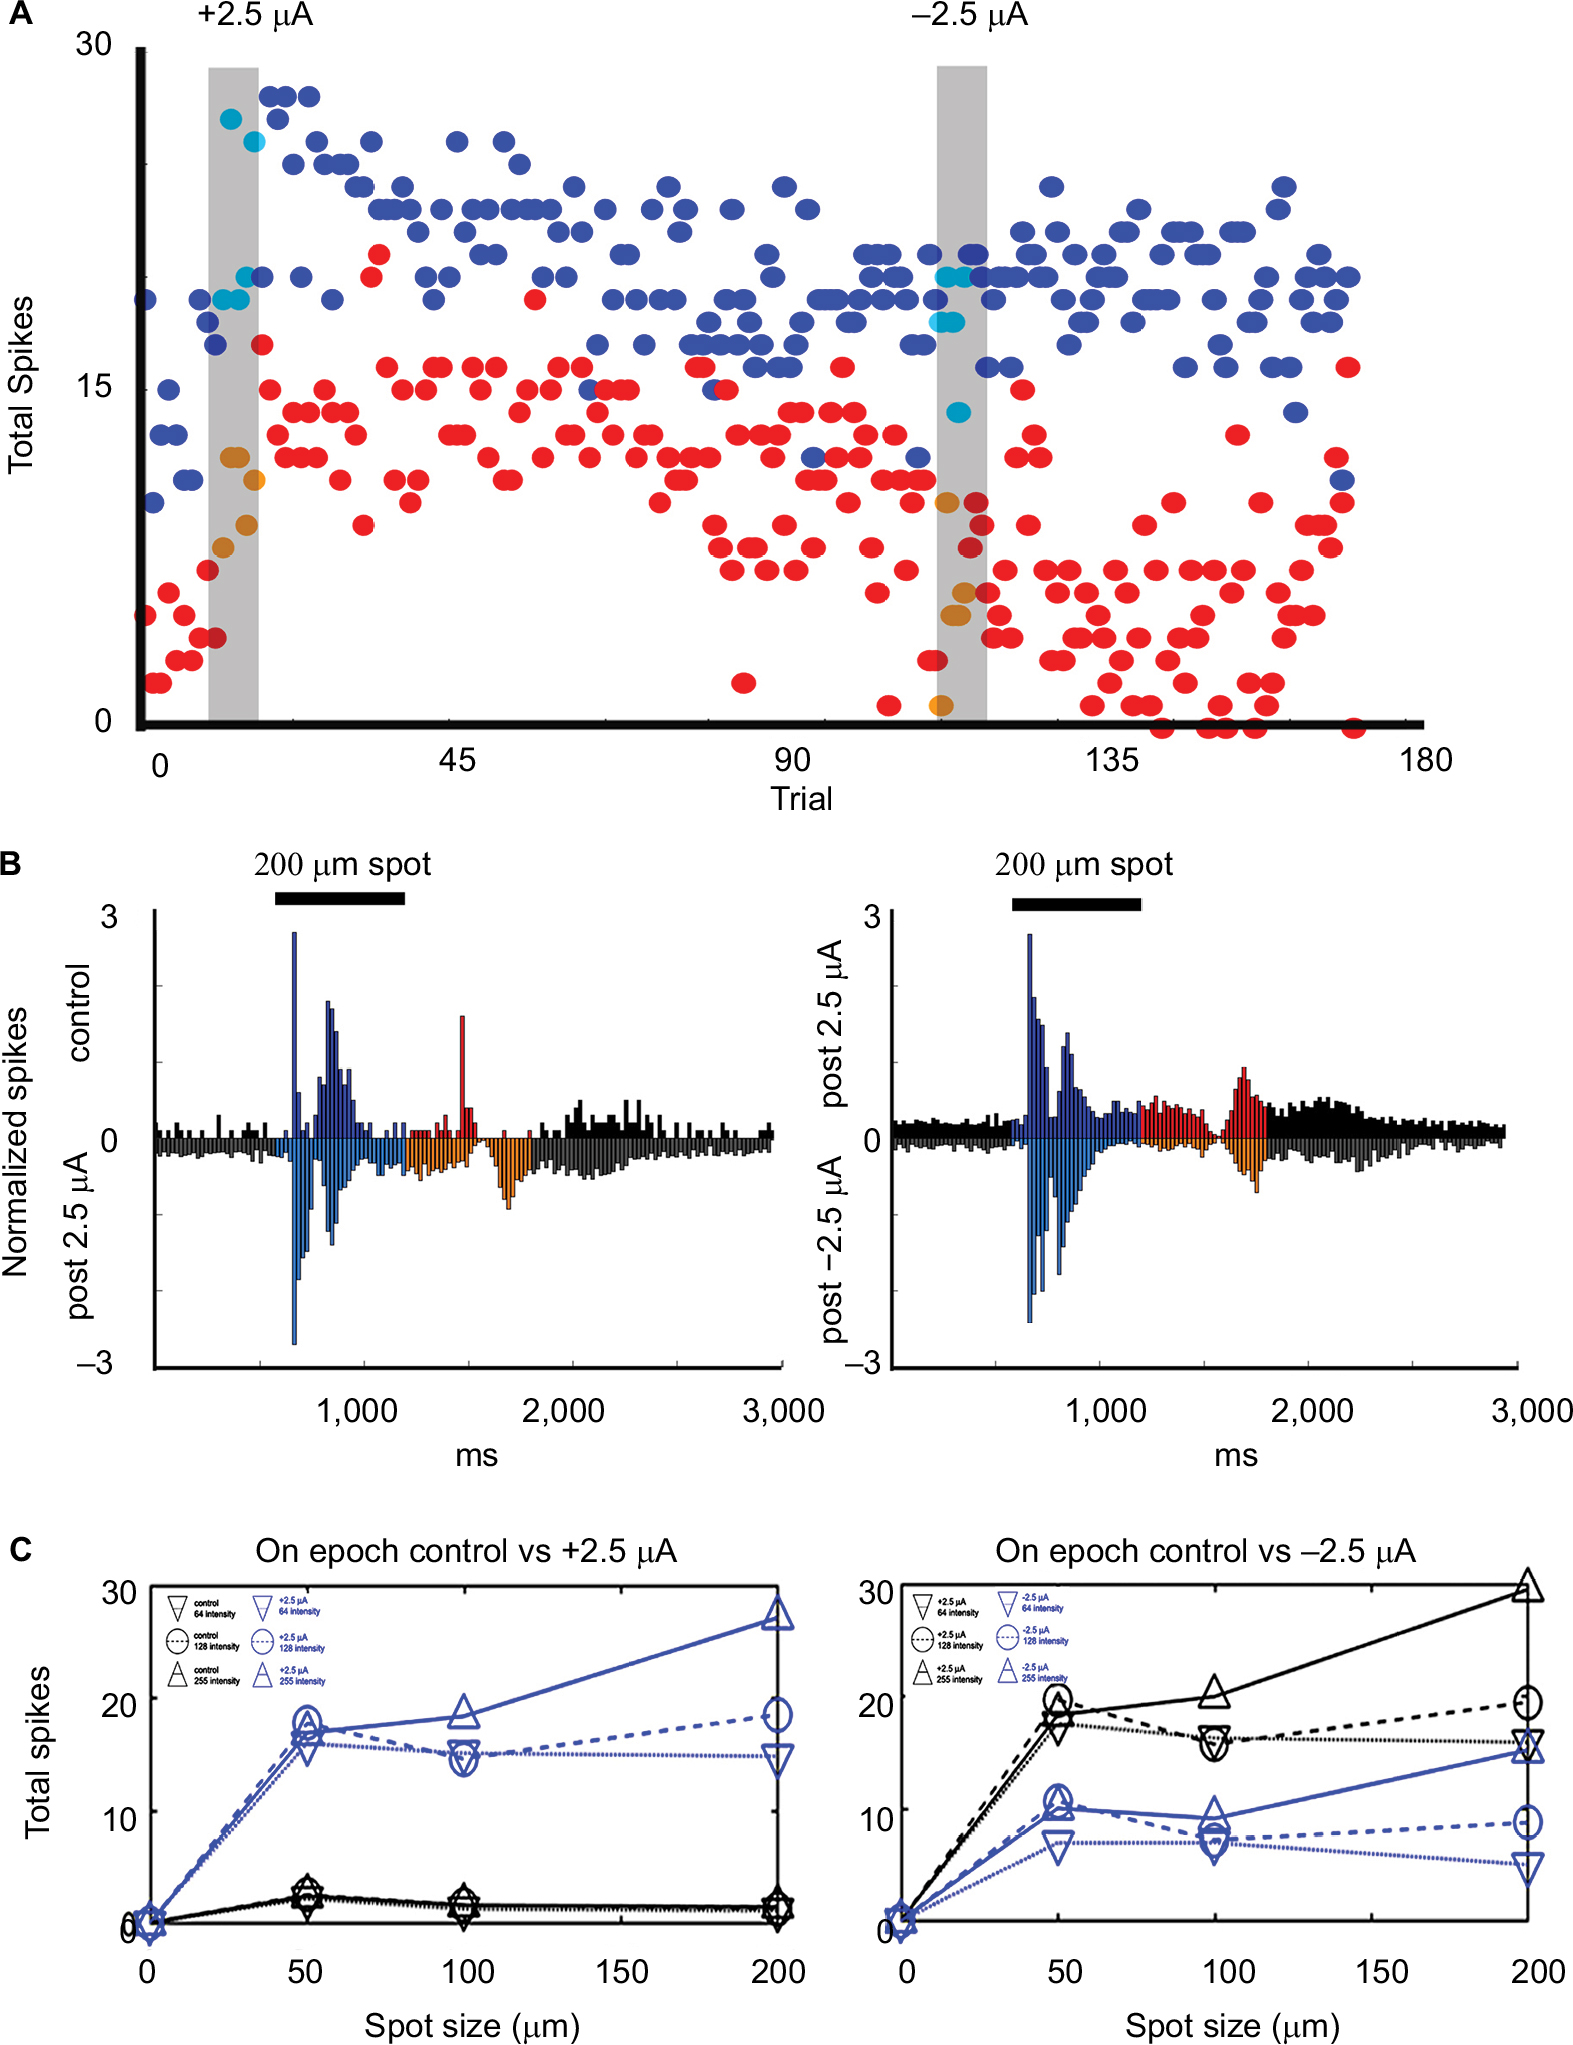
An example of the typical effects of the application of low current, + or −2.5 µA, after the retina had received previous stimulation is shown in Figure 4. In this experiment, the retina was allowed to recover from previous stimulation (five trials at +2.5 µA) for at least 1 hour before the cell was selected. After the cell was classified, we applied +2.5 µA, followed by a recovery period, then −2.5 µA. Time series plots of the average spike totals by trial showed that stimulation with +2.5 µA current (first grey bar) resulted in increased firing in response to a bright 200 mm spot during and after current application for both the On (p = 0.0001) and Off (p = 0.0001) epochs. Responses were reduced to control levels after subsequent application of −2.5 µA (Figure 4A). As was the case for most experiments with currents less than 15 µA, there was little modulation of the maintained activity during positive or negative current application.
As shown in Figure 4B, the peristimulus time histogram revealed that during light On, response was enhanced after +2.5 µA current application while the firing during the Off epoch was delayed (because of the loss of initial transient response) and more sustained. Figure 4C shows responses as a function of spot size and intensity. Responses were enhanced after +2.5 µA current application with greatest effects on responses to the largest and brightest spots, whereas responses to the stimuli decreased after −2.5 µA current application.
Effect of postcurrent amplitude on retinal ganglion cell responses
An experiment that tested incrementing levels of current is shown in Figure 8. The peristimulus time histograms of the light-evoked responses of an On–Off cell show that +2.5 µA current application significantly increased both the On (p = 0.0001) and the Off (p = 0.0001) responses to a 200 mm spot. After 30 minutes without current, subsequent application of +5 µA current reduced postcurrent firing rates back to near that of baseline. After 30 minutes without current, subsequent application of +10 µA current, both On and Off responses were reduced. The Off response remained slightly elevated with respect to control (p = 0.027) and the On response was almost completely eliminated. Other ganglion cells had similar nonmonotonic relationships to increasing current and subsequent responses.
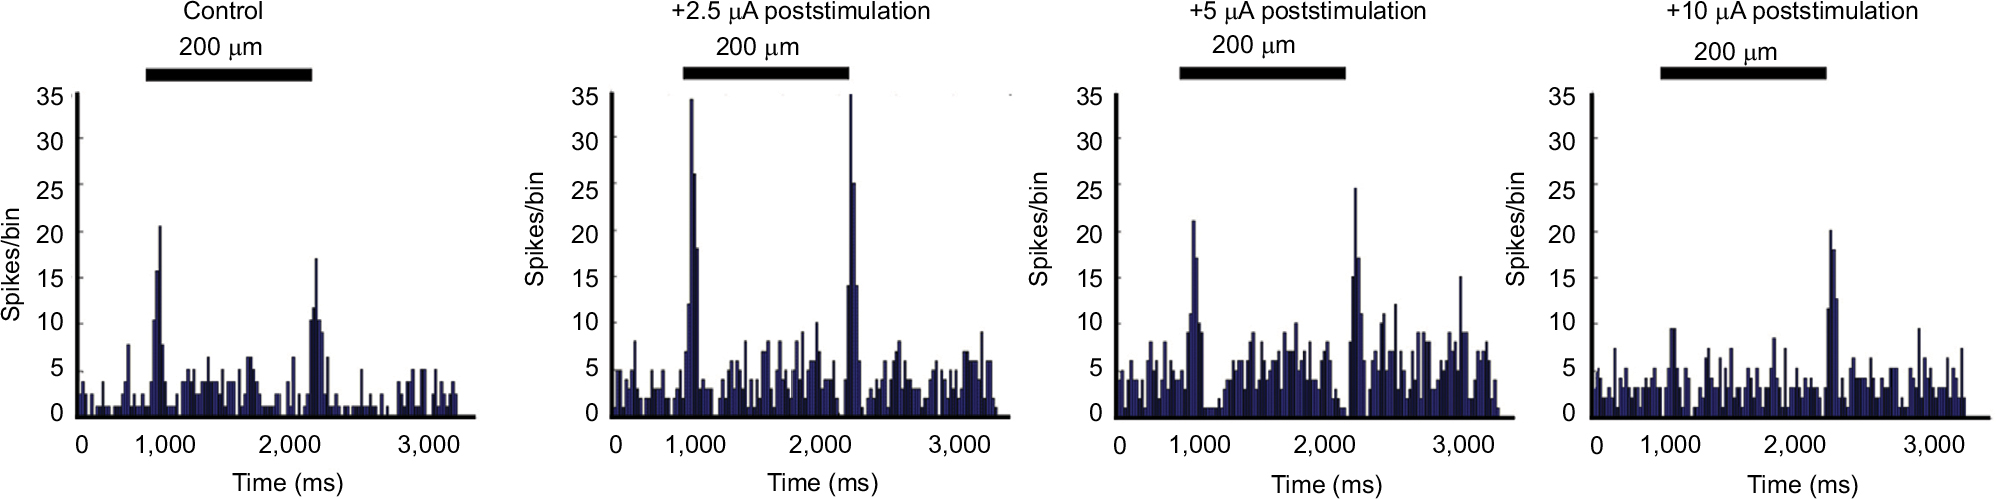 | Figure 8 Differential effects of current amplitude. Notes: Peristimulus histograms of the responses of an On–Off ganglion cell at baseline and following brief current injections at increasing amplitudes of current. Bar over histograms is time during light stimuli. Comparison of the first to second histogram shows that application of +2.5 µA current significantly increased On (p = 0.0001) and Off (p = 0.0001) responses to flashes of a 200 µm spot as well as the baseline firing rate (maintained epoch; p=0.0027). After subsequent application of +5 µA current, the baseline firing remained significantly elevated with respect to control (p = 0.0001). However, while the peak On component of the light responses returned to control levels, the total firing during the On epoch (p = 0.0001) and responses during the Off epoch remained elevated with respect to control (p = 0.001) but diminished with respect to the Off responses after the first +2.5 µA stimulation. After five trials of +10 µA current application, the firing rate and Off responses remained slightly elevated with respect to control (p = 0.0001 and p = 0.027), whereas the On component of the light responses was almost completely eliminated. |
Latency changes in ganglion cells responses during and after current application
Figure 9A shows the difference in firing pattern between baseline and during −5 µA current application for an On-center ganglion cell. In contrast to previous results in which we did not observe notable firing changes during current application, here the total number of spikes increased (p = 0.001) (also noted on the grey area of the far-right panel) and rise and fall times were faster. As soon as the current was turned off, the number of light-evoked spikes declined (On p = 0.0006, Off p = 0.0001) and latency was delayed (Figure 9A). Figure 9C shows the time series total On and Off light responses depicting the immediate drop in firing after current cessation (after grey bar). The plots of spike totals by trial show that On responses were high during current application (five trials, grey bars) after which the response magnitude and variability were suppressed for at least 40 minutes.
 | Figure 9 Latency changes in response to current application. Notes: On response delay after current application. (A) Peristimulus time histograms before current application (top) versus during −5 µA current application (bottom). (B) Peristimulus time histograms before current application (top) vs postcurrent application (bottom). (C) On (blue dots) and off (red dots) epoch responses pre-, during (grey bar), and after application of −5 µA current for 10 trials. Black = baseline firing, Blue = firing during On epoch, Red = firing during off epoch. During current application, the total number of spikes increased in the On epoch (p = 0.001) compared with control levels. After current application, the total number of spikes immediately decreased (On p = 0.0006, Off p = 0.0001) and the firing in response to light onset was delayed by 120 ms relative to the timing of the response prior to current application. |
Changes in correlated firing
Although the data are not shown, we did not find significant increases in correlated firing either during current application or afterward. The only two examples where correlated firing increased moderately during current and recovery were two cases where the ganglion cell responses increased significantly during current application. Our results indicate that significant effects on the magnitude and pattern of On and Off responses can be induced by current stimulation without simultaneous increases in correlated or synchronous firing either during or after the current application epoch.
Discussion
This study examined the effect of µA current applications on ganglion cell responses in the isolated retina. The twofold motivations of this study were to assess the effects of tDCS-like stimulation on the retina itself and to test the retina as a cellular model for CNS effects. The isolated retina-eyecup is unique in that maintained firing and stimulus driven activity are relatively normal compared to brain slices or some anesthetized preparations. This preparation allows for the investigation of specific, stimulus-driven responses at the cellular level that is not possible in the behavioral studies that dominate the tDCS literature. The ability to study changes in an intact well-defined sensory circuit in vitro will enable the direct assessment of the effects and mechanisms of tDCS.
One of the most significant findings in the present study was that electric current as weak as 2.5 µA produced measurable effects on ganglion cell postcurrent responsiveness. Response suppression was more common. However, the typical current amplitude and polarity that resulted in activation was −5 µA or, in some cases, a second application of current. These results parallel human tDCS experiments wherein amounts of current applied are enough to produce behavioral changes after stimulation with very subtle, if any, effects during current application and with reports that more than one administration of tDCS enhance behavioral outcomes.35,36 We found that the threshold current to induce changes in the response to light stimuli in the isolated retina-eyecup was nearly a 1,000-fold less than the 2 mA currents typically administered in human tDCS studies. However, the isolated configuration is likely to incur far less shunting than human tDCS experiments.33
A second significant finding was that even a single 5-minute instance of low current application was capable of affecting the response properties of neurons for up to 1.5 hours, the longest period tested. Prolonged postcurrent stimulation effects are consistent with measurable effects in human behavior following cessation of tDCS application.2–7
Third, we found that the effect of current amplitude and polarity on changes in ganglion cell responsiveness was complex. We found that high amplitude currents (~100 µA) in preliminary experiments tended to result in strong postcurrent suppression which is consistent with published data that suggest refractory states induced by high direct current density can result in decreased neuronal responses in animal studies.17 So we used lower, near threshold currents for most data runs in this study. The responses of Sustained cells were consistently suppressed during the first round of current application, but responses could be enhanced after subsequent rounds of stimulation. The decreased responsiveness at low current amplitudes suggest that the mechanism of suppression may be related to subtle effects on membrane voltages within cellular compartments (as reviewed in Jackson et al17) and is consistent with the observation that first round suppression was independent of current direction, amplitude, or number of trials. However, the light responses of Transient cells were likely to be enhanced by negative currents, and unaffected or suppressed by first round positive currents. These patterns suggest that activating currents were influenced by the orientation of the retina and ganglion cell axons with respect to the stimulating and ground electrodes.
In many experiments, the On and Off responses of the same ganglion cell were differentially affected, particularly those evoked by larger light stimuli that produced both center and antagonistic surround responses. When the light responses were differentially affected, it was most frequently the dominant center response that was enhanced. That is, for On-center cells, firing during the On epoch was enhanced and firing during the Off epoch was suppressed and vice versa. This suggests that current application might refine the center surround balance for some concentric ganglion cells.
The effects of current polarity and amplitude may be complex because the retinal circuitry is complex. It is likely that electric current has multiple effects at different thresholds on different cell types making both excitatory and inhibitory contributions to the responses of integrating neurons like retinal ganglion cells. Potential mechanisms may include effects on gamma-aminobutyric acid, glutamate,37 and BDNF.38 Some studies have also suggested that axonal orientation mediates the response dependence on current polarity.32 Endogenous electric fields in the CNS have also been shown to have effects on neural excitability.39
Studying the effects of tDCS-like currents on hippocampal slice and other slice preparations requires either electrical or pharmacological stimulation that does not fully mimic the full complement of normal inputs and operation of the underlying neural circuitry. The use of light stimulation in the retina uses native retinal signal transduction mechanisms. The retina is an immunoprotected CNS structure, derived from the diencephalon during neural development. Although the mechanisms may be different in the local circuitry and the full complement of neurotransmitters differs from brain region to brain region, all neurons have basic electrical properties and mechanisms of integrating graded input to reach the threshold for firing.
We posit that the differential sensitivity of retinal circuits to tDCS stimulation underlies the heterogeneity of the effects we observed from tDCS stimulation in different retinal ganglion cell classes. Because the specific layers and cell types differ between the retina and the rest of the brain, direct comparisons of the effects of electrical stimulation across different CNS regions will be important in future studies. The effects of electrical fields on carbachol-induced activity have been investigated in hippocampal slices.15,17 Because carbachol also facilitates activity in rat brain slices, 25,40 and many inner retinal neurons express cholinergic receptors,41,42 the effects of electrical stimulation on carbachol-induced activity can be assessed in rat hippocampal slices, rat cortical slices, and the isolated rat retina. This would allow direct comparison of the effects of electrical current on evoked activity across three in vitro preparations from the same species.
There were limitations in this study. The sample of ganglion cell classes did not include enough cells of any one class to yield a clear picture of response-dependence on current polarity, amplitude, and duration that may be specific to each class or to allow calculations of the effect size. The study also did not examine effects that may have occurred beyond 1.5 hours. In addition, the isolated retina cannot be maintained in vitro over the weeks or months to assess effects as is possible in humans to study putative neuroplastic effects.
Conclusion
It is important to understand the cellular mechanisms of tDCS because this neuromodulation technique is being investigated to modify behavior and treat a myriad of medical conditions and psychiatric disorders.5 Elucidating cellular mechanisms can help optimize parameters for greater treatment efficacy, help explain individual differences in responses to tDCS, and clarify equivocal findings within some applications, for example, eating behavior (Ray et al43 for summary) or lead to outcomes that are directly translatable to the treatment of retinal diseases. The determination of these effects in the well-known circuitry and neurochemistry of the retina can reveal cellular mechanisms modulated by electric current stimulation and suggest novel pharmacological and neuromodulation targets to enhance the treatment potential of tDCS.
Acknowledgments
This work was supported by a VSRC core (UAB Vision Science Research Center, grant P30 EY003039), National Science Foundation (grant IOS 0622318), National Institute of Digestive and Kidney Diseases (NIDDK) (grant P30DK056336), and an NORC predoctoral National Heart, Lung, and Blood Institute (NHLBI) (grant T32HL105349, Nutrition and Obesity Research Center). The content is solely the responsibility of the authors and does not necessarily represent the official views of the NIDDK, NHLBI, or National Institutes of Health (NIH). Alex Zotov wrote the code for Zstim, the retinal stimulation program, supported by the VSRC core.
Author contributions
Author contributions: FRA conceived the project. CES and FRA equally designed and performed specific experiments, analyzed data (Matlab code written by FRA), and drafted the manuscript. MKR and MMB contributed to data interpretation and manuscript preparation. All authors contributed toward data analysis, drafting and revising the paper and agree to be accountable for all aspects of the work.
Disclosure
The authors report no conflicts of interest in this work.
References
Esmaeilpour Z, Schestatsky P, Bikson M, et al. Notes on human trials of transcranial direct current stimulation between 1960 and 1998. Front Hum Neurosci. 2017;11:71. | ||
Cappon D, Jahanshahi M, Bisiacchi B. Value and efficacy of transcranial direct current stimulation in the cognitive rehabilitation: a critical review since 2000. Front Neurosci. 2016;10:157. | ||
Dedoncker J, Brunoni AR, Baeken C, Vanderhasselt MA. A systematic review and meta-analysis of the effects of transcranial direct current stimulation (tDCS) over the dorsolateral prefrontal cortex in healthy and neuropsychiatric samples: influence of stimulation parameters. Brain Stimul. 2016;9(4):501–517. | ||
Hashemirad F, Zoghi M, Fitzgerald PB, Jaberzadeh S. The effect of anodal transcranial direct current stimulation on motor sequence learning in healthy individuals: a systematic review and meta-analysis. Brain Cogn. 2016;102:1–12. | ||
Kekic M, Boysen E, Campbell IC, Schmidt U. A systematic review of the clinical efficacy of transcranial direct current stimulation (tDCS) in psychiatric disorders. J Psychiatr Res. 2016;74:70–86. | ||
Burgess EE, Sylvester MD, Morse KE, et al. Effects of transcranial direct current stimulation (tDCS) on binge eating disorder. Int J Eat Disord. 2016;49(10):930–936. | ||
Ding Z, Li J, Spiegel DP, et al. The effect of transcranial direct current stimulation on contrast sensitivity and visual evoked potential amplitude in adults with amblyopia. Sci Rep. 2016;6:19280. | ||
Tagami Y, Kurimoto T, Miyoshi T, Morimoto T, Sawai H, Mimura O. Axonal regeneration induced by repetitive electrical stimulation of crushed optic nerve in adult rats. Jpn J Ophthalmol. 2009;53(3):257–266. | ||
Henrich-Noack P, Lazik S, Sergeeva E, et al. Transcorneal alternating current stimulation after severe axon damage in rats results in “long-term silent survivor” neurons. Brain Res Bull. 2013;9:7–14. | ||
Ciavatta VT, Mocko JA, Kim MK, Pardue MT. Subretinal electrical stimulation preserves inner retinal function in RCS rat retina. Mol Vis. 2013;19:995–1005. | ||
Hanif AM, Kim MK, Thomas JG, et al. Whole-eye electrical stimulation therapy preserves visual function and structure in P23H-1 rats. Exp Eye Res. 2016;149:75–83. | ||
Mocko JA, Kim M, Faulkner AE, Cao Y, Ciavatta VT, Pardue MT. Effects of subretinal electrical stimulation in mer-KO mice. Invest Ophthalmol Vis Sci. 2011;52(7):4223–4230. | ||
Pardue MT, Ciavatta VT, Hetling JR. Neuroprotective effects of low level electrical stimulation therapy on retinal degeneration. Adv Exp Med Biol. 2014;801:845–851. | ||
Vigod S, Dennis CL, Daskalakis Z, et al. Transcranial direct current stimulation (tDCS) for treatment of major depression during pregnancy: study protocol for a pilot randomized controlled trial. Trials. 2014;15:366. | ||
Bikson M, Grossman P, Thomas C, et al. Safety of transcranial direct current stimulation: evidence based update 2016. Brain Stimul. 2016;9(5):641–661. | ||
Wagner T, Valero-Cabre A, Pascual-Leone A. Noninvasive human brain stimulation. Annu Rev Biomed Eng. 2007;9:527–565. | ||
Jackson MP, Rahman A, Lafon B, et al. Animal models of transcranial direct current stimulation: methods and mechanisms. Clin Neurophysiol. 2016;127(11):3425–3454. | ||
Anastassiou CA, Montgomery SM, Barahona M, Buzsáki G, Koch C. The effect of spatially inhomogeneous extracellular electric fields on neurons. J Neurosci. 2010;30(5):1925–1936. | ||
Nasseri P, Nitsche MA, Ekhtiari H. A framework for categorizing electrode montages in transcranial direct current stimulation. Front Hum Neurosci. 2015;9:54. | ||
McCaig CD, Rajnicek AM. Electrical fields, nerve growth and nerve regeneration. Exp Physiol. 1991;76(4):473–494. | ||
Antonenko D, Schubert F, Bohm F, et al. tDCS-induced modulation of GABA levels and resting-state functional connectivity in older adults. J Neurosci. 2017;37(15):4065–4073. | ||
Rosenkranz K, Nitsche MA, Tergau F, Paulus W. Diminution of training-induced transient motor cortex plasticity by weak transcranial direct current stimulation in the human. Neurosci Lett. 2000;296(1):61–63. | ||
Liebetanz D, Nitsche MA, Tergau F, Paulus W. Pharmacological approach to the mechanisms of transcranial DC-stimulation-induced after-effects of human motor cortex excitability. Brain. 2002;125(Pt 10):2238–2247. | ||
Fritsch B, Reis J, Martinowich K, et al. Direct current stimulation promotes BDNF-dependent synaptic plasticity: potential implications for motor learning. Neuron. 2010;66(2):198–204. | ||
Ozen S, Sirota A, Belluscio MA, et al. Transcranial electric stimulation entrains cortical neuronal populations in rats. J Neurosci. 2010;30(34):11476–11485. | ||
Bączyk M, Jankowska E. Presynaptic actions of transcranial and local direct current stimulation in the red nucleus. J Physiol. 2014;592(Pt 19):4313–4328. | ||
Ames A 3rd, Nesbett FB. In vitro retina as an experimental model of the central nervous system. J Neurochem. 1981;37(4):867–877. | ||
Masland RH. The neuronal organization of the retina. Neuron. 2012;76(2):266–280. | ||
Risner ML, Amthor FR, Gawne TJ. The response dynamics of rabbit retinal ganglion cells to simulated blur. Vis Neurosci. 2010;27(1–2):43–55. | ||
Amthor FR, Keyser KT, Dmitrieva NA. Effects of the destruction of starburst-cholinergic amacrine cells by the toxin AF64A on rabbit retinal directional selectivity. Vis Neurosci. 2002;19:495–509. | ||
Amthor FR, Tootle JS, Yildirim A. A new transparent multi-unit recording array system fabricated by in-house laboratory technology. J Neurosci Methods. 2003;126(2):209–219. | ||
Kabakov AY, Muller PA, Pascual-Leone A, Jensen FE, Rotenberg A. Contribution of axonal orientation to pathway-dependent modulation of excitatory transmission by direct current stimulation in isolated rat hippocampus. J Neurophysiol. 2012;107(7):1881–1889. | ||
Miranda PC, Lomarev M, Hallett M. Modeling the current distribution during transcranial direct current stimulation. Clin Neurophysiol. 2006;117(7):1623–1629. | ||
Amthor FR, Takahashi ES, Oyster CW. Morphologies of rabbit retinal ganglion cells with concentric receptive fields. J Comp Neurol. 1989;280(1):72–96. | ||
Barbieri M, Negrini M, Nitsche MA, Rivolta D. Anodal-tDCS over the human right occipital cortex enhances the perception and memory of both faces and objects. Neuropsychologia. 2016;81:238–244. | ||
Hill AT, Rogasch NC, Fitzgerald PB, Hoy KE. TMS-EEG: a window into the neurophysiological effects of transcranial electrical stimulation in non-motor brain regions. Neurosci Biobehav Rev. 2016;64:175–184. | ||
Das S, Holland P, Frens MA, Donchin O. Impact of transcranial direct current stimulation (tDCS) on neuronal functions. Front Neurosci. 2016;10:550. | ||
Podda MV, Cocco S, Mastrodonato A, et al. Anodal transcranial direct current stimulation boosts synaptic plasticity and memory in mice via epigenetic regulation of Bdnf expression. Sci Rep. 2016;6:22180. | ||
Buzsaki G, Anastassiou CA, Koch C. The origin of extracellular fields and currents: EEG, ECoG, LFP and spikes. Nat Rev Neurosci. 2012;13(6):407–420. | ||
Kilb W, Luhmann HJ. Carbachol-induced network oscillations in the intact cerebral cortex of the newborn rat. Cereb cortex. 2003;13(4):409–421. | ||
Keyser KT, Wotring V, Strang CE. The role of acetylcholine and its receptors in retinal processing. In: Stein JP, editor. Reference Module in Neuroscience and Biobehavioral Psychology. Elsevier; New York City, NY. 2017. | ||
Strang CE, Long Y, Gavrikov KE, Amthor FR, Keyser KT. Nicotinic and muscarinic acetylcholine receptors shape ganglion cell response properties. J Neurophysiol. 2015;113(1):203–217. | ||
Ray MK, Sylvester MD, Osborn L, et al. The critical role of cognitive-based trait differences in transcranial direct current stimulation (tDCS) suppression of food craving and eating in frank obesity. Appetite. 2017;116:568–574. |
 © 2018 The Author(s). This work is published and licensed by Dove Medical Press Limited. The full terms of this license are available at https://www.dovepress.com/terms.php and incorporate the Creative Commons Attribution - Non Commercial (unported, v3.0) License.
By accessing the work you hereby accept the Terms. Non-commercial uses of the work are permitted without any further permission from Dove Medical Press Limited, provided the work is properly attributed. For permission for commercial use of this work, please see paragraphs 4.2 and 5 of our Terms.
© 2018 The Author(s). This work is published and licensed by Dove Medical Press Limited. The full terms of this license are available at https://www.dovepress.com/terms.php and incorporate the Creative Commons Attribution - Non Commercial (unported, v3.0) License.
By accessing the work you hereby accept the Terms. Non-commercial uses of the work are permitted without any further permission from Dove Medical Press Limited, provided the work is properly attributed. For permission for commercial use of this work, please see paragraphs 4.2 and 5 of our Terms.