")
Back to Journals » International Journal of Nephrology and Renovascular Disease » Volume 9
Effects of socioeconomic status on physical and mental health of hemodialysis patients in Japan: differences by age, period, and cohort
Authors Sugisawa H , Shimizu Y, Kumagai T, Sugisaki H, Ohira S, Shinoda T
Received 24 February 2016
Accepted for publication 11 May 2016
Published 11 July 2016 Volume 2016:9 Pages 171—182
DOI https://doi.org/10.2147/IJNRD.S107031
Checked for plagiarism Yes
Review by Single anonymous peer review
Peer reviewer comments 3
Editor who approved publication: Professor Pravin Singhal
Hidehiro Sugisawa,1 Yumiko Shimizu,2 Tamaki Kumagai,3 Hiroaki Sugisaki,4 Seiji Ohira,5 Toshio Shinoda6
1Graduate School of Gerontology, J.F. Oberlin University, Machida, 2Faculty of Nursing, The Jikei University School of Medicine, Chofu, 3School of Nursing, Osaka City University, Osaka, 4Hachioji Azumacho Clinic, Hachioji, 5Sapporo Kita Clinic, Sapporo, 6Kawakita General Hospital, Suginami, Japan
Study purpose: Whether or not socioeconomic status (SES)-related differences in the health of hemodialysis patients differ by age, period, and birth cohort remains unclear. We examined whether SES-related gaps in physical and mental health change with age, period, and birth cohort for hemodialysis patients.
Methods: Data were obtained from repeated cross-sectional surveys conducted in 1996, 2001, 2006, and 2011, with members of a national patients’ association as participants. We used raking adjustment to create a database which had similar characteristics to the total sample of dialysis patients in Japan. SES was assessed using family size-adjusted income levels. We divided patients into three groups based on their income levels: below the first quartile, over the second quartile and under the third quartile, and over the fourth quartile. We used the number of dialysis complications as a physical health indicator and depressive symptoms as a mental health indicator. We used a cross-classified random-effects model that estimated fixed effects of age categories and period as level-1 factors, and random effects of birth cohort as level-2 factors.
Results: Relative risk of dialysis complications in respondents below the first quartile compared with ones over the fourth quartile was reduced in age categories >60 years. Mean differences in depressive symptoms between respondents below the first quartile and ones over the fourth quartile peaked in the 50- to 59-year-old age group, and were reduced in age groups >60 years. In addition, mean differences varied across periods, widening from 1996 to 2006. There were no significant birth cohort effects on income differences for dialysis complications or depressive symptoms.
Conclusion: The number of dialysis complications and depressive symptoms in dialysis patients were affected by income differences, and the degree of these differences changed with age category and period.
Keywords: complications, depressive symptoms, cross classified random effects model, income status, raking adjustment
Introduction
In many studies, socioeconomic status (SES) has been identified as an important factor associated with differences in appearance and onset of kidney diseases or lower levels of kidney function.1–9 As presented in a review by Beaulieu and Levin,10 four studies of chronic kidney disease outcome have demonstrated an inverse relationship between SES and chronic kidney disease, supporting a significant association between low SES and kidney disease. SES is associated with the incidence/prevalence of end-stage kidney disease (ESKD) and also influences a wide range of health indicators in patients with ESKD and who are undergoing dialysis. Studies using quality-of-life (QOL) indicators as outcome measures show a strong relation between higher SES and increased scores on some dimensions of a QOL scale.11–14 Higher SES is related to lower depression and higher levels of activities of daily living in patients with ESKD and undergoing dialysis.15,16 In addition, lower SES of patients with ESKD and undergoing dialysis is significantly related to higher death rate.17,18 The reasons why lower SES has a negative effect on health indicators in patients with ESKD and undergoing dialysis may involve fewer personal resources and lower levels of social support to deal with stress imposed by ESKD and dialysis.12,19 Few studies have examined differences in the effects of SES by age, period, and cohort in patients with ESKD and undergoing dialysis. Age effects represent the effects on an outcome of differences in the ages of the respondents at the time of observation. Period effects reflect differences in the time periods of observations or measurement of the outcome. Cohort effects indicate differences according to year of birth or some other shared life event for a set of respondents.20 Time trends (period effects) of incidence and prevalence of ESKD have been observed using the patient registration in Japan,21 in Australia and New Zealand,22 in Canada,23 and in the US and European countries.24,25 Time trends in health indictors, mainly mortality of patients undergoing dialysis over time, have also been examined. Some research has shown improvements in survival over time,26–29 although a few studies have revealed no mortality differences over time.30 However, it remains unclear whether or not influences of SES on health indicators in patients with ESKD and undergoing dialysis change over time. Dalstra et al31 adduce reasons why such studies are important. First, findings about the widening or decreasing of SES-related health gaps can contribute to the setting of priorities in the public health field, to better understanding of such gaps, and to the prediction of future trends related to these health gaps. Second, knowledge about changes in SES-related health gaps over time can assist in the evaluation of policies aimed at reducing these gaps. Dalstra et al also note the importance of studies of time trends in SES-related health gaps in patients with ESKD and undergoing dialysis.
SES has been identified as a strong social determinant of health in the general population in both developed and developing countries.32–34 People with higher status are likely to have better physical and mental health as well as extended longevity. However, there is debate about the consistency of the relationship between SES and health. Differences in the effects of SES by age, period, and cohort have been explored. In the context of aging and life course, some studies have shown narrowing of SES-related health gaps in later life, while others have demonstrated constant or widening SES-related health gaps.35 In general, it remains uncertain whether health gaps narrow, remain stable, or widen over time. In the few articles published in the past 10 years, increases31,36–40 and decreases, as well as stability,41–44 of SES-related health differences over time have all been reported. Thus, research on time trends remains inconclusive. Similarly, few studies have examined cohort effects, but strong cohort variations in SES-related health gaps across successive cohorts have been observed.45,46
The present study examines whether SES-related gaps in physical and mental health change with age, period, and cohort for patients undergoing hemodialysis.
Subjects and methods
Data
We analyzed repeated cross-sectional data collected in 1996, 2001, 2006, and 2011 from members of the Japan Association of Kidney Disease Patients. The surveys were collaboratively conducted by the Japan Association of Kidney Disease Patients and the Japanese Hemodialysis Physicians Association.
The respondents included in the present study were not a representative sample of all dialysis patients in Japan. Almost all members of the Association are undergoing hemodialysis. The members in the Association represented 53.4% of the total number of patients undergoing dialysis in Japan in 1996.47 The participation rate decreased over time. The participation rate at the time of the most recent survey (in 2011) was 32.4%.48
The respondents were selected by systematic sampling of one person for about every ten persons on a member list of the Association. Two groups of subjects responded to the survey. The first group was composed of patients undergoing hemodialysis, and the second group comprised the dialysis physicians of the first group. Board members of the Patients Association in each prefecture distributed questionnaires to dialysis physicians whose patients had been selected as part of the survey sample. The questionnaire contained medical-, psychological-, and socioeconomic-related assessment items. After the dialysis physicians completed the medical questions, they distributed the questionnaires to the patients. After the patients answered the psychological- and socioeconomic-related questions, they returned the questionnaires to the board members in each prefecture. The response rates were 85.0% for the 1996 survey, 86.9% for the 2001 survey, 83.7% for the 2006 survey, and 78.0% for the 2011 survey.
The total number of respondents was 32,209 (6,905 in 1996, 8,549 in 2001, 8,971 in 2006, and 7,784 in 2011).
Measures
We used dialysis complications as a measurement of physical health. Because hemodialysis can lead to dysfunctions in several organ systems,49 we asked dialysis physicians about the presence of infection and complications in eight organ systems: circulatory, digestive, neural/mental, articular/muscular, infection, ophthalmologic, blood, and dermatologic. We also assessed intradialytic complications. Most incidences of intradialytic complications have been prevented by improvements in hemodialysis technology. However, improving patients’ motivation and education, which are known to be strongly influenced by SES, and emphasizing the need to restrict dietary sodium intake are also known to be important for reducing intradialytic complications, such as hypertension, which constitutes the majority of such complications.50 In this study, the indicator of dialysis-related complications was calculated by adding an extra point if respondents had intradialytic complications to the number of organ systems having complications.
We used depressive symptoms as a mental health indicator. Depressive symptoms are associated with increased risk of mortality and hospitalization in patients undergoing dialysis.51 Depressive symptoms were assessed using a short version of the Center for Epidemiologic Studies-Depression (CES-D) scale developed by Kohout et al.52,53 The original CES-D was developed by Radloff.54 He examined reliability and validity of this scale. Among hemodialysis patients, higher CES-D scores are related to higher all-cause mortality, hospitalization, and withdrawal.55 In addition, it has been found that the CES-D’s factorial composition is highly similar across the various physical illness groups, including hemodialysis patients.56 These studies show that the CES-D is an appropriate scale to measure depressive symptoms as opposed to a screen for major depressive episodes. Information used to assess depressive symptoms was obtained from the patient questionnaire. The reliability coefficients of the short CES-D scale in each survey year were 0.680 in 1996, 0.767 in 2001, 0.772 in 2006, and 0.766 in 2011. In this study, clinical laboratory test indicators, such as Kt/V, hematocrit level, and albumin level, were not included as health measures. Although our data included clinical laboratory test results, there were no clinical laboratory test data that were commonly available across all four surveys.
Household income was used as an indicator of SES. Our database involved only household annual income as an indicator of SES. In Japan and in Western countries, household income of the general population has been frequently used as an indicator of SES, and it has been reported as having a significant effect on health.57–59 We assessed SES by using the family size-adjusted income, by dividing household income by the square root of household size. Eight income levels were used to assess household income. Family size-adjusted income was calculated by adjusting the midpoints to each income category. We divided respondents into three groups by income levels. The lowest income level included people under the first quartile of income, the middle income level included people within the second and third quartiles, and the highest income level included those over the fourth quartile. Respondents were divided into three groups by income levels in each survey because the average income of respondents differed across survey times. We currently lack a “gold standard” measure of income indicators for analyzing health gaps by income. Some studies have used quartile of income as such an indicator.60–62 Relative risks are calculated by specifying the fourth quartile as the reference category.
Individual variables used as covariates were sex, period of dialysis, and primary cause of kidney disease. Period was determined by survey years from 1991 to 2011. The cohort was determined by parsing the sample into 5-year birth cohorts ranging from 1915–1919 to 1975–1980 (only the last cohort was 6 years). These cohorts were defined by their midpoint; for example, the 1942 cohort included individuals born between 1940 and 1944. It was difficult to accurately estimate cohort patterns related to health differences before 1915, or after 1980, due to small effective sample sizes.
The number of respondents eligible for cohort analysis was 32,103. Among the eligible respondents, those without missing values were 80.7%; 11.1% had missing values related to adjusted income. We added cases with missing values in the income variable through creating a “no answer” category to prevent significant reduction of the number of cases which we could analyze. As a result, of the eligible respondents, data from 28,561 respondents (89.0%) were analyzed. Cases which were excluded from analysis were more likely to be older, female, have a shorter period of hemodialysis, have higher depressive symptoms, have more complications, have a lower adjusted income, or have a lower percentage of glomerulonephritis as the primary cause of kidney disease, compared to those without missing values.
Statistical analysis
Respondent characteristics were compared with those of all patients undergoing dialysis in Japan in order to examine possible sampling bias. Data of all patients undergoing dialysis were obtained from an annual national statistical survey of dialysis facilities conducted by the Japanese Society for Dialysis Therapy, with a response rate of 99.0%. However, distributions of characteristics for each kind of dialysis treatment were not calculated. The percentages cited were calculated using the total number of patients undergoing dialysis in Japan in the denominator because over 20 years, patients undergoing hemodialysis represented >95% of the patients undergoing dialysis.
As Table 1 indicates, we compared distributions of age, sex, cause of renal disease, and duration of dialysis between the total population and the respondents for each of the four surveys from 1996 to 2011. In terms of the 2011 survey,63 the percentage of respondents >70 years (25.3%) was lower than that among the total number of patients (43.6%). The percentage of males among the respondents was 55.2%, relatively lower than the percentage among the total patients (62.6%). In our sample, chronic glomerulonephritis was the leading cause of kidney disease (48.6%), and diabetic nephropathy was the second leading cause (21.4%). Among all patients, the leading causes of kidney disease were diabetic nephropathy (40.0%) and chronic glomerulonephritis (37.9%). The percentage of people who had been undergoing dialysis for <5 years was lower (23.7%) than that of total patients (47.8%). Similar differences in age, sex, cause of renal disease, and duration of dialysis between the total population and respondents appeared in each of the 1996, 2001, and 2006 surveys.64–66 This pattern suggests concerns about the representativeness of the present sample.
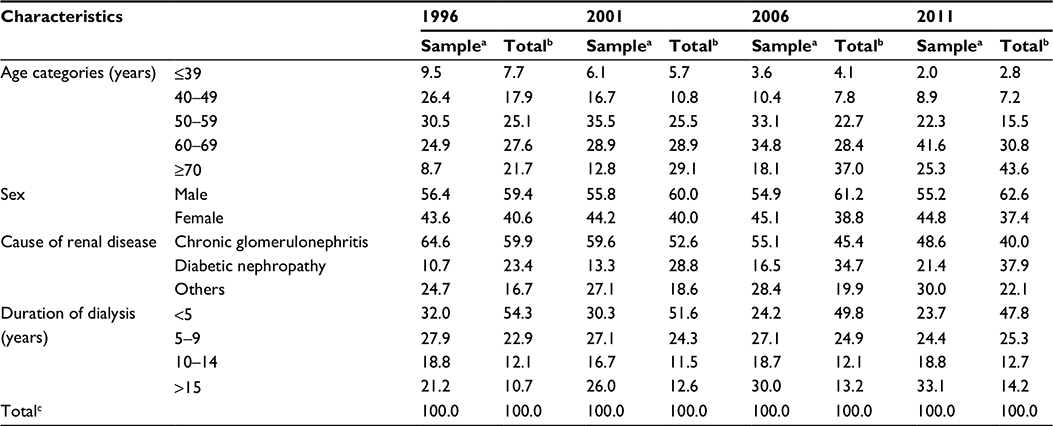 | Table 1 Differences in characteristics between studied analytic sample and total dialysis patients in Japan during each survey year Notes: aSample means analytic sample in each survey conducted in 1996, 2001, 2006, and 2011. bTotal means total dialysis patients in Japan in 1996, 2001, 2006, and 2011. Data were obtained from an annual national statistical survey of dialysis facilities conducted by the Japanese Society for Dialysis Therapy. cTotal percentages for each characteristic were calculated by exclusion of cases including “unknown” variables. |
We used a weighing technique to create a data set which was similar to the characteristics of all patients. Cell weighting is typically used. Using cell weighting, we need to calculate a cell weight score for each cell classified by all possible combinations of the weighting variables. For example, when we use age (five categories) and cause of renal diseases (three categories) as the weighting variables, we need to calculate a weight score for each of the 15 cells classified according to the five age categories and three causes of renal disease. That is, it is required that the total data be available for each cell, classified by all weighing variables. As we used four weighing variables (as described later) in this study, we needed the total dialysis patient data available for each cell, classified by the four weighting variables. However, we could not obtain such data for each survey year. Raking adjustment is an alternative to cell weighting.67 Raking adjustment is an iterative proportion procedure that performs cell-by-cell adjustments over the various univariate distributions to make the weighted sample cells match known marginal totals. This process is repeated iteratively until there is convergence between the weighted sample and known marginal totals. Using raking adjustment, we only need the marginal distribution of each weighing variable among the population. We could obtain the marginal distributions of the four weighing variables in the total dialysis patients, age, sex, cause of renal disease, and duration of dialysis, for each of the four surveys. Raking adjustment was conducted for each of the four survey data sets from 1996 to 2011. We used SPSSINC_RAKE provided in the Python extension commands as a raking technique68 that functioned on the IBM SPSS Statistics processor (IBM Corporation, Armonk, NY, USA) to calculate the weights.
In disentangling the effects of age, period, and cohort by conventional linear regression models using aggregate population data, a model identification problem arises from the complete linear dependency among the three predictor variables. To address this type of problem, Yang and Land20 proposed a hierarchical age–period–cohort (HAPC) modeling approach that uses individual-level data and a multilevel modeling framework. Access to individual-level observations is possible to identify fixed-effect models by the creation of different time intervals among age, period, and/or cohort, and also by the addition of quadratic age effects into the equations. Moreover, as cohort effects arise from differences in life conditions and experiences over the life course of cohorts, and as period effects arise from temporal or sequential changes in life conditions and circumstances that basically have an equal impact on all cohorts, it is possible to conclude that people who are in the same cohort, or same survey year, are indeed embedded in the same social historical context. As a result, in the HAPC model, respondents are simultaneously influenced by two higher level social historical contexts defined by the time period and cohort, which are randomly modeled.20 We basically adopted a HAPC model, specifically, a cross-classified random-effects two-level model (CCREM). We treated period as a level-1 factor because the number of periods in this study was relatively few and estimation of random effects of period as level-2 factors is relatively difficult. We entered age categories composed of 10-year age ranges, including a category <39 and a category >70. In addition, we entered interaction terms not only between income quartiles and age categories, but also between income categories and period, as level-1 factors to examine the effects of age and period on the income differences for dialysis complications and depressive symptoms. We also added cross-level interaction terms between income quartiles as level-1 factors and cohorts as level-2 factors to examine a potential cohort effect on the income differences for both health indicators. Sex, cause of renal disease, and duration of dialysis were entered as covariates.
Analyses were conducted using mixed-effect regression models included in GLIMMIX Procedure, SAS 9.4 (SAS Institute Inc., Cary, NC, USA). We analyzed based on a negative binominal distribution the number of dialysis complications because these data were countable. Countable data were analyzed based on a Poisson distribution. This study used a negative binominal distribution to escape biased standard errors due to over-dispersed count data. In terms of depressive symptoms, we used generalized mixed models for normally distributed responses. Income differences for a number of dialysis complications were evaluated as relative risk, calculated by dividing the number of dialysis complications in the group below the first quartile by that in the group over the fourth quartile. In CCREM, relative risks were calculated by natural log returns of group coefficients below the first quartile by setting up the group over the fourth quartile as a reference category. Income differences for depressive symptoms were evaluated using mean differences. They were calculated by subtracting depressive symptom scores in the group below the first quartile from those in the group over the fourth quartile. In CCREM, mean differences were equal to group coefficients below the first quartile by setting up the group over the fourth quartile as a reference category.
Ethical considerations
The study was conducted according to the guidelines of the Declaration of Helsinki, and all procedures were approved by the Research Ethics Board of J.F. Oberlin University. The questionnaire along with the letter of invitation explaining the content of the study was given to each potential respondent in this survey. Data collection procedures assured confidentiality by the use of self-administered, anonymous questionnaires. Responses in this study were completely voluntary, and confidentiality was fully guaranteed. Only respondents who wished to participate in this survey sent their questionnaires back to us, and this was considered as consent to be included.
Results
Table 2 presents summary statistics of age and sex distribution, income distribution, and other relevant characteristics among aggregated data from 1996 to 2011 after raking adjustment. The respondents <39 years old composed 5.1% of the total, those 40–49 years old 10.6%, those 50–59 years old 22.4%, those 60–69 years old 28.8%, and those ≥70 years old 33.1%. Male respondents constituted 60.8%. Chronic glomerulonephritis represented 48.5%, and diabetic nephropathy represented 32.0%. Respondents whose duration of dialysis was <5 years represented 50.8% of the sample.
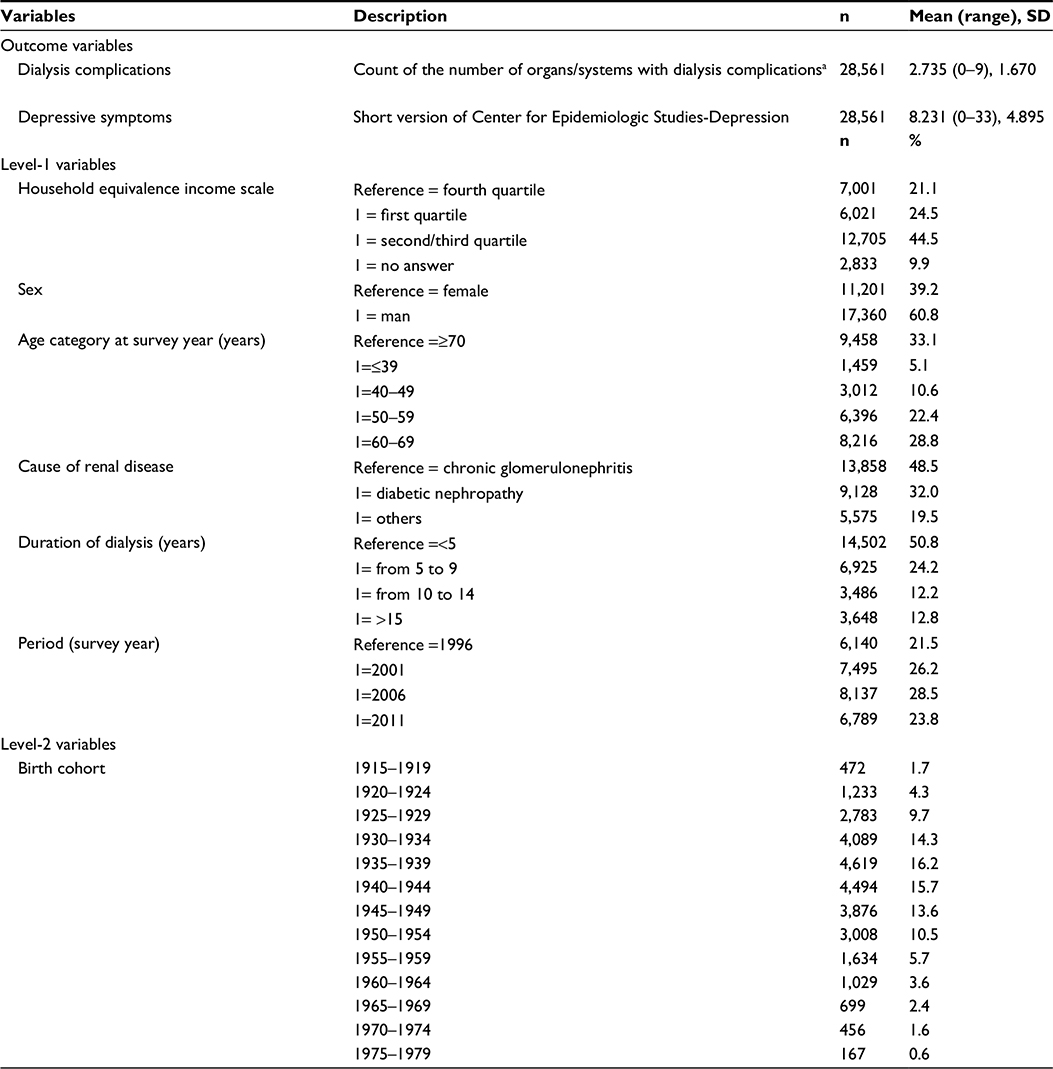 | Table 2 Summary statistics for dialysis complications, depressive symptoms, level-1 variables, and level-2 variables among aggregated data from 1996 to 2011 surveys after raking adjustment Note: aExistence of intradialytic complications added one point to total. Abbrevation: SD, standard deviation. |
Table 3 shows the differences between respondents below the first quartile and ones over the fourth quartile in dialysis complications and depressive symptoms, using data aggregated over the four surveys. Relative risk of dialysis complications for respondents below the first quartile income compared with ones over the fourth quartile was 1.100 (confidence interval [CI]: 1.076–1.124). The mean difference in depressive symptoms was 1.748 (CI: 1.581–1.196). Relative risk of dialysis complications and mean differences in depression symptoms for respondents below the first quartile compared with ones over the fourth quartile were larger for 50–59 years old than for the other age categories. Mean difference in depressive symptoms between respondents below the first quartile income and ones over the fourth quartile was higher in 2001, 2006, and 2011 than in 1996. Mean differences in depressive symptoms between respondents below the first quartile income and ones over the fourth quartile widened over newer birth cohorts.
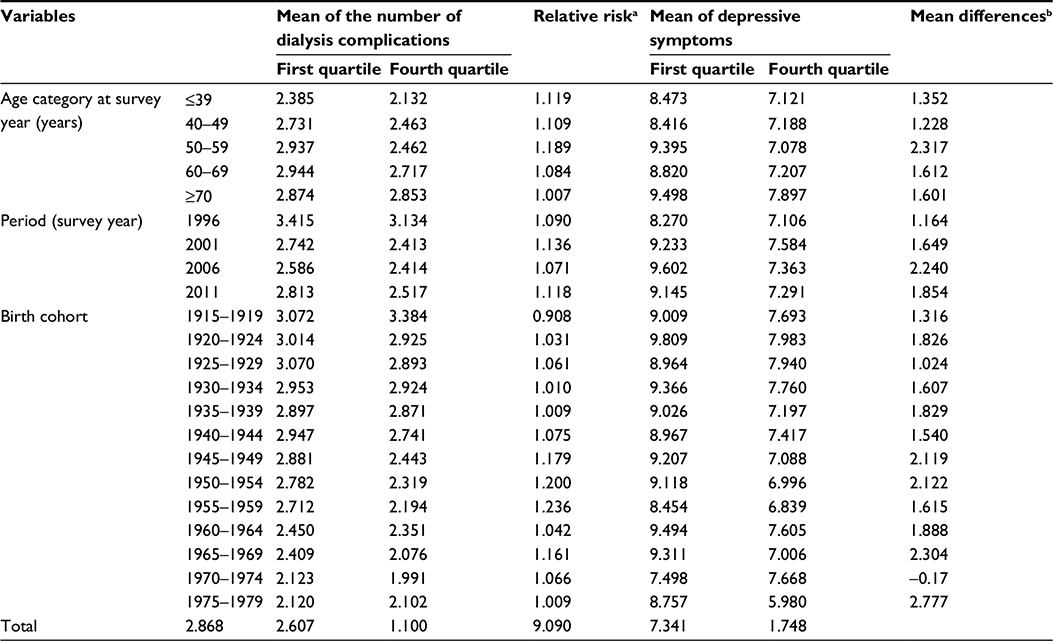 | Table 3 Differences between respondents below the first quartile income and ones over the fourth quartile in the number of dialysis complications and depressive symptoms among aggregated data from 1996 to 2011 after raking adjustment Notes: aThe numbers of dialysis complications were count data. What we referred to as a count was called a risk because by definition, a risk is the number of events per time. Relative risks were calculated by dividing means of the number of dialysis complications in respondents below the first quartile by means of the number of complications in ones over the fourth quartile. bMean differences were calculated by subtracting the means of depressive symptoms in respondents below the first quartile from means of depressive symptoms in ones over the fourth quartile. |
Table 4 shows the CCREM results for prediction of dialysis complications and depressive symptoms. Coefficients for the interaction terms between age categories <69 years old and the first income quartile were relatively large and positive; relative risks for age categories <69 years old were larger than for the >70-year-old category (reference), and relative risk for the age category of 50–59 years old was significantly larger than for the age category >70 years. Figure 1 shows differences in relative risk by age categories. Relative risk was reduced in age categories >60 years old. There were no significant interaction term coefficients between income quartiles and period. The income quartile coefficients did not have significant random effects by birth cohort (results omitted).
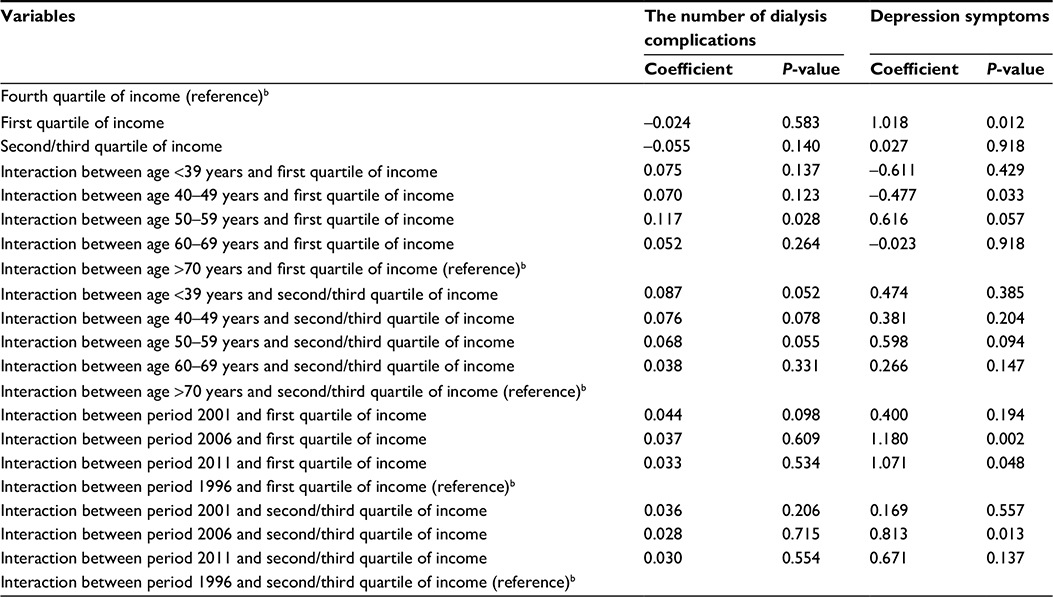 | Table 4 Effect of age and period on the income differences in the number of dialysis complications and depressive symptoms: results from cross-classified random-effects two-level modela Notes: aThese are results after sex, age categories, causes of renal disease, duration of dialysis, period, and cohort were controlled and their coefficients were omitted from this table. “Unknown” categories of income were excluded from this table. Because the coefficients of the income quartiles did not have significant random effects by birth cohort, these results were omitted from this table. b>We analyzed categorical independent variable using dummy coding; we created K-1 dummy variables from a variable with K categories, omitted categories were named as reference categories, as a result, coefficients of reference categories were not calculated. |
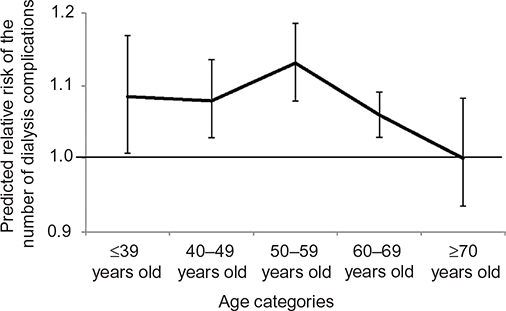 | Figure 1 Differences by age categories in relative risk of dialysis complications in first-income quartile respondents compared to fourth-quartile respondents. Notes: Values were estimated by substitutions of mean values for independent variables without income and age variables, which were entered as fixed effects of a cross-classified random-effects model. Vertical lines indicate 95% confidence interval. |
Regarding depressive symptoms, the coefficients for interaction terms between age categories <49 years old and first quartile of income were relatively large and negative; the mean differences in respondents <49 years old were smaller than for ones >70 years old (reference), and a significant mean difference was observed between 40–49 and ≥70 years old. The coefficient of interaction between 50 and 59 years old and first quartile of income was not only positive but also significant; the mean differences in the 50- to 59-year-old group were significantly larger than for respondents >70 years old. Figure 2A shows the mean differences over age categories. Although the mean differences widened over age categories <50–59 years old, they were reduced in age categories >60 years old. In terms of period effects, all coefficients of interactions between each of the 2001, 2006, and 2011 periods and the first quartile of income were relatively large and positive; the mean differences in each of the 2001, 2006, and 2011 periods were larger than in 1996, and mean differences for each of the 2006 and 2011 periods were significantly larger than in 1996. Figure 2B shows mean differences by period. Mean differences by period from 1996 to 2006 widened but stabilized after the 2006 period.
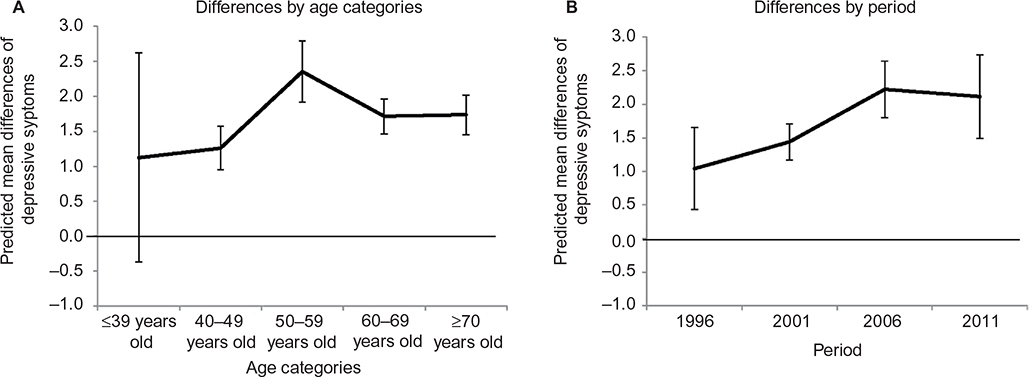 | Figure 2 Mean differences by age categories or period for depressive symptoms between respondents below the first income quartile and ones over the fourth quartile. Notes: (A) differences by age categories, and (B) differences by period. Values were estimated by substitutions of mean values for independent variables without income and age variables (without income and period variables in case of period effects), which were entered as fixed effects of a cross-classified random-effects model. Vertical lines indicate 95% confidence interval. |
Discussion
Using data aggregated over four surveys, both the number of dialysis complications and depressive symptoms were found to be influenced by income levels. These findings were similar to results of previous research that discovered gaps in QOL, mental health, physical health, and mortality by SES among dialysis patients. In addition, the present data suggest that income gaps in the number of dialysis complications and depressive symptoms differ across age categories. Whether or not health gaps by SES widen with age in the general population has been a matter of debate. Research by Ross and Wu,69 Lynch,70 and Dupre71 has shown that gaps in self-rated health or differences in physical functioning based on educational levels increase with age in other countries. In Japan, both increases and decreases in health differences related to SES over the life course have been observed in the general population.72,73 Two theoretical stances predict opposite effects of age on SES-related health gaps. According to the cumulative disadvantage theory, SES-related health gaps should widen with age. On the other hand, the age-as-leveler theory suggests that health gaps by SES should reduce or shrink with age. This present results support the predictions of age-as-leveler theory among patients undertaking dialysis as aged 50 and over, in terms of SES-related gaps in the number of dialysis complications. The decreased association between income and the number of dialysis complications in later life can be explained by selective mortality and biological frailty. Even if hemodialysis patients with lower income experience dialysis complications more frequently, the development of such dialysis complications causes deaths at an earlier age.74 As a result, survivors with more biological vitality among the patients with lower income in later life are left and contribute to reduced income gaps. In terms of income gaps in depressive symptoms, the predictions of the age-as-leveler theory were supported only in age categories >50–59 years old. In age categories <49 years old, this present study supports the cumulative disadvantage theory. However, it is unclear whether cumulative disadvantage works to widen the income gaps in hemodialysis patients. A large literature indicates that human happiness follows a U-shape (a midlife peak) throughout life.75 One explanation for this phenomenon pertains to financial hardship.75 As it is easy to imagine that hemodialysis patients with lower income have experiences of more serious financial hardship, it is possible that mental health in the hemodialysis patient group with lower income in middle age is more seriously influenced by such hardship.
The period trends revealed that mental health differences resulting from differences in income levels increased from 1996 to 2006. Interestingly, time trends in mental health related to income differences were not observed in the case of dialysis complications. According to the traditional perspective, economic fluctuations have negative effects on health, particularly in the lower SES groups.76 In addition, positive correlations between per capita gross domestic product (GDP) and suicides rates have been identified in Japan,77 suggesting that health problems, and mental health problems in particular, are known to be influenced by economic conditions. Unemployment rates in this study were lowest in 1996 (3.4%), highest in 2001 (5.0%), and between these points in 2006 and 2011 (2006: 4.1%, 2011: 4.6%).78 Periodic trends in depressive symptoms related to income were also related to trends in the unemployment rate. However, our data included only four time points for assessing period, and it was therefore difficult to identify whether unemployment rates could statistically explain depressive symptoms related to income differences by period.
During the past four decades, technological innovations in hemodialysis, such as the use of disposable high-flux polysulfone dialyzers and online hemodiafiltration, have been introduced.79 In addition, advanced medical treatment, such as substitution therapy with human recombinant erythropoietin, and optimization of nutritional status that prevents dialysis-related complications have been put into practice.79 If later cohorts of patients, particularly those with lower SES and lower adherence to medical directions, benefit from advances in the treatment of patients undergoing dialysis, we would expect to see the reduction of gaps in health by income levels in later cohorts. However, such a narrowing of gaps in the later cohorts was not observed. Technical advances in maintenance dialysis treatment may not contribute to convergence of health gaps by income level.
Our findings should be interpreted in the light of several limitations. First, our findings were based only on members of the Patients Association, which may raise concerns about representativeness of the data. Recently, participation by patients undergoing dialysis in the Patients Association has decreased. We made a comparable database with the hemodialysis patient population in terms of typical differences in characteristics between the sample and the dialysis patient population, using raking adjustment to resolve sampling bias. However, raking adjustment may not have been sufficient to eliminate the sampling bias observed in this study. Even under the limited adjustment methodology used in this study, age effects and period effects on physical and mental health differences related to income levels were identified, which is indicative of the robustness of the results.
Second, we used an income-based indicator to measure SES, ignoring other socioeconomic indicators such as education or occupation, because our database included only household income as an indicator of SES. On the basis of our review, there are few databases which we can use to examine differences by period and cohort in SES-related health gaps among dialysis patients, not only in Japan but also around the world. Even if the database had such limitations, we think that our research findings can contribute to progress in the study of social determinants of health. However, each SES indicator has a different effect on health. To identify mechanisms of SES-related health gaps, other indicators to measure SES, besides income, should be used.
Third, we used only four surveys conducted every 5 years to examine period effects on health gaps by SES. Data collected over longer periods are needed to obtain a more accurate representation of period effects. Fourth, we did not identify participants as being on any antidepressant medication. A study by Fukuhara et al showed that antidepressants were much less commonly prescribed in Japan compared with other eleven countries, including Canada, France, Germany, and Italy (1% in Japan vs 17% in other eleven countries).80 Accordingly, it can be supposed that there are few effects of taking antidepressant medication on the results of this study.
Conclusion
The number of dialysis complications and depressive symptoms in patients undergoing hemodialysis vary with income, and they also change with age categories and time period. There were no differences in income-related health gaps by birth cohort in patients undergoing hemodialysis.
Acknowledgments
The authors acknowledge the help of many dialysis physicians and the prefecture board members of the Japan Association of Kidney Disease Patients.
Author contributions
HS formulated the research question, designed the study, analyzed the data, and wrote the article. YS and TK designed the portion of the study that concerned the psychosocial aspects of the patients. HS, TS, and SO designed the portion of the study that concerned the medical aspects of the patients and provided critical revision of the manuscript. All authors contributed toward data analysis, drafting and critically revising the paper and agree to be accountable for all aspects of the work. All authors have read and approved the final manuscript.
Disclosure
The authors report no conflicts of interest in this work.
References
Perneger TV, Whelton PK, Klag MJ. Race and end-stage renal disease. Socio-economic status and access to health care as mediating factors. Arch Intern Med. 1995;155(11):1201–1208. | ||
Klag MJ, Whelton PK, Randall BL, Neaton JD, Brancati FL, Stamler J. End-stage renal disease in African–American and white men. 16-Year MRFIT findings. JAMA. 1997;277(16):1293–1298. | ||
Krop JS, Coresh J, Chambless LE, et al. A community-based study of explanatory factors for the excess risk for early renal function decline in blacks vs. whites with diabetes. Arch Intern Med. 1999;160(10):1472–1476. | ||
Fored CM, Ejerblad E, Fryzek JP, et al. Socio-economic status and chronic renal failure: a population-based case-control study in Sweden. Nephrol Dial Transplant. 2003;18(1):82–88. | ||
Merkin SS, Roux AV, Coresh J, Fried LF, Jackson SA, Powe NR. Individual and neighborhood socioeconomic status and progressive chronic kidney disease in an elderly population: the Cardiovascular Health Study. Soc Sci Med. 2007;65(4):809–821. | ||
Shoham DA, Vupputuri S, Diez Roux AV, et al. Kidney disease in life-course socioeconomic context; the Atherosclerosis Risk in Communities (ARIC) Study. Am J Kidney Dis. 2007;49(2):217–226. | ||
Shoham DA, Vupputuri S, Kaufman JS, et al. Kidney disease and the cumulative burden of life course socioeconomic conditions: the Atherosclerosis Risk in Communities (ARIC) study. Soc Sci Med. 2008;67(8):1311–1320. | ||
McClellan WM, Newsome BB, McClure L, et al. Poverty and racial disparities in kidney disease: the REGARDS study. Am J Nephrol. 2010;32(1):38–46. | ||
Crews DC, Charles RF, Evans MK, Zonderman AB, Powe NR. Poverty, race, and CKD in a racially and socioeconomically diverse urban population. Am J Kidney Dis. 2010;55(6):992–1000. | ||
Beaulieu M, Levin A. A critical evaluation of the effects of socioeconomic status on kidney disease. Port J Nephrol Hypert. 2009;23(3):235–244. | ||
Rebollo P, Ortega F, Baltar JM, et al. Health-related quality of life (HRQOL) in end stage renal disease (ESRD) patients over 65 years. Geriatr Nephrolol Urol. 1998;8(2):85–94. | ||
Sesso R, Rodrigues-Neto JF, Ferraz MB. Impact of socioeconomic status on the quality of life of ESRD patients. Am J Kidney Dis. 2003;41(1):186–195. | ||
Chiang CK, Peng YS, Chiang SS, et al. Health-related quality of life of hemodialysis patients in Taiwan: a multicenter study. Blood Purif. 2004;22(6):490–498. | ||
Cruz MC, Andrade C, Urrutia M, Draibe S, Nogueira-Martins LA, Sesso Rde C. Quality of life in patients with chronic kidney disease. Clinics (Sao Paulo). 2011;66(6):991–995. | ||
Cook WL, Jassal SV. Functional dependencies among the elderly on hemodialysis. Kidney Int. 2008;73(11):1298–1295. | ||
Theofilou P. Depression and anxiety in patients with chronic renal failure: the effect of sociodemographic characteristics. Int J Nephrol. 2011;2011:514070. | ||
Abraham G, Jayaseelan T, Matthew M, et al. Resource settings have a major influence on the outcome of maintenance hemodialysis patients in South India. Hemodial Int. 2010;14(2):211–217. | ||
Marinovich S, Lavorato C, Rosa-Diez G, Bisigniano L, Fernández V, Hansen-Krogh D. The lack of income is associated with reduced survival in chronic haemodialysis. Nefrologia. 2012;32(1):79–88. | ||
Khattak M, Sandhu GS, Desilva R, Goldfard-Rumyantzev AS. Association of education level with dialysis outcome. Hemodial Int. 2012;16(1):82–88. | ||
Yang Y, Land KC. Age-Period-Cohort Analysis; New Models, Methods, and Empirical Applications. Boca Raton, FL: CRC Press; 2013. | ||
Usami T, Koyama K, Takeuchi O, Morozumi K, Kimura G. Regional variations in the incidence of end-stage renal failure in Japan. JAMA. 2000;284(20):2622–2624. | ||
Disney AP. Some trends in chronic renal replacement therapy in Australia and New Zealand, 1997. Nephrol Dial Transplant. 1998;13(4):854–859. | ||
Canadian Institute for Health Information. 2001 Report, Volume 1: Dialysis and Renal Transplantation, Canadian Organ Replacement Register. Ottawa: Canadian Institute for Health Information; 2001. | ||
Briggs JD, Jager KJ. The first year of the new ERA–EDTA registry. Nephrol Dial Transplant. 2001;16(6):1130–1131. | ||
van Dijk PC, Jager KJ, de Charro F, et al. Renal replacement therapy in Europe: the results of a collaborative effort by the ERA–EDTA registry and six national or regional registries. Nephrol Dial Transplant. 2001;16(6):1120–1129. | ||
Goodkin DA, Young EW, Kurokawa K, Prüiz KG, Levin NW. Mortality among hemodialysis patients in Europe, Japan, and the United States: case-mix effects. Am J Kidney Dis. 2004;44(5 Suppl 2):16–21. | ||
Port FK, Pisoni RL, Bommer J, et al. Improving outcomes for dialysis patients in the international Dialysis Outcomes and Practice Patterns Study. Clin J Am Soc Nephrol. 2006;1(2):246–255. | ||
Jassal SV, Trpeski L, Zhu N, Fenton S, Hemmelgam B. Changes in survival among elderly patients initiating dialysis from 1990 to 1999. CMAJ.2007;177(9):1033–1038. | ||
Kramer A, Stel V, Zoccali C, et al. An update on renal replacement therapy in Europe: ERA-EDTA registry data from 1997 to 2006. Nephrol Dial Transplant. 2009;24(12):3557–3566. | ||
Kurella M, Covinsky KE, Collins AJ, Chertow GM. Octogenarians and nonagenarians starting dialysis in the United States. Ann Intern Med. 2007;146(3):177–183. | ||
Dalstra JAA, Kunst AE, Geurts JJ, Frenken FJ, Mackenbach JP. Trends in socioeconomic health inequalities in the Netherlands, 1981–1999. J Epidemiol Community Health. 2002;56(12):927–934. | ||
Adler NE, Ostrove JM. Socioeconomic status and health: what we know and what we don’t. Ann N Y Acad Sci. 1999;896:3–15. | ||
Lund C, Breen A, Flisher AJ, et al. Poverty and common mental disorders in low and middle income countries: A systematic review. Soc Sci Med. 2010;71(3):517–528. | ||
Ibrahim MM, Damasceno A. Hypertension in developing countries. Lancet. 2012;380(9841):611–619. | ||
Kim J, Durden E. Socioeconomic status and age trajectories of health. Soc Sci Med. 2007;65(12):2489–2502. | ||
Davey-Smith G, Dorling D, Mitchell R, Shaw M. Health inequalities in Britain: continuing increases up to the end of the 20th century. J Epidemiol Community Health. 2002;56(6):434–435. | ||
Mackenbach JP, Howden-Chapman P. New perspectives on socioeconomic inequalities in health. Perspect Biol Med. 2003;46(3):428–444. | ||
Khang YH, Lynch JW, Yun S, Lee SI. Trends in socioeconomic health inequalities in Korea: use of mortality and morbidity measures. J Epidemiol Community Health. 2004;58(4):308–314. | ||
Schoeni RF, Martin LG, Andreski PM, Freeman VA. Persistent and growing socioeconomic disparities in disability among the elderly: 1982-2002. Am J Public Health. 2005;95(11):2065–2070. | ||
Strand BH, Grøholt EK, Steingrímsdóttir ÓA, Blakely T, Graff-Iversen S, Naess Ø. Educational inequalities in mortality over four decades in Norway: prospective study of middle aged men and women followed for cause specific mortality, 1960-2000. BMJ. 2010;340:c654. | ||
Sacker A, Wiggins RD. Age-period-cohort effects on inequalities in psychological distress, 1981-2000. Psychol Med. 2002;32(6):977–990. | ||
Wamala S, Blakely T, Atkinson J. Trends in absolute socioeconomic inequalities in mortality on Sweden and New Zealand: A 20 year gender perspective. BMC Public Health. 2006;6:164. | ||
Fors S, Lennartsson C, Lundberg O. Health inequalities among older adults in Sweden 1991–2002. Eur J Public Health. 2008;18(2):138–143. | ||
Blakely T, Tobias M, Atkinson J. Inequalities in mortality during and after restructuring of the New Zealand economy: repeated cohort studies. BMJ. 2008;336(7640):371–375. | ||
Lynch SM. Explaining life course and cohort variation in the relationship between education and health: the role of income. J Health Soc Behav. 2006;47(4):324–338. | ||
Chen F, Yang Y, Liu G. Social change and socioeconomic disparities in health over the life course in China: a cohort analysis. Am Sociol Rev. 2010;75(1):125–150. | ||
Japan Association of Kidney Disease Patients. 2001 Nendo Ketsuekitosekikanja Jittaichosa Hokokusho [Report on Survey Hemodialysis Patients 2001]. Setagaya: Association of Periodical Publication by Organizations for the Disabled; 2002. Japanese. | ||
Japan Association of Kidney Disease Patients. 2011 Nendo Ketsuekitosekikanja Jittaichosa Hokokusho [Report on Survey Hemodialysis Patients 2011]. Setagaya: Association of Periodical Publication by Organizations for the Disabled; 2012. Japanese. | ||
Himmelfarb J. Hemodialysis complications. Am J Kidney Dis. 2005;45(6):1122–1131. | ||
Devenport A. Can advances in hemodialysis machine technology prevent intradialytic hypertension? Semin Dial. 2009;22(3):231–236. | ||
Lopes AA, Bragg J, Young E, et al; for Dialysis Outcome and Practice Patterns Study (DOPPS). Depression as a predictor of mortality and hospitalization among hemodialysis patients in the United States and Europe. Kidney Int. 2002;62(1):199–207. | ||
Kohout FJ, Berkman LF, Evans DA, Cornoni-Huntley J. Two shorter forms of the CES-D (Center for Epidemiological Studies Depression) depression symptoms index. J Aging Health. 1993;5(2):179–193. | ||
Carpenter JS, Andrykowski MA, Wilson J, et al. Psychometrics for two short forms of the Center for Epidemiological Studiesdepression scale. Issues Ment Health Nurs. 1998;19(5):481–494. | ||
Radloff LA. The CES-D scale: a self-report depression scale for research in the general population. Appl Psychol Meas. 1977;1(3):385–401. | ||
Lopes AA, Albert JM, Young EW, et al. Screening for depression in hemodialysis patients: associations with diagnosis, treatment, and outcomes in the DOPPS. Kidney Int. 2004;66(5):2047–2053. | ||
Devins GM, Orme CM, Costello CG, et al. Measuring depressive symptoms in illness populations: psychometric properties of the Center for Epidemiologic Studies Depression (CES-D) Scale. Psychol Health. 1988;2(2):139–156. | ||
Kagaminori S, Gaina A, Nasermoaddeli A. Socioeconomic status and health in the Japanese population. Soc Sci Med. 2009;68:2152–2160. | ||
Yamazaki S, Fukuhara S, Suzukamo Y. Household income strongly associated with health-related quality of life among Japanese men but women. Public Health. 2005;119(7):561–567. | ||
Murata C, Kondo K, Hirai H, Ichida Y, Ojima T. Association between depression and socio-economic status among community-dwelling elderly in Japan: the Aichi Gerontological Evaluation Study (AGES). Health Place. 2008;14(3):406–414. | ||
Philbin EF, William Dec G, Jenkins PL, DiSalvo TG. Socioeconomic status as an independent risk factors for hospital readmission for heart failure. Am J Cardiol. 2001;87(12):1367–1371. | ||
Skalická V, van Lenthe F, Bambra C, Krokstad S, Mackenbach J. Material, psychological, behavioural and biomedical factors in the explanation of relative socio-economic inequalities in mortality: evidence from the HUNT study. Int J Epidemiol. 2009;38(5):1272–1284. | ||
Dowd JB, Zajacova A. Does the predictive power of self-rated health for subsequent mortality risk vary by socioeconomic status in the US? Int J Epidemiol. 2007;36(6):1214–1221. | ||
Committee of Renal Data Registry. Wagakuni no Manseitousekiryoho no Genkyou 2011 Nen 12 Gatsu 31 Nichi Genzai [An Overview of Regular Dialysis Treatment in Japan as of 31 December 2011]. Bunkyo: The Japanese Society for Dialysis Therapy; 2012. Available from: http://docs.jsdt.or.jp/overview/pdf2012/2011all.pdf. Accessed February 28, 2015. Japanese. | ||
Committee of Renal Data Registry. Wagakuni no Manseitousekiryoho no Genkyou 2006 Nen 12 Gatsu 31 Nichi Genzai [An Overview of Regular Dialysis Treatment in Japan as of 31 December 2006]. Bunkyo: The Japanese Society for Dialysis Therapy; 2007. Available from: http://docs.jsdt.or.jp/overview/pdf2007/2006all.pdf. Accessed February 28, 2015. Japanese. | ||
Committee of Renal Data Registry. Wagakuni no Manseitousekiryoho no Genkyou 2001 Nen 12 Gatsu 31 Nichi Genzai [An Overview of regular Dialysis Treatment in Japan as of 31 December 2001]. Bunkyo: The Japanese Society for Dialysis Therapy; 2002. | ||
Committee of Renal Data Registry. Wagakuni no Manseitousekiryoho no Genkyou 1996 Nen 12 Gatsu 31 Nichi Genzai [An Overview of regular Dialysis Treatment in Japan as of 31 December 1996]. Bunkyo: The Japanese Society for Dialysis Therapy; 1997. | ||
Kalton G, Flores-Cervantes I. Weighting methods. J Off Stat. 2003;19(2):81–97. | ||
IBM Knowledge Center. Python extension commands for SPSS statistics. Available from: http://www.ibm.com/support/knowledgecenter/SSLVMB_23.0.0/spss/programmability_option/python_uber_installed_extensions.dita. Accessed April 30, 2016. | ||
Ross CE, Wu C. Education, age, and the cumulative advantage in health. J Health Soc Behav. 1996;37(1):104–120. | ||
Lynch SM. Cohort and life-course patterns in the relationships between education and health: a hierarchical approach. Demography. 2003;40(2):309–331. | ||
Dupre E. Educational differences in age-related patterns of disease: reconsidering the cumulative disadvantage and age-as-leveler hypothesis. J Health Soc Behav. 2007;48(1):1–15. | ||
Honjo K, Kawakami N, Takeshima T, et al. Social class inequalities in self-rated health and their gender and age group differences in Japan. J Epidemiol. 2006;16(6):223–232. | ||
Fukuda Y, Nakamura K, Takano T. Municipal socioeconomic status and mortality in Japan: sex and age differences, and trends of 1973–1998. Soc Sci Med. 2004;59(12):2435–2445. | ||
Nolan CR. Strategies for improving long-term survival in patients with ESRD. J Am Soc Nephrol. 2005;16 Suppl 2:S120–S127. | ||
Weiss A, King JE, Inoue-Murayama M, Matsuzawa T, Oswald AJ. Evidence for a midlife crisis in great apes consistent with the U-shape in human beings. Proc Natl Acad Sci U S A. 2012;109(49):19949–19952. | ||
Blasco-Fontecilla H, Perez-Rodriguez MM, Garcia-Nieto R, et al. Worldwide impact of economic cycles on suicide trends over three decades: differences according to level of development. A mixed effect model study. BMJ Open. 2012;2:e000785. | ||
Edwards R. Who is hurt by pro-cyclical mortality? Soc Sci Med. 2008;67(12):2051–2058. | ||
Statistical Bureau, Ministry of Internal Affairs and Communications. Chōki Jikeiretsuhyou 2 Shugyou Joutaibetsu 15 Sai ljou Jinkou [Historical data 2 population aged 15 years old and over by labour force status-whole Japan]. Available from: http://www.stat.go.jp/data/roudou/longtime/03roudou.htm. Accessed October 7, 2015. Japanese | ||
Lehmann PR, Ambühl M, Corleto D, Klaghofer R, Ambühl PM. Epidemiologic trends in chronic renal replacement therapy over forty years: a Swiss dialysis experience. BMC Nephrol. 2012;13:52. | ||
Fukuhara S, Green J, Albert J, et al. Symptoms of depression, prescription of benzodiazepines, and the risk of death in hemodialysis patients in Japan. Kidney Int. 2006;70(10):1866–1872. |
 © 2016 The Author(s). This work is published and licensed by Dove Medical Press Limited. The full terms of this license are available at https://www.dovepress.com/terms.php and incorporate the Creative Commons Attribution - Non Commercial (unported, v3.0) License.
By accessing the work you hereby accept the Terms. Non-commercial uses of the work are permitted without any further permission from Dove Medical Press Limited, provided the work is properly attributed. For permission for commercial use of this work, please see paragraphs 4.2 and 5 of our Terms.
© 2016 The Author(s). This work is published and licensed by Dove Medical Press Limited. The full terms of this license are available at https://www.dovepress.com/terms.php and incorporate the Creative Commons Attribution - Non Commercial (unported, v3.0) License.
By accessing the work you hereby accept the Terms. Non-commercial uses of the work are permitted without any further permission from Dove Medical Press Limited, provided the work is properly attributed. For permission for commercial use of this work, please see paragraphs 4.2 and 5 of our Terms.