")
Back to Journals » Drug Design, Development and Therapy » Volume 10
Effects of probenecid and cimetidine on the pharmacokinetics of nemonoxacin in healthy Chinese volunteers
Authors Zhang Y , Dai X, Yang Y, Chen X, Wang T, Tang Y, Tsai C, Chang L, Chang Y, Zhong D
Received 7 September 2015
Accepted for publication 27 November 2015
Published 20 January 2016 Volume 2016:10 Pages 357—370
DOI https://doi.org/10.2147/DDDT.S95934
Checked for plagiarism Yes
Review by Single anonymous peer review
Peer reviewer comments 3
Editor who approved publication: Prof. Dr. Wei Duan
Yi-fan Zhang,1 Xiao-jian Dai,1 Yong Yang,1 Xiao-yan Chen,1 Ting Wang,2 Yun-biao Tang,3 Cheng-yuan Tsai,4 Li-wen Chang,4 Yu-ting Chang,4 Da-fang Zhong1
1State Key Laboratory of Drug Research, Shanghai Institute of Materia Medica, Chinese Academy of Sciences, Shanghai, 2Department of Pharmacy, The First Hospital Affiliated to Lanzhou University, Lanzhou, 3Department of Pharmacy, The General Hospital of Shenyang Military Region, Shenyang, People’s Republic of China; 4TaiGen Biotechnology Co., Ltd., Taipei, Taiwan
Purpose: To investigate the effects of probenecid and cimetidine on the pharmacokinetics of nemonoxacin in humans.
Methods: Two independent, open-label, randomized, crossover studies were conducted in 24 (12 per study) healthy Chinese volunteers. In Study 1, each volunteer received a single oral dose of 500 mg of nemonoxacin alone or with 1.5 g of probenecid divided into three doses within 25 hours. In Study 2, each volunteer received a single oral dose of 500 mg of nemonoxacin alone or with multiple doses of cimetidine (400 mg thrice daily for 7 days). The plasma and urine nemonoxacin concentrations were determined using validated liquid chromatography–tandem mass spectrometry methods.
Results: Coadministration of nemonoxacin with probenecid reduced the renal clearance (CLr) of nemonoxacin by 22.6%, and increased the area under the plasma concentration–time curve from time 0 to infinity (AUC0–∞) by 26.2%. Coadministration of nemonoxacin with cimetidine reduced the CLr of nemonoxacin by 13.3% and increased AUC0–∞ by 9.4%. Coadministration of nemonoxacin with probenecid or cimetidine did not significantly affect the maximum concentration of nemonoxacin or the percentage of the administered dose recovered in the urine.
Conclusion: Although probenecid reduced the CLr and increased the plasma exposure of nemonoxacin, these effects are unlikely to be clinically meaningful at therapeutic doses. Cimetidine had weaker, clinically meaningless effects on the pharmacokinetics of nemonoxacin.
Keywords: nemonoxacin, probenecid, cimetidine, clinical pharmacokinetics, drug–drug interaction
Introduction
Nemonoxacin (TG-873870) is a novel nonfluorinated quinolone developed by TaiGen Biotechnology Co., Ltd (Taipei, Taiwan). It shows a broad spectrum of activity against Gram-positive, Gram-negative, and atypical pathogens,1,2 and it appears to be more potent than other fluorinated quinolones (FQs), including ciprofloxacin, levofloxacin, and moxifloxacin.3 Clinical studies have shown that nemonoxacin has good safety/tolerability and efficacy profiles in the treatment of community-acquired pneumonia (CAP), superior to those of levofloxacin.4,5 The premarketing clinical studies for the oral formulation have been completed, and the Taiwan Food and Drug Administration approved oral nemonoxacin for the treatment of CAP in March 2014 (Manufacturing licence No. 058540).
To further understand the safety and effectiveness of new drugs, drug–drug interaction (DDI) studies must be considered. Nemonoxacin is quickly and completely absorbed after its oral administration and has a half-life of 10–13 hours, which supports its once-daily administration.6–8 Like other FQs, the absorption of nemonoxacin is reduced in the presence of polyvalent metal ions, such as Al3+, Mg2+, and Fe2+, because of its ability to chelate with metals.9 Because no major or minor metabolites of nemonoxacin have been found in in vitro or in vivo studies,6–8 the risk of metabolism-related DDIs is very low. Mass balance studies in healthy volunteers have shown that nemonoxacin is predominantly eliminated by the kidney, and 50%–70% of the dose is excreted unchanged in the urine more than 72 hours after its administration.6–9 After its binding by plasma proteins is considered (16%), the renal clearance (CLr) of the free (unbound) fraction of nemonoxacin is 132–164 mL/min, which is greater than the normal glomerular filtration rate (GFR) (ie, 125 mL/min), suggesting active renal secretion of the unchanged drug. Because nemonoxacin primarily exists as a zwitterion at physiological pH, it is likely to interact with organic anion transporters (OATs) and organic cation transporters (OCTs) in renal tubule cells. It is well documented that probenecid, which is actively secreted via the renal tubules and has a high affinity for OATs and OCTs, decreases the CLr of many FQs, including ciprofloxacin, gemifloxacin, gatifloxacin, and levofloxacin.10–13 It was also reported that coadministration of cimetidine, a competitive OCT2 inhibitor, significantly reduces the CLr of enoxacin, fleroxacin, gemifloxacin, or levofloxacin (by 13%–28%).13–15 Here, we performed two studies to determine the effects of probenecid and cimetidine on the pharmacokinetics of nemonoxacin in healthy volunteers.
Materials and methods
Study drugs
Nemonoxacin malate capsules (250 mg of nemonoxacin per capsule, Batch number: 12031007, Expiry date: March, 2014) were provided by TaiGen Biotechnology Co., Ltd. Probenecid tablets (250 mg of probenecid per tablet, Batch number: 110502, Expiry date: May, 2014) were manufactured by Shanghai Sine Pharmaceutical Co., Ltd (Shanghai, People’s Republic of China) and Tagment® tablets (400 mg of cimetidine per tablet, Batch number: 12100066, Expiry date: July, 2014) were manufactured by GlaxoSmithKline (China) Investment Co., Ltd (London, UK).
Volunteers
Twenty-four healthy Chinese volunteers were initially enrolled in the studies, with 12 volunteers (six males and six females) per study. In Study 1, all 12 volunteers completed the study and were included in the pharmacokinetic analyses. Their mean age was 23.3±2.7 years (range 19–27 years), mean body weight was 62.0±9.6 kg (range 58–80 kg), and mean body mass index (BMI) was 21.8±2.8 kg/m2 (range 19.6–23.9 kg/m2). In Study 2, one male volunteer withdrew for personal reasons after the administration of cimetidine on day 4 in Period 1. The other eleven volunteers completed the study and were included in the pharmacokinetic analysis. Their mean age was 21.8±1.6 years (range 18–24 years), mean body weight was 58.4±3.9 kg (range 51–65 kg), and mean BMI was 21.0±1.2 kg/m2 (range 19.7–23.2 kg/m2). The volunteers were in good health in terms of their medical history, physical examination, electrocardiography (ECG), and routine laboratory tests. None of the subjects had used any drugs for ≥2 weeks before the study and alcohol was forbidden from 72 hours before the administration of the study drugs. All volunteers provided written informed consent before enrollment.
Study design
Two independent, open-label, randomized, two-treatment, two-sequence, two-period crossover studies were designed to assess the effects of probenecid and cimetidine on the pharmacokinetics of nemonoxacin in healthy volunteers. Both studies included a washout period of 7 days between each study period. In Study 1, each volunteer received a single oral dose of 500 mg of nemonoxacin alone (Treatment A) or with 500-mg oral doses of probenecid 1 hour prior to and 12 and 24 hours after the administration of nemonoxacin (Treatment B). In Study 2, each volunteer received a single oral dose of 500 mg of nemonoxacin alone (Treatment C) or with multiple doses of cimetidine (Treatment D). In Treatment D, 400 mg of cimetidine was orally administered thrice daily for 7 days, and nemonoxacin was administered on day 5. In both studies, nemonoxacin was orally administered to the subjects after an overnight fast of ≥10 hours. No food was allowed for ≥4 hours after administration of the drug. Water was allowed as desired, except 2 hours before and 2 hours after drug administration. Study 1 was conducted at the General Hospital of Shenyang Military Region and Study 2 was conducted at the First Hospital Affiliated to Lanzhou University. The protocols of Study 1 and Study 2 were approved by the Independent Ethics Committee of the General Hospital of Shenyang Military Region and the Independent Ethics Committee of the First Hospital Affiliated to Lanzhou University, respectively.
Safety evaluation
All the volunteers who participated in the studies were included in the safety analysis. Safety was evaluated in terms of physical examinations, vital signs (blood pressure, pulse, respiratory rate, and body temperature), 12-lead ECG, laboratory tests (clinical chemistry, hematology, urinalysis, and serology), and adverse events (AEs). Vital signs and 12-lead ECG were assessed before the administration and at 2, 4, 24, 48, and 72 hours after the administration of nemonoxacin. Clinical chemistry, hematology, and urinalysis were conducted 1 day before and 24 hours after nemonoxacin administration. Additional laboratory tests were performed 72 hours after nemonoxacin administration if abnormal, and clinically significant values were observed at 24 hours. AEs were recorded throughout the study period and at the follow-up.
Sample collection for pharmacokinetic analysis
In both studies, blood samples (4 mL) were collected from a forearm vein and were placed in heparinized tubes. Samples were obtained before and at 0.33, 0.67, 1, 1.5, 2, 2.5, 3, 4, 6, 8, 12, 14, 24, 36, 48, and 72 hours after the administration of nemonoxacin. The blood samples were centrifuged at 1,500× g for 10 minutes. The plasma was separated and frozen at approximately −70°C until further analysis. Urine samples were collected before nemonoxacin was administered and during the following periods after its administration: 0–4, 4–8, 8–12, 12–24, 24–48, and 48–72 hours. The volume of urine was recorded in each collection interval, and 10 mL of well-mixed urine was retained and frozen at approximately −70°C until further analysis.
Bioanalytical methods
The plasma and urine nemonoxacin concentrations were determined with a validated liquid chromatography–tandem mass spectrometry assay (Supplementary data), after protein precipitation with acetonitrile. Chromatography was performed on an Eclipse Plus C18 column (particle size 3.5 μm, 100×4.6 mm; Agilent, Wilmington, DE, USA) with isocratic elution (mobile phase of 1% formic acid in 5 mM ammonium acetate–acetonitrile [70:30, v/v]) at a flow rate of 0.70 mL/min. The column temperature was 40°C. An API 4000 triple quadrupole mass spectrometer equipped with a TurboIonSpray source (Applied Biosystems, Concord, ON, Canada) was used to determine the concentrations of nemonoxacin. The concentrations were quantified with multiple reaction monitoring of transitions m/z 372→m/z 311 for nemonoxacin and m/z 402→m/z 364 for moxifloxacin (internal standard). The nemonoxacin response was linear (r>0.998) over concentration ranges of 0.005–5.0 and 0.2–200 μg/mL for plasma and urine, respectively. The intra- and inter-assay precision in the plasma matrix was <4.3% and 6.1%, respectively. For the urine concentrations, the intra- and inter-assay precision was <5.5% and 7.1%, respectively. The accuracy was 96.4%–102.1% for plasma and 96.1%–98.9% of the nominal value for urine. In method validation, dilution test was performed to assess the reliability of the method at concentration levels outside the calibration range. The results indicated that a tenfold dilution of human plasma samples containing nenomoxacin above the upper limit of quantification (ULOQ) was acceptable. In unknown sample analysis, for concentrations higher than ULOQ, the samples were then reassayed after appropriate dilution.
Pharmacokinetic analysis
The pharmacokinetic parameters were determined using the standard noncompartmental method with the Phoenix WinNonlin software version 6.3 (Pharsight, Mountain View, CA, USA). The maximum concentration (Cmax) and the time to reach Cmax (tmax) were obtained from the plasma concentration–time curves. The elimination rate constant (λz) was calculated by linear regression of the terminal linear portion of the ln-concentration–time curve, and the terminal elimination half-life (t1/2) was calculated as 0.693/λz. The area under the plasma concentration–time curve (AUC) from time 0 to the last time point (AUC0–t) was calculated using the linear trapezoidal method. The AUC from time 0 to infinity (AUC0–∞) was calculated as AUC0–t+Ct/λz, where Ct is the last measurable concentration. The mean residence time (MRT) was calculated as AUMC/AUC, where AUMC was the area under the moment curve. Oral clearance (CL/F) was calculated as the nemonoxacin dose/AUC0–∞, and the terminal volume of distribution without correction for bioavailability (Vz/F) was calculated as oral clearance/λz. Renal clearance (CLr) was determined based on the cumulative amount of nemonoxacin excreted in the urine divided by the AUC for the collection interval. The percentage of the administered dose recovered in the urine (Fe) was also determined.
Statistical analysis
In both studies, AUCs and Cmax were loge-transformed and compared by analysis of variance (ANOVA) with the following factors: treatment sequence, volunteer nested with treatment sequence, period, and treatment. The point estimates and associated 90% confidence intervals (CIs) for the differences between each treatment (Study 1, B-A; Study 2, D-C) were determined using the residual variances taken from the model. The point estimates and CIs on the log scale were then back-transformed to give point estimates and CIs for the ratios (Study 1, B:A; Study 2, D:C). For all analyses, P-values <0.05 were considered statistically significant.
Results
Effects of probenecid on nemonoxacin pharmacokinetics
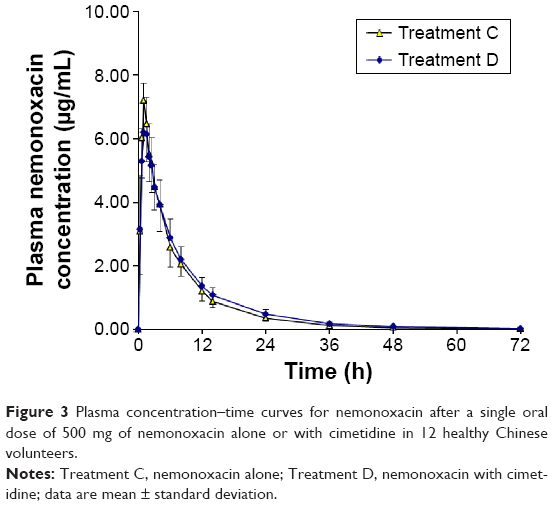
The plasma concentration–time curves and urinary recovery-time curves after the administration of a single dose of 500 mg of nemonoxacin, either alone or with probenecid, are shown in Figures 1 and 2, respectively. The calculated parameters and the statistical results are summarized in Table 1. After a single oral dose of 500 mg of nemonoxacin, the mean Cmax was 5.67 μg/mL, which occurred at 1 hour, and the AUC0–∞ was 46.5 h·μg/mL. The mean Fe and CLr were 58.2% and 6.41 L/h, respectively. The coadministration of nemonoxacin with probenecid had some effects on the pharmacokinetics of nemonoxacin, increasing AUC0–∞ by 26.2%, reducing CLr by 22.6%, and increasing MRT from 9.24 to 11.1 hours. The Cmax and Fe of nemonoxacin were unaffected by probenecid.
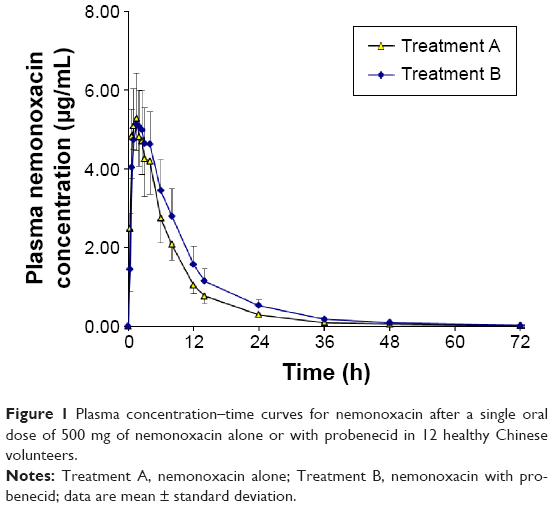 | Figure 1 Plasma concentration–time curves for nemonoxacin after a single oral dose of 500 mg of nemonoxacin alone or with probenecid in 12 healthy Chinese volunteers. |
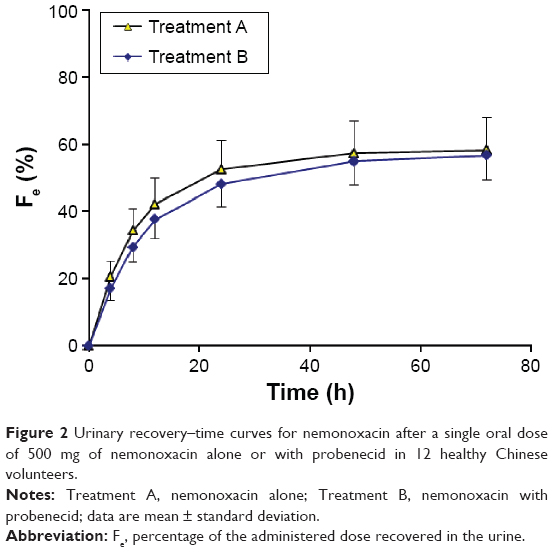 | Figure 2 Urinary recovery–time curves for nemonoxacin after a single oral dose of 500 mg of nemonoxacin alone or with probenecid in 12 healthy Chinese volunteers. |
 | Table 1 Pharmacokinetic characteristics of nemonoxacin in 12 healthy Chinese volunteers after a single oral dose of 500 mg of nemonoxacin alone or with probenecid |
Effects of cimetidine on nemonoxacin pharmacokinetics
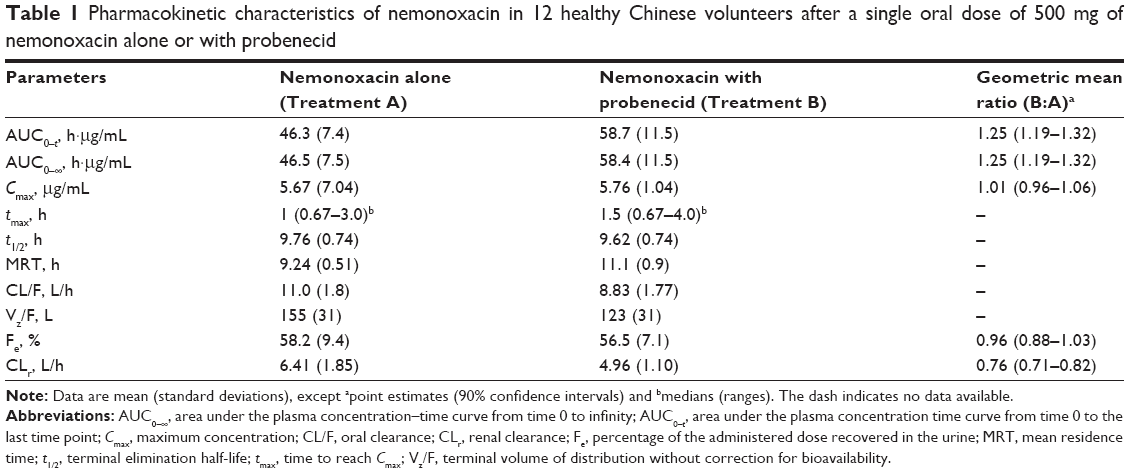
The plasma concentration–time curves for nemonoxacin and urinary recovery-time curves after the administration of a single dose of 500 mg of nemonoxacin, alone or in combination with cimetidine, are shown in Figures 3 and 4, respectively. The calculated parameters and the statistical results are summarized in Table 2. Cimetidine had a small but clinically meaningless effect on AUC0–∞, which increased by only 9.4%. Cimetidine reduced CLr by 13.3% and increased MRT from 9.74 to 11.5 hours. The Cmax and Fe of nemonoxacin were unaffected by cimetidine, and the other pharmacokinetic parameters were changed by <20%.
 | Figure 3 Plasma concentration–time curves for nemonoxacin after a single oral dose of 500 mg of nemonoxacin alone or with cimetidine in 12 healthy Chinese volunteers. |
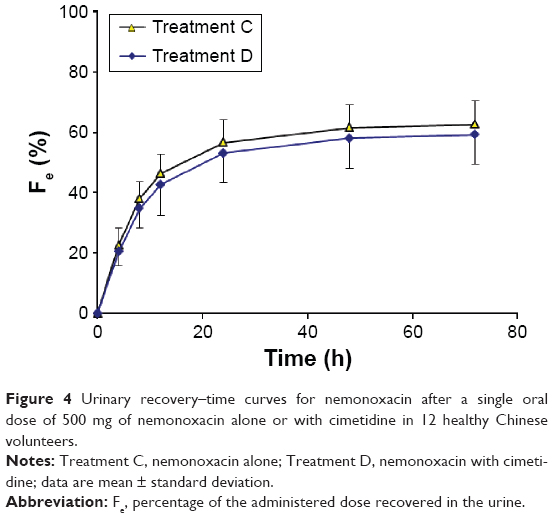 | Figure 4 Urinary recovery–time curves for nemonoxacin after a single oral dose of 500 mg of nemonoxacin alone or with cimetidine in 12 healthy Chinese volunteers. |
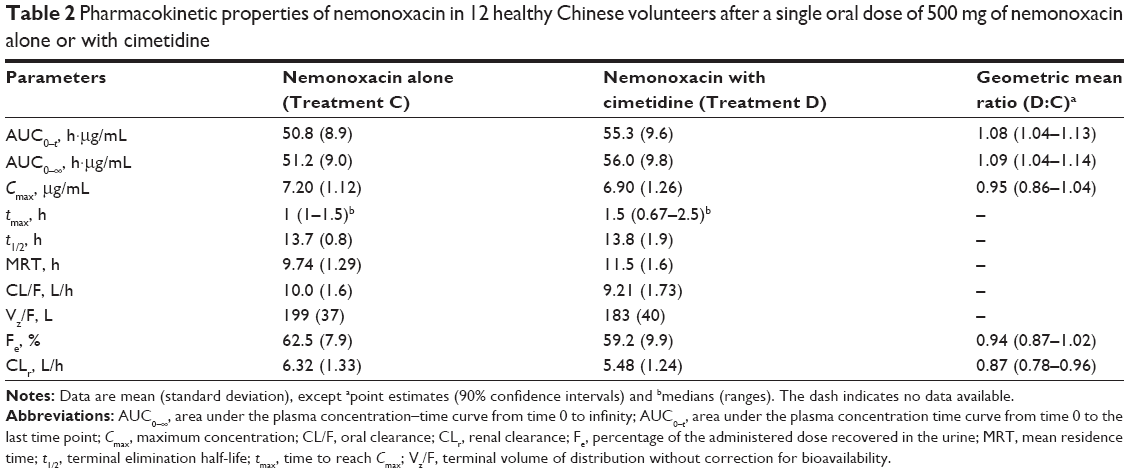 | Table 2 Pharmacokinetic properties of nemonoxacin in 12 healthy Chinese volunteers after a single oral dose of 500 mg of nemonoxacin alone or with cimetidine |
Safety
A total of 16 adverse events (AEs) were reported by eleven volunteers in both studies. In Study 1, one episode of sinus bradycardia and one episode of prolonged QT on ECG were considered to be possibly related to the study drug. In Study 2, one episode of increased blood uric acid, one episode of upper abdominal pain, and two episodes of flatulence were considered to be possibly related to the study drug. All the AEs in both studies were mild and resolved without treatment. None of the volunteers withdrew from the study because of an AE. Therefore, nemonoxacin was considered to be well tolerated when administered alone or in combination with probenecid or cimetidine.
Discussion
A recent review of the clinical literature indicated that tubular secretion and resorption are the major determinants of the plasma half-lives, efficacy, and DDIs of FQs.16 Because of their zwitterionic properties, FQs are likely to interact with organic anion and cation transporters belonging to the solute carrier subfamily, including OAT1, OAT3, and OCT2. Many in vivo studies have shown DDIs between FQs and probenecid, a substrate for OATs and OCTs.10–13 Nemonoxacin differs from FQs in that it lacks the fluorine at the R6 position but, like FQs, nemonoxacin has two ionizable groups and displays a high CLr. Therefore, it may interact with renal OATs or OCTs, as indicated by the present results.
Higher than normal doses of the interacting drugs are often used in DDI studies. For example, in DDI studies of ciprofloxacin or gemifloxacin, the interacting drug, probenecid, was administered at doses of 3.5–4.5 g, which were divided into multiple daily doses. Under this treatment regimen, the effects of probenecid were likely to be exaggerated because the CLr of ciprofloxacin and gemifloxacin decreased by 65% and 51%, respectively, and the AUC0–∞ of ciprofloxacin increased by 72%.10,11 However, in DDI studies of gatifloxacin or moxifloxacin, probenecid was used at a clinically relevant dose (500 mg twice daily). At this dose, the CLr of gatifloxacin decreased by 38% and the AUC0–∞ increased by 42%,12 but no effects were observed in the moxifloxacin DDI study.17 Using a modeling method, Landersdorfer et al predicted that the AUC0–24 h of gemifloxacin increases by 20% when administered in combination with 500 mg of probenecid twice daily.11 With reference to the design of the gatifloxacin and moxifloxacin studies, we used a daily dose of 1.5 g of probenecid, which was divided into three doses. The results showed that the coadministration of probenecid reduced the CLr of nemonoxacin by 22.6% and increased its AUC0–∞ by 26.2%. The extent of this interaction is similar to its interaction with gemifloxacin, but is weaker than its interaction with gatifloxacin. However, considering the good safety/tolerability profile of nemonoxacin, this DDI may be clinically meaningless.
Compared to probenecid, the effects of cimetidine on the pharmacokinetics of nemoxacin were much weaker, with a reduction in the CLr of nemonoxacin by 13.3% and an increase in the AUC by <10%. Although it has been reported that cimetidine inhibits the renal secretion of some FQs and reduces the CLr of temafloxacin,18 enoxacin,19 levofloxacin,13 and gemifloxacin15 by 19%, 26%, 24%, and 28%, respectively, its effects on nemonoxacin were much weaker and are unlikely to be clinically relevant. The urine recovery of nemonoxacin was not significantly affected by its coadministration with either probenecid or cimetidine.
Conclusion
In conclusion, we observed no clinically relevant DDIs when nemonoxacin was coadministered with probenecid or cimetidine in healthy Chinese volunteers. Based on these findings, no clinically relevant pharmacokinetic interactions are expected when nemonoxacin is coadministered with other substrates of OATs or OCTs.
Acknowledgment
The study was supported by the National Science & Technology Major Project “Key New Drug Creation and Manufacturing Program” of China (Number: 2012ZX0931-001).
Disclosure
Cheng-yuan Tsai, Li-wen Chang, and Yu-ting Chang are employees of TaiGen Biotechnology Co., Ltd. The other authors report no conflicts of interest in this work.
References
Adam HJ, Laing NM, King CR, Lulashnyk B, Hoban DJ, Zhanel GG. In vitro activity of nemonoxacin, a novel nonfluorinated quinolone, against 2,440 clinical isolates. Antimicrob Agents Chemother. 2009; 53:4915–4920. | ||
Chen YH, Liu CY, Lu JJ, King CH, Hsueh PR. In vitro activity of nemonoxacin (TG-873870), a novel non-fluorinated quinolone, against clinical isolates of Staphylococcus aureus, enterococci and Streptococcus pneumoniae with various resistance phenotypes in Taiwan. J Antimicrob Chemother. 2009;64:1226–1229. | ||
Lauderdale TL, Shiau YR, Lai JF, Chen HC, King CH. Comparative in vitro activities of nemonoxacin (TG-873870), a novel nonfluorinated quinolone, and other quinolones against clinical isolates. Antimicrob Agents Chemother. 2010;54:1338–1342. | ||
van Rensburg DJ, Perng RP, Mitha IH, et al; Efficacy and safety of nemonoxacin versus levofloxacin for community-acquired pneumonia. Antimicrob Agents Chemother. 2010;54:4098–4106. | ||
Qin X, Huang H. Review of nemonoxacin with special focus on clinical development. Drug Des Devel Ther. 2014;8:765–774. | ||
Guo B, Wu X, Zhang Y, et al; Safety and clinical pharmacokinetics of nemonoxacin, a novel non-fluorinated quinolone, in healthy Chinese volunteers following single and multiple oral doses. Clin Drug Investig. 2012;32:475–486. | ||
Lin L, Chang LW, Tsai CY, et al; Dose escalation study of the safety, tolerability, and pharmacokinetics of nemonoxacin (TG-873870), a novel potent broad-spectrum nonfluorinated quinolone, in healthy volunteers. Antimicrob Agents Chemother. 2009;54:405–410. | ||
Chung DT, Tsai CY, Chen SJ, et al; Multiple-dose safety, tolerability, and pharmacokinetics of oral nemonoxacin (TG-873870) in healthy volunteers. Antimicrob Agents Chemother. 2010;54:411–417. | ||
Zhang YF, Dai XJ, Wang T, et al; Effects of an Al3+− and Mg2+−containing antacid, ferrous sulfate, and calcium carbonate on the absorption of nemonoxacin (TG-873870) in healthy Chinese volunteers. Acta Pharmacol Sin. 2014;35:1586–1592. | ||
Landersdorfer CB, Kirkpatrick CM, Kinzig M, et al; Competitive inhibition of renal tubular secretion of ciprofloxacin and metabolite by probenecid. Br J Clin Pharmacol. 2010;69:167–178. | ||
Landersdorfer CB, Kirkpatrick CM, Kinzig M, et al; Competitive inhibition of renal tubular secretion of gemifloxacin by probenecid. Antimicrob Agents Chemother. 2009;53:3902–3907. | ||
Nakashima M, Uematsu T, Kosuge K, et al; Single- and multiple-dose pharmacokinetics of AM-1155, a new 6-fluoro-8-methoxy quinolone, in humans. Antimicrob Agents Chemother. 1995;39:2635–2640. | ||
Fish DN, Chow AT. The clinical pharmacokinetics of levofloxacin. Clin Pharmacokinet. 1997;32:101–119. | ||
Mulgaonkar A, Venitz J, Gründemann D, Sweet DH. Human organic cation transporters 1 (SLC22A1), 2 (SLC22A2), and 3 (SLC22A3) as disposition pathways for fluoroquinolone antimicrobials. Antimicrob Agents Chemother. 2013;57:2705–2711. | ||
Allen A, Bird N, Dixon R, et al; Effect of cimetidine on the pharmacokinetics of oral gemifloxacin in healthy volunteers. Clin Drug Invest. 2001;21:519–526. | ||
Mulgaonkar A1, Venitz J, Sweet DH. Fluoroquinolone disposition: identification of the contribution of renal secretory and reabsorptive drug transporters. Expert Opin Drug Metab Toxicol. 2012;8:553–569. | ||
Stass H, Sachse R. Effect of probenecid on the kinetics of a single oral 400 mg dose of moxifloxacin in healthy male volunteers. Clin Pharmacokinet. 2001;40(Suppl 1):71–76. | ||
Sörgel F, Granneman GR, Stephan U, Locke C. Effect of cimetidine on the pharmacokinetics of temafloxacin. Clin Pharmacokinet. 1992;22(Suppl 1):75–82. | ||
Misiak PM1, Eldon MA, Toothaker RD, Sedman AJ. Effects of oral cimetidine or ranitidine on the pharmacokinetics of intravenous enoxacin. J Clin Pharmacol. 1993;133:53–56. |
Supplementary materials
Instrumentation and liquid chromatography–tandem mass spectrometry (LC–MS/MS) analytical conditions
The high-performance liquid chromatography system consisted of a LC-20AD pump, a DGU-20A3 degasser, a SIL-20AC autosampler, and a CTO-20A thermostatted column compartment (Shimadzu, Kyoto, Japan). Nemonoxacin and the internal standard (IS) moxifloxacin were separated on an Eclipse Plus C18 column (100×4.6 mm, 3.5 μm particle size; Agilent, Wilmington, DE, USA) protected by a Security Guard C18 column (4×3.0 mm, 5 μm; Phenomenex, Torrance, CA, USA). The mobile phase was a mixture of 1% formic acid in 5 mM ammonium acetate–acetonitrile (70:30, v/v) and the flow rate was 0.7 mL/min. The column temperature was maintained at 40°C.
Mass spectrometric detection was performed on an API4000 triple quadrupole instrument (Applied Biosystems, Concord, ON, Canada) in multiple-reaction monitoring mode. A Electrospray Eionization (ESI) interface was used in positive ionization mode. Data processing was performed with Analyst 1.4.1 software (Applied Biosystems).The instrument was operated with an ion spray voltage of +4.2 kV, heater gas temperature of 400°C, nebulizer gas (gas 1) of 50 psi, heater gas (gas 2) of 50 psi, curtain gas of 30 psi, and collision gas of 4 psi. Nitrogen was used as the nebulizer, heater, curtain, and collision-activated dissociation gas. The declustering potential was set at 80V for nemonoxacin and the IS. In the ESI-positive scan mode, the protonated molecules [M + H]+ of nemonoxacin and moxifloxacin mainly produce fragment ions at m/z 354 and 384, respectively, by the neutral loss of one molecule of water (Figure S1). However, the transitions m/z 372→354 and m/z 402→384 could not be used for quantitative analysis because of their large variabilities. Instead, the optimized multiple-reaction monitoring fragmentation transitions were set at m/z 372→m/z 311 with a collision energy (CE) of 30 eV for nemonoxacin, and m/z 402→m/z 364 with a CE of 39 eV for moxifloxacin. The dwell time for each transition was 200 ms.
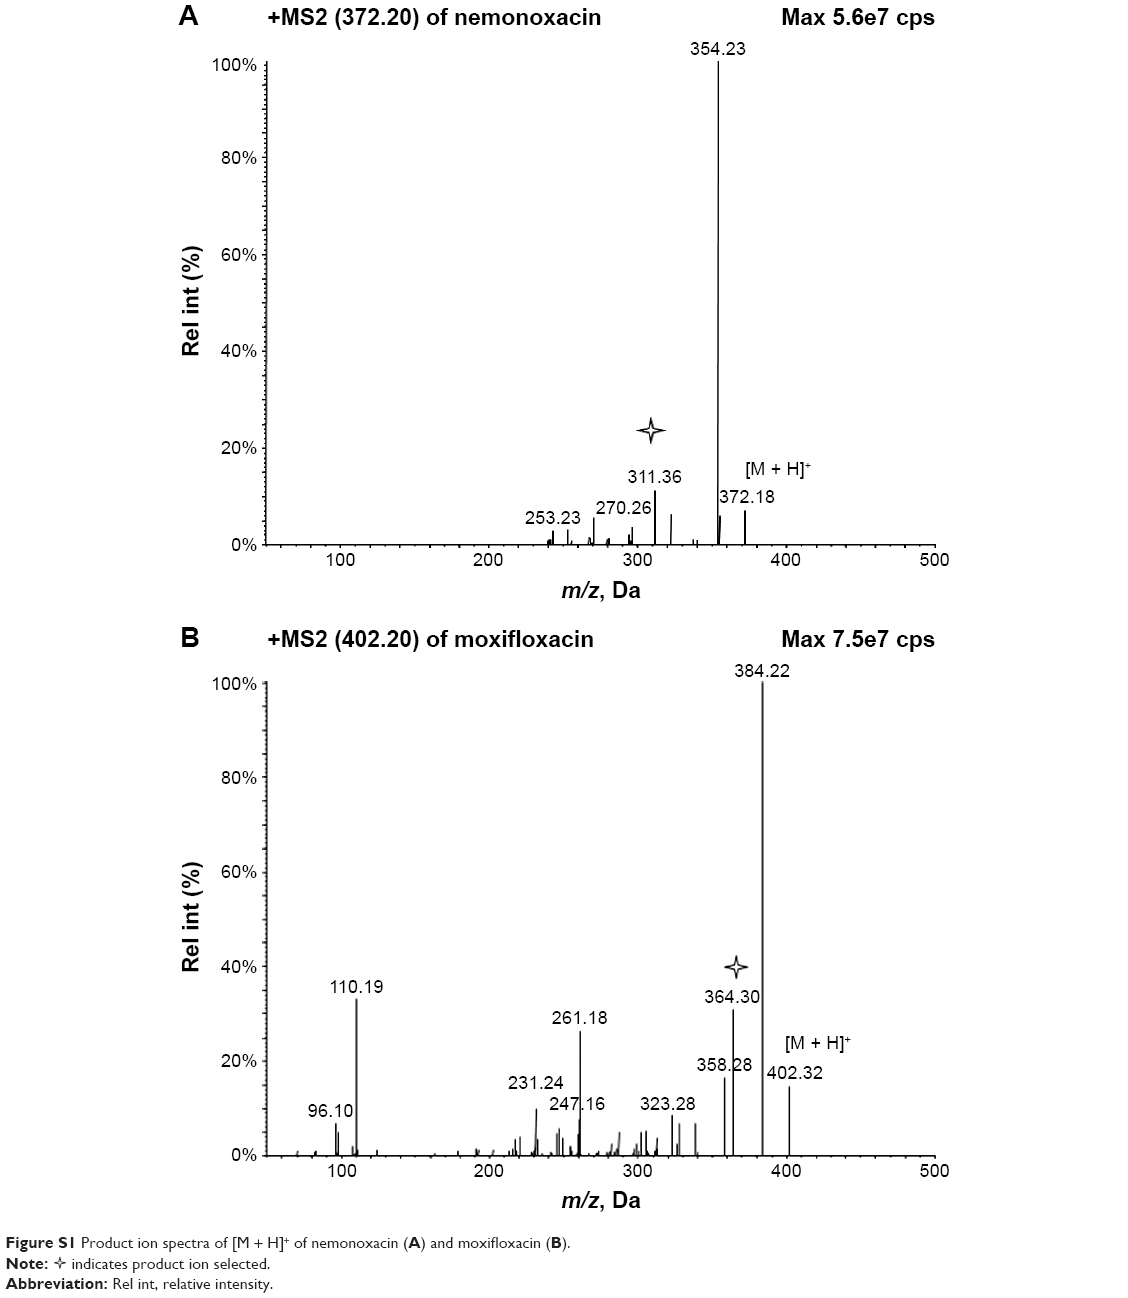 | Figure S1 Product ion spectra of [M + H]+ of nemonoxacin (A) and moxifloxacin (B). |
 indicates product ion selected.
Preparation of calibration standards and quality control samples
Two stock solutions of nemonoxacin were prepared by dissolving appropriate amounts of nemonoxacin malate in methanol. The stock solution containing 765 μg/mL nemonoxacin was used to prepare the calibration curve samples. The other stock solution containing 703 μg/mL nemonoxacin was used to prepare the quality control (QC) samples. The stock solution was serially diluted with methanol/water (50:50, v/v) to yield seven working solutions. These working solutions were used to spike blank pooled human plasma or urine to yield calibration standards with concentrations of 0.005, 0.015, 0.05, 0.20, 0.80, 2.0, and 5.0 μg/mL in plasma and 0.2, 0.5, 2.0, 8.0, 20.0, 80.0, and 200 μg/mL in urine. The QC samples were similarly prepared to yield concentrations of 0.01, 0.50, and 4.0 μg/mL in plasma and 0.4, 10.0, and 160 μg/mL in urine. The stock solutions were stored at 4°C and were brought to room temperature before use. The standard working solutions were freshly prepared before use. The QC samples were aliquoted into 1.5 mL polypropylene tubes and stored at −70°C until analysis.
Sample preparation
To determine the nemonoxacin concentrations in plasma, frozen samples were thawed at room temperature and thoroughly vortexed. The IS (25 μL, 2.0 μg/mL) and acetonitrile (200 μL) were added to plasma (100 μL). The mixture was vortexed for 1 minute and then centrifuged at 11,000× g for 5 minutes. Next, the supernatant (100 μL) was transferred to another tube and evaporated to dryness under a stream of nitrogen at 40°C. The residue was dissolved in the mobile phase (150 μL), and the resulting solution (20 μL) was injected into the LC–MS/MS system for analysis.
To determine nemonoxacin concentrations in urine, the IS (20 μL, 100 μg/mL) and acetonitrile (200 μL) were added to urine (100 μL). The mixture was vortexed for 1 minute and then centrifuged at 11,000× g for 5 minutes. Next, the supernatant (15 μL) was transferred to a new tube and the mobile phase (985 μL) was added. The mixture was vortexed for 10 seconds and the resulting solution (20 μL) was injected into the LC–MS/MS system for analysis.
Method validation
Selectivity
Selectivity was assessed by comparing the chromatograms of blank human plasma or urine samples with the corresponding spiked plasma or urine samples and samples obtained from volunteers after a dose of nemonoxacin. The typical chromatograms of blank plasma samples, blank samples spiked with nemonoxacin and the IS, and plasma samples from a volunteer are shown in Figure S2.The corresponding chromatograms for urine samples are shown in Figure S3. The retention times in plasma and urine were 2.5 minutes for nemonoxacin and 2.2 minutes for the IS.
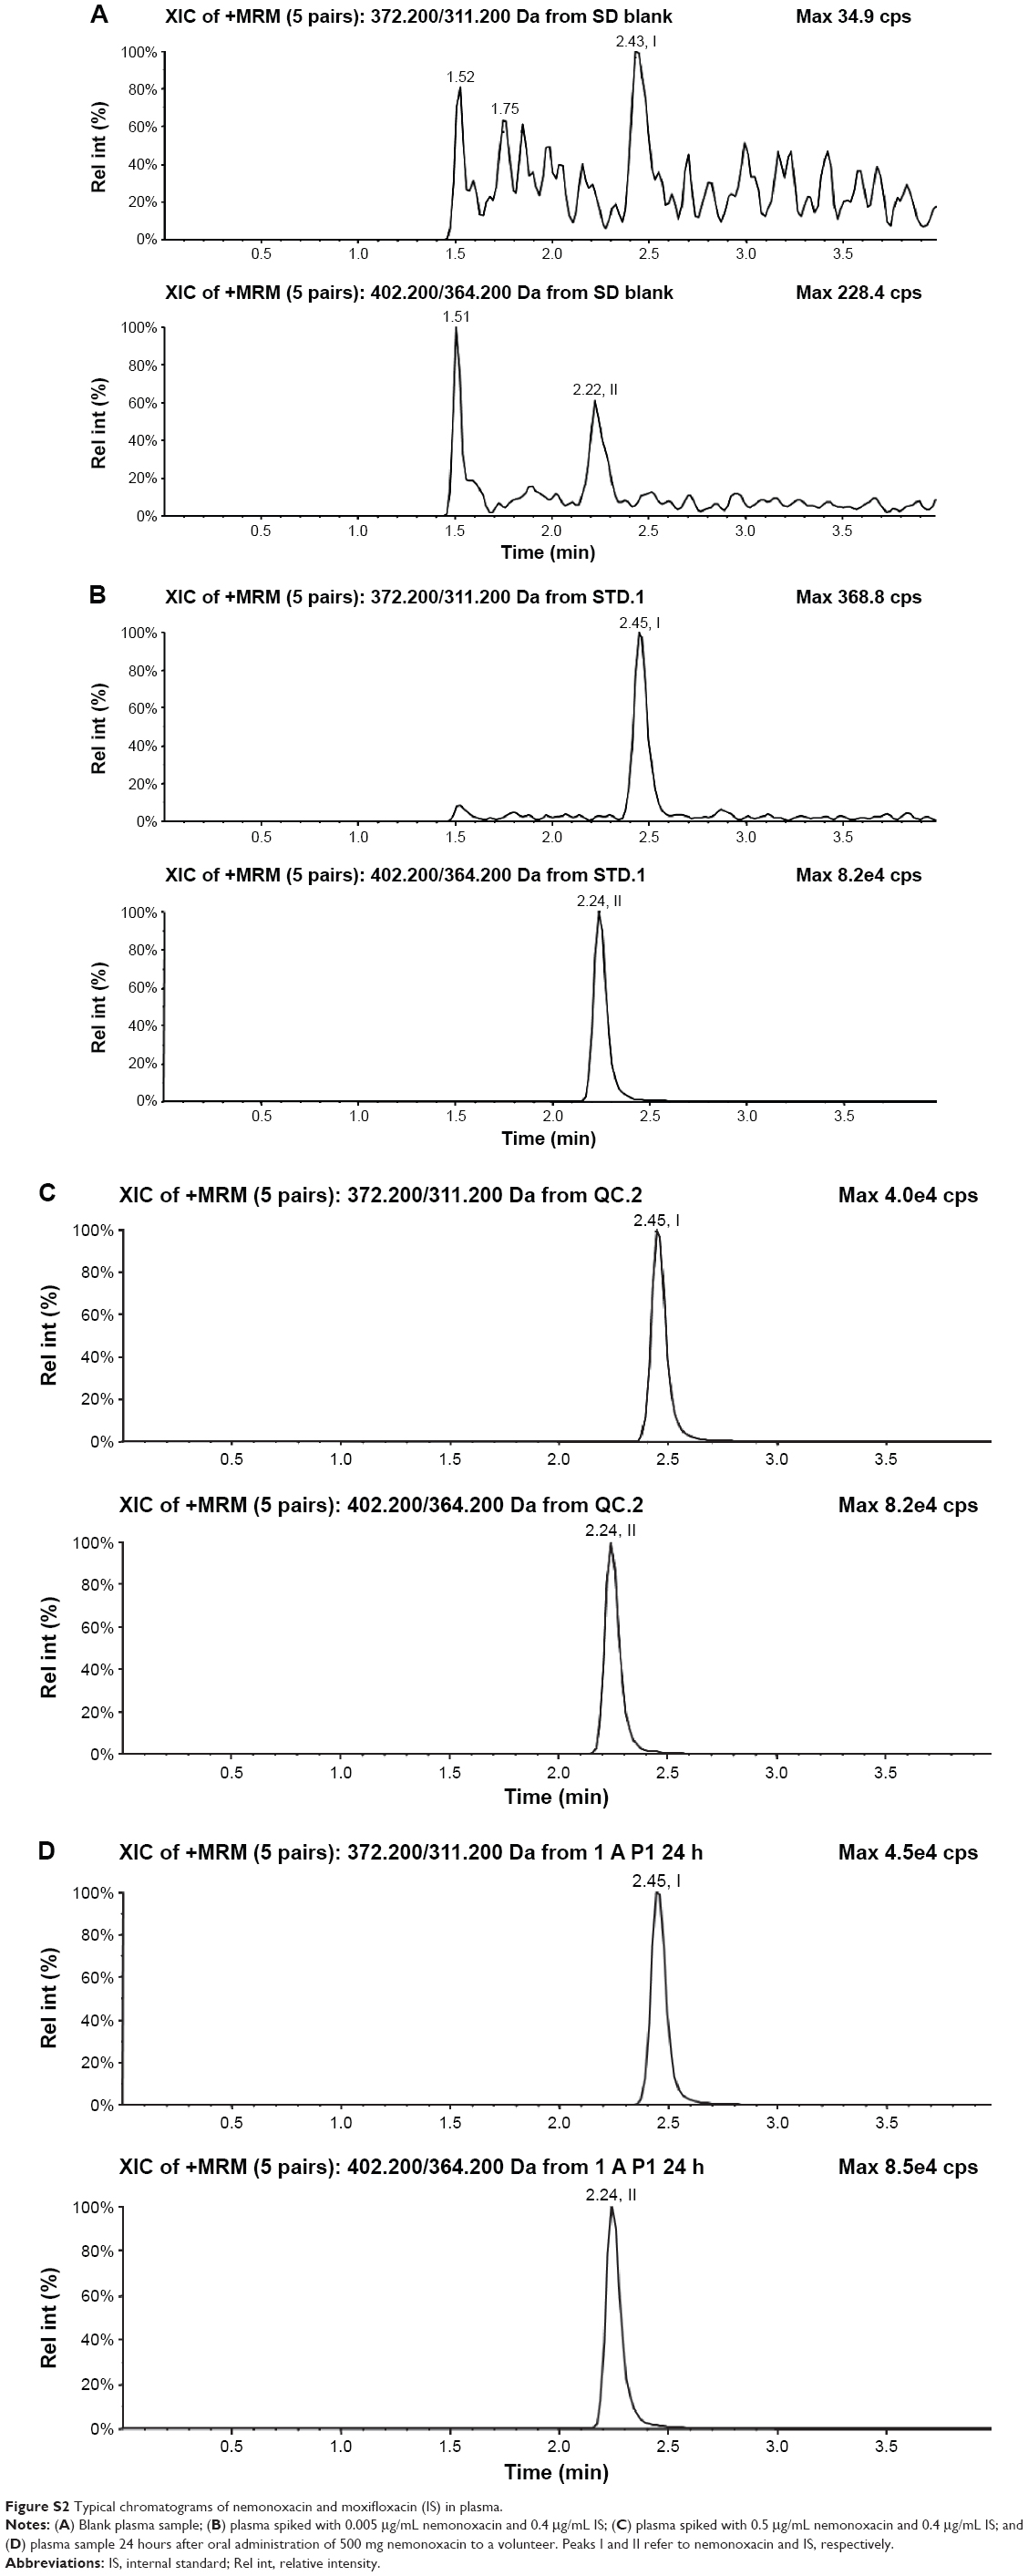 | Figure S2 Typical chromatograms of nemonoxacin and moxifloxacin (IS) in plasma. |
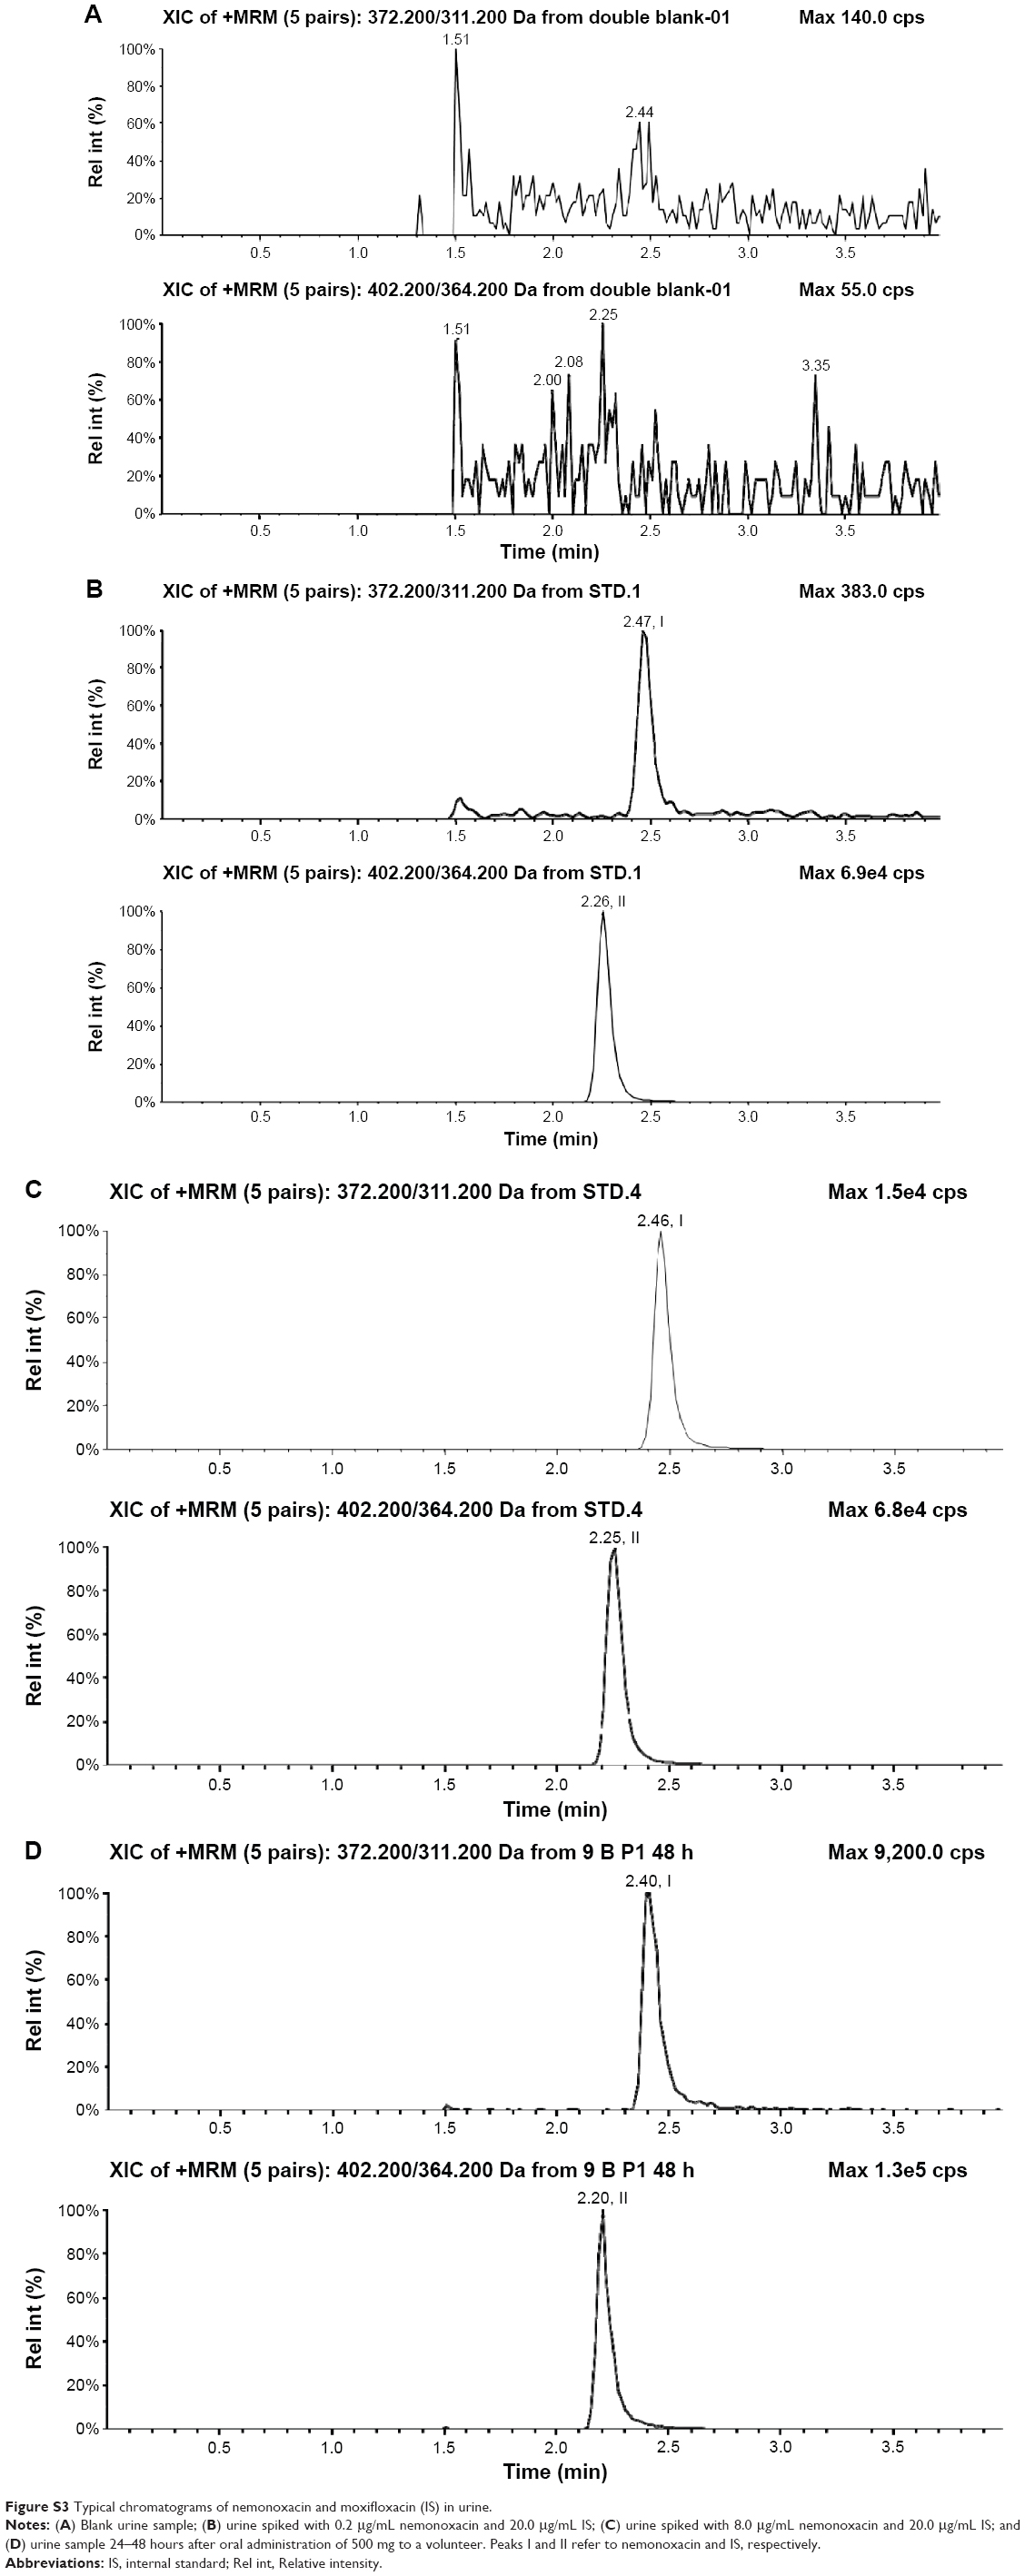 | Figure S3 Typical chromatograms of nemonoxacin and moxifloxacin (IS) in urine. |
Linearity of calibration curves and the lower limit of quantification
To evaluate linearity, we prepared calibration curves with seven concentration levels from 0.005 to 5.0 μg/mL in plasma, and from 0.2 to 200 μg/mL in urine, in duplicate on 3 consecutive days. The curves were fitted with a weighted (1/x2) least squares linear regression to measure the peak area ratio of nemonoxacin to IS. The lower limit of quantification (LLOQ), which was defined as the lowest concentration on the calibration curve, was assessed by analyzing six replicates on 3 separate days. The nemonoxacin response was linear for concentrations ranging from 0.005 to 5.00 μg/mL in plasma and from 0.2 to 200 μg/mL in urine. The typical equations of the calibration curve were y =1.06×10⁻³x+8.0×10⁻⁵ (r=0.9989) for plasma and y =0.0190x-3.77×10⁻⁵ (r=0.9977) for urine, where y represents the peak area ratio of nemonoxacin to IS, and x represents the plasma or urine concentration.
The LLOQ was 0.005 μg/mL in plasma and 0.2 μg/mL in urine. The intra- and inter-day precision and accuracy at the LLOQ in plasma or urine are shown in Table S1. The precision and accuracy were acceptable, with relative standard deviation (RSD) values of <14.3% and relative error (RE) values from -1.9% to 1.4%.
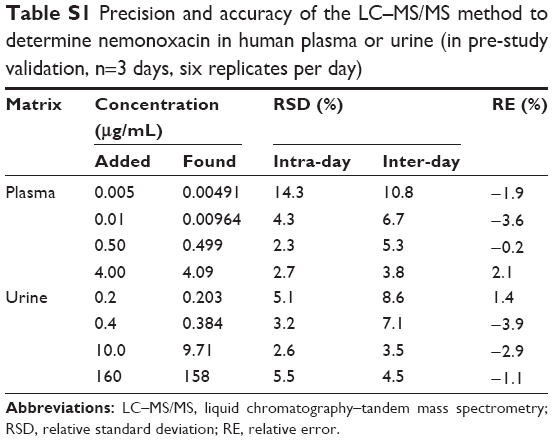 | Table S1 Precision and accuracy of the LC–MS/MS method to determine nemonoxacin in human plasma or urine (in pre-study validation, n=3 days, six replicates per day) |
Precision and accuracy
Precision and accuracy were assessed by determining the concentrations of the QC samples (0.01, 0.50, and 4.0 μg/mL in plasma; 0.40, 10.0, and 160 μg/mL in urine) in six replicates on 3 consecutive validation days. The accuracy and precision were calculated by one-way analysis of variance, and the results are summarized in Table S1. The intra- and inter-day precision were <4.3% and 6.1%, respectively, in plasma and were <5.5% and 7.1%, respectively, in urine. The accuracy ranged from 96.4% to 102.1% of the nominal concentration in plasma, and from 96.1% to 98.9% in urine. Therefore, the intra- and inter-assay precision and accuracy for the determination of nemonoxacin were acceptable.
A dilution test was also performed to evaluate the precision and accuracy of the method for diluted samples. QC samples containing 25 μg/mL nemonoxacin were diluted tenfold with blank plasma in six replicates. All of the back-calculated values were within ±15% of the nominal concentration. The precision and accuracy values were 4.6% and 103.9%, respectively, which were acceptable for a tenfold dilution of human plasma samples with nemonoxacin concentrations above the upper limit of quantification.
Recovery and matrix effect
Recovery was determined by comparing the mean peak area of samples (three concentrations in six replicates) subjected to the extraction process with the mean peak area of three blank plasma samples spiked with neat solutions after protein precipitation. The recovery of the IS was evaluated in a similar way. The mean recoveries of nemonoxacin in plasma were 93.0%, 88.5%, and 81.2% for nemonoxacin concentrations of 0.01, 0.50, and 4.0 μg/mL, respectively. The mean recoveries in urine were 91.7%, 90.1%, and 92.9% for nemonoxacin concentrations of 0.2, 10.0, and 160 μg/mL, respectively. The mean recoveries of IS in plasma and urine were 94.0% and 98.0%, respectively.
Blank plasma or urine samples from six different sources were processed and then spiked with neat solutions of nemonoxacin and the IS to study the matrix effect. The corresponding peak area ratios of nemonoxacin to the IS in spiked plasma or urine post-extraction (A) were compared with those of water-substituted samples (B) at equivalent concentrations. The matrix effect was calculated as A/B ×100. The matrix effects of the IS were determined in a similar way. The matrix effect values in plasma were 99.3% and 99.5% for the nemonoxacin concentrations of 0.01 and 4.0 μg/mL, respectively. The matrix effect value for the IS in plasma was 101%. The matrix effect values in urine were 81.0% and 89.8% for nemonoxacin concentrations of 10.0 and 160 μg/mL, respectively. The matrix effect value for the IS in urine was 112%.
Stability
The stability of nemonoxacin in human plasma and urine was evaluated for short-term, long-term, post-preparation, and freeze–thaw conditions. Nemonoxacin was stable in plasma or urine samples stored at room temperature for 6 hours, in the mobile phase for 24 hours, after five freeze–thaw cycles, and in plasma or urine samples stored at −70°C for >2 months. The stock solutions of nemonoxacin were also stable after storage at 4°C for >2 months.
Effects of probenecid or cimetidine on the determination of nemonoxacin in plasma
To evaluate the effects of probenecid on the determination of nemonoxacin in plasma, the QC samples were spiked with 35.0 μg/mL of probenecid and 0.005 μg/mL of nemonoxacin and analyzed in six replicates. The precision and accuracy of nemonoxacin were acceptable, with RSD and RE values of 9.5% and 2.3%, respectively. The effects of cimetidine were assessed in a similar way, by spiking QC samples with 5.00 μg/mL of cimetidine and 0.005 μg/mL of nemonoxacin with six replicates. The RSD and RE values were 13.9% and -8.4%, respectively.
 © 2016 The Author(s). This work is published and licensed by Dove Medical Press Limited. The full terms of this license are available at https://www.dovepress.com/terms.php and incorporate the Creative Commons Attribution - Non Commercial (unported, v3.0) License.
By accessing the work you hereby accept the Terms. Non-commercial uses of the work are permitted without any further permission from Dove Medical Press Limited, provided the work is properly attributed. For permission for commercial use of this work, please see paragraphs 4.2 and 5 of our Terms.
© 2016 The Author(s). This work is published and licensed by Dove Medical Press Limited. The full terms of this license are available at https://www.dovepress.com/terms.php and incorporate the Creative Commons Attribution - Non Commercial (unported, v3.0) License.
By accessing the work you hereby accept the Terms. Non-commercial uses of the work are permitted without any further permission from Dove Medical Press Limited, provided the work is properly attributed. For permission for commercial use of this work, please see paragraphs 4.2 and 5 of our Terms.