")
Back to Journals » Diabetes, Metabolic Syndrome and Obesity » Volume 13
Effects of MK-7 Supplementation on Glycemic Status, Anthropometric Indices and Lipid Profile in Patients with Type 2 Diabetes: A Randomized Controlled Trial
Authors Karamzad N , Faraji E, Adeli S , Carson‐Chahhoud K, Azizi S , Pourghassem Gargari B
Received 8 March 2020
Accepted for publication 11 June 2020
Published 26 June 2020 Volume 2020:13 Pages 2239—2249
DOI https://doi.org/10.2147/DMSO.S253014
Checked for plagiarism Yes
Review by Single anonymous peer review
Peer reviewer comments 3
Editor who approved publication: Professor Ming-Hui Zou
Nahid Karamzad,1– 3 Esmaeil Faraji,4 Shaghayegh Adeli,2 Kristin Carson‐Chahhoud,5,6 Samaneh Azizi,2 Bahram Pourghassem Gargari2,3
1Student Research Committee, Tabriz University of Medical Sciences, Tabriz, Iran; 2Department of Biochemistry and Diet Therapy, Faculty of Nutrition and Food Sciences, Tabriz University of Medical Sciences, Tabriz, Iran; 3Nutrition Research Center, Faculty of Nutrition and Food Sciences, Tabriz University of Medical Sciences, Tabriz, Iran; 4Endocrine Research Center, Tabriz University of Medical Sciences, Tabriz, Iran; 5Australian Centre for Precision Health, School of Health Sciences, University of South Australia, Adelaide, South Australia, Australia; 6School of Medicine, University of Adelaide, Adelaide, South Australia, Australia
Correspondence: Bahram Pourghassem Gargari
Department of Biochemistry and Diet Therapy, Faculty of Nutrition and Food Sciences, Tabriz University of Medical Sciences, Tabriz, Iran
Email [email protected]
Background: Type 2 diabetes mellitus (T2DM) is a prevalent disorder which accounts for 90– 95% of diabetic patients. The aim of this study was to assess the effects of menaquinone (MK-7) supplementation on glycemic indices, anthropometric indices and lipid profile, among patients with T2DM.
Methods: In this double-blind placebo-controlled randomized clinical trial, 60 men and women with T2DM were allocated equally into either the MK-7 (200 μg/day) or the placebo group. Physical activity level and dietary intake were assessed using the international physical activity questionnaire-short form (IPAQ-SF) and a 3-day food record, pre- and post-intervention. Anthropometric measures, blood pressure, glycemic indices and lipid profile including fasting blood sugar (FBS), hemoglobin A1c (HBA1C), fasting insulin (FI), homeostatic model assessment insulin resistance index (HOMA-IR), triglycerides (TG), total cholesterol (TC), high-density lipoprotein (HDL-C) and low-density lipoprotein (LDL-C) were measured at baseline and after twelve weeks.
Results: Forty-five patients completed the trial. There were no significant between-group differences for calorie intake, macronutrient intake, physical activity level or anthropometric measures at baseline and at the end of the study. Dietary vitamin K intake increased significantly at the end of the study in the MK-7 (p: 0.02) and placebo (p: 0.001) groups, but intergroup differences were not significant (p: 0.86). FBS (p: 0.01), HbA1c (p: 0.002), fasting insulin (p: 0.01) and HOMA-IR (p: 0.007) decreased significantly in the MK-7 group. Furthermore, after adjustment for the baseline values and changes of vitamin K intake at the end of study, FBS and HbA1C showed significant intergroup changes, and they were significantly lower in the MK-7 group compared to the placebo group. Lipid profile (TG, TC, LDL-C, HDL-C and LDL-C/HDL-C) did not change significantly within or between groups.
Conclusion: MK-7 supplementation seems to be effective in the improvement of glycemic indices, but not the lipid profile of patients with T2DM.
Clinical Trial Registration: The present study was prospectively registered at the Iranian Registry of Clinical Trials on May 2019 (ID: IRCT20100123003140N22).
Keywords: diabetes, dyslipidemia, glycemic status, menaquinone, MK-7, phylloquinone, vitamin K, anthropometric indices
Introduction
Diabetes mellitus (DM) is a metabolic disease characterized by chronic hyperglycemia.1 Type 2 diabetes mellitus (T2DM) accounts for 90–95% of all diabetic patients.1 Insulin resistance and a progressive loss of β-cell insulin secretion are the main concerns of T2DM.2 Disease complications include: a) Acute complications: hyperglycemic hyperosmolar syndrome (increased blood osmolarity without ketosis); hypoglycemia and b) Chronic complications: microvascular complications (retinopathy, nephropathy and neuropathy); macrovascular complications (coronary heart disease, stroke and peripheral vascular disease).3 Increased mortality and a reduction in lifespan of 7 years add to the burden of this disease.4 There were 463 million cases of T2DM reported globally in 2017, which has increased 25% since 1990.5 In addition, the age-standardized prevalence of T2DM in Iran was 7.3% in 2017, which was 57% higher than in 1990.5
To date, various methods have been used to control T2DM, including dietary management, lifestyle changes, regular exercise, regular blood glucose control, and ultimately drug and insulin therapy. Another important strategy for controlling T2DM is the use of vitamin supplements.6 According to some recent studies, vitamin K supplementation can effectively improve clinical features of diabetes.7
Vitamin K has different forms, including vitamin K1 (phylloquinone), vitamin K2 (menaquinone or MK) and vitamin K3 (synthetic form named menadione).8 Differences in the chemical structure of K1 (phylloquinone) and K2 (menaquinone) have led to differences in their uptake and bioavailability.9 Adsorption, bioavailability and the half-life of K2 is higher than K1.9–11 Studies have revealed that vitamin K2 supplementation can be an appropriate treatment strategy for diabetes, having a more sustained effect than K1.12 Vitamin K2 has at least 10 different compounds (MK-4 to MK-14),9 but its common forms are MK-4 and MK-7. MK-7 has a longer half-life, as well as more bioavailability and uptake than MK-4.3,13
A very small number of animal studies have investigated the effects of vitamin K on diabetes,7 and to date only one clinical trial has reported the effectiveness of MK-7 on vascular calcification in patients with T2DM.14 As such, the aim of this study was to assess the effects of menaquinone supplementation (MK-7) on metabolic parameters in people with T2DM.
Materials and Methods
Study Design and Patients
This parallel double-blind placebo-controlled randomized clinical trial was conducted between August and December 2019 in the northwest of Iran. Sixty men and non-postmenopausal women with T2DM (body mass index: 27–35 kg/m2) aged 20–55 years, were enrolled into the study using a convenience sampling method. They were diagnosed with T2DM by an endocrinologist and were receiving appropriately prescribed medical therapy (only anti-diabetic drugs and not insulin) for at least six months prior to study enrolment. Following a public announcement of the study, patients willing to participate were recruited from public and private hospitals and clinics in the north-west of Iran. The exclusion criteria were: pregnancy, lactation, menopause, hormone therapy, use of vitamin K containing contraceptives; polycystic ovary syndrome; presence of diseases affecting vascular calcification or cardiac dysfunction; history of bone disease, rheumatoid arthritis, thyroid, parathyroid, liver, kidney, intestine disease or malignancies; presence of infectious or inflammatory disease symptoms or recent surgery; use of insulin, corticosteroids and anticoagulant drugs such as warfarin and coumarin; adherence to a specific diet and consumption of any dietary supplements or weight reducing drugs for three month prior to the study; smoking.
After being given a full explanation of the study procedures, written informed consent was taken from each participant prior to the commencement of baseline data collection. The study was approved by the ethics committee of Tabriz University of Medical Sciences, Tabriz, Iran (Ethics code: IR.TBZMED.REC.1398.123). It was also registered with the Iranian Registry of Clinical Trials (IRCT20100123003140N22).
Randomization, Blinding, and Study Procedures
A blinded assistant, not otherwise involved with the study, was tasked with random participant allocation into the two experimental groups (1:1) using RAS (Random Allocation Software). Allocation concealment was achieved through the use of sealed, opaque envelopes with consecutive numbering. Blinding of participants and investigators was supported through the provision of MK-7 or placebo (cornstarch-capsules) containers with identical labelling. The blinded assistant created a 3-digit code for each participant to facilitate identification and tracking. Participants and clinicians/researchers were all blinded to participant group membership throughout the study. An endocrinologist interviewed eligible volunteers to confirm T2DM. The next day, after a 12-hour overnight fast, blood was drawn to measure metabolic parameters. Additional data collection included: a demographic questionnaire, international physical activity questionnaire-short form (IPAQ-SF), blood pressure and measurement of anthropometric indices. Following appropriate explanations, participants were asked to complete the 3-day food record form and return to the clinic every three weeks for 12-weeks. All assessments were performed at both baseline and after 12 weeks.
Intervention
All participants were given standardized dietary advice according to published recommendations.15 They were then randomized into the intervention or placebo group. Patients in the MK-7 group received 200 µg/d MK-7 capsules and those in the placebo group received capsules containing cornstarch for a period of twelve weeks. All participants were directed to take the capsule with their main meal. Participants were contacted by phone each week for a follow-up, in addition to the three weekly visit to the clinic.
Assessment of Physical Activity and Dietary Intake
The IPAQ-SF questionnaire was used to estimate physical activity levels. A trained researcher completed the questionnaire with each participant pre- and post-intervention, via face-to-face interview. Questionnaire validity and reliability have been confirmed previously by BashiriMoosavi et al in 2015.16 According to guidelines for data processing and analysis of the IPAQ, a total metabolic equivalents score (MET-minutes/week) was calculated, with patients categorized as high (≥3000 MET), moderate (600–3000 MET), or low (<600 MET) levels of activity.17
Dietary intake was assessed using a three-day food record. Participants were asked to record their dietary intakes on three non-consecutive days (two weekdays and a weekend) pre- and post-intervention. Nutritionist IV software (First Databank, San Bruno, CA, USA), modified for Iranian foods, was used for dietary data analysis.
Blood Sampling and Biochemical Measurements
After a 12-hour overnight fast, seven mL of blood was drawn for biochemical analyses. Serum fasting blood sugar (FBS), total cholesterol (TC), high-density lipoprotein (HDL-C) and triglycerides (TG) were measured by enzymatic methods using the colorimetric technique and pars Azmoon kits (Pars Azmoon, Tehran, Iran). Low-density lipoprotein (LDL-C) was calculated using the Friedewald equation.18 Hemoglobin A1c (HbA1c) was measured using the spectrophotometric method.19 Serum fasting insulin (FI) was determined using the sandwich ELISA (enzyme-linked immunosorbent assay) method, with a commercial kit (Monobind, Lake Forest, CA, USA). The Homeostatic model assessment insulin resistance index (HOMA-IR) was calculated using the formula: HOMA-IR = [fasting insulin (μIU/mL) × FBS (mg/dL)]/405.20
Anthropometric Indices and Blood Pressure Measurements
All measurements were conducted by a trained nutritionist at baseline and at the end of the study. Height (without shoes with precision of 0.1 cm) and weight (with Seca scale, light clothes and precision of 0.1 kg) were measured. Body mass index (BMI) was calculated as weight (kg) divided by height squared (m2).21 A non-stretchable measuring tape was used to measure waist circumference (WC) and hip circumference (HC). WC was measured as the smallest horizontal girth between the costal and iliac crests at minimal respiration and a relaxed position. HC was taken as the greatest circumference at the level of greater trochanters (the widest portion of the hip) on both sides. Waist to hip ratio (WHR) was calculated by dividing WC (cm) by HC (cm).22 In addition, blood pressure was measured in a comfortable sitting position in the left arm after at least five-minutes resting, using an aneroid sphygmomanometer and stethoscope. It was measured on two occasions and the mean of the two was taken as the individual’s blood pressure.
Sample Size and Statistical Analysis
The sample size was determined based on a similar study published in 201623 and provided 80% power with a 5% risk of type 1 error. This resulted in a sample requirement of 23 per group, which was increased to 30 per group to accommodate an expected 30% attrition rate over the 12-week study period. A sensitivity analysis initially was conducted on Intention to treat (ITT) and per protocol approaches and as there was no difference between the results and losses to follow did not impose any bias on the results, the ITT approach was selected for the present study. Kolmogorov Smirnov test was undertaken to assess the normality of the quantitative variables. The normally and non-normally distributed variables were presented as mean ± standard deviation (SD) and median (25th and 75th percentiles), respectively. Dichotomous variables were reported as number (percent). Differences between the two groups at baseline were assessed using independent sample t-test or Mann–Whitney U-test for continuous variables and Chi-squared or Fishers exact tests for dichotomous variables. Paired samples t-test and Wilcoxon signed-rank test were used to assess within-group changes and for normally and non-normally distributed variables, respectively. Continuous variables were compared between groups at the end of the study using an analysis of covariance (ANCOVA) and Quantile Regression, adjusting for baseline values and potential confounding factors. A P-value less than 0.05 was defined as statistically significant for all statistical tests and SPSS software Version 19 (SPSS Inc., IL, Chicago, USA) and Stata Version 14 (StataCorp, College Station, TX, USA) were used to perform the statistical analyses.
Results
Of the 644 patients who were screened by phone, 72 met all inclusion/exclusion criteria. However, after a face to face meeting, 12 were excluded due to a BMI>35 (n=8) or refusing to participate further (n=4). Sixty participants were recruited with seven and eight lost to follow up in the MK-7 and placebo groups, respectively, by 12-weeks. Therefore, a total of 45 participants completed the study (MK-7 group n=23; placebo group n=22) (Figure 1). No adverse effects were reported by any of the participants, retained or lost, at any stage of the trial.
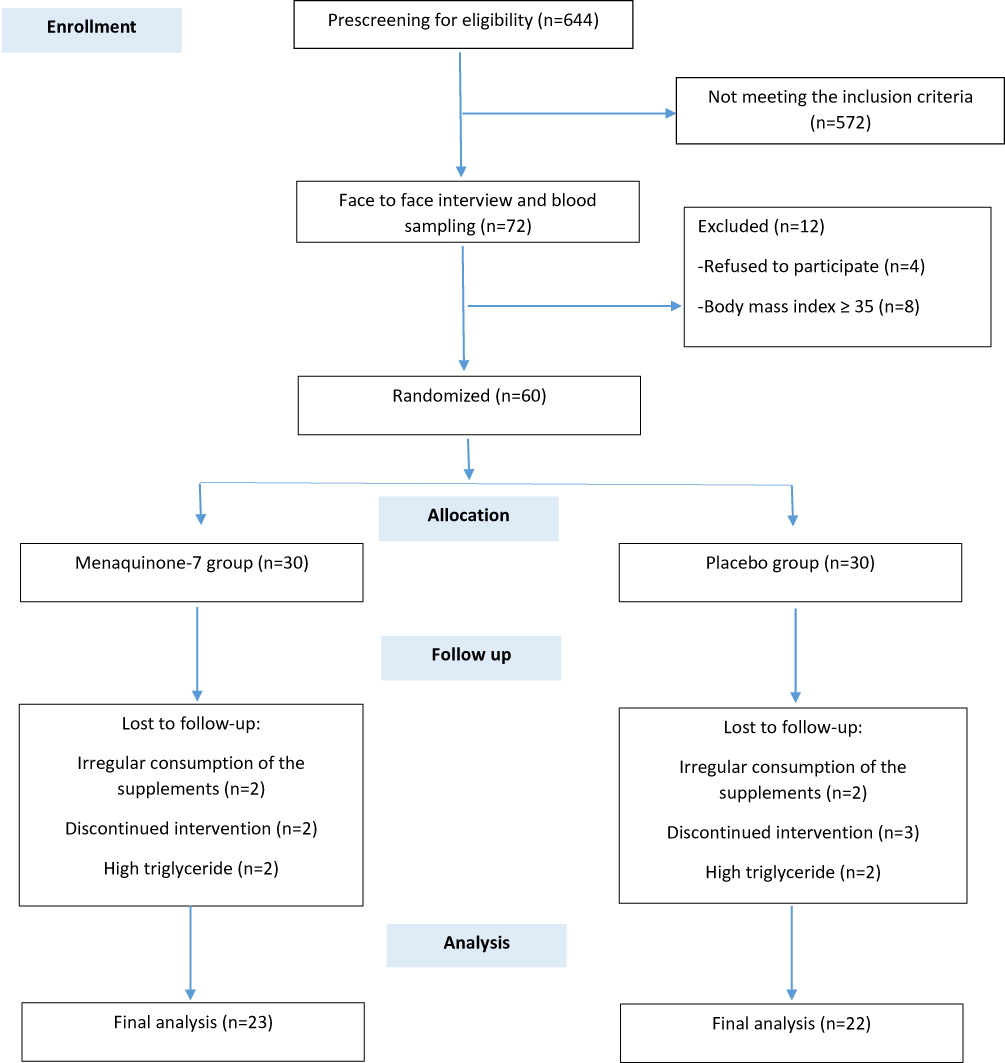 |
Figure 1 Flow diagram of the patient selection process. |
Demographics
As shown in Table 1, the intervention and placebo groups were homogeneous for demographic indices, blood pressure, drug history and physical activity level at baseline (p>0.05). Just under half of the participants reported an education level less than diploma level and most were married. The mean (SD) ages were 45.35 (6.25) and 46.95 (5.25) years in MK-7 and placebo groups, respectively.
 |
Table 1 Baseline Characteristics of the Study Population |
Physical Activity and Dietary Intake
There was no significance difference between the two groups for level of physical activity at baseline (Table 1) and the level of physical activity remained unchanged throughout the study (P>0.05).
As shown in Table 2, calorie and macronutrient intake between the two groups was not significantly different at baseline, with no significant difference observed at the end of the study in either group (p>0.05). Adjustments to the data for baseline differences did not change the findings. Although vitamin K intake increased significantly in both groups during the study, no significant between-group differences were observed, even when adjusted for baseline differences.
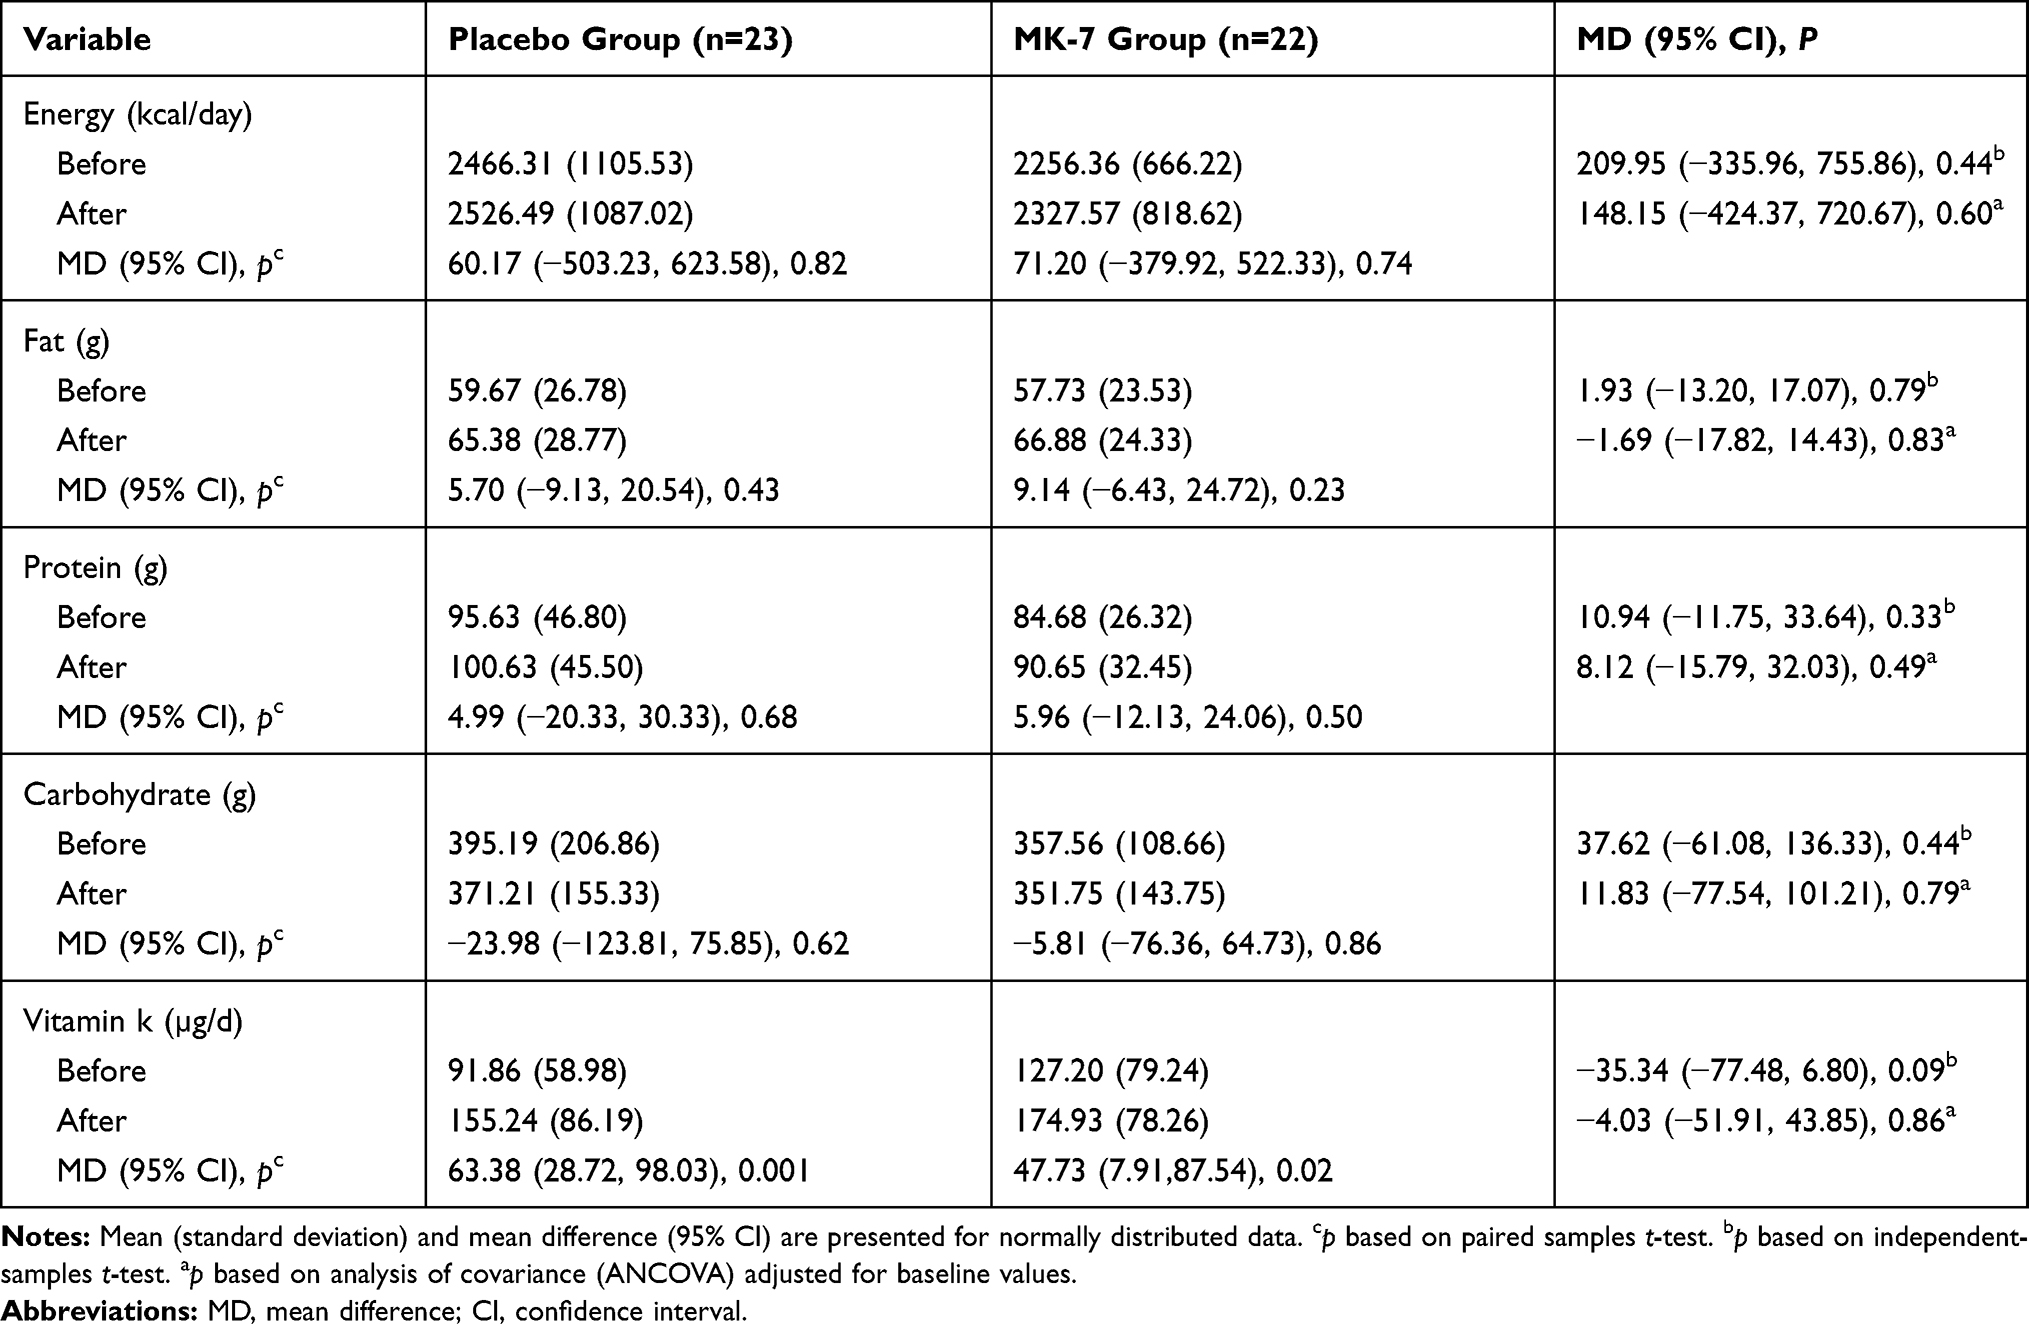 |
Table 2 Comparison of the Dietary Intake Between Study Groups at Baseline and at the End of the Intervention |
Glycaemia and Lipid Profile
No differences in glycemic indexes were observed at baseline. After the 12-week follow-up, FBS (p: 0.01), HbA1c (p: 0.002), fasting insulin (p: 0.01) and HOMA-IR (p: 0.007) were significantly reduced in the MK-7 group. After adjustment for the baseline values and changes in vitamin K intake, FBS (p: 0.02) and HbA1C (p: 0.01) were still significantly lower in the MK-7 group compared to placebo group. However, fasting insulin and HOMA-IR showed no statistically significant intergroup difference (p> 0.05).
The two groups had similar lipid profiles at baseline (Table 3). At the 12-week follow-up, there were no significant changes, within or between groups (p>0.05), for: TG, TC, LDL-C, HDL-C and LDL-C/HDL-C.
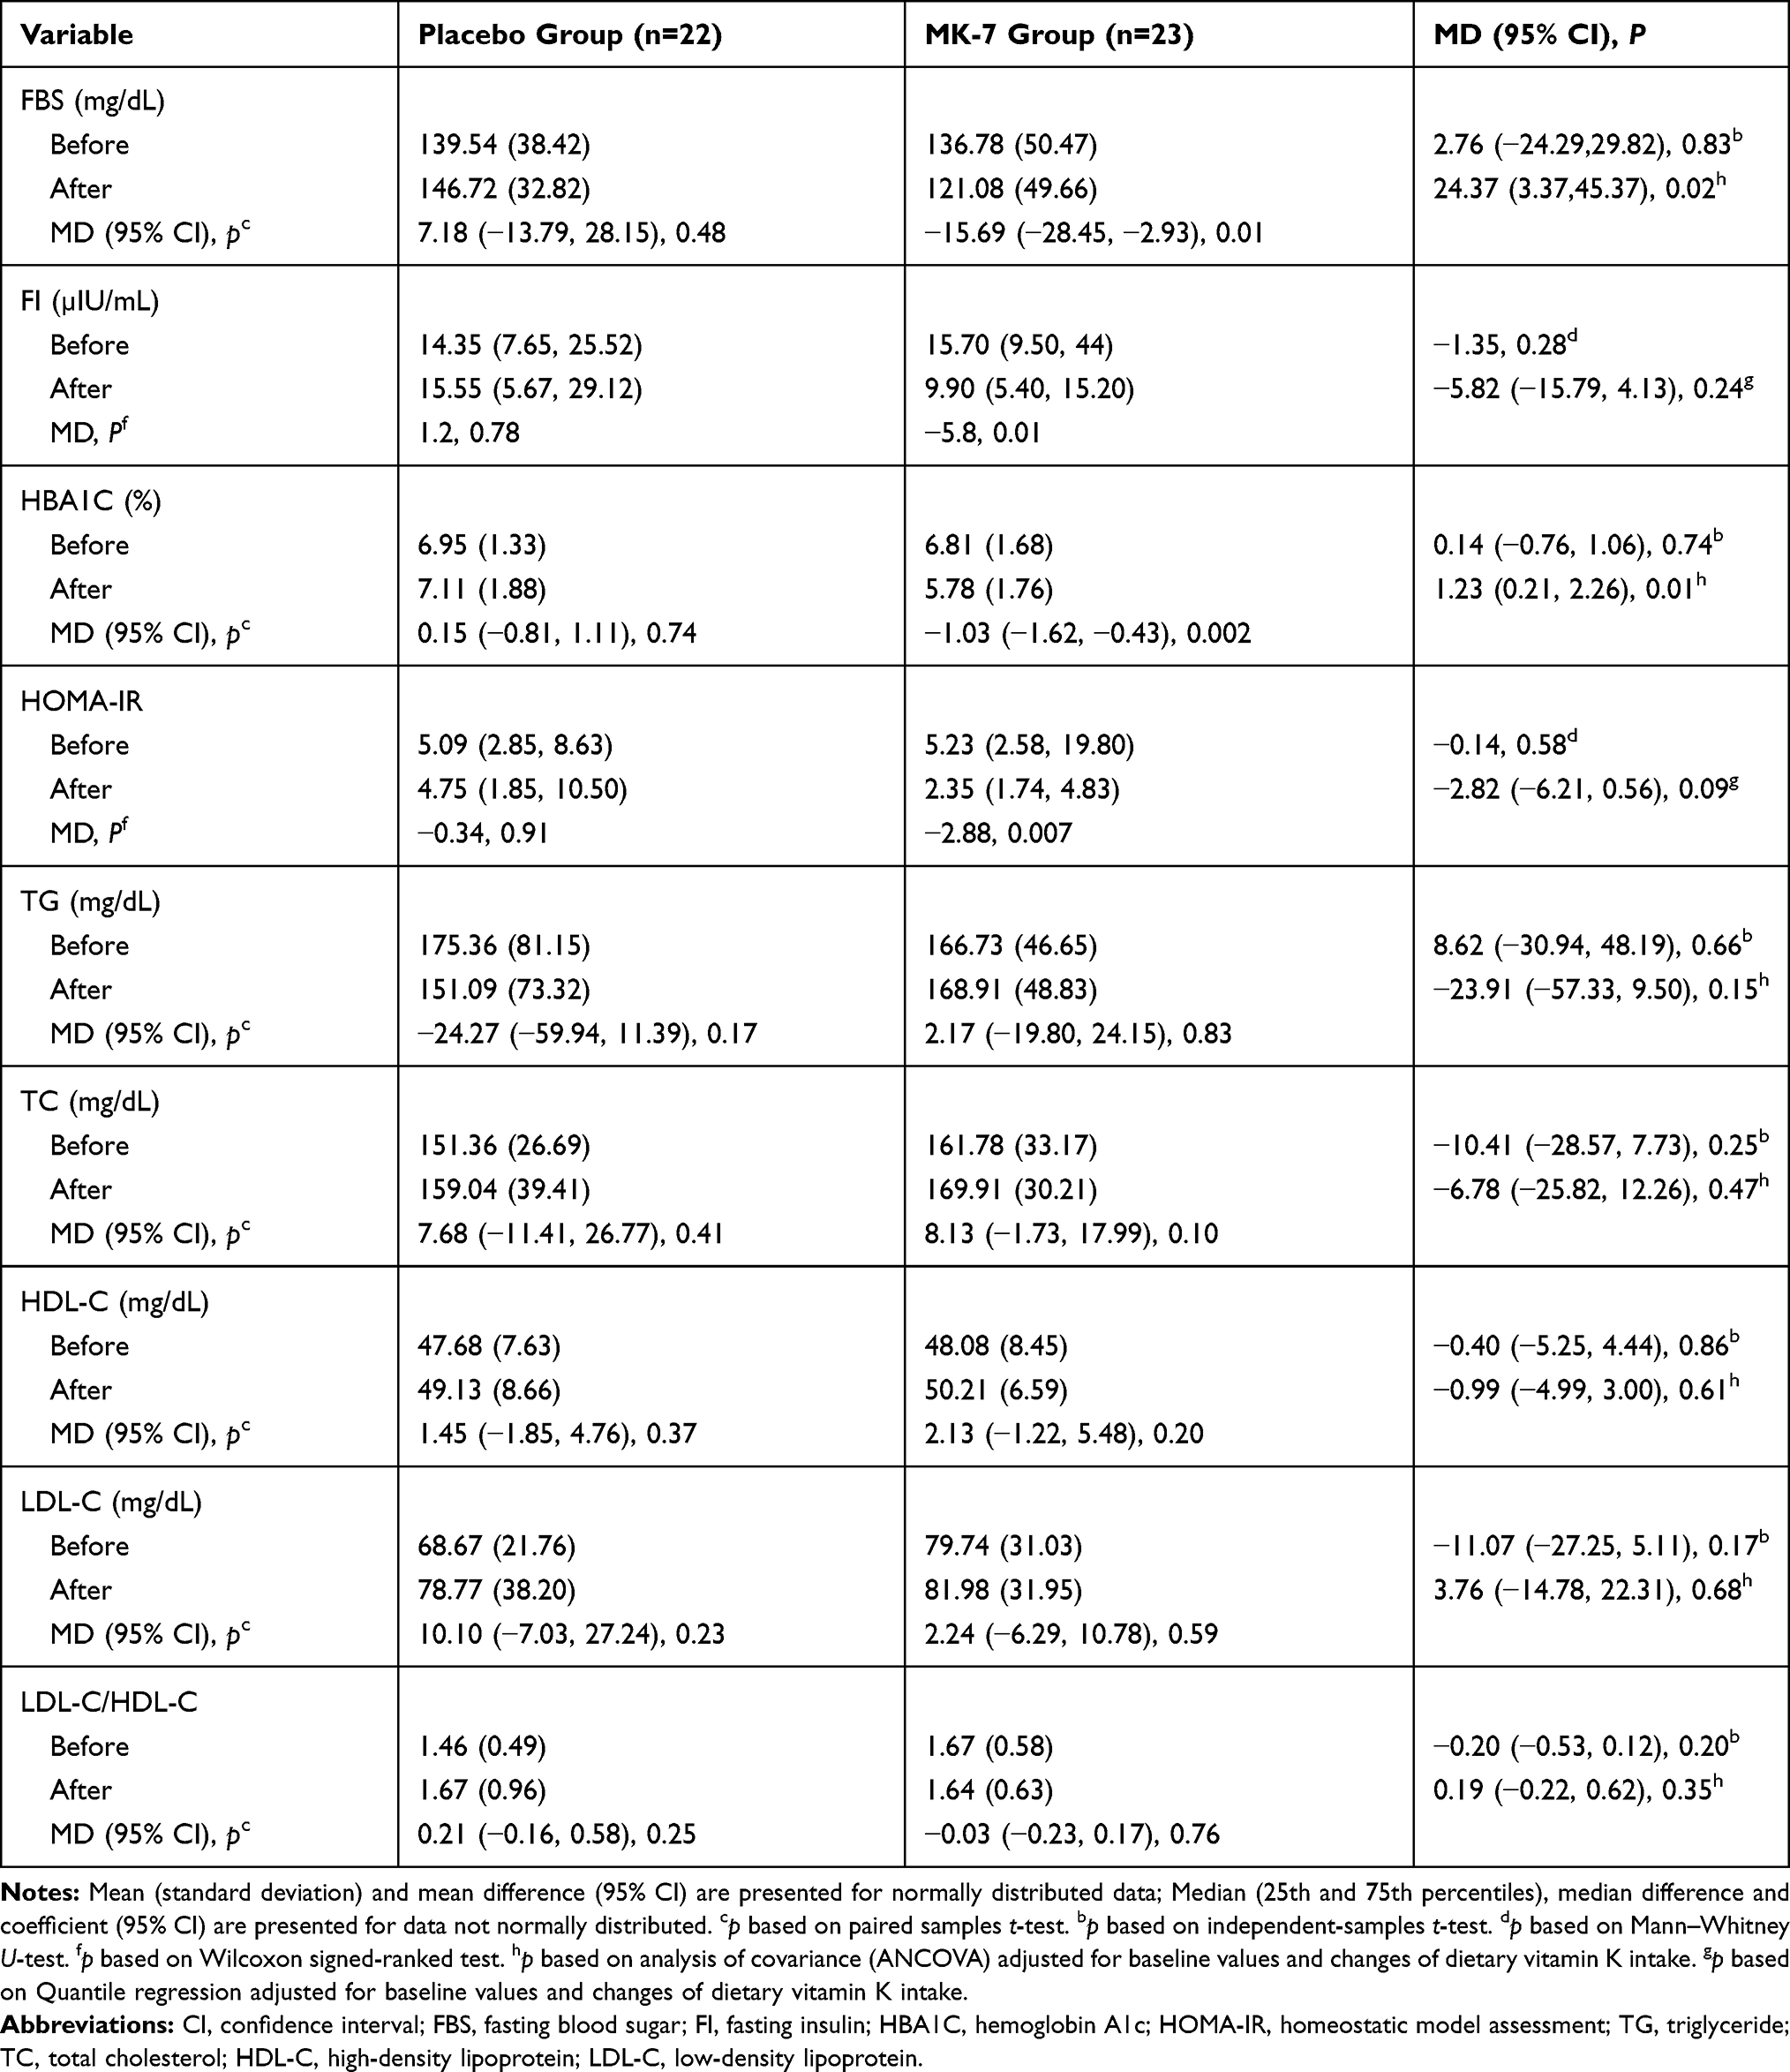 |
Table 3 Comparison of the Glycemic Indexes and Lipid Profile Between Study Groups at Baseline and at the End of the Intervention |
Anthropometric Measures
As presented in Table 4, weight increased significantly in the placebo group and HC decreased significantly in MK-7 group. However, no statistically significant between-groups differences were observed for weight, BMI, WC, HC or WHR at the end of the study, when the baseline values and dietary vitamin K intake were taken into consideration.
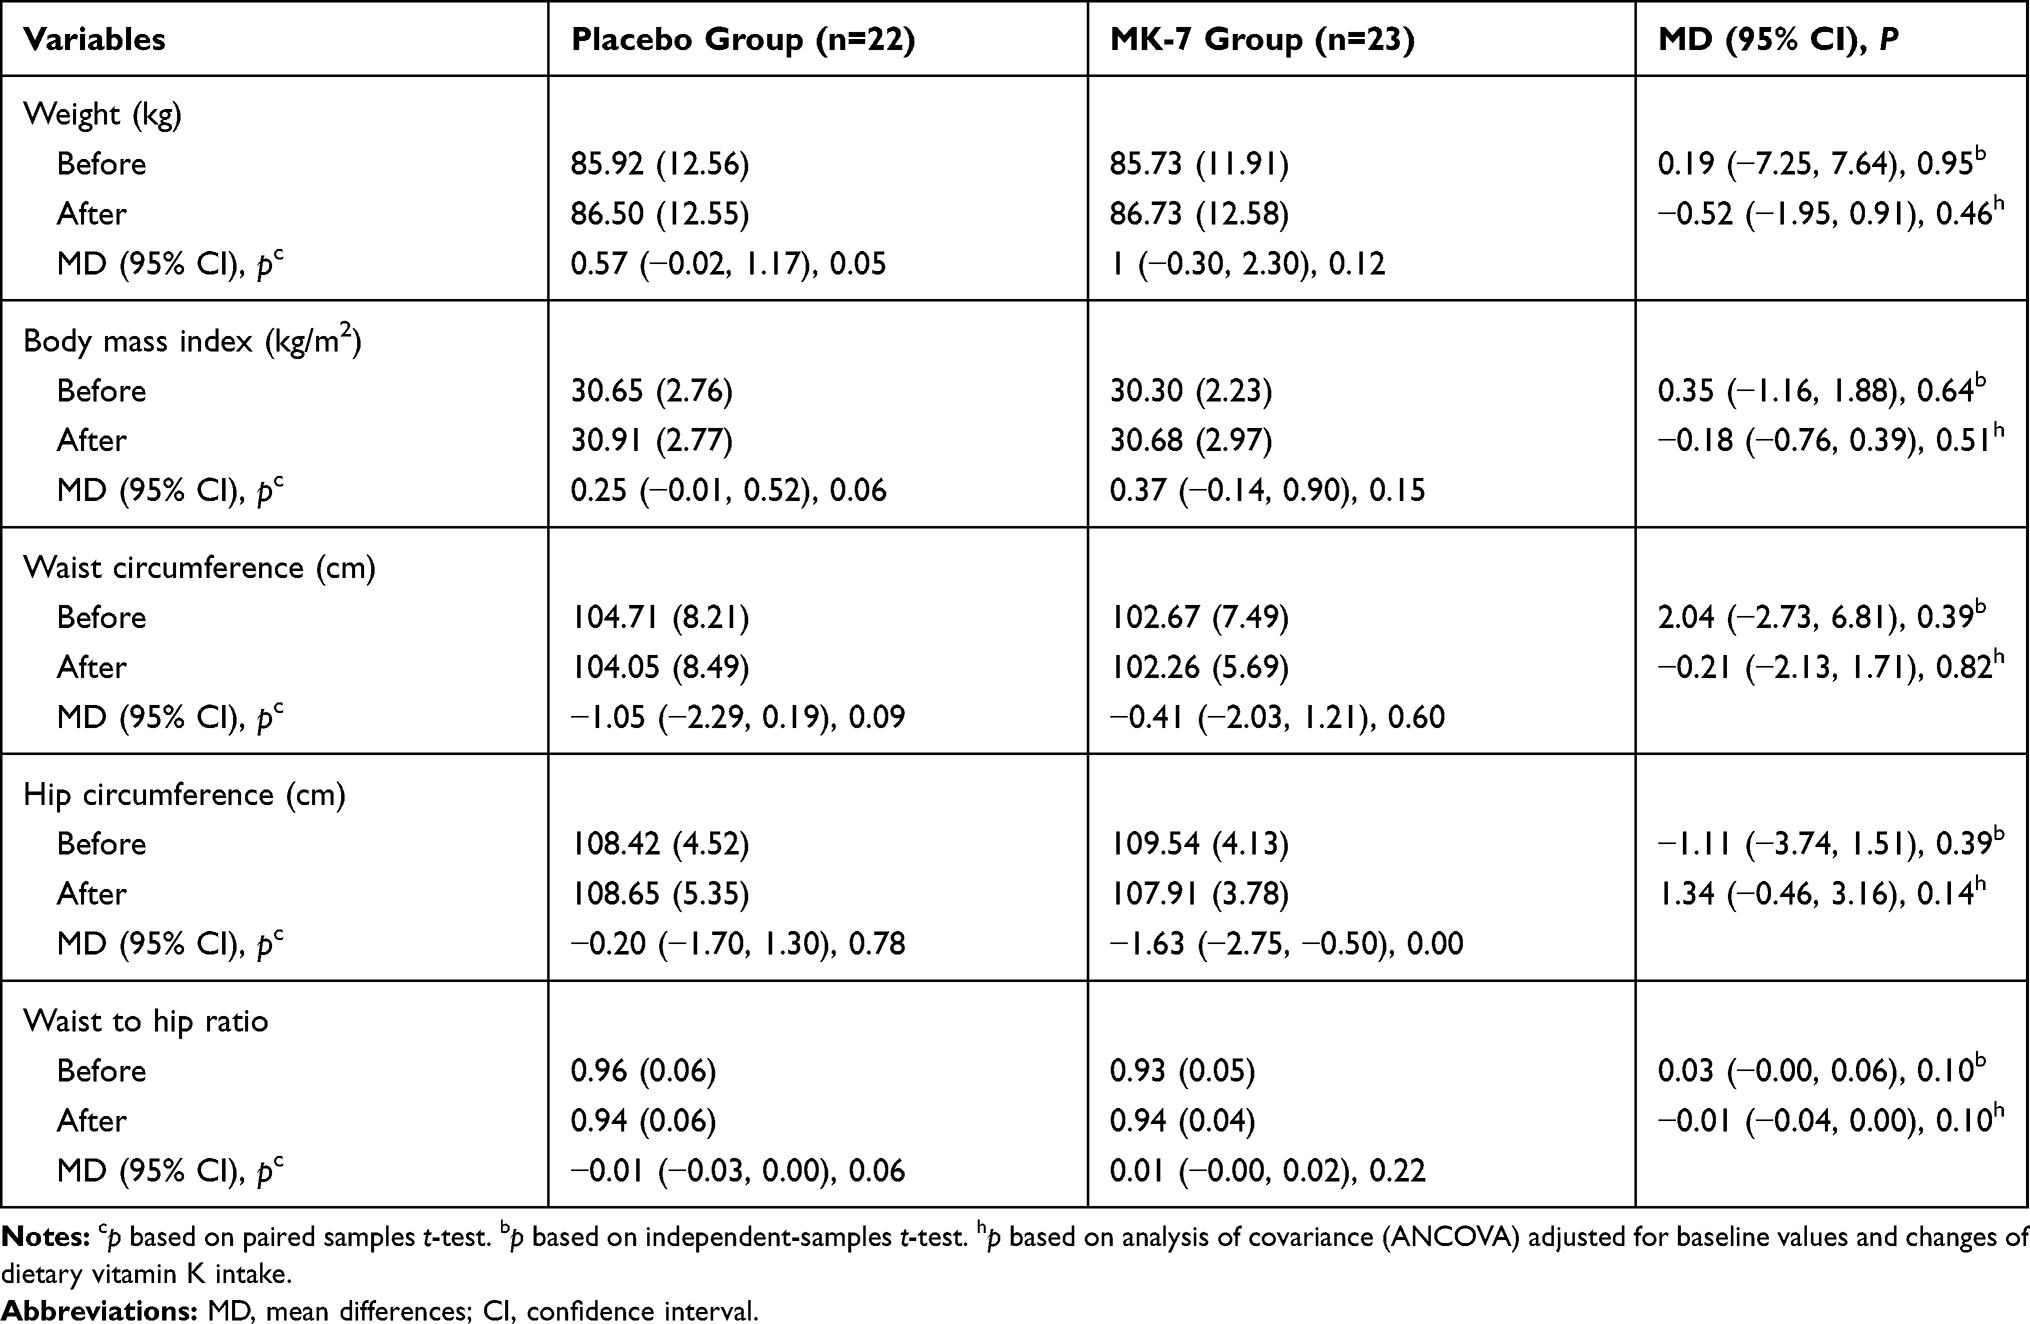 |
Table 4 Comparison of the Anthropometric Indexes Between Study Groups at Baseline and End of the Intervention |
Discussion
This study investigated the effects of a 12-week MK-7 supplementation on people with T2DM. More specifically, the present study examined the effect of MK-7 on glycemic status, anthropometric indices and lipid profile in people with T2DM. Significant improvements were observed in the glycemic indices in the MK-7 group, including: FBS, HbA1C, FI and HOMA-IR. Statistically significant intergroup changes were also observed for FBS and HbA1C.
There were only seven published studies which have evaluated the effects of vitamin K on diabetic animals.7 Supplementation with 10,15,30 mg/kg/day of MK-4 for eight weeks was found to dose dependently improve HbA1c, FBS and HOMA-IR in diabetic rats.24 Another study, also in diabetic rats, identified decreased FBS and hyperglycemia after twelve-weeks supplementation with 30 mg/kg of MK-4.25 Two other studies showed dose dependent reductions in FBS, HbA1c and HOMA-IR after eight-week supplementation with 1, 3, 5 µg/kg/day vitamin K1, also in diabetic rats.26,27 Moreover, three studies conducted by Sai Varsha et al showed decreased FBS, HbA1c and increased serum FI in diabetic rats who received 5 mg/kg of vitamin K1, twice a week for three months.28–30
Thus, overall vitamin K supplementation has been shown to be effective in diabetes animals, which has now also been supported by our findings in human diabetic patients. However, conflicting results were found in a study conducted by Rasekhi et al on pre-diabetic premenopausal women. Their four week intervention of 1000 µg/day of vitamin K1 resulted in no significant improvement in: FBS, serum FI, HOMA-IR or HOMA-B.10,31 There may be several reasons for this negative finding. Firstly, the intervention duration of four-weeks was probably too short and the vitamin K dosage was too small to result in significant glycemic changes.31 Secondly, HOMA-IR is an indirect method of measuring insulin resistance, therefore yielding different results by applying different methods of measuring insulin resistance.31 Thirdly, according to previous studies, vitamin K would be more effective for improving the glycemic control among subjects with impaired glucose tolerance, rather than among healthy individuals.32 In light of this, the role of vitamin K in glycemic control seems to be notable in patients with DM, rather than among pre-diabetes.7
As described in our previous study,7 vitamin K can increase insulin sensitivity in skeletal muscle cells in several different ways. Vitamin K can (a) reduce oxidative stress and inflammation,26,28-30 (b) elevate adiponectin levels10,24,33 and activate AMPK (phosphorylated AMP-activated protein kinase) pathways,33 and (c) directly increase the expression of SIRT1 (sirtuin1) and AMPK.26 AMPK and SIRT1 are important signaling molecules in the regulation of lipid metabolism, glucose hemostasis and insulin sensitivity.34
The present study also showed that MK-7 supplementation had no significant beneficial effects on lipid profile parameters, in comparison to the placebo group. In contrast with the present study, two studies on diabetic animals found vitamin K supplementation had a significant positive effect on lipid profile. In diabetic rats, an eight week intervention which consisted of 30 mg/kg/day of vitamin K2 (MK-4), resulted in significantly reduced TC and TG.24 In addition, dosages of 1, 3, 5 µg/kg BW/day of vitamin K1 over an eight-week period has also been reported to significantly reduce TC and TG among diabetic mice.27 However, to date no clinical trials have confirmed these findings on diabetic dyslipidemia.
There are two reasons for the inconsistent results between our study and the two previous studies. Firstly, our study was conducted using a rigorous RCT design in a human population with T2DM, compared to studies using animals. As such, it is important to note that the results from animal studies may not mirror the findings in humans. Secondly, the dosage and vitamin K type were not the same. Perhaps a higher dose of vitamin K is needed to produce an effect on TG and TC. Further studies are required with diabetic populations to examine this hypothesis.
The possible mechanisms involved in the improvements in diabetic dyslipidemia have been explained in our previous study.7 Vitamin K can reduces hepatocyte lipogenesis and gluconeogenesis by (a) suppressing inflammatory cytokines’ production,28,35-41 (b) inactivation of NF-κB (nuclear factor kappa B),33,42 (c) elevating adiponectin levels,10,24 and (d) increasing the gene expression levels of AMPK and SIRT-1.26,43-47
In this study no significant between-group differences were observed for weight, BMI, WC, HC and WHR post-intervention. A significant increase in weight was observed only in the placebo group. Similarly, supplementation with 1.5 mg/day of MK-4 for 12-months had no significant effect on weight or BMI in healthy postmenopausal women,48 or even when the dosage was increased to 1000 µg/d vitamin K1 for four weeks.10
Consistent with our study, MK-4 supplementation in healthy postmenopausal women, over a three-year period, did not result in a significant weight gain, whereas a significant increase in weight was observed in their placebo group.49 This suggests that taking vitamin K helps to maintain baseline weight and BMI.49,50 In contrast to our findings, previous research has suggested that vitamin K levels were lower in participants with higher weight and waist circumferences.49 This finding was also reported in another study, which showed that body weight and BMI were significantly lower in subjects with the highest tertile of vitamin K level.51
One possible explanations for the effect of vitamin K on the maintenance of body weight, as suggested by Knapen et al’s hypothesis, is that vitamin K directly affects cell function, independent of Ȣ-carboxylation.49 Takeuchi et al conducted an in vitro study and reported that MK-4, but not phylloquinone, inhibited adipogenesis.52 In line with these findings, Shearer et al showed that MK-4 has direct effects on cellular pathways by activating the steroid and xenobiotic receptors on the nuclear membrane.53 Our study suggests that this hypothesis may be also true for MK-7.
Strengths and Limitation
1. For the diabetic population, only animal studies were previously available. This is the first study that evaluated the effect of vitamin K on glycemic status, anthropometric indices and lipid profile among patients with T2DM.
2. Absorption and bioavailability of MK-7 were shown to be better than for MK-433 and only one previous study had examined the effect of MK-7 on vascular calcification in patients with T2DM.
3. Participant dietary intake was measured using a three-day food record, in which under reporting may have occurred. It seems that a weighted food record may be more precise, but in the present study patients were asked to report their dietary intake using home scales.
4. Nutritional recommendations were presented to all participants, but we were not able to verify the level of adherence.
5. Subgroup analysis could not be conducted to examine whether the treatment effect of MK-7 was heterogeneous across the different subgroups of patients with T2DM. Future research is needed with larger sample sizes to investigate this hypothesis.
Conclusion
Our study suggests that vitamin K supplementation in T2DM results in improved glycemic status, including: FBS, HbA1C, FI and HOMA-IR. Vitamin K supplementation may also help with body weight maintenance. However, no significant effects were observed for other anthropometric or lipid profile indices. Future research is required to confirm these findings and to support a recommendation for vitamin K supplementation as an adjunctive treatment for diabetic patients.
Compliance with Ethical Standards
The present study was conducted according to the guidelines of the Helsinki Declaration and all procedures involving human patients were approved by the ethics committee of Tabriz University of Medical Sciences, Tabriz, Iran (Ethics code: IR.TBZMED.REC.1398.123).
Data Sharing Statement
The data are available from the corresponding author, upon reasonable request.
Acknowledgment
The authors would like to thank the people who participated in this trial.
Disclosure
The authors declare no conflict of interest.
References
1. Kerner W, Brückel J. Definition, classification and diagnosis of diabetes mellitus. Exp Clin Endocrinol Diabetes. 2014;122:384–386. doi:10.1055/s-0034-1366278
2. Association AD. 2. Classification and diagnosis of diabetes: standards of medical care in diabetes—2018. Diabetes Care. 2018;41:S13–S27. doi:10.2337/dc18-S002
3. Li Y, Peng Chen J, Duan L, Li S. Effect of vitamin K2 on type 2 diabetes mellitus: a review. Diabetes Res Clin Pract. 2018;136:39–51. doi:10.1016/j.diabres.2017.11.020
4. Morgan CL, Currie CJ, Peters JR. Relationship between diabetes and mortality: a population study using record linkage. Diabetes Care. 2000;23:1103–1107. doi:10.2337/diacare.23.8.1103
5. James SL, Abate D, Abate KH, et al. Global, regional, and national incidence, prevalence, and years lived with disability for 354 diseases and injuries for 195 countries and territories, 1990–2017: a systematic analysis for the Global Burden of Disease Study 2017. Lancet. 2018;392:1789–1858.
6. Afkhami-Ardekani M, Vahidi S, Vahidi A, Ahmadie M. The prevalence of type 2 diabetes mellitus on age of 30 years and above in Yazd province (Iranian population). J Shahid Sadoughi Univ Med Sci Health Serv. 2001;9:22–27.
7. Karamzad N, Maleki V, Carson‐Chahhoud K, Azizi S, Sahebkar A, Gargari BP. A systematic review on the mechanisms of vitamin K effects on the complications of diabetes and pre‐diabetes. BioFactors. 2019;46(1):21–37.
8. Booth S. Vitamin K: food composition and dietary intakes. Food Nutr Res. 2012;56:5505. doi:10.3402/fnr.v56i0.5505
9. Shea M, Booth SL. Concepts and controversies in evaluating vitamin K status in population-based studies. Nutrients. 2016;8:8. doi:10.3390/nu8010008
10. Rasekhi H, Karandish M, Jalali M-T, et al. Phylloquinone supplementation improves glycemic status independent of the effects of adiponectin levels in premonopause women with prediabetes: a double-blind randomized controlled clinical trial. J Diabetes Metab Disord. 2015;14:1. doi:10.1186/s40200-014-0127-9
11. Widhalm JR, Ducluzeau AL, Buller NE, Elowsky CG, Olsen LJ, Basset GJ. Phylloquinone (vitamin K1) biosynthesis in plants: two peroxisomal thioesterases of lactobacillus origin hydrolyze 1, 4‐dihydroxy‐2‐naphthoyl‐coa. Plant J. 2012;71:205–215. doi:10.1111/j.1365-313X.2012.04972.x
12. Guariguata L, Whiting DR, Hambleton I, Beagley J, Linnenkamp U, Shaw JE. Global estimates of diabetes prevalence for 2013 and projections for 2035. Diabetes Res Clin Pract. 2014;103:137–149. doi:10.1016/j.diabres.2013.11.002
13. Schurgers LJ, Vermeer C. Differential lipoprotein transport pathways of K-vitamins in healthy subjects. Biochim Biophys Acta. 2002;1570:27–32. doi:10.1016/S0304-4165(02)00147-2
14. Zwakenberg S, De Jong P, Bartstra J, et al. The effect of menaquinone-7 supplementation on vascular calcification in patients with diabetes: a randomized, double-blind, placebo-controlled trial. Am J Clin Nutr. 2019;110:883–890. doi:10.1093/ajcn/nqz147
15. Seino Y, Ueno S, Yabe D, Suzuki A. Dietary recommendations for type 2 diabetes patients: lessons from recent clinical and basic research in Asia. J Diabetes Investig. 2019;10:1405–1407. doi:10.1111/jdi.13135
16. BashiriMoosavi F, Farmanbar R, Taghdisi M, AtrkarRoshan Z. Level of physical activity among girl high school students in Tarom county and relevant factors. Iran J Health Educ Health Promot. 2015;3:133–140.
17. Committee IR. Guidelines for data processing and analysis of the International Physical Activity Questionnaire (IPAQ)-short and long forms; 2005. Available from: http://www ipaq ki se/scoring pdf.
18. Friedewald WT, Levy RI, Fredrickson DS. Estimation of the concentration of low-density lipoprotein cholesterol in plasma, without use of the preparative ultracentrifuge. Clin Chem. 1972;18:499–502. doi:10.1093/clinchem/18.6.499
19. Pan T, Li M, Chen J, Xue H. Quantification of glycated hemoglobin indicator HbA1c through near-infrared spectroscopy. J Innov Opt Health Sci. 2014;7:1350060. doi:10.1142/S1793545813500600
20. Matthews D, Hosker J, Rudenski A, Naylor B, Treacher D, Turner R. Homeostasis model assessment: insulin resistance and β-cell function from fasting plasma glucose and insulin concentrations in man. Diabetologia. 1985;28:412–419. doi:10.1007/BF00280883
21. Saghafi-Asl M, Amiri P, Naghizadeh M, Ghavami SM, Karamzad N. Association of endotoxaemia with serum free fatty acids in metabolically healthy and unhealthy abdominally obese individuals: a case–control study in northwest of Iran. BMJ Open. 2017;7:e015910. doi:10.1136/bmjopen-2017-015910
22. Taylor RW, Jones IE, Williams SM, Goulding A. Evaluation of waist circumference, waist-to-hip ratio, and the conicity index as screening tools for high trunk fat mass, as measured by dual-energy X-ray absorptiometry, in children aged 3–19 y. Am J Clin Nutr. 2000;72:490–495. doi:10.1093/ajcn/72.2.490
23. Asemi Z, Raygan F, Bahmani F, et al. The effects of vitamin D, K and calcium co-supplementation on carotid intima-media thickness and metabolic status in overweight type 2 diabetic patients with CHD. Br J Nutr. 2016;116:286–293. doi:10.1017/S0007114516001847
24. Hussein AG, Mohamed RH, Shalaby SM, El Motteleb DMA. Vitamin K2 alleviates type 2 diabetes in rats by induction of osteocalcin gene expression. Nutrition. 2018;47:33–38. doi:10.1016/j.nut.2017.09.016
25. Iwamoto J, Seki A, Sato Y, Matsumoto H, Takeda T, Yeh JK. Vitamin K 2 prevents hyperglycemia and cancellous osteopenia in rats with streptozotocin-induced type 1 diabetes. Calcif Tissue Int. 2011;88:162–168. doi:10.1007/s00223-010-9441-5
26. Dihingia A, Ozah D, Ghosh S, et al. Vitamin K1 inversely correlates with glycemia and insulin resistance in patients with type 2 diabetes (T2D) and positively regulates SIRT1/AMPK pathway of glucose metabolism in liver of T2D mice and hepatocytes cultured in high glucose. J Nutr Biochem. 2018;52:103–114. doi:10.1016/j.jnutbio.2017.09.022
27. Dihingia A, Ozah D, Baruah PK, Kalita J, Manna P. Prophylactic role of vitamin K supplementation on vascular inflammation in type 2 diabetes by regulating the NF-κB/Nrf2 pathway via activating Gla proteins. Food Funct. 2018;9:450–462. doi:10.1039/C7FO01491K
28. Varsha MS, Thiagarajan R, Manikandan R, Dhanasekaran G. Vitamin K1 alleviates streptozotocin-induced type 1 diabetes by mitigating free radical stress, as well as inhibiting NF-κB activation and iNOS expression in rat pancreas. Nutrition. 2015;31:214–222. doi:10.1016/j.nut.2014.05.012
29. Varsha MS, Raman T, Manikandan R, Dhanasekaran G. Hypoglycemic action of vitamin K1 protects against early-onset diabetic nephropathy in streptozotocin-induced rats. Nutrition. 2015;31:1284–1292. doi:10.1016/j.nut.2015.05.012
30. Varsha MS, Raman T, Manikandan R. Inhibition of diabetic-cataract by vitamin K1 involves modulation of hyperglycemia-induced alterations to lens calcium homeostasis. Exp Eye Res. 2014;128:73–82. doi:10.1016/j.exer.2014.09.007
31. Rasekhi H, Karandish M, Jalali M, et al. The effect of vitamin K1 supplementation on sensitivity and insulin resistance via osteocalcin in prediabetic women: a double-blind randomized controlled clinical trial. Eur J Clin Nutr. 2015;69:891–895. doi:10.1038/ejcn.2015.17
32. Shahdadian F, Mohammadi H, Rouhani MH. Effect of vitamin K Supplementation on glycemic control: a systematic review and meta-analysis of clinical trials. Horm Metab Res. 2018;50:227–235. doi:10.1055/s-0044-100616
33. Panahi Y, Khalili N, Sahebi E, et al. Effects of curcuminoids plus piperine on glycemic, hepatic and inflammatory biomarkers in patients with type 2 diabetes mellitus: a randomized double-blind placebo-controlled trial. Drug Res. 2018;68:403–409. doi:10.1055/s-0044-101752
34. Hou X, Xu S, Maitland-Toolan KA, et al. SIRT1 regulates hepatocyte lipid metabolism through activating AMP-activated protein kinase. J Biol Chem. 2008;283:20015–20026. doi:10.1074/jbc.M802187200
35. Shea MK, Dallal GE, Dawson-Hughes B, et al. Vitamin K, circulating cytokines, and bone mineral density in older men and women. Am J Clin Nutr. 2008;88:356–363. doi:10.1093/ajcn/88.2.356
36. Yoshida M, Booth SL, Meigs JB, Saltzman E, Jacques PF. Phylloquinone intake, insulin sensitivity, and glycemic status in men and women. Am J Clin Nutr. 2008;88:210–215. doi:10.1093/ajcn/88.1.210
37. Pan Y, Jackson RT. Dietary phylloquinone intakes and metabolic syndrome in US young adults. J Am Coll Nutr. 2009;28:369–379. doi:10.1080/07315724.2009.10718099
38. Beulens JW, Grobbee DE, Sluijs I, Spijkerman AM, Van Der Schouw YT. Dietary phylloquinone and menaquinones intakes and risk of type 2 diabetes. Diabetes Care. 2010;33:1699–1705. doi:10.2337/dc09-2302
39. Ibarrola-Jurado N, Salas-Salvado J, Martínez-González MA, Bullo M. Dietary phylloquinone intake and risk of type 2 diabetes in elderly subjects at high risk of cardiovascular disease. Am J Clin Nutr. 2012;96:1113–1118. doi:10.3945/ajcn.111.033498
40. Dam V, Dalmeijer GW, Vermeer C, et al. Association between vitamin K and the metabolic syndrome: a 10-year follow-up study in adults. J Clin Endocrinol Metab. 2015;100:2472–2479. doi:10.1210/jc.2014-4449
41. Manna P, Kalita J. Beneficial role of vitamin K supplementation on insulin sensitivity, glucose metabolism, and the reduced risk of type 2 diabetes: a review. Nutrition. 2016;32:732–739. doi:10.1016/j.nut.2016.01.011
42. Ohsaki Y, Shirakawa H, Miura A, et al. Vitamin K suppresses the lipopolysaccharide-induced expression of inflammatory cytokines in cultured macrophage-like cells via the inhibition of the activation of nuclear factor κB through the repression of IKKα/β phosphorylation. J Nutr Biochem. 2010;21:1120–1126. doi:10.1016/j.jnutbio.2009.09.011
43. Yamauchi T, Kamon J, Waki H, et al. The fat-derived hormone adiponectin reverses insulin resistance associated with both lipoatrophy and obesity. Nat Med. 2001;7:941–946. doi:10.1038/90984
44. Kharroubi I, Rasschaert J, Eizirik DL, Cnop M. Expression of adiponectin receptors in pancreatic β cells. Biochem Biophys Res Commun. 2003;312:1118–1122. doi:10.1016/j.bbrc.2003.11.042
45. Ouchi N, Walsh K. Adiponectin as an anti-inflammatory factor. Clin Chim Acta. 2007;380:24–30. doi:10.1016/j.cca.2007.01.026
46. Ohashi K, Ouchi N, Matsuzawa Y. Anti-inflammatory and anti-atherogenic properties of adiponectin. Biochimie. 2012;94:2137–2142. doi:10.1016/j.biochi.2012.06.008
47. Ye R, Scherer PE. Adiponectin, driver or passenger on the road to insulin sensitivity? Mol Metabol. 2013;2:133–141. doi:10.1016/j.molmet.2013.04.001
48. Koitaya N, Sekiguchi M, Tousen Y, et al. Low-dose vitamin K 2 (MK-4) supplementation for 12 months improves bone metabolism and prevents forearm bone loss in postmenopausal Japanese women. J Bone Miner Metab. 2014;32:142–150. doi:10.1007/s00774-013-0472-7
49. Knapen MH, Schurgers LJ, Shearer MJ, Newman P, Theuwissen E, Vermeer C. Association of vitamin K status with adiponectin and body composition in healthy subjects: uncarboxylated osteocalcin is not associated with fat mass and body weight. Br J Nutr. 2012;108:1017–1024. doi:10.1017/S000711451100626X
50. Yoshida M, Jacques PF, Meigs JB, et al. Effect of vitamin K supplementation on insulin resistance in older men and women. Diabetes Care. 2008;31:2092–2096. doi:10.2337/dc08-1204
51. Hwang YC, Jeong IK, Ahn KJ, Chung HY. The uncarboxylated form of osteocalcin is associated with improved glucose tolerance and enhanced β‐cell function in middle‐aged male subjects. Diabetes Metab Res Rev. 2009;25:768–772. doi:10.1002/dmrr.1045
52. Takeuchi Y, Suzawa M, Fukumoto S, Fujita T. Vitamin K2 inhibits adipogenesis, osteoclastogenesis, and ODF/RANK ligand expression in murine bone marrow cell cultures. Bone. 2000;27:769–776. doi:10.1016/S8756-3282(00)00396-3
53. Shearer MJ, Newman P. Metabolism and cell biology of vitamin K. Thromb Haemost. 2008;100:530–547. doi:10.1160/TH08-03-0147
 © 2020 The Author(s). This work is published and licensed by Dove Medical Press Limited. The full terms of this license are available at https://www.dovepress.com/terms.php and incorporate the Creative Commons Attribution - Non Commercial (unported, v3.0) License.
By accessing the work you hereby accept the Terms. Non-commercial uses of the work are permitted without any further permission from Dove Medical Press Limited, provided the work is properly attributed. For permission for commercial use of this work, please see paragraphs 4.2 and 5 of our Terms.
© 2020 The Author(s). This work is published and licensed by Dove Medical Press Limited. The full terms of this license are available at https://www.dovepress.com/terms.php and incorporate the Creative Commons Attribution - Non Commercial (unported, v3.0) License.
By accessing the work you hereby accept the Terms. Non-commercial uses of the work are permitted without any further permission from Dove Medical Press Limited, provided the work is properly attributed. For permission for commercial use of this work, please see paragraphs 4.2 and 5 of our Terms.