")
Back to Journals » International Journal of Nanomedicine » Volume 15
Effects of Green Silver Nanoparticles on Apoptosis and Oxidative Stress in Normal and Cancerous Human Hepatic Cells in vitro
Authors Bin-Jumah M , AL-Abdan M, Albasher G, Alarifi S
Received 24 November 2019
Accepted for publication 23 January 2020
Published 9 March 2020 Volume 2020:15 Pages 1537—1548
DOI https://doi.org/10.2147/IJN.S239861
Checked for plagiarism Yes
Review by Single anonymous peer review
Peer reviewer comments 2
Editor who approved publication: Dr Thomas Webster
May Bin-Jumah,1 Monera AL-Abdan,1 Gadah Albasher,2 Saud Alarifi2
1Department of Biology, College of Science, Princess Nourah Bint Abdulrahman University, Riyadh, Saudi Arabia; 2Department of Zoology, College of Science, King Saud University, Riyadh, Saudi Arabia
Correspondence: Saud Alarifi
Department of Zoology, College of Science, King Saud University, BOX 2455, Riyadh 11451, Saudi Arabia
Tel +966-14679816
Fax +966 4678514
Email [email protected]
Introduction: Extensive use of metallic nanomaterials in different areas of agriculture and commercial products induce significant harmful effects on human health and the environment. In the current study, we synthesized an eco-friendly approach silver nanoparticles (AgNPs) using root extracts of Beta vulgaris L.
Methods: The synthesized green silver nanoparticles (gAgNPs) were characterized by dynamic light scattering (DLS) and high-resolution transmission electron microscope (HR-TEM). The gAgNPs had a round shape and the mean size was 20− 50 nm. The cytotoxic effects of gAgNPs were determined in human hepatic normal (CHANG) and cancer (HUH-7) cells by using tetrazolium salt (MTT) and lactate dehydrogenase (LDH) assays for 24 h.
Results and Discussion: It was clear from the observations of this experiment that higher concentrations of gAgNPs reduce cell viability. The production of reactive oxygen species (ROS) was evaluated by using DCFDA. The gAgNPs induced more ROS in the HuH-7 cells than in the CHANG cells. The fragmentation of DNA was evaluated by alkaline single-cell gel electrophoresis and the maximum DNA strand breakage was found at a higher concentration exposure of gAgNPs for 24 h. It is important to notice that the HuH-7 cells showed an increased sensitivity to gAgNPs than the CHANG cells. The apoptotic and necrotic effects of gAgNPs on both the cells were evaluated using annexin-V-FITC and propidium iodide staining. An increased count of apoptotic and necrotic cells was found following a higher concentration exposure of gAgNPs. The apoptotic protein expression in these cells due to gAgNPs exposure was determined using immunoblotting techniques and the level of Bcl2 was decreased. However, the expression of BAX and protein was increased in both cells.
Conclusion: Therefore, it can be concluded that higher concentrations of gAgNPs may induce significant cytotoxicity and cause DNA damage and apoptosis.
Keywords: green silver nanoparticles, cytotoxicity, CHANG and HuH-7 cells, genotoxicity, apoptosis
Introduction
Nanoparticles are an innovative class of functional materials. Silver nanoparticles (AgNPs) are extensively applied in different fields of science, such as biomedical science, including antibacterial, antiviral, anti-inflammatory, and anticancer therapies. AgNPs are being used to produce various biomedical products to prevent infection.1 The application of AgNPs has been widened due to recent advances in nanotechnology. Gulbagca et al2 (2019) reported anti-oxidant, antibacterial, antifungal, and DNA cleavage activities of biogenic silver nanoparticles. AgNPs have several important implications including medical diagnostics3 therapeutics, antioxidant,4 antibacterial,5 and cytotoxic6 properties. Some researchers have synthesized nanoparticles using bacteria, fungi, yeast, and plant sources.7 Many researchers have synthesized AgNPs by using different biological materials and reported their anticancer effects as listed in (Table 1).8–14 Beta vulgaris is commonly known as red beet and cultivated as a food. Extracts of red beet showed antioxidant, anti-inflammatory, antiallergic activities.15 In this study, we used root extracts of the red beet plant to synthesis ecofriendly AgNPs. AgNPs-mediated toxicity involves various mechanisms, in particular, the production of excess reactive oxygen species (ROS). At low levels, ROS regulates various cellular functions and at higher levels, it induces cell death.16 Disproportionate production of ROS induces apoptosis in a variety of human cancers including breast cancer, ovarian cancer, and lung cancer.17,18 Recent in vitro and in vivo studies have demonstrated the toxicity of AgNPs in a variety of cancerous and non-cancerous cells.19,20 Hence, we have synthesized green silver nanoparticles by using extracts of red beet (Beta vulgaris) root. Red beet is a medicinal plant used for the treatment of liver diseases and can lower the serum triglyceride level. We synthesized silver nanoparticles by using the root extracts of red beet plants. Induction of cytotoxicity of nanoparticles depends not only on their shape, surface chemistry, or size but also on the cell line studied. Erdogan et al,21 reported that green silver nanoparticles induced toxicity and showed anti-cancer effects with phototherapy in MCF7 cells.
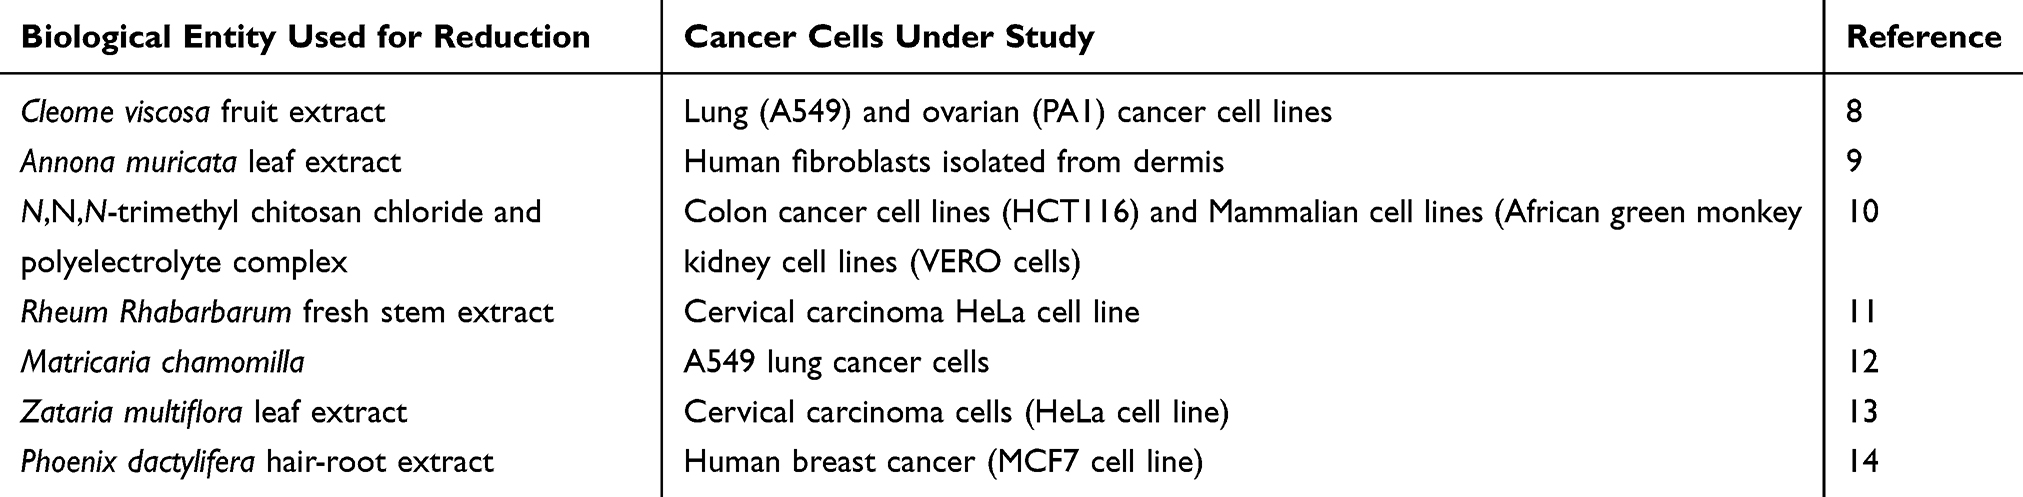 |
Table 1 Anticancer Properties of Green Synthesized AgNPs |
Furthermore, current studies on the cytotoxic responses of the liver exposed to green silver NPs are very limited. Therefore, we selected CHANG and HuH-7cells as a model in this study. Thus, the main objective of this study was to compare the mechanism of the toxic effects of gAgNPs of similar shape and size (30 nm) in human liver cells.
Materials and Methods
Chemical and Reagents
Green silver nanoparticle (gAgNPs) was prepared by using root extracts of Beta vulgaris L (Beet) plant. MTT [3-(4, 5-dimethylthiazol-2-yl)-2, 5-diphenyltetrazolium bromide], 2, 7-dichlorofluorescin diacetate (H2-DCFH-DA), dimethyl sulfoxide (DMSO), annexin V FITC and propidium iodide were purchased from Sigma-Aldrich (St. Louis, Missouri, United States). Dulbecco’s modified Eagle’s medium (DMEM), fetal bovine serum (FBS) and antibiotics were purchased from Gibco, USA.
Preparation of Beet Root Extracts
The fresh beetroot was purchased from local market and washed with running tap water and sterile double distilled water to clean soil particles, etc. Roots were cut in small pieces, grinded and filtered using mesh (22 µm) and stored in refrigerator for further use.
Synthesis of Silver Nanoparticles
Ten milliliters of root extracts were mixed to 90 mL of silver nitrate (1mM) in 250 mL conical flask and shaked it very well. After 25 min, the color of reaction mixture was changed in dark blackish-brown, demonstrating the formation of silver nanoparticles and reduction of Ag+ ions.
Physical Characterization of gAgNPs
The size of green silver nanoparticles (gAgNPs) was determined using high-resolution transmission electron microscope (HR-TEM) (JEOL Inc., Tokyo, Japan) at an accelerating voltage 110 kV.
The mean hydrodynamic size and zeta potential of gAgNPs in dH2O and culture medium were observed by DLS (Nano-Zeta Sizer-HT, Malvern, UK) as described by Alarifi et al22. We have used 100 μg/mL for DLS measurement because this is the maximum exposure concentration used in cytotoxicity studies.
Cell Culture and Treatment of Nanoparticles
CHANG and HuH-7cells were procured from American Type Culture Collection (ATCC), USA. These cells were subcultured in DMEM culture medium supplemented with FBS (10%) and 10,000 U/mL antibiotics at CO2 (5%) incubator at 37°C. The cells at 80% confluence were subcultured into 96 well plates, 6 well plates and 25 cm2 flasks according to designed experiments.
CHANG and HuH-7 cells were sub-cultured for overnight prior to exposure to gAgNPs. The stock solution of gAgNPs was prepared in mili Q water @ 1 µg/µL and diluted according to the experimental dosage (0–100 µg/mL). Control cells were not exposed to gAgNPs and considered as controls with each experiment.
Cytotoxicity
3-(4, 5-Dimethylthiazol-2-Yl)-2, 5-Diphenyltetrazolium Bromide (MTT) Assay
The reduction of MTT into formazan crystal in CHANG and HuH-7 cells was determined according to Alarifi et al,23 method to find out the toxicity of gAgNPs in CHANG and HuH-7 cells. CHANG and HuH-7 cells (1×10⁴ per well) have been cultured in 96-culture plate and exposed to different concentration of gAgNPs (0, 5, 20, 40 and 100 µg/mL) of for 24 h. After 24 h, culture media with gAgNPs was discarded from 96 well plates and new culture media containing MTT powder (5 mg/mL) were filled (100 µL/well) and incubated for 4 h at 37°C. The produced formazan crystal was dissolved in dimethyl sulfoxide (DMSO) and optical density (OD) was determined at 570 nm using a micro-plate reader (Synergy-H1; BioTek, Winooski, VT, USA).
Lactate Dehydrogenase Enzyme Assay (LDH) Assay
We have done LDH assay by using kit (LDH cytotoxicity assay kit 601170 Cayman chemical kit) as described by manufacturer.
Evaluation of Intracellular Reactive Oxygen Species (ROS)
Generation of intracellular ROSin CHANG and HuH-7 cells after exposure to gAgNPs (0, 5, 20, 40 and 100 µg/mL) for 24 hrs was determined according to the methods described Alzahrani et al24. Briefly, 1×10⁴ cells were cultured in black bottom culture plate (96 well) and left 24 h for attachment in CO2 incubator at 37°C. CHANG and HuH-7 cells exposed to gAgNPs for 24 hrs. After treatment, the culture plates were washed with chilled PBS and 10 µM DCFH-DA was added per well at 37°C for 1 hr. After one-hour incubation, the plate was washed and fluorescence intensity was measured at 485 nm excitation and 520 nm emissions using the micro plate reader (Synergy-H1; BioTek). Data were represented as a percent of fluorescence intensity relative to the control wells.
Another set of cells (1×10³ cells/well in a six-well transparent plate) were analyzed for intracellular fluorescence using a fluorescence microscope (Olympus CKX 41; Olympus: Center Valley, Pennsylvania, USA), with images taken at 40 x magnification.
Preparation of Cells Extracts
CHANG and HuH-7 cells have treated to different concentration (0,5, 20, 40 and 100 µg/mL) of gAgNPs in 75 cm2 culture flasks for 24 hrs. The cells were washed with cold PBS and scarped by scraper (Fisher Brand Cell scrapers, Fisher Scientific USA) and cell lysis buffer [1× 20 mM Tris-HCl (pH 7.5), 150 mM NaCl, 1 mM Na2EDTA, 1% Triton, 2.5 mM sodium pyrophosphate] were added in tube for 30 min at 4ºC. After incubation, the cells were centrifuged at 15,000 rpm at 4°C and supernatant was collected and retained on ice for other tests. The quantity of protein in cell lysate was measured by Bradford method.25
LPO Assay
LPO (lipid peroxide) level was evaluated by determining the development of malondialdehyde (MDA) using the method of Ohkawa et al26. One hundred microliter cell lysate was mixed with 1.9 mL sodium phosphate buffer (0.1 M, pH 7.4) and incubated for 60 min 37°C. After incubation TCA (5% w/v) was added and centrifuged at 3000 g for 10 min at room temperature to obtain supernatant. The supernatant was mixed with 1 mL TBA (1%) and put in water bath at 100°C for 30 min. The absorbance of cooled mixture was observed at 532 nm and was converted to MDA and expressed in terms of mM MDA/mg protein.
GSH Assay
The evaluation of total glutathione content (GSH/GSSG) was done using a colorimetric test kit (ab156681). The total glutathione quantity was measured by comparison with the predetermined glutathione standard curve. Data were expressed as nM (GSH/GSSG)/mg protein.
Evaluation of Mitochondrial Membrane Potential (MMP)
CHANG and HuH-7 cells were cultured in clear bottom black 96-well plate and incubated at 37°C, 5% CO2 and 95% humidity for 24 hrs to allow for cell attachment. After incubation, medium was discarded from plate and different concentration (0, 5, 20, 40 and 100 µg/mL) of gAgNPs exposed to plate for 24 hrs. After treatments, the NPs were removed and plates were washed three-time Hank’s balanced salt solution. Then JC-1 (10 µM) was added per well and plates were put for 60–70 min at 37°C. After dye incubation, the dye was removed from the plates and the plates were washed two times with chilled HBSS. Fluorescence was evaluated at excitation/emission 485/580 nm and then at excitation/emission 485/530 nm using a fluorescence plate reader (Synergy Biotech, USA).
To confirm the compromisation of MMP in CHANG and HuH-7 cells, plates were also used to capture fluorescence images from fluorescence microscopy (Nikon Eclipse TE 300). Excitation of JC-1 was at 450–480 nm and emission was measured using a long pass 520 filter, which allowed seeing both the green and red florescence intensity at the same time.
Condensation of Chromosome in CHANG and HuH-7 Cells
CHANG and HuH-7 cells were cultured in six-well plates and added to various concentrations (0, 5, 20, and 40 µg/mL) of gAgNPs for 24 hrs. After exposure to gAgNPs the condensation of chromosome in cells examined by using confocal microscope after staining Hoechst 33342 (10 µL) and propidium iodide (PI) (10 µL) stains.
Evaluation of Caspase-3
Caspase-3 enzymes play a significant role in cell death. Caspase-3 enzymes were determined in gAgNPs (0, 5, 20, and 40 µg/mL) exposed and unexposed CHANG and HuH-7 cells by using Bio-Vision colorimetric assay kits.
Flow Cytometric Analysis
The apoptotic and necrotic CHANG and HuH-7 cells after exposure to gAgNPs (0, 5, 20, and 40 µg/mL) for 24 hrs were determined through flow cytometer (Becton-Dickinson Immuno cytometry Systems, Sunnyvale, CA, USA) by using Annexin V-FITC/PI staining. Cells were accumulated by trypsinization, and washed with PBS and re-suspended in binding buffer at a concentration of106 cells/mL. Annexin V-FITC (5 µL) and PI (5 µL) was mixed to cell suspension (500 µL) and incubated for 30 min at the dark at room temperature. Then cells were screened by flow cytometry (Becton-Dickinson Immuno cytometry Systems, Sunnyvale, CA, USA). Fluorescence emitted by Annexin V bound FITC and DNA-bound propidium iodide in each event was detected as red fluorescence, respectively. Results were analyzed by FACS Diva 6.1.2 software.
DNA Fragmentation Assay
DNA fragmentation after exposure to gAgNPs in both cells were examined applying alkaline single-cell gel electrophoresis assay according to Ali et al27. This is a visual and sensitive technique for evaluating DNA strand breakage in CHANG and HuH-7 cells. The damage is expressed by an increase of DNA fragments that have migrated out of the cell nucleus during electrophoresis and formed an image of a DNA in comet tail length (% of tail DNA) and olive tail moment. A total of 50 cells on each slide were counted according to the intensity of fluorescence in the tail. DNA damage was expressed as percentage tail DNA and olive tail moment by using a Carl Zeiss (AXIO), Imager M1 microscope connected to a computer with Comet Imager V.2.0.0 software for comet analysis.
Western Blot Assay
The two liver cells (CHANG and HuH-7 cells) were scrapped in RIPA buffer (ab156034), after which the cell were centrifuged at 13,000 rpm, 4ºC for 30 min and supernatant were transfer in new tube for further study. The proteins (20 μg) were separated on TGX stain free gel and transferred to a polyvinylidene fluoride (PVDF) membrane (Bio Rad, Laboratories Inc., Berkeley, CA, USA). The membrane was then incubated with mouse monoclonal antibody against β-actin (1:12,000 dilutions, Abcam, Cambridge, UK), Bax (1:1000 dilutions, Antibodies-online), Bcl-2 (1:500 dilutions, Santa Cruz) overnight at 4°C. The horseradish peroxidase (HRP)-conjugated goat anti-mouse IgG (H + L) antibody (1:2000 dilutions Bio Rad) was used as a secondary antibody. Immuno-reactive bands were detected using an EZ west Lumi plus (ATTO corporation, Tokyo, Japan), which is a chemiluminescent substrate to detect HRP on Western blotting membrane. The luminescence intensity (optical density) of the target protein bands was quantified using Lumino Graph 2 (ATTO Corporation). All protein expression levels were normalized to the levels of β-actin protein expression in each band.
Statistical Analysis
All experiments were run minimum three times, and data presented as average ± standard error (±SE). Data from the experiments were statistically analyzed by one-way analysis of variance (ANOVA) followed by a post hoc Dunnett’s test using the Graph Pad prism 5.01 software (Graph Pad Software Inc., San Diego, CA, USA). A p-value <0.05, 0.01, was considered statistically significant and highly significant in this data, respectively.
Results
Physiochemical Characterization of gAgNPs
The gAgNPs was characterized by applying by HR-TEM and DLS methods. The TEM image of gAgNPs was presented in Figure 1A. The mean diameter of gAgNPs with spherical shape was 52.4±3.6 nm. The hydrodynamic size of gAgNPs in water and culture media were 122±2.0 nm and 160± 3 nm. The zeta-potential of NPs in water and culture media were ~11.4 ±2.6 mV and ~9.1±2.4 mV (Table 2).
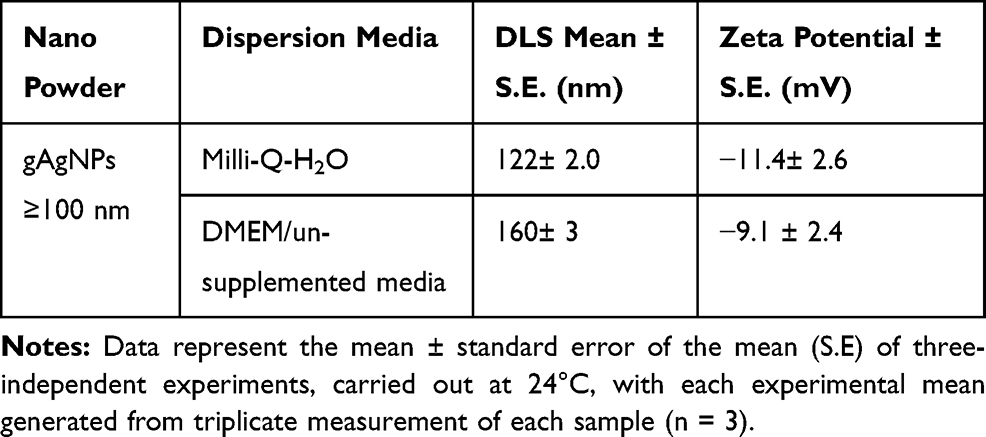 |
Table 2 DLS Measurements of Nanoparticle Size and Zeta Potential to Compare the Dispersion Characteristics of Particles in Simplified and in vitro Biological Representative Media |
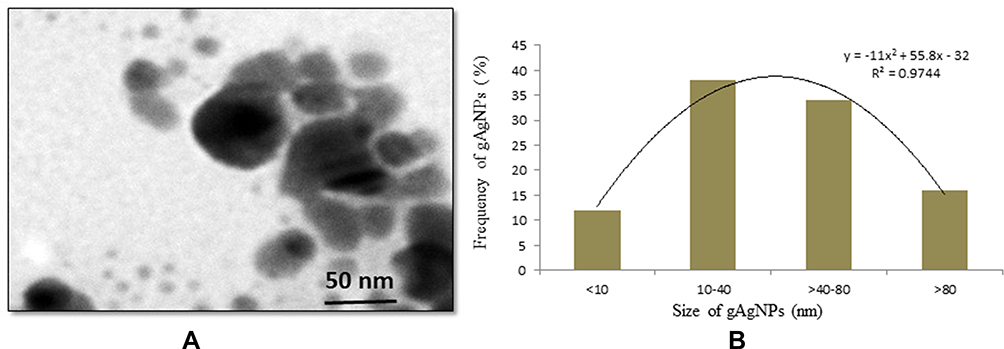 |
Figure 1 (A) TEM image of green silver nanoparticles (gAgNPs) (B) Distribution green silver nanoparticles (gAgNPs) size (%). |
Cytotoxicity
The cytotoxic response of gAgNPs on CHANG and HuH7 cells was assessed by MTT and LDH assays and cytotoxicity results were shown in Figure 2A and B). The gAgNPs showed more adverse effects on HuH7 cells than CHANG cells. The gAgNPs produced cytotoxicity in concentration dependent manner. The maximum cytotoxic level of gAgNPs in CHANG cells was 70.5% and whereas it was 54.9% for HuH7 cells. Some researchers reported that cell viability up to 50% and onwards demonstrate the nanoparticle is non-cytotoxic, whereas less than 50% cell viability demonstrate the NPs are cytotoxic.28 The different types of cells showed variation in LDH activity.29 In this experiment the release of LDH enzyme in HuH-7 cells was more than CHANG cells. Thus it was confirmed that gAgNPs was cytotoxic for HuH-7 cells and result of LDH test was agreement with the finding of MTT test (Figure 2B).
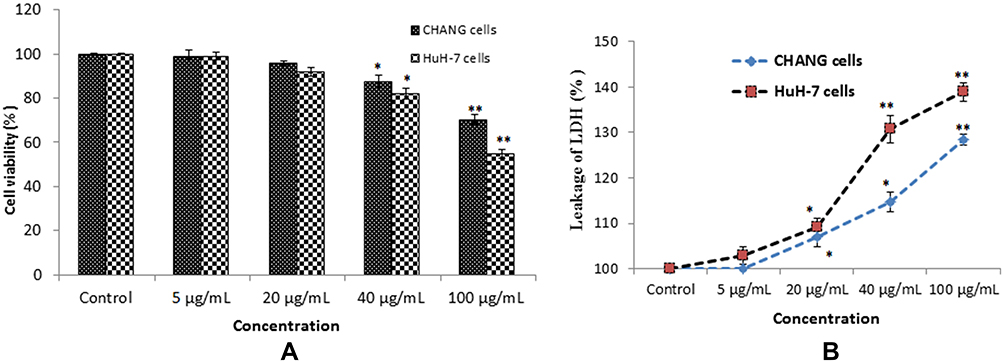 |
Figure 2 Cytotoxicity of gAgNPs on CHANG and HuH-7 cells for 24 hrs, as evaluated by (A). MTT (B). LDH assays. Each value represents the mean ±SE of three experiments. n= 3, *p < 0.05, ** p < 0.01 vs control. |
Oxidative Stress Biomarkers
The generation of ROS in CHANG and HuH-7 cells after treatment of gAgNPs was determined and it was generated as concentration dependent manner. Oxidative stress includes lipid peroxidation, glutathione and oxidative damage to nuclear materials and proteins at cellular levels. The generation of ROS was measured by using DCFDA and it was oxidized in cells and formed DCF fluorescent compound. We have observed high intensity of green fluorescence in HuH-7 cells than CHANG cells (Figure 3A–F). Percentage of intracellular generation of ROS was 153.8% and 180% in CHANG and HuH-7 cells at higher concentration of gAgNPs exposure, respectively (Figure 3G).
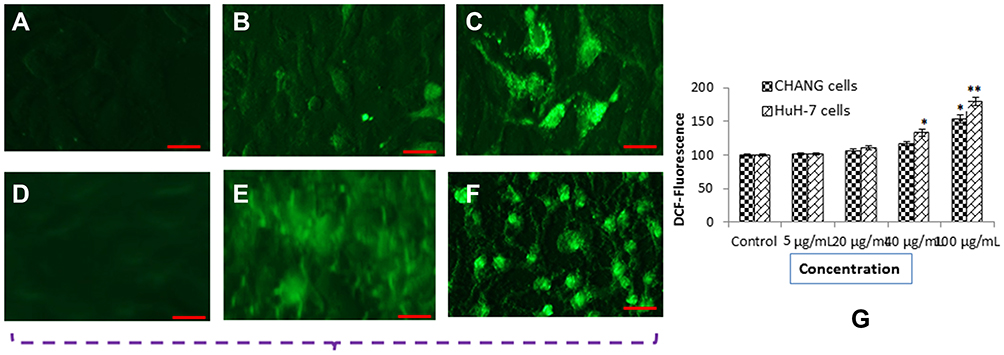 |
Figure 3 DCF Fluorescence intensity of CHANG and HuH-7 cells after exposure to NPs for 24 hr (A) Control CHANG cells (B) CHANG cells at 40 µg/mL gAgNPs exposure (C) CHANG cells at 100 µg/mL gAgNPs exposure (D) Control HuH-7 cells (E) HuH-7 cells at 40 µg/mL gAgNPs exposure (F) HuH-7 cells at 100 µg/mL gAgNPs exposure (G) % ROS generation due to NPs exposure to cells. Each value represents the mean ±SE of three experiments. *p< 0.05 and **p< 0.01vs. control. Scale bar is 200 µm. |
The other oxidative biomarkers such as LPO and GSH were determined in these cells. The level of glutathione was decreased (Figure 4B) and lipid peroxide was increased in HuH-7 cells than CHANG cells (Figure 4A).
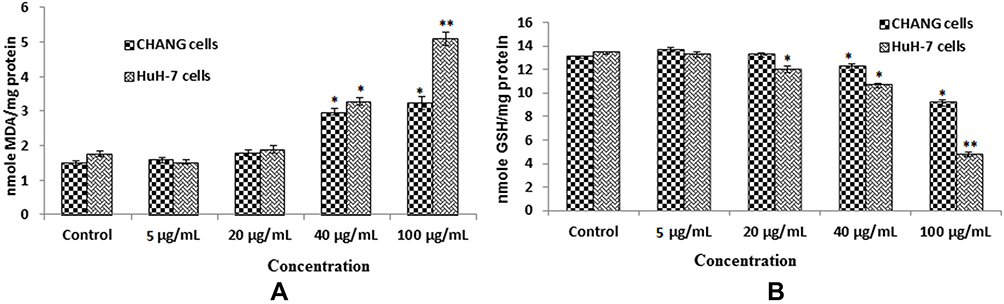 |
Figure 4 After exposure of gAgNPs on CHANG and HuH-7 cells for 24 hrs (A). Levels of LPO (B). GSH in cells. Each value represents the mean ±SE of three experiments. *p < 0.05 and**p < 0.01 vs control. |
MMP
We have measured loss of MMP in CHANG and HuH-7 cells at different concentration of gAgNPs for 24 applying the dye, JC-1. Red aggregates were indicative of intact mitochondrial membrane potential (MMP) were predominant in cells at exposure of lower concentration of gAgNPs (5 µg/mL) (Figure 5C). The cells treated with high concentration (100 µg/mL) decrease red aggregate and increase green aggregate were indicating loss of MMP (Figure 5A and B). Our findings agreement with finding of Bova et al,30 for loss of MMP in HepG2 cells due to troglitazone. The MMP was decreased in a dose-response manner (Figure 5).
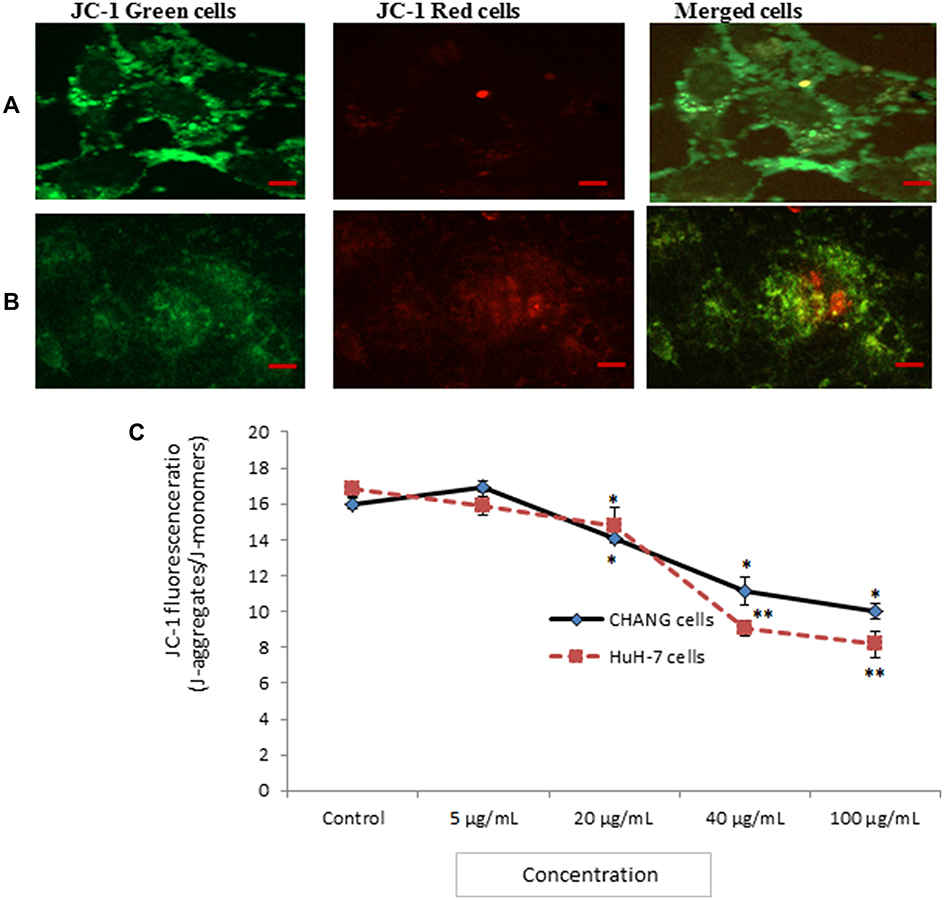 |
Figure 5 Photomicrograph of JC-1 fluorescence intensity in CHANG cells (A) and HuH-7 cells (B) after exposure to gAgNPs (C). JC-1 fluorescence ratio as marker of MTP loss. Each value represents the mean ±SE of three experiments. *p < 0.05 and **p < 0.01 vs control. Scale bar is 20 µm. |
Apoptosis and Necrosis in Cells
We have determined the activity of caspase-3 in CHANG and HuH-7 cells. Activity of caspase-3 was found more in HuH-7 cells than CHANG cells (Figure 6G). The chromosome condensation was observed by using DAPI and more condensed chromatin was found in 20 µg/mL and 40 µg/mL gAgNPs exposed CHANG (Figure 6B and C) and HuH-7 cells (Figure 6E and F) as compared to control cells (Figure 6A and D), respectively.
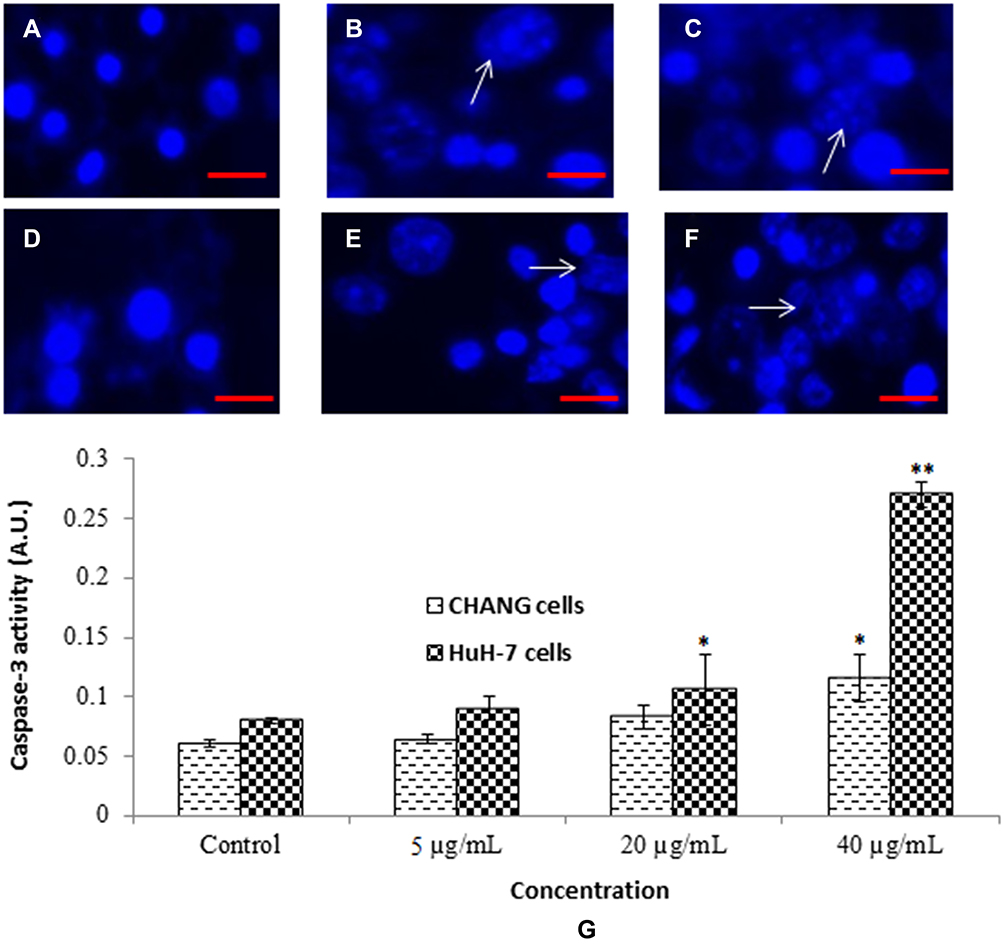 |
Figure 6 Chromosomal condensation (A). Control CHANG cells (B). CHANG cells exposed at 20 µg/mL gAgNPs (C). CHANG cells exposed at 40 µg/mL gAgNPs (D). Control HuH-7 cells (E). HuH-7 cells exposed at 20 µg/mL gAgNPs (F). HuH-7 cells exposed at 40 µg/mL gAgNPs and (G) Induction of caspase-3 activity in CHANG and HuH-7 cells after exposure to gAgNPs for 24 hrs. Each value represents the mean ±SE of three experiments. *p < 0.05 and **p < 0.01 vs control. Arrow indicates fragmented chromosome. Scale bar is 200 µm. |
Figure 7 represents the typical fluorescence activated cell sorting (FACS) photomicrograph. The statistical analysis of early and late apoptotic cells was determined by (FACS) as shown in Figure 7A–E. The cell histogram revealed that no cytotoxic effects of gAgNPs at lower concentrations. The gAgNPs induced high toxicity towards HuH-7 cells. Even at the higher concentration of gAgNPs (40 μg/mL), the early and late apoptosis rate was 24.42% and 26.46%, respectively, compared with that of the control group (Figure 7E).
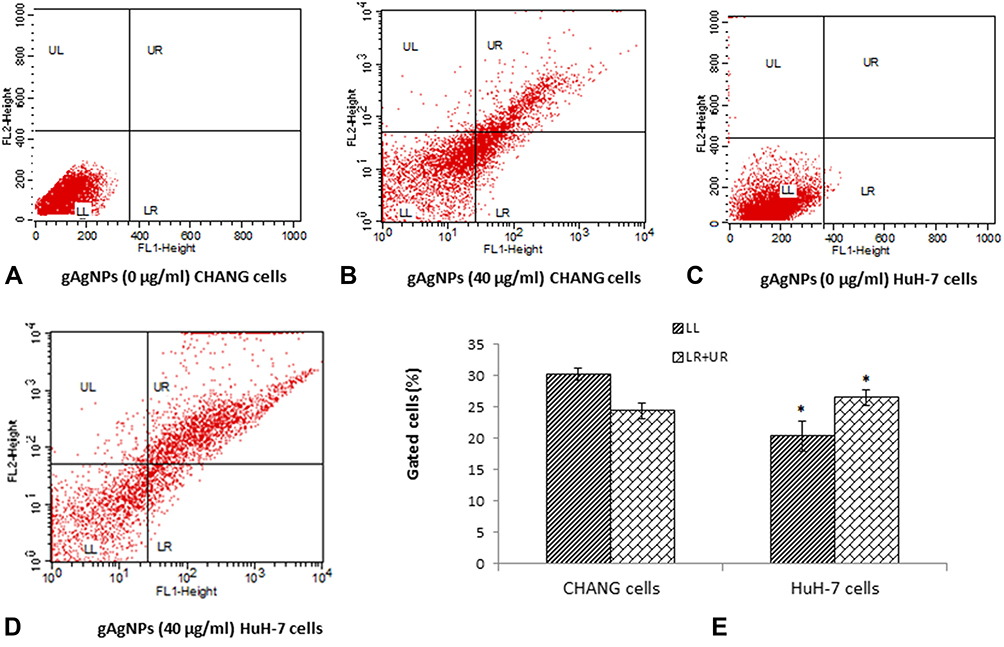 |
Figure 7 The fluorescence scatter diagram after exposure to gAgNPs (40 µg/mL) to cells (A). Control CHANG cells (B). CHANG cells exposed at 40 µg/mL gAgNPs (C). Control HuH-7 cells (D). HuH-7 cells exposed at 40 µg/mL gAgNPs and (E) Induction of early and late apoptotic cells (%) after exposure to gAgNPs (40 µg/mL) for 24 hrs. Each value represents the mean ±SE of three experiments. *p < 0.05 vs control. FL-1 Height and FL-2 Height represents Annexin-V-FITC and PI staining cells, respectively. LL – living cells (Annexin-V–/PI–stained), LR – Early apoptotic cells (Annexin-V+/PI–stained), UL – Necrotic cells (Annexin-V–/PI+ stained), UL – Late apoptotic cells (Annexin-V+ PI+ stained). |
DNA Damage
The fragmentation of DNA in both cells after exposure to gAgNPs was measured in the form of percentage tail DNA and olive tail moment (Figure 8A–F). The gAgNPs induced DNA damage in both cells in concentration dependent manner but higher DNA damage was seen in HuH-7 cells than CHANG cells (Figure 8A and B).
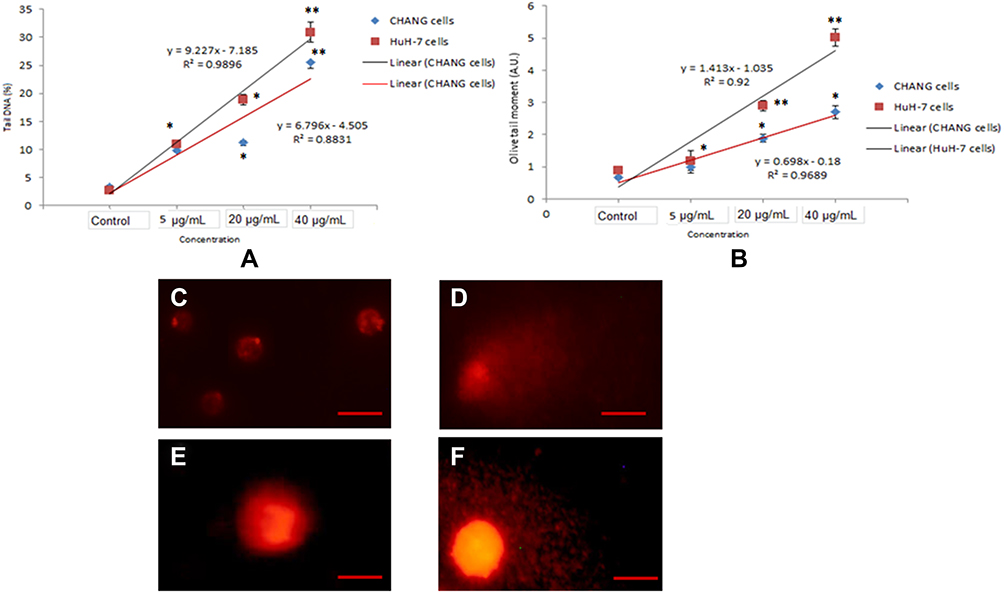 |
Figure 8 Genotoxic effect of gAgNPs exposure to CHANG and HuH-7 cells (A). Tail DNA (%) (B). Olive tail moment. DNA damage photomicrograph of cells due to gAgNPs exposure (C). Control CHANG cells (D). CHANG cells exposed at 40 µg/mL gAgNPs (E). Control HuH-7 cells (F). HuH-7 cells exposed at 40 µg/mL gAgNPs. Each value represents the mean ±SE of three experiments. *p < 0.05 and **p < 0.01 vs control. Scale bar is 50 µm. |
Altered Expression of Apoptotic Protein
To determine the expression of apoptotic protein in CHANG and HuH-7 cell by gAgNPs was evaluated by Western blot analysis (Figure 9). In CHANG cells, gAgNPs induced dose dependent decrease in Bcl2 protein expression (Figure 9A) and increased expression of bax, proteins (Figure 9A). HuH-7 cells induced similar effects, leading to a significant decrease in Bcl2 and increase in bax, protein expression (Figure 9B). As in observation, there was more expression of apoptotic protein in HuH-7 cells than CHANG cells (Figure 9C).
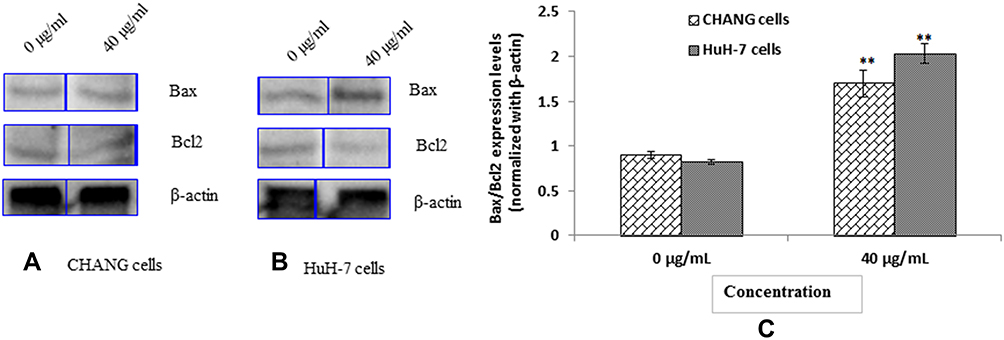 |
Figure 9 Expression of pro and anti-apoptotic proteins as evaluated by immuno blotting for 24 hrs (A) CHANG cells (B) HuH-7 Cells (C) Densitometry analysis of relative protein level of Bax/Bcl2 ratio. Each value represents the mean ±SE of three experiments. n= 3, ** p < 0.01 vs control. |
Discussion
The most significant use of nanotechnology is the upgrade of human health through medical innovations.31 Nanotechnology is an inventive field of science involving the higher application of new materials. We used red beet extracts for the synthesis of silver nanoparticles. The synthesized silver nanoparticles had a spherical shape and the size ranged from 5 to 100 nm (Figure 1). Some researchers reported that the size of synthesized nanoparticles depends upon the plant extract volume.32 Green technology is a set of principles or rather a chemical philosophy that encourages the design of products and processes that reduce or eliminate the use and generation of hazardous substances.33 This indicates that most of the microspheres are produced in the products except when red beet extracts are used and during organic molecule capping on the surface of AgNPs.34 Based on the reported studies, it is clear that silver nanoparticles are extensively used as antibacterial and antimicrobial agents.35 In particular, AgNP-based nano-systems were assessed as suitable carriers of various therapeutic molecules, including anti-inflammatory,36 antioxidant,37 antimicrobial,38 anti-cancer39 substances. Nowadays, biosynthesized metallic nanoparticles using plant extracts have drawn more attention because of being a simple and viable alternative against chemical and physical methods with a potential application in the field of nanomedicine. Silver nanoparticles were synthesized using Piper longum fruit and showed antibacterial and cytotoxic effects.40 In this experiment, we determined the cytotoxic and genotoxic potentials of the gAgNPs in CHANG and HuH-7cells. The gAgNPs reduced the cell vitality of these cells after exposure to gAgNPs. The gAgNPs induced more cytotoxic effects on the HuH-7 than on the CHANG cells. The morphological alterations of these cells were evaluated by AO/EtBr staining and these changes were correlated to gAgNPs cytotoxicity. The synthesized silver nanoparticles were able to induce fragmentation of the nucleus in the cells. Mousavi et al,41 reported that gAgNPs synthesized by using the leaf extracts of Artemisia turcomanica induced cytotoxic and apoptotic effects on gastric cancerous cells. Nanoparticles induce free radicals, which may damage the cells through oxidative stress mechanism. The generation of intracellular ROS deteriorates the lipid membrane of the target cells by the formation of malondialdehyde molecule and this is known as lipid peroxidation (LPO).42 In this study, a more prominent lipid peroxidase activity was observed in the HuH-7 than CHANG cells. ROS has been linked through a different mechanism such as damaging nuclear components (DNA and RNA) and protein, interference of cellular signaling pathways, and alteration in the gene expression ultimately leading to the stoppage of cell growth.42 Treatment of CHANG and HuH-7 cells with gAgNPs revealed concentration-dependent toxic effects on mitochondrial injury and DNA damage because of oxidative stress. Interestingly, among these two-cell types, the HuH-7 cells were more sensitive than the CHANG cells. To confirm whether cell proliferation was inhibited by the apoptotic response, we investigated the apoptotic cells by annexin-V-FITC and PI staining after exposure to gAgNPs. The genotoxic potential of gAgNPs was determined by using the comet assay and higher DNA damage was found at the maximum concentration of AgNPs exposure. We measured the LPO and glutathione levels, biomarkers of oxidative stress, in both the cells after treatment with NPs.
This study indicates that gAgNPs is an inducer of apoptosis in the liver cells, although its effect takes place more slowly than the DNA-damaging nanoparticles and after a long dormant time. However, mitochondria are the main source of ROS generation.43 Some researchers reported that the increased ROS generation in Rett mice was accompanied by increased mitochondrial activity.4,44 MMP contributes to the systemic oxidative burden and oxidative tissue damage in CHANG and HuH-7 cells.
The gAgNPs-induced apoptosis was initiated by the activation of caspase-3, which was observed at 20 and 40 µg/mL nanoparticle exposure by evaluation of the caspase-3 activity by ELISA and immunoblotting. Activation of caspase-3 was accompanied by the down-regulation of Bcl2 and the up-regulation of Bax and p53 proteins. All these events led to the appearance of the morphological signs of apoptosis, which were observed in more cells after exposure to NPs.
It was significant to note that HuH-7 cells were more susceptible to gAgNPs than the CHANG cells. In the future, we will investigate the mechanisms of toxicity due to gAgNPs in in vivo experiments.
Acknowledgment
This research was funded by the Deanship of Scientific Research at Princess Nourah Bint Abdulrahman University, through the Research Funding Program (Grant No# FRP-1440-4).
Disclosure
The authors report no conflicts of interest in this work.
References
1. Chen X, Schluesener HJ. Nanosilver: a nano-product in medical application. Toxicol Lett. 2008;176(1):1–12. doi:10.1016/j.toxlet.2007.10.004
2. Gulbagca F, Ozdemir S, Gulcan M, Sen F. Synthesis and characterization of Rosa canina-mediated biogenic silver nanoparticles for anti-oxidant, antibacterial, antifungal, and DNA cleavage activities. Heliyon. 2019;5(12):e02980. doi:10.1016/j.heliyon.2019.e02980
3. El-Sayed IH, Huang X, El-Sayed MA. Surface plasmon resonance scattering and absorption of anti-EGFR antibody conjugated gold nanoparticles in cancer diagnostics: applications in oral cancer. Nano Lett. 2005;5:829–834. doi:10.1021/nl050074e
4. Lim YY, Murtijaya J. Antioxidant properties of Phyllanthus amarus extracts as affected by different drying methods. LebTechnol. 2007;40:1664–1669.
5. Sathish KM, Sneha K, Won SW, et al. Cinnamon zeylanicum bark extract and powder mediated green synthesis of nanocrystalline silver particles and its bactericidal activity. Colloids Surf B Biointerfaces. 2009;73:332–338. doi:10.1016/j.colsurfb.2009.06.005
6. Safaepour M, Shahverdi AR, Shahverdi HR, et al. Green synthesis of small silver nanoparticles using geraniol and its cytotoxicity against fibrosarcoma-Wehi 164. Avicenna J Med Biotechnol. 2009;1:111–115.
7. Thakkar KN, Mhatre SS, Parikh RY. Biological synthesis of metallic nanoparticles. Nanomedicine. 2010;6:257–262. doi:10.1016/j.nano.2009.07.002
8. Lakshmanan G, Sathiyaseelan A, Kalaichelvan P, Murugesan K. Plant-mediated synthesis of silver nanoparticles using fruit extract of Cleome viscosa L.: assessment of their antibacterial and anticancer activity. Karbala Int J Mod Sci. 2018;4(1):61–68. doi:10.1016/j.kijoms.2017.10.007
9. Sánchez-Navarro M, Ruiz-Torres CA, Niño-Martínez N, et al. Cytotoxic and bactericidal effect of silver nanoparticles obtained by green synthesis method using annona muricata aqueous extract and functionalized with 5-fluorouracil. Bioinorg Chem Appl. 2018;2018:8. doi:10.1155/2018/6506381
10. Elella MHA, Mohamed RR, Abdel-Aziz MM, Sabaa MW. Green synthesis of antimicrobial and antitumor N, N, N-trimethyl chitosan chloride/poly (acrylic acid)/silver nanocomposites. Int J Biol Macromol. 2018;111:706–716. doi:10.1016/j.ijbiomac.2018.01.055
11. Palem RR, Ganesh SD, Kroneková Z, Sláviková M, Saha N, Sáha P. Green synthesis of silver nanoparticles and biopolymer nanocomposites: a comparative study on physico-chemical, antimicrobial and anticancer activity. Bull Mate Sci. 2018;41(2):55. doi:10.1007/s12034-018-1567-5
12. Dadashpour M, Firouzi-Amandi A, Pourhassan-Moghaddam M, et al. Biomimetic synthesis of silver nanoparticles using Matricaria chamomilla extract and their potential anticancer activity against human lung cancer cells. Mater Sci Eng C. 2018;92:902–912. doi:10.1016/j.msec.2018.07.053
13. Baharara J, Ramezani T, Hosseini N, Mousavi M. Silver nanoparticles synthesized coating with Zataria multiflora leaves extract induced apoptosis in HeLa cells through p53 activation. IJPR. 2018;17(2):627.
14. Oves M, Aslam M, Rauf MA, et al. Antimicrobial and anticancer activities of silver nanoparticles synthesized from the root hair extract of Phoenix dactylifera. Mater Sci Eng. 2018;89:429–443. doi:10.1016/j.msec.2018.03.035
15. Gamal AAE, AlSaid MS, Raish M, et al. Beetroot (Beta vulgaris L.) extract ameliorates gentamicin-induced nephrotoxicity associated oxidative stress, inflammation, and apoptosis in rodent model. Mediators Inflamm. 2014;2014:983952. doi:10.1155/2014/983952
16. Lee JH, Kim YS, Song KS, et al. Bio persistence of silver nanoparticles in tissues from Sprague-Dawley rats. Part Fibre Toxicol. 2013;1(10):36. doi:10.1186/1743-8977-10-36
17. Gurunathan S, Han JW, Eppakayala V, Jeyaraj M, Kim JH. Cytotoxicity of biologically synthesized silver nanoparticles in MDA-MB-231 human breast cancer cells. Biomed Res Int. 2013;2013:535796. doi:10.1155/2013/535796
18. Han JW, Gurunathan S, Jeong JK, et al. Oxidative stress mediated cytotoxicity of biologically synthesized silver nanoparticles in human lung epithelial adenocarcinoma cell line. Nanoscale Res Lett. 2014;9(1):459. doi:10.1186/1556-276X-9-459
19. Hsin YH, Chen CF, Huang S, Shih TS, Lai PS, Chueh PJ. The apoptotic effect of nano-silver is mediated by a ROS and JNK-dependent mechanism involving the mitochondrial pathway in NIH3T3 cells. Toxicol Lett. 2008;179(3):130–139. doi:10.1016/j.toxlet.2008.04.015
20. Jeong JK, Gurunathan S, Kang MH, et al. Hypoxia-mediated autophagic flux inhibits silver nanoparticle-triggered apoptosis in human lung cancer cells. Sci Rep. 2016;6:21688. doi:10.1038/srep21688
21. Erdogan O, Abbak M, Demirbolat GM, et al. Green synthesis of silver nanoparticles via Cynara scolymus leaf extracts: the characterization, anticancer potential with photodynamic therapy in MCF7 cells. PLoS One. 2019;14(6):e0216496. doi:10.1371/journal.pone.0216496
22. Alarifi S, Ali D, Alkahtani S. Oxidative stress-induced DNA damage by manganese dioxide nanoparticles in human neuronal cells. Biomed Res Int. 2017;2017:5478790. doi:10.1155/2017/5478790
23. Alarifi S, Ali D, Alkahtani S. Nanoalumina induces apoptosis by impairing antioxidant enzyme systems in human hepatocarcinoma cells. Int J Nanomedicine. 2015;10(1):3751–3760. doi:10.2147/IJN.S82050
24. Alzahrani F, Khadijah M, Ali D, Alarifi S. Apoptotic and DNA-damaging effects of yttria- stabilized zirconia nanoparticles on human skin epithelial cells. Int J Nanomedicine. 2019;14:7003–7016. doi:10.2147/IJN.S212255
25. Bradford MM. A rapid and sensitive method for the quantitation of microgram quantities of protein utilizing the principle of protein dye binding. Anal Biochem. 1976;72:248–254. doi:10.1016/0003-2697(76)90527-3
26. Ohkawa H, Onishi N, Yagi K. Assay for lipid peroxidation in animal tissue by thiobarbituric acid reaction. Anal Biochem. 1979;95:351–358. doi:10.1016/0003-2697(79)90738-3
27. Ali D, Nagpure NS, Kumar S, Kumar R, Kushwaha B. Genotoxicity assessment of acute exposure of chlorpyrifos to freshwater fish channa punctatus (Bloch) using micronucleus assay and alkaline single-cell gel electrophoresis. Chemosphere. 2008;71(10):1823–1831. doi:10.1016/j.chemosphere.2008.02.007
28. Baker MA, Assis SL, Higa OZ, Costa I. Nanocomposite hydroxyapatite formation on Ti-13Nb-13Zr alloy exposed in a MEM cell culture medium and the effect of H2O2 addition. Acta Biomater. 2009;5(1):63–75. doi:10.1016/j.actbio.2008.08.008
29. Kaja S, Payne AJ, Naumchuk Y, Koulen P. Quantification of lactate dehydrogenase for cell viability testing using cell lines and primary cultured astrocytes. Curr Protoc Toxicol. 2017;72:
30. Bova MP, Tam D, McMahon G, Mattson MN. Troglitazone induces a rapid drop of mitochondrial membrane potential in liver HepG2 cells. Toxicol Lett. 2005;155:41–50. doi:10.1016/j.toxlet.2004.08.009
31. Basavaraj KH. Nanotechnology in medicine and relevance to dermatology: present concepts. Indian J Dermatol. 2012;57(3):169–174. doi:10.4103/0019-5154.96186
32. Moosa AA, Ridha AM, Al-Kaser M. Process parameters for green synthesis of silver nanoparticles using leaves extract of aloe vera plant. Int J Multi Curr Res. 2015;3:966–975.
33. Anastas PT, Warner JC. Green Chemistry: Theory and Practice. New York: Oxford University Press; 1998.
34. Kou J, Varma RS. Beet juice utilization: expeditious green synthesis of noble metal nanoparticles (Ag, Au, Pt, and Pd) using microwaves. RSC Adv. 2012;2:10283–10290. doi:10.1039/c2ra21908e
35. Burdușel AC, Gherasim O, Grumezescu AM, Mogoantă L, Ficai A, Andronescu E. Biomedical applications of silver nanoparticles: an up-to-date overview. Nanomaterials (Basel). 2018;8(9):681. doi:10.3390/nano8090681
36. Jiang Q, Yu S, Li X, Ma C, Li A. Evaluation of local anesthetic effects of lidocaine-Ibuprofen ionic liquid stabilized silver nanoparticles in Male Swiss mice. J Photochem Photobiol B. 2018;178:367–370. doi:10.1016/j.jphotobiol.2017.11.028
37. Soni N, Dhiman RC. Phytochemical, anti-oxidant, larvicidal, and antimicrobial activities of castor (Ricinus communis) synthesized silver nanoparticles. Chin Herb Med. 2017;9:289–294. doi:10.1016/S1674-6384(17)60106-0
38. Kaur A, Goyal D, Kumar R. Surfactant mediated interaction of vancomycin with silver nanoparticles. Appl Surf Sci. 2018;449:23–30. doi:10.1016/j.apsusc.2017.12.066
39. Petrov PD, Yoncheva K, Gancheva V, Konstantinov S, Trzebicka B. Multi-functional block copolymer nano-carriers for co-delivery of silver nanoparticles and curcumin: synthesis and enhanced efficacy against tumor cells. Eur Polym J. 2016;81:24–33. doi:10.1016/j.eurpolymj.2016.05.010
40. N J R, Vali DN, Rani M, Rani SS. Evaluation of antioxidant, antibacterial and cytotoxic effects of green synthesized silver nanoparticles by Piper longum fruit. Mater Sci Eng C. 2014;34:115–122. doi:10.1016/j.msec.2013.08.039
41. Mousavi B, Tafvizi F, Bostanabad SZ. Green synthesis of silver nanoparticles using Artemisia turcomanica leaf extract and the study of anti-cancer effect and apoptosis induction on gastric cancer cell line (AGS). Artif Cells Nanomed Biotechnol. 2018;46(S1):S499–S510. doi:10.1080/21691401.2018.1430697
42. Wang TY, Libardo MDJ, Angeles-Boza AM, Pellois JP. Membrane oxidation in cell delivery and cell killing applications. ACS Chem Biol. 2017;12(5):1170–1182. doi:10.1021/acschembio.7b00237
43. Can K, Rinne CM, Rehling P, et al. Neuronal redox-imbalance in Rett Syndrome affects Mitochondria as Well as Cytosol, and is accompanied by intensified mitochondrial O2 consumption and ROS Release. Front Physiol. 2019. doi:10.3389/fphys.2019.00479
44. Grober U, Kisters K, Adamietz IA. Vitamin D in oncology: update 2015. Med Monatsschr Pharm. 2015;38(12):512–516.
 © 2020 The Author(s). This work is published and licensed by Dove Medical Press Limited. The full terms of this license are available at https://www.dovepress.com/terms.php and incorporate the Creative Commons Attribution - Non Commercial (unported, v3.0) License.
By accessing the work you hereby accept the Terms. Non-commercial uses of the work are permitted without any further permission from Dove Medical Press Limited, provided the work is properly attributed. For permission for commercial use of this work, please see paragraphs 4.2 and 5 of our Terms.
© 2020 The Author(s). This work is published and licensed by Dove Medical Press Limited. The full terms of this license are available at https://www.dovepress.com/terms.php and incorporate the Creative Commons Attribution - Non Commercial (unported, v3.0) License.
By accessing the work you hereby accept the Terms. Non-commercial uses of the work are permitted without any further permission from Dove Medical Press Limited, provided the work is properly attributed. For permission for commercial use of this work, please see paragraphs 4.2 and 5 of our Terms.