")
Back to Journals » Diabetes, Metabolic Syndrome and Obesity » Volume 13
Effects of Glycated Hemoglobin Level on Bone Metabolism Biomarkers in Patients with Type 2 Diabetes Mellitus
Authors Zhao H, Qi C, Zheng C, Gan K, Ren L, Song G
Received 8 February 2020
Accepted for publication 30 April 2020
Published 22 May 2020 Volume 2020:13 Pages 1785—1791
DOI https://doi.org/10.2147/DMSO.S248844
Checked for plagiarism Yes
Review by Single anonymous peer review
Peer reviewer comments 2
Editor who approved publication: Prof. Dr. Juei-Tang Cheng
Hang Zhao,1 Cuijuan Qi,1 Chong Zheng,2 Kexin Gan,1 Luping Ren,1,* Guangyao Song1,*
1Endocrinology Department, Hebei General Hospital, Hebei 050051, People’s Republic of China; 2Pediatric Orthopaedics, Shijiazhuang the Third Hospital, Hebei 050011, People’s Republic of China
*These authors contributed equally to this work
Correspondence: Luping Ren Email [email protected]
Purpose: We aimed to determine the relationship between the levels of glycated hemoglobin (HbA1c) and biomarkers of bone metabolism in patients with type 2 diabetes mellitus (T2DM), and whether HbA1c independently influences any of these biomarkers.
Patients and Methods: A cohort study of 240 patients with T2DM was performed. Serum was obtained and used to measure HbA1c, total cholesterol (TC), triglycerides, high-density lipoprotein-cholesterol, low-density lipoprotein-cholesterol (LDL-C), very-low-density lipoprotein-cholesterol, apolipoprotein A1 (ApoA1), apolipoprotein B (ApoB), total protein, albumin, blood urea nitrogen (BUN), creatinine, serum 25-hydroxyvitamin D (25OHD), osteocalcin (OC), β-C-terminal cross-linked telopeptide of type I collagen (β-CTX), procollagen type 1 N-terminal propeptide (P1NP), or parathyroid hormone (PTH) concentrations. The participants were divided into three study groups according to HbA1c level: < 7%, 7– 9% and ≥ 9%. Chi-square testing and one-way analysis of variance were used to compare groups. The relationships between HbA1c and bone metabolism biomarker values were analyzed using linear correlation analysis and multiple linear regression analysis.
Results: Age, duration of T2DM, and the concentrations of TC, LDL-C, apolipoprotein B, albumin, and BUN showed significant difference among the < 7%, 7– 9% and ≥ 9% HbA1c groups. Of the bone metabolism biomarkers, there were significant differences in serum 25-hydroxyvitamin D (25OHD) and osteocalcin (OC) among the groups. The correlation coefficients (r) for the relationships of HbA1c with 25OHD and OC were − 0.200 and − 0.183, respectively (P < 0.05). Regardless of adjustment for none, some, or all of the confounding factors (age, sex, and duration of T2DM), the 25OHD and OC concentrations were significantly lower in the HbA1c ≥ 9% group than in the HbA1c < 7% group. HbA1c showed no relationship with β-CTX, PINP, or PTH.
Conclusion: T2DM patients with poorer glycemic control had lower concentrations of serum 25OHD and OC, suggesting that HbA1c is an independent risk factor for low 25OHD and OC.
Keywords: diabetes mellitus type 2, bone metabolism, glycated hemoglobin
Introduction
Type 2 diabetes mellitus (T2DM) is a metabolic disease characterized by hyperglycemia that is caused by genetic and environmental factors. It can be associated with a variety of complications, which can be categorized as macrovascular disease, such as coronary heart disease and cerebral infarction, and microvascular disease, such as diabetic nephropathy, diabetic retinopathy, and diabetic peripheral neuropathy, but it also affects bone health.1 Diabetic osteoporosis (OP), first identified by Albright et al2 in 1947, is a form of secondary OP that leads to severe chronic pain and joint dysfunction, and even fracture, and is thus associated with a high prevalence of disability. In recent years, increasing attention has been paid to the deleterious effects of diabetes on bone.
Previous studies have shown that patients with T2DM have a higher risk of fracture than healthy people. A meta-analysis by Vestergaard3 showed that the relative risk of hip fracture in adults with T2DM is 1.3 times higher than that of normal people. The meta-analysis by Janghorbani yielded similar results, with a relative risk of hip fracture of 2.8 in adults with T2DM.4 This fracture risk is higher than that predicted using bone density measurements, and suggests high bone fragility in patients with T2DM.5 The underlying mechanisms of the higher bone fragility in diabetes are complex. Low bone turnover, accumulation of advanced glycation end-products, abnormal microstructures and macrostructures, and abnormal biomechanical properties caused by material damage to tissues may be responsible. However, other factors influence bone fragility, including the inflammatory response, oxidative stress, adipokines, and bone marrow fat content.6 Furthermore, external factors, such as falls, are closely related to diabetes complications and the hypoglycemia caused by treatment, and add to the higher risk of fracture.7 Nevertheless, even after adjusting for fall frequency, diabetes remains an independent risk factor for higher fracture risk.8,9
The measurement of bone mineral density is the gold standard method for the diagnosis of OP, but it is of relatively limited use in early diagnosis. Bone metabolism biomarkers are metabolites of bone cells or bone matrix that are of great assistance for the early diagnosis, evaluation, and treatment of OP. Biochemical indicators of bone formation include 25-hydroxyvitamin D (25OHD), osteocalcin (OC), and total type 1 N-terminal propeptide (P1NP), whereas β-C-terminal telopeptides of type I collagen (β-CTX) and parathyroid hormone (PTH) are biochemical indicators of bone resorption. In patients with T2DM, the efficacy of blood glucose control may affect the circulating concentrations of these bone metabolic markers, and thus may be useful for the prediction of OP risk. Glycated hemoglobin (Hb1Ac) was selected for this study because it can be used to evaluate the average fasting blood glucose level over the previous 2–3 months and is stable. We examined the relationships between HbA1c level and markers of bone metabolism in patients with T2DM and whether HbA1c independently influences these markers.
Patients and Methods
Participants
This study was approved by Ethics Committee of Hebei General Hospital (Registration no. ChiCTR2000029391). We enrolled patients with T2DM who were admitted to the Endocrinology Department of Hebei General Hospital between June 2018 and December 2019.
Inclusion Criteria
- Patients with T2DM were included. The diagnosis of T2DM was made according to the criteria for the diagnosis and classification of diabetes proposed by the World Health Organization in 1999 (Table 1).
- Patient information including basic characteristics and blood indicators was collected from all participants.
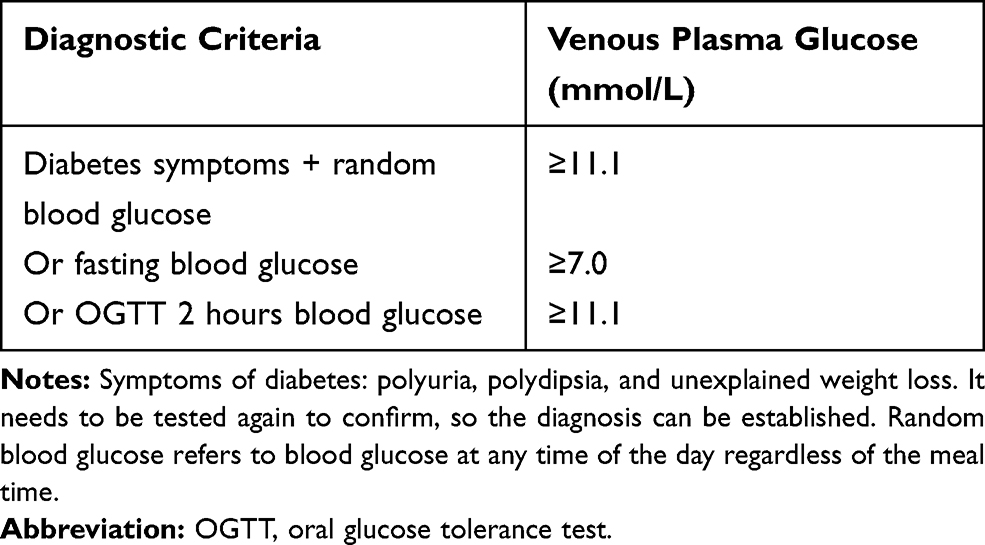 |
Table 1 Diagnostic Criteria for Type 2 Diabetes |
Exclusion Criteria
- Presence of type 1 diabetes or other types of diabetes.
- Presence of a complex inflammatory disease, such as lung or urinary tract infection, or another stress state.
- Use of vitamin D, calcium, a bisphosphonate, a glucocorticoid, estrogen, warfarin, or other drugs that affect bone metabolism in the preceding 6 months.
- Presence of a malignant tumor.
- Presence of a disease that could cause secondary OP, such as hyperthyroidism, hyperparathyroidism, rheumatoid arthritis, kidney disease, or multiple myeloma.
- Presence of another severe chronic disease, such as severe liver or kidney dysfunction, or heart failure.
- Presence of acute cardiovascular and cerebrovascular disease, such as myocardial infarction, cerebral hemorrhage, or cerebral infarction, in the preceding 6 months.
- Recent acute complications of diabetes, such as diabetic ketoacidosis, diabetic hyperosmolar coma, or hypoglycemia.
Data Collection
The age, sex, duration of T2DM, family history of diabetes (relatives within three generations), history of hypertension and gastrointestinal disease, smoking history, alcohol consumption history, and body mass index (BMI) of the participants were collected.
The participants were fasted overnight for at least 8–10 hours before blood was collected the following morning from a cephalic vein. Serum was obtained and used to measure HbA1c, total cholesterol (TC), triglycerides (TG), high-density lipoprotein-cholesterol (HDL-C), low-density lipoprotein-cholesterol (LDL-C), very-low-density lipoprotein-cholesterol (VLDL-C), apolipoprotein A1 (ApoA1), apolipoprotein B (ApoB), total protein, albumin, urea nitrogen (BUN), creatinine (Cr), 25OHD, OC, β-CTX, P1NP and PTH concentrations.
Statistical Analysis
Data were analyzed using SPSS v.22.0 (IBM, Inc., Armonk, NY, USA). According to their HbA1c results, the participants were divided into three groups: HbA1c <7%, HbA1c 7–9%, and HbA1c ≥9%. Categorical data are expressed as numbers (percentage) and the chi-square test was used for comparisons among groups. Continuous data were tested for their normality and homogeneity of variance; normally distributed data are expressed as mean ± standard deviation, and one-way analysis of variance was used for comparisons among groups. Non-normally distributed data are expressed as medians (interquartile range) and non-parametric testing was performed. The relationships between HbA1c and bone metabolism biomarkers were analyzed using linear correlation analysis and multiple linear regression analysis. P <0.05 was considered to indicate statistical significance.
Results
Basic Characteristics of Participants in the Three HbA1c Groups
Nearly half (49.6%) of the participants had an HbA1c ≥9%, which made this a larger group than the other two. There were no differences in the proportions of men and women among the three groups (P >0.05). The participants in the 7–9% group were slightly older (P <0.05). There were no differences in family history of diabetes, or prevalence of hypertension, gastrointestinal disorders, smoking or drinking among the groups (P >0.05). The duration of diabetes differed among the three groups, with the longest duration being 1–10 years in the ≥9% group (P <0.05). With regard to blood lipid concentrations, only the serum TC, LDL-C, and ApoB concentrations differed among the groups: when HbA1c was not well controlled (≥9%), the concentrations of these lipids were higher, while albumin concentrations were lower (P <0.05). BUN was highest in the 7–9% HbA1c group (P <0.05) (Table 2).
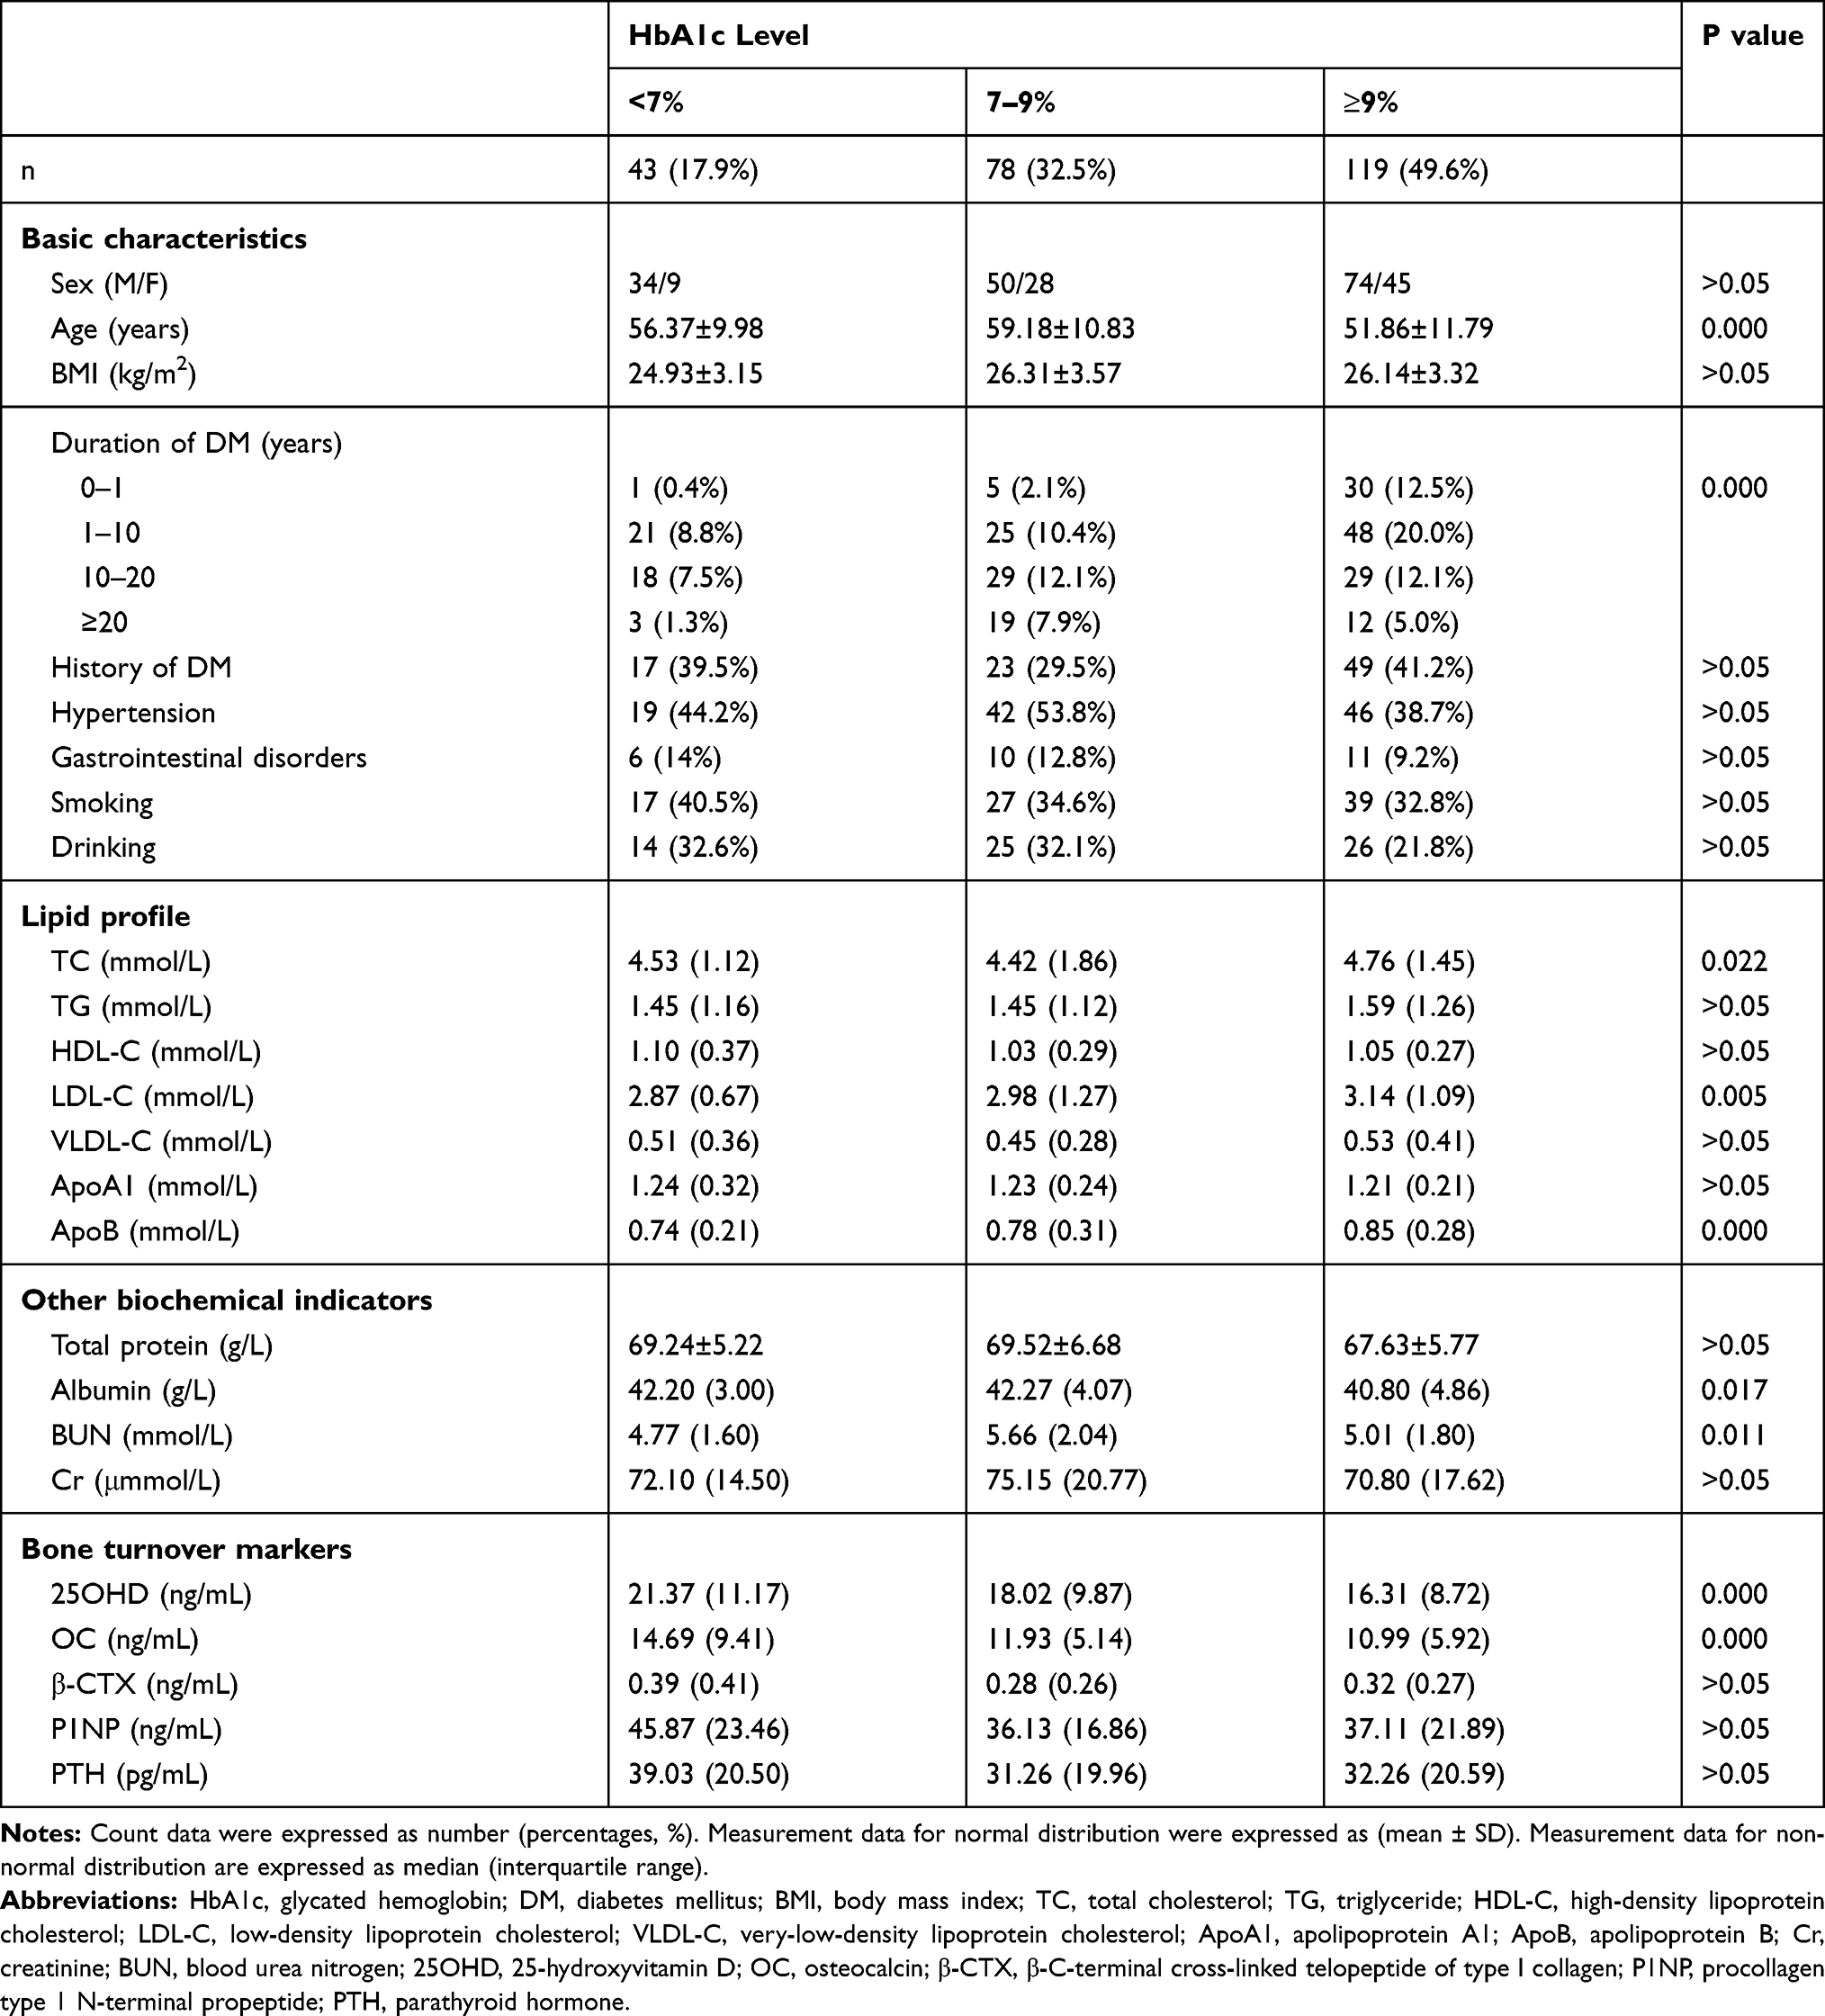 |
Table 2 Participants Characteristics by HbA1c |
Comparisons of Bone Metabolism Biomarker Concentrations Among the HbA1c Groups
There were no differences in β-CTX, P1NP, or PTH among the three groups (P >0.05). However, as HbA1c increased, the 25OHD and OC concentrations gradually decreased (P <0.05). In the HbA1c <7%, 7–9%, and ≥9% groups, the 25OHD concentrations were 21.37 (11.17), 18.02 (9.87), and 16.31 (8.72), and the OC concentrations were 14.69 (9.41), 11.93 (5.14), and 10.99 (5.92), respectively (P <0.05) (Table 1).
Relationships Between HbA1c and Bone Metabolism Biomarkers
The correlation coefficients for the relationships of HbA1c with 25OHD, OC, β-CTX, PINP and PTH were r = −0.200 (P = 0.002), r = −0.183 (P = 0.005), r = 0.007 (P = 0.920), r = −0.047 (P = 0.472) and r = −0.034 (P = 0.600) (Figure 1), respectively. These results implied negative linear correlations of HbA1c with 25OHD and OC.
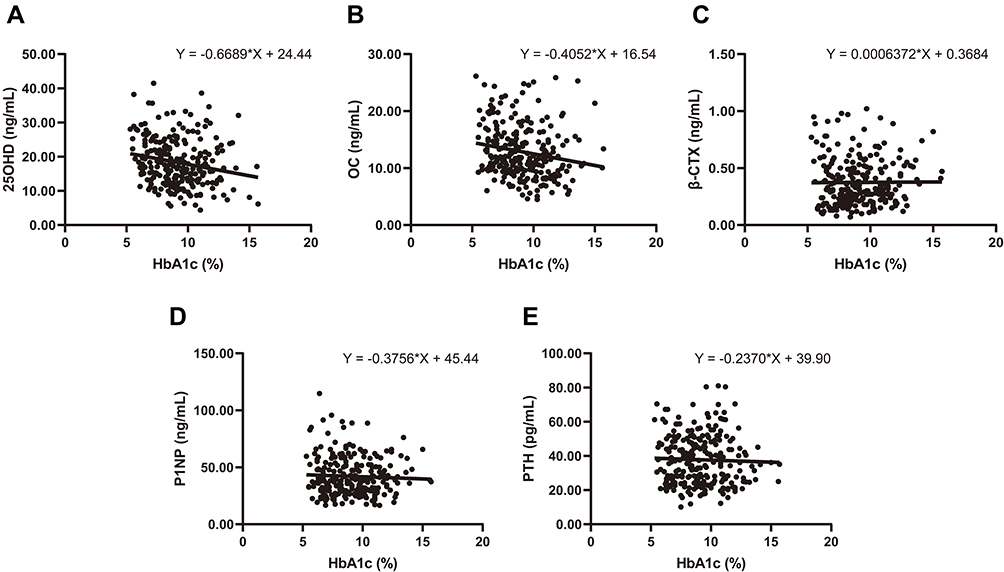 |
Figure 1 Linear association of HbA1c and bone metabolism biomarkers. Notes: (A) 25OHD (ng/mL), (B) OC (ng/mL), (C) β-CTX (ng/mL), (D) P1NP (ng/mL), (E) PTH (pg/mL). Abbreviations: HbA1c, glycated hemoglobin; OC, osteocalcin; P1NP, procollagen type 1 N-terminal propeptide; PTH, parathyroid hormone; 25OHD, 25-hydroxyvitamin D; β-CTX, β-C-terminal cross-linked telopeptide of type I collagen. |
Effect of HbA1c on Bone Metabolism Biomarkers
Before adjustment for potential confounding factors, the serum 25OHD and OC concentrations were significantly lower in the HbA1c ≥9% group than in the HbA1c <7% group (P <0.05). When some or all of the potential confounding factors were adjusted for, the same results were obtained (P <0.05), indicating that HbA1c independently influences 25OHD and OC. However, there were no significant differences between the 7–9% and <7% groups (P >0.05). Regardless of adjustment for potential confounding factors, HbA1c showed no relationship to β-CTX, PINP or PTH (P >0.05) (Table 3).
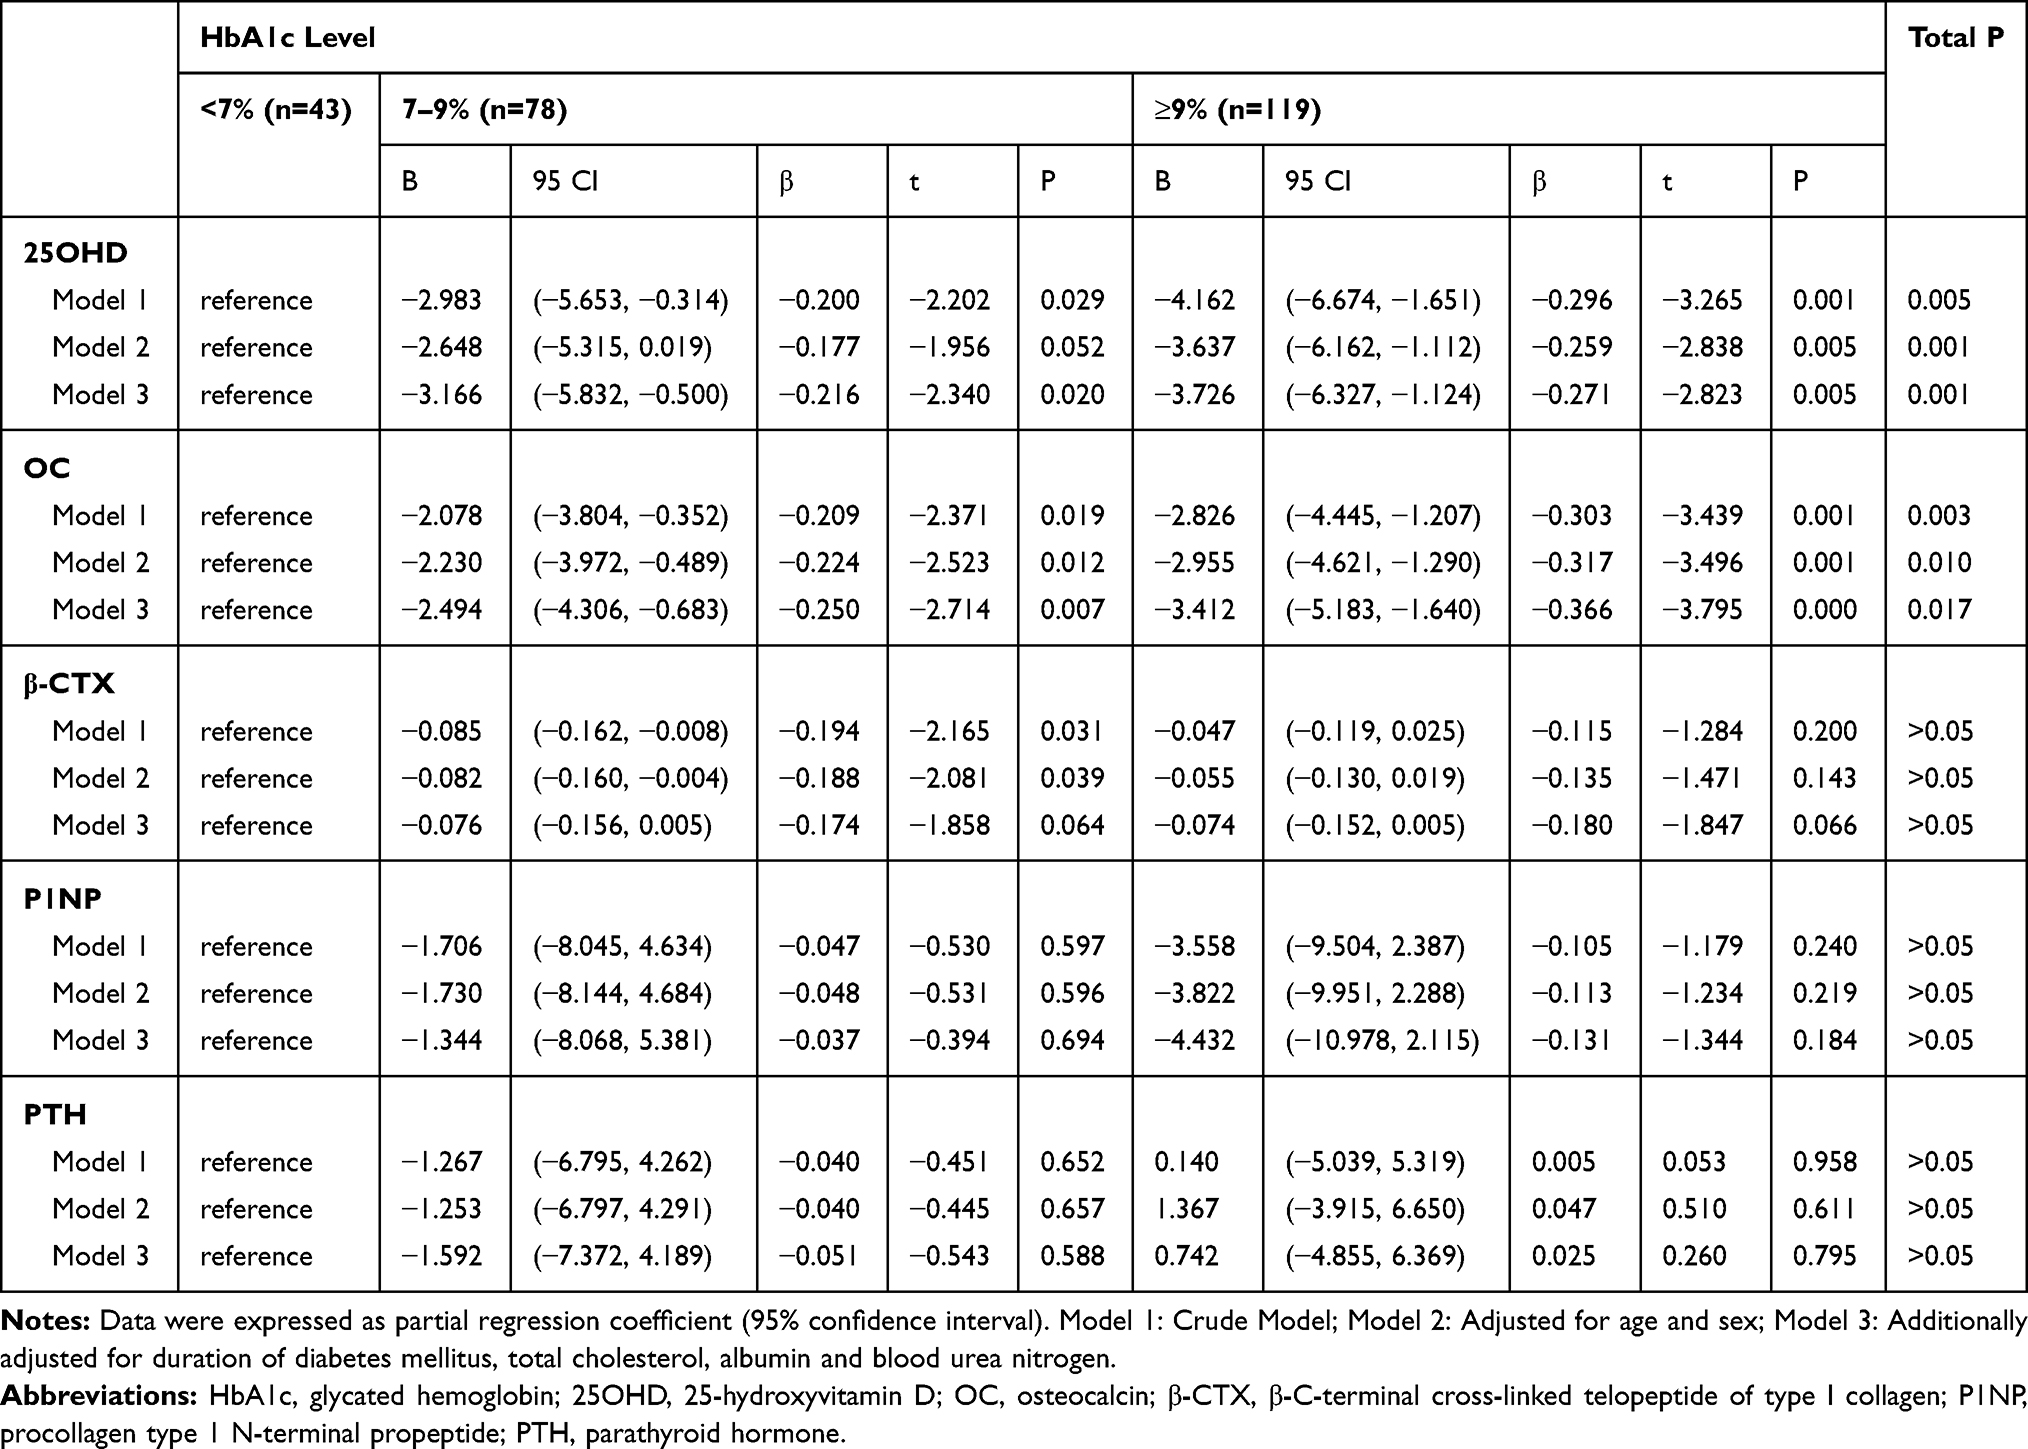 |
Table 3 Adjusted Association Between HbA1c with 25OHD, OC, β-CTX, P1NP and PTH |
Discussion
T2DM and OP are common in the older population, and they are frequent co-morbidities. In recent years, OP has become established as a chronic complication of T2DM,10,11 and indeed there is a common pathogenetic basis for OP and T2DM.12 Hyperglycemia and disorders of lipid and protein metabolism present in T2DM can affect bone metabolism in a number of ways. Previous epidemiological studies have found that patients with T2DM and OP have a higher risk of fracture than the general population.13 T1DM is the most common cause of secondary OP, and it has been shown that bone mineral density (BMD) declines due to insulin deficiency,14,15 whereas the onset of T2DM tends to be later, and therefore the accompanying changes in bone mass may be affected by a range of factors.16
Bone density and mass are important determinants of bone strength and have been evaluated using a variety of methods, including BMD, trabecular bone score, quantitative computed tomography, and bone morphology methods.17 Early diagnosis is difficult to achieve using these methods, whereas bone metabolism biomarkers reflect abnormal bone metabolism early in disease progression, and provide a theoretical basis for the prevention, early diagnosis, and treatment of OP in T2DM patients. Therefore, in the present study, bone metabolism biomarkers were used to evaluate bone metabolism in participants with T2DM. We divided the participants into three categories of HbA1c level: good glycemic control, <7%; poor glycemic control, 7–9%; and extremely poor glycemic control, with the need for intensive insulin treatment, ≥9%. We hypothesized that a close relationship between HbA1c and a bone metabolism biomarker be used to identify abnormal bone metabolism and early OP in patients with T2DM, and therapy prevents OP and fractures.
While the correlation coefficients for HbA1c with 25OHD and OC indicated weak relationships, this may have been the result of the limited sample size. Furthermore, the relationship between HbA1c and bone biomarkers may not be direct, ie there may be factors that mediate this relationship and merit further investigation. We found that a high level of HbA1c, especially >9%, was an independent risk factor for significantly lower serum 25OHD and OC concentrations (biomarkers of bone formation). As the HbA1c increased, serum 25OHD and OC concentrations decreased significantly. This result suggested that poor glycemic control has a deleterious effect on bone formation, and as the balance in bone metabolism continues to change, resorption dominates in bone, increasing the risk of OP.
A study by Timimi et al18 found that 53.7% and 4.4% of patients with T2DM had vitamin D insufficiency and deficiency, respectively, while in healthy people, the prevalence was 29.4% and 0.68%, respectively. Furthermore, a meta-analysis showed a significant negative correlation between blood 25OHD concentration and the risk of T2DM across a number of populations.19
There are several possible mechanisms whereby poor blood glucose control could lead to reduced bone formation. First, in hyperglycemic patients, a large amount of glucose is excreted in the urine, which may be accompanied by a large amount of calcium. Second, with the progression of the disease, islet function declines, resulting in insufficient insulin secretion, which inhibits protein synthesis, causing a negative nitrogen balance and robbing the skeleton of protein—a key component. Patients with T2DM and poor glycemic control have more severe islet β-cell dysfunction and insulin resistance, but vitamin D has been shown to improve β-cell function and increase the sensitivity of peripheral tissues to insulin.
There were some limitations to the present study. First, the sample size was relatively small, which may have led to false negatives with regard to the bone resorption-related indicators. Second, the study comprised patients with T2DM admitted to our hospital, who may have had poorer blood glucose control than the general population with diabetes, resulting in a larger number of participants with high HbA1c values. Future studies should recruit more participants with a more even split of HbA1c values among the three categories. Third, non-diabetic controls have not been included in the study because we only recruited subjects who were hospitalized, which may result in some analytic bias.
In summary, we have shown that the poorer the glycemic control of a patient with T2DM, the lower their serum 25OHD and OC concentrations, implying a lower degree of bone formation, which is not conducive to the maintenance of bone quality and strength. Therefore, proper control of blood glucose may help to promote bone formation and reduce the incidence of OP in these patients.
Abbreviations
ApoA1, apolipoprotein A1; ApoB, apolipoprotein B; BMD, bone mineral density; BMI, body mass index; BUN, blood urea nitrogen; Cr, creatinine; DM, diabetes mellitus; HbA1c, glycated hemoglobin; HDL-C, high-density lipoprotein cholesterol; LDL-C, low-density lipoprotein cholesterol; T2DM, type 2 diabetes mellitus; TC, total cholesterol; TG, triglyceride; VLDL-C, very-low-density lipoprotein cholesterol; OC, osteocalcin; OP, osteoporosis; P1NP, procollagen type 1 N-terminal propeptide; PTH, parathyroid hormone; 25OHD, 25-hydroxyvitamin D; β-CTX, β-C-terminal cross-linked telopeptide of type I collagen.
Data Sharing Statement
The authors confirm that all data underlying the findings are fully available forever by email request after publication. All relevant data are within the manuscript.
Ethics Approval
The experiment was approved by the Ethics Committee of Hebei General Hospital (No: 2020 Research Ethics 01). All patients provided written informed consent, and that this trial was conducted in accordance with the Declaration of Helsinki.
Acknowledgments
We thank Mark Cleasby and Michelle Kahmeyer-Gabbe, PhDs, from Liwen Bianji, Edanz Group China, for editing the English text of a draft of this manuscript.
Funding
This study is not supported by a grant.
Disclosure
The authors report no conflicts of interest related to this work.
References
1. Hygum K, Starup-Linde J, Langdahl BL. Diabetes and bone. Osteoporosis Sarcopenia. 2019;5(2):29–37. doi:10.1016/j.afos.2019.05.001
2. Albright F. Osteoporosis. Ann Intern Med. 1947;27:861–882.
3. Vestergaard P. Discrepancies in bone mineral density and fracture risk in patients with type 1 and type 2 diabetes—a meta-analysis. Osteoporos Int. 2007;18(4):427–444. doi:10.1007/s00198-006-0253-4
4. Janghorbani M, Van Dam RM, Willett WC, Hu FB. Systematic review of type 1 and type 2 diabetes mellitus and risk of fracture. Am J Epidemiol. 2007;166(5):495–505. doi:10.1093/aje/kwm106
5. Murray CE, Coleman CM. Impact of diabetes mellitus on bone health. Int J Mol Sci. 2019;20.
6. Napoli N, Chandran M, Pierroz DD, Abrahamsen B, Schwartz AV, Ferrari SL. Mechanisms of diabetes mellitus-induced bone fragility. Nat Rev Endocrinol. 2017;13:208–219.
7. Formiga F, Chivite D, Ruiz D. Clinical evidence of diabetes mellitus end-organ damage as risk factor for falls complicated by hip fracture: A multi-center study of 1225 patients. Diab Res Clin Pract. 2015;109:233–237.
8. Farr JN, Drake MT, Amin S, Melton LJ, McCready LK, Khosla S. In vivo assessment of bone quality in postmenopausal women with type 2 diabetes. J Bone Miner Res. 2014;29:787–795.
9. Bonds DE, Larson JC, Schwartz AV, et al. Risk of fracture in women with type 2 diabetes: the women’s health initiative observational study. J Clin Endocrinol Metab. 2006;91:3404–3410.
10. Roy B. Biomolecular basis of the role of diabetes mellitus in osteoporosis and bone fractures. World J Diabetes. 2013;4(4):101–113. doi:10.4239/wjd.v4.i4.101
11. Paschou SΑ, Dede AD, Anagnostis PG, Vryonidou A, Morganstein D, Goulis DG. Type 2 diabetes and osteoporosis: a guide to optimal management. J Clin Endocrinol Metab. 2017;102(10):3621–3634. doi:10.1210/jc.2017-00042
12. Jackuliak P, Payer J. Osteoporosis, fractures, and diabetes. Int J Endocrinol. 2014;2014:820615. doi:10.1155/2014/820615
13. Saller A, Maggi S, Romanato G, Tonin P, Crepaldi G. Diabetes and osteoporosis. Aging Clin Exp Res. 2008;20(4):280–289. doi:10.1007/BF03324857
14. Shah VN, Carpenter RD, Ferguson VL, Schwartz AV. Bone health in type 1 diabetes. Curr Opin Endocrinol Diab Obes. 2018;25(4):231–236. doi:10.1097/MED.0000000000000421
15. Dhaon P, Shah V. Type 1 diabetes and osteoporosis: A review of literature. Indian J Endocrinol Metab. 2014;18(2):159–165. doi:10.4103/2230-8210.129105
16. Sanches CP, Vianna AGD, Barreto FDC. The impact of type 2 diabetes on bone metabolism. Diabetol Metab Syndr. 2017;9(1):85. doi:10.1186/s13098-017-0278-1
17. Jiang N, Xia W. Assessment of bone quality in patients with diabetes mellitus. Osteoporosis Int. 2018;29(8):1721–1736. doi:10.1007/s00198-018-4532-7
18. Al-Timimi DJ, Ali AF. Serum 25(OH) D in diabetes mellitus type 2: relation to glycaemic control. J Clin Diagn Res. 2013;7(12):2686–2688. doi:10.7860/JCDR/2013/6712.3733
19. Song, Wang, Pittas AG, et al. Blood 25-hydroxy vitamin D levels and incident type 2 diabetes: a meta-analysis of prospective studies. Diab Care. 2013;36(5):1422–1428. doi:10.2337/dc12-0962
 © 2020 The Author(s). This work is published and licensed by Dove Medical Press Limited. The full terms of this license are available at https://www.dovepress.com/terms.php and incorporate the Creative Commons Attribution - Non Commercial (unported, v3.0) License.
By accessing the work you hereby accept the Terms. Non-commercial uses of the work are permitted without any further permission from Dove Medical Press Limited, provided the work is properly attributed. For permission for commercial use of this work, please see paragraphs 4.2 and 5 of our Terms.
© 2020 The Author(s). This work is published and licensed by Dove Medical Press Limited. The full terms of this license are available at https://www.dovepress.com/terms.php and incorporate the Creative Commons Attribution - Non Commercial (unported, v3.0) License.
By accessing the work you hereby accept the Terms. Non-commercial uses of the work are permitted without any further permission from Dove Medical Press Limited, provided the work is properly attributed. For permission for commercial use of this work, please see paragraphs 4.2 and 5 of our Terms.