")
Back to Journals » Nanotechnology, Science and Applications » Volume 13
Effects of Fluorescent Diamond Particles FDP-NV-800nm on Essential Biochemical Functions of Primary Human Umbilical Vein Cells and Human Hepatic Cell Line, HepG-2 in vitro (Part VI): Acute Biocompatibility Studies
Authors Marcinkiewicz C, Lelkes PI , Sternberg M, Feuerstein GZ
Received 26 June 2020
Accepted for publication 3 September 2020
Published 6 October 2020 Volume 2020:13 Pages 103—118
DOI https://doi.org/10.2147/NSA.S268107
Checked for plagiarism Yes
Review by Single anonymous peer review
Peer reviewer comments 2
Editor who approved publication: Professor Israel (Rudi) Rubinstein
Cezary Marcinkiewicz,1,2 Peter I Lelkes,2 Mark Sternberg,1 Giora Z Feuerstein1
1Debina Diagnostics Inc., Newtown Square, PA, USA; 2College of Engineering, Temple University, Philadelphia, PA, USA
Correspondence: Giora Z Feuerstein
Debina Diagnostics Inc., Newtown Square, PA, USA
Email [email protected]
Background: Recently, we reported the safety and biocompatibility of fluorescent diamond particles, FDP-NV-Z-800nm (FDP-NV) injected intravenously into rats, where no morbidity and mortality were noted over a period of 3 months. The acute effects of FDP-NV-800nm particles on cultured human endothelial and hepatic cells remain unexplored.
Purpose: In this study, we aimed to explore select cellular and biochemical functions in cultured human umbilical endothelial cells (HUVEC) and a human hepatic cancer cell line (HepG-2) exposed to FDP-NV-800 in vitro at exposure levels within the pharmacokinetics (Cmax and the nadir) previously reported in vivo.
Methods: Diverse cellular and biochemical functions were monitored, which cumulatively can provide insights into some vital cellular functions. Cell proliferation and migration were assessed by quantitative microscopy. Mitochondrial metabolic functions were tested by the MTT assay, and cytosolic esterase activity was studied by the calcein AM assay. Chaperons (CHOP), BiP and apoptosis (caspase-3 activation) were monitored by using Western blot (WB). MAPK Erk1/2 signaling was assessed by the detection of the phosphorylated form of the protein (P-Erk 1/2) and its translocation into the cell nucleus.
Results: At all concentrations tested (0.001– 0.1mg/mL), FDP-NV did not affect any of the biomarkers of cell integrity of HepG2 cells. In contrast, the proliferation of HUVEC was affected at the highest concentration tested (0.1mg/mL, Cmax). Exposure of HUVEC to (0.01 mg/mL) FDP-NV had a mild-moderate effect on cell proliferation as evident in the MTT assay and was absent when proliferation was assessed by direct cell counting or by using the calcein AM assays. In both cell types, exposure to the highest concentration (0.1 mg/mL) of FDP-NV did neither affect FBS-stimulated cell signaling (MAPK Erk1/2 phosphorylation) nor did it activate of Caspase 3.
Conclusion: Our data suggest that FDP-NV-800nm are largely biocompatible with HepG-2 cells proliferation within the pharmacokinetic data reported previously. In contrast, HUVEC proliferation at the highest exposure dose (0.1 mg/mL) responded adversely with respect to several biomarkers of cell integrity. However, since the Cmax levels are very short-living, the risk for endothelial injury is likely minimal for slow rate cell proliferation such as endothelial cells.
Keywords: near infra-red, HepG-2 cells, HUVEC, cell proliferation, apoptosis, MAPK kinase
Introduction
Nanomedicine is a fast-growing medical discipline featuring intense pre-clinical research and emerging clinical exploratory studies as evident by over 25,000 articles listed in PubMed over the past 10 years. Nanomedicine offers a “third leg” of pharmaceutical technology above and beyond synthetic organic molecules and engineered biologicals. Nanomedicine builds on diverse materials and co-junctional additives that aim to direct biologically active nanoparticles to specific cells, organs, or pathological processes.1–6
Of major contemporary interest are particles engineered to emit a near-infrared (NIR) light signal in response to an electromagnetic stimulus (excitation light) that generates fluorescence either due to innate properties (“Color Centers”) or when coated with organic fluorescent additives.7–9 The ability to emit in the NIR opens the possibility for imaging of bodily structures per se or as an adjunct to state-of-the-art imaging technologies (MRI, magnetic resonance imaging or US, Ultrasound) along with targeted delivery of therapeutic agents.10,11
Of special interest are nanodiamond particles carrying nitrogen-vacancies (FDP-NV−) that enable the particles to become fluorescent upon excitation at 580–620nm, resulting in near infra-red (NIR) emission in the peak range of 720–740 nm.12,13 The NIR light emission of such particles displays exceptional stability with negligible interference by biological elements such as water and oxyhemoglobin.14 Furthermore, the surfaces of these particles can be functionalized with a variety of chemical groups (carboxyls, amines, etc.) that provide opportunities for diverse linkages, from small organic molecules, to polymers, proteins, and nucleic acids.15
We recently described a bioengineered fluorescent diamond particles-NV-Z-800nm (FDP-NV) conjugated with the snake venom disintegrin, bitistatin (Bit), and showed (in vitro and ex vivo) that FDP-NV-800nm/Bit binds specifically to the platelet fibrinogen receptor αIIbβ3 integrin.16 Subsequently, we published in vivo studies demonstrating the binding of FDP-NV-Bit to acutely generated (iatrogenic) blood clots in rat carotid arteries.17 Taken together, FDP-NV-800nm/Bit demonstrated targeted homing in vivo and hence showed the potential to serve as a diagnostic tool for high-risk vascular blood clots.
These initial studies were followed by 3 safety and biocompatibilities studies, where a high dose (60 mg/kg, delivered as a single intravenous bolus) of FDP-NV-800nm blocked with BSA was injected i.v. into intact rats to establish the pharmacokinetic profile and organ distribution as well as to assess a comprehensive panel of hematologic, metabolic and biochemical safety biomarkers.18–20 In these studies, we found that within the 5 days to 12 weeks follow-up periods, FDP-NV primarily distributed to the liver and spleen, and that virtually none were found in the lung, heart, and kidney.18–20 Furthermore, no specific histopathological observations related to the FDP-NV particles’ potential cyto-/histo-toxicity were observed. However, no study so far addressed possible acute safety or toxicological consequences in endothelial or hepatic parenchyma cells exposed to FDP-NV-800nm.
In the present study, we extended our search for possible direct FDP-NV-800nm related toxicological effects using two different cell-types, HUVEC and HepG-2. These cells were chosen since endothelial cells are the first line of exposure to FDP-NV, when infused into the systemic circulation (as per the intended clinical indication), while hepatocytes are the primary repository of circulating FDP-NV.20 HepG-2 cell line is cancer human hepatoma, but it is used as a model for study in vitro of drug metabolism and hepatotoxicity.21 In presented study, we used HepG-2 cell line to investigate the proliferation-related activity of FDP-NV, because primary hepatocytes do not proliferate in vitro. FDP-NV exposure levels were selected according to the acute pharmacokinetic levels observed in vivo, including the maximal blood levels and its nadir at 90 minutes post-exposure.18 Considering that acute biocompatibility studies with FDP-NV-800nm have never been reported in the published literature, the studies presented here provide novel information and insights into the acute biocompatibility of FDP-NV in support of the intended clinical development in humans.
Materials and Methods
Preparation of Nanoparticles
Carboxyl-functionalized FDP-NV-800nm (FDP-NV) was purchased from ADAMAS Nanotechnologies (Raleigh, NC, USA). FDP-NV and disinfected by suspension in 70% ethanol for 15 min at room temperature (RT) followed by centrifugation for 7 min at 2900 x g at RT to isolate the particles. Passive blocking of potential non-specific protein binding sites on the particles was performed by incubation with PBS (phosphate-buffered saline, pH=7.4, ThermoFisher Sci., Waltham, MA, USA), containing 3% BSA (bovine serum albumin, Sigma, St. Louis, MO, USA) at 37°C for 1 hour. FDP-NV were isolated by centrifugation as described above and particles were stored as a stock solution in PBS at 1 mg/mL at 4°C.17
Analysis of Z-Average and ζ-Potential of FDP-NV-800nm in Different Dispersants
Particles blocked with BSA or “naïve” (FDP-NV-COOH, pre-BSA blocking), were suspended in deionized (DI) water, PBS, or culture media according to the various protocols used in the cell experiments (vide infra). HepG-2 (human liver hepatocellular carcinoma) cells were cultured in Eagle’s Minimum Essential Medium (EMEM, ThermoFisher Sci.), supplemented with 10% fetal bovine serum (FBS) (ThermoFisher Sci.) and penicillin/streptomycin (ThermoFisher Sci.), HUVEC were cultured in EGM-2MV media (Lonza, Basel, Switzerland). Particles were suspended in each culture media as dispersant at a density of 0.5 mg/mL and applied into dual-purpose capillary cuvettes (1 mL total volume). Samples were tested in a Zetasizer Ver. 7.11 (Malvern Panalytical Ltd., Malvern, UK).
Cell Counting Assay
Cell counting was performed as previously published, with minor modifications.22 The HepG-2 (human hepatocellular carcinoma) cell line was purchased from American Type Culture Collection (ATTC) (Manassas, VA, USA). Primary HUVEC (human umbilical cord endothelial cells) were purchased from Lonza and used for experiments in their 5–6th passages. Cells were maintained a 37°C in 5% CO2 atmosphere in a humidified incubator in their respective culture media as previously described.20 HepG-2 and HUVEC were “seeded” in 96-well plates (2 x 10³ cells per well in 100 μL medium) and allowed to attach and spread by overnight. Some of the wells were fixed with 4% paraformaldehyde (PFA, ThermoFisher Sci.) and the nuclei were stained using DAPI (4ʹ,6-diamino-2-phenylindole, dihydrochloride, ThermoFisher Sci.). These cells served as a control for time 0. In separate plates,20 cells were treated or not for 24 hrs. with FDP-NV. HUVEC were additionally also treated, or not, for a total of 48 and 72 hrs. Vincristine (50 μg/mL), which blocks cell proliferation by affecting the cell-cycle, was added to all experimental groups as a positive control for suppressing cell proliferation. Just like for time 0, at each timepoint the cells were fixed and stained by DAPI. The plates were analyzed in a fluorescence microscope (Olympus IX81, Olympus, Tokyo, Japan) by imaging 7 observation fields for each well using 100x magnification and DAPI (blue filter) for visualization of the nuclei, and TRITC (red filter) for FNDP-NV visualization. The number of viable cells in each field was determined by analysis of DAPI stained nuclei using ImageJ software (National Institutes of Health, Bethesda, MD, USA) with a digital set-up cell counter. Data are presented as a percentage increase in cell number normalized to time 0.
Cell Metabolic Activity Monitored by MTT Assay
The MTT assay was performed as a standard colorimetric assay,23 using a commercial Cell Proliferation Assay Kit (ThermoFisher Sci.), composed of component A (3-(4,5-dimethylthiazol-2-yl)-2,5-diphenyltetrazolium bromide (MTT)) and component B (SDS (sodium dodecyl sulfate)) according to manufacturer’s protocol. Briefly, HepG-2 cells and HUVEC were seeded in 96-well plates at a density of 1 x 10⁴ cells per well in the media described above for each cell type. Cells were subjected (or not) to FDP-NV-800nm blocked by BSA or vincristine (50 μg/mL) for 24 hours. Media were changed to 100 μL phenol red-free DMEM (Dulbecco’s Modified Eagle Medium) (ThermoFisher Sci.), containing MTT component A. Plates were incubated for 4 hours and cells lysed by adding equal volumes of 10% SDS (kit component B). Plates were incubated overnight and read using an ELISA plate reader (ELx800, BioTek, Winooski, VT, USA) at a wavelength of 562 nm.
Calcein AM Cytosolic Esterase Assay
The Calcein AM assay was performed as previously described.24 In brief, seeding and treatment of HepG-2 cells and HUVEC were performed as described above for the MTT assay. Cells’ culture media was changed after 24 hrs. and replenish with 5 μg/mL calcein AM (ThermoFisher Sci.) in serum-free media for 30 min at 37°C. The plates were inspected for fluorescence by microplate reader (FLx800, BioTek) at 485 nm Excitation and 530 Emission wavelengths.
In vitro “Wound Healing” (WH) Assay
An in vitro “Wound healing” assay (“scratch assay”) was performed as described previously.25 Briefly, HUVEC were seeded in 12-well plates and maintained for 1–2 days until 80–90% confluency Near-confluent HUVEC cells (monolayer) were subjected to a “gentle scrape” across the plate using a plastic spatula tip, resulting in a gap area (devoid of cells) of approx. 1 mm width and treated or not with FDP-NV for another 24 hrs. Cells treated with FDP-NV were stimulated for 24 hrs. to migrate across the gap by replacing the media with fresh media containing 2% FBS. Control cells (non-exposed to FDP-NV) were divided for positive, stimulated by 2% FBS, and negative where migration was minimalized by reducing the FBS concentration to 0.1% FBS (HUVEC are sensitive to complete removal of FBS and detach from the surface in serum-free medium). At the end of the experiment, all the cells were fixed with 4% PFA and stained with DAPI, as described above. The scratches were visualized in a fluorescence microscope (Olympus IX81) at 20x magnification, using DAPI (blue filter) for nuclei visualization and TRITC (red filter) for FNBDP-NV visualization. Control plates included confluent cells subjected to the same scratch immediately before PFA exposure. The migration index was estimated by measurement of the total surface area cell-free region of the images, using ImageJ software.
Cell Signaling Represented by Phosphorylation of MAPK Erk1/2
The level of phosphorylation of MAPK Erk1/2 induced by 2% FBS was tested using Western blot (WB) analysis, as previously described.26 Briefly, HepG-2 cells and HUVEC were cultured in 6 cm diameter Petri dishes to 90% confluency and treated or not with FDP-NV (0.1 mg/mL), as described above. Cells were serum-starved for 24 hours and then stimulated with 2% FBS for 0, 10, and 20 minutes. Cells were lysed in ice-cold RIPA (Radioimmunoprecipitation Assay) buffer (Teknova Inc., Hollister, CA, USA), containing a “cocktail” of protease inhibitors (Sigma Inc.) and the “Halt” phosphatase inhibitor cocktail (ThermoFisher Sci.).
The protein lysate (20 μg) was separated by SDS-PAGE (sodium dodecyl sulfate, polyacrylamide gel electrophoresis) using precast Mini-PROTEAN gradient (4–20%) gels (Bio-Rad Inc., Hercules, CA, USA), and transferred onto PVDF (Polyvinylidene difluoride) membranes (Sigma Inc.) using a semi-dry blotting system (Bio-Rad Inc.). The presence of phospho- and total-Erk1/2 (after membrane “stripping”) was detected using polyclonal antibodies (Cell Signaling Techn., Danvers, MA, USA). Protein bands on the membrane were visualized using a C-DiGit Blot Scanner (LI-COR Biosci., Lincoln, NE, USA). The intensity of the bands was quantified using UN-Scan-It software (Silk Scientific Corp., Orem, UT, USA) for calculation of the ratio of phosphor-Erk1/2 to total-Erk1/2.
Nuclear Translocation of Phospho-Erk1/2
Fractionation of Cell Lysates
HepG-2 cells and HUVEC were grown in 6 cm diameter dishes, treated or not with FDP-NV (0.1 mg/mL), and “starved” under the same conditions as described above for MAPK Erk1/2 cell signaling. Cells were stimulated by exposure to 250 nM TPA (Tetradecanoyl phorbol acetate, Sigma Inc.) for 15 minutes, as previously reported.27 Fractionation of the cells was performed using the Subcellular Protein Fractionation Kit for Cultured Cells (ThermoFisher Sci.) according to the manufacturer protocol. Cytoplasmic and nuclear extracts were analyzed by WB using phospho- and total-MAPK Erk1/2 as described above. The two fractions were validated by WB analysis using an anti-Mek polyclonal antibody and an anti-HDAC1 polyclonal antibody (Cell Signaling Techn.), as respective markers for the cytoplasmic and the nuclear fractions.
Immunocytochemistry for the Detection of Phospho-MAPK Erk1/2 in the Cytoplasm and the Nucleus
Cells were cultured in 8-wells glass chamber slides and immune-stained, as described previously.25 The cells were treated (or not) with 0.1 mg/mL of FDP-NV-800nm blocked by BSA in the presence or absence of TPA (see above). A Polyclonal anti-phospho-Erk1/2 antibody (Cell Sign. Techn.) was used in conjunction with a FITC-tagged goat anti-rabbit IgG (Vector Labs Inc., Burlingame CA, USA) as a secondary antibody. Slides were analyzed in a fluorescence microscope (Olympus IX81) at 400x magnification with an oil objective and using FITC (green filter) to detect phospho-MAPK Erk 1/2 and TRITC (red filter) to detect FNDP-NV.
Cell Apoptosis (Caspase-3) and Endoplasmic Reticulum (ER)-Stress Biomarkers
The presence of activated caspase 3, as well as the expression of the chaperon proteins CHOP and BiP during induction of ER-stress, was detected by WB analysis, as previously described.28 HepG-2 cells and HUVEC were treated or not with 0.1 mg/mL FDP-NV as described above. Treatment with vincristine (200 μg/mL) was used as a positive control for apoptosis, with tunicamycin (25 mg/mL) as a positive control for ER-stress.29 Apoptosis was detected using a rabbit polyclonal antibody against caspase 3 (Cell Sign. Techn.), which recognizes both the cleaved and the non-cleaved protein. A rabbit mAb (clone C50B12) against BiP and a mouse mAb (clone L63F7) against CHOP (both from Cell Sign. Techn.) were used for the detection of ER-stress. Equal loading of proteins was verified by membrane stripping and re-probing with an anti-actin mouse monoclonal antibody (Sigma Inc.).
Data Analysis and Statistics
Unless mentioned otherwise, all experiments were carried out in triplicate with at least 3 independent repeats. Data are presented as mean ± SD, as indicated in the figure legends. Statistical analyses were done by ANOVA (where appropriate) using SigmaPlot software (SigmaPlot® 12 SPSS, Systat Software Inc., San Jose CA, USA). Statistical significance was established at a value of P< 0.05.
Results
Physical Properties of FDP-NV-800nm Suspended in Various Media
The FDP-NV-800 nm particles were suspended in various dispersants known to modify particle diameters (Z-average), and surface ζ-potential. Figure 1A presents the changes in diameters (Z-average) of FDP-NV-COOH (native particles without passive absorption of BSA) or FDP-NV suspended in DI water, PBS (pH = 7.4), or media used in each of the cell cultures. A substantial and statistically significant increase in the Z-average was observed when FDP-NV-COOH were suspended in PBS; The particle size increased from 778 ± 6 nm (DI water suspension) to 1488 ± 164 nm (PBS), 1215 ± 54 nm (HUVEC media), and 1403 ± 61 nm (HepG-2 cell media), respectively. Passive absorption of BSA on the surface of the particles neutralized the increases observed in the respective solutions. The ζ-potential was substantially impacted trending to more positive charges to isoelectric (Figure 1B). The ζ-potential of FDP-NV-800nm-COOH dispersed in DI water was −47.9 ± 1.1 mV, which increased to −21.9 ± 1.3 mV when the particles were immersed in PBS, −9.9 ± 0.4 mV for HUVEC media and −10.9 ± 0.9 mV for HepG-2 cell media, respectively. However, unlike the impact on Z-average, passive coating of FDP-NV with BSA had minimal impact on the ζ-potential of FDP-NV-COOH.
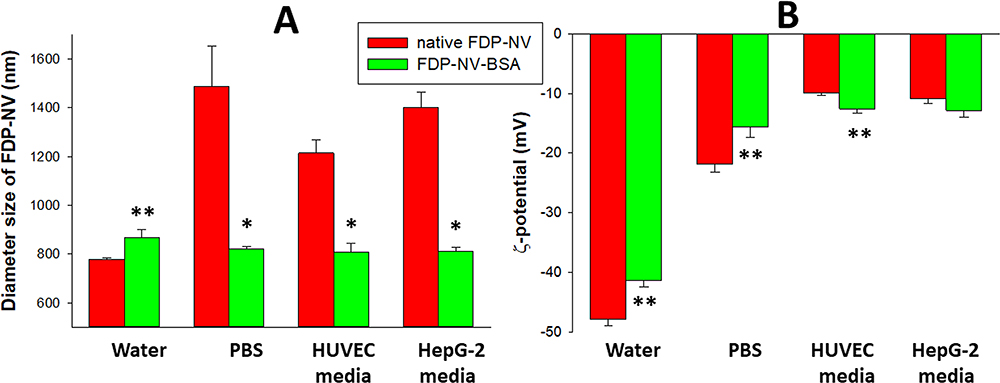 |
Figure 1 Effect of passive adsorption of BSA on aggregation and surface potential of FDP-NV functionalized with carboxyl groups and suspended in water, culture medium and biological buffers, respectively. |
Effect of FDP-NV on HUVEC or HepG-2 Cell Proliferation
Proliferation of HepG-2 cells was not impacted by the presence of FDP-NV (up to 0.1 mg/mL), as inferred from the increase in cell numbers over 24 hours (Figure 2A). In contrast, HUVEC exposed to a high concentration of FDP-NV (0.1 mg/mL FDP-NV) showed a statistically significant reduction in the cell numbers to approximately 65% after 24 hrs. and remained on the same level to 48 hrs. (Figure 3A). Longer incubation of HUVEC with FDP-NV up to 72 hrs. resulted in an increased inhibitory effect to approx. 47%. We did not observe an adverse impact following exposure of HUVEC to a lower concentration (1/10th) of particles for 24 and 48 hrs., although a slight, but statistically significant (P = 0.02) inhibitory effect was observed for 72 hrs. incubation (Figure 3A). As expected, vincristine suppressed proliferation to 17% of control in HepG-2, and for HUVEC reduced the number of viable cells below their number at time zero. We did not perform a 3 days study for HepG-2 cells, because, when cultured over extended periods, these cells tend to grow in multilayered clusters (colonies). Overlapping nuclei may prevent proper cell counting. Representative images of cells treated for 24 hours with 0.1 mg/mL FDP-NV confirmed intracellular particle accumulation and peri-nuclear agglomeration, especially in HUVEC (Figure 3B). Similarly, but less conspicuously, HepG-2 cells also displayed an accumulation of FDP-NV in the cytoplasm and formation of a perinuclear corona (Figure 2B). These observations are in line with similar results of our recent studies in both cell types.20
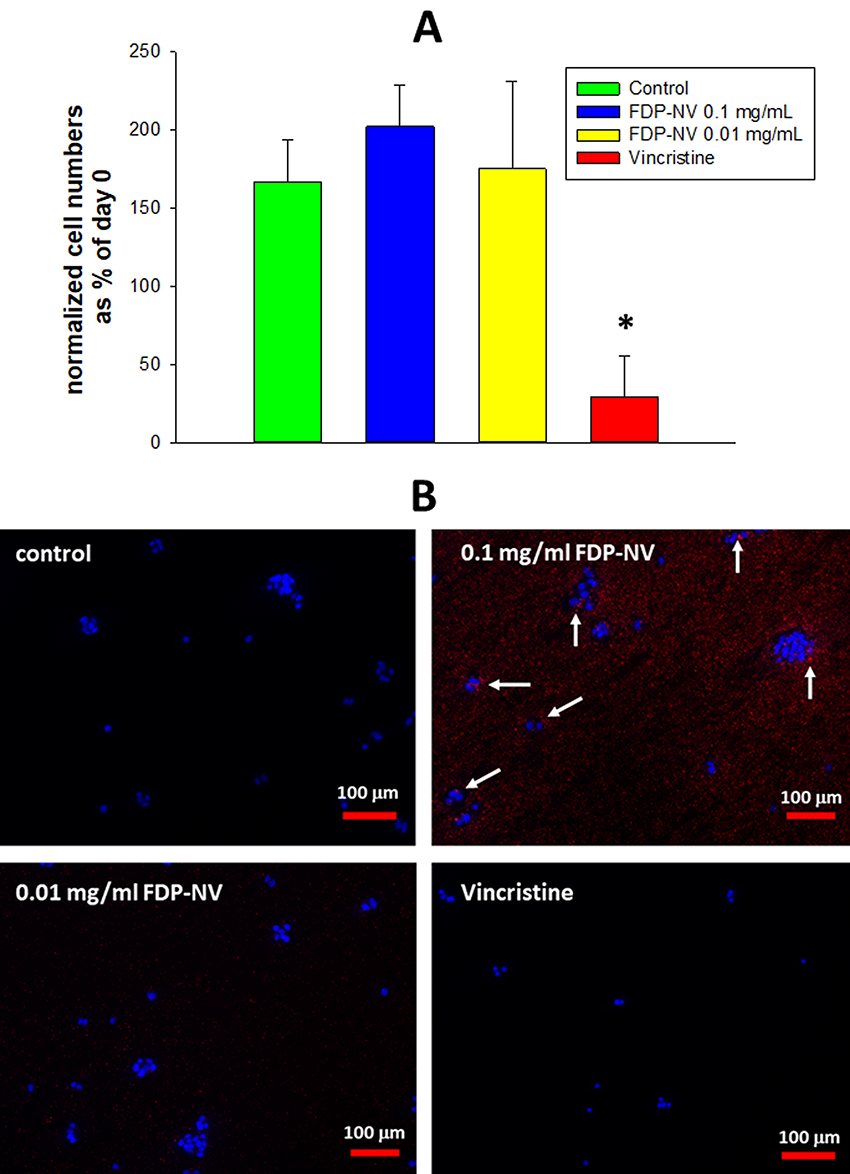 |
Figure 2 Effect of FDP-NV on HepG-2 cell proliferation determined by direct evaluation of cell numbers after 24 hours. |
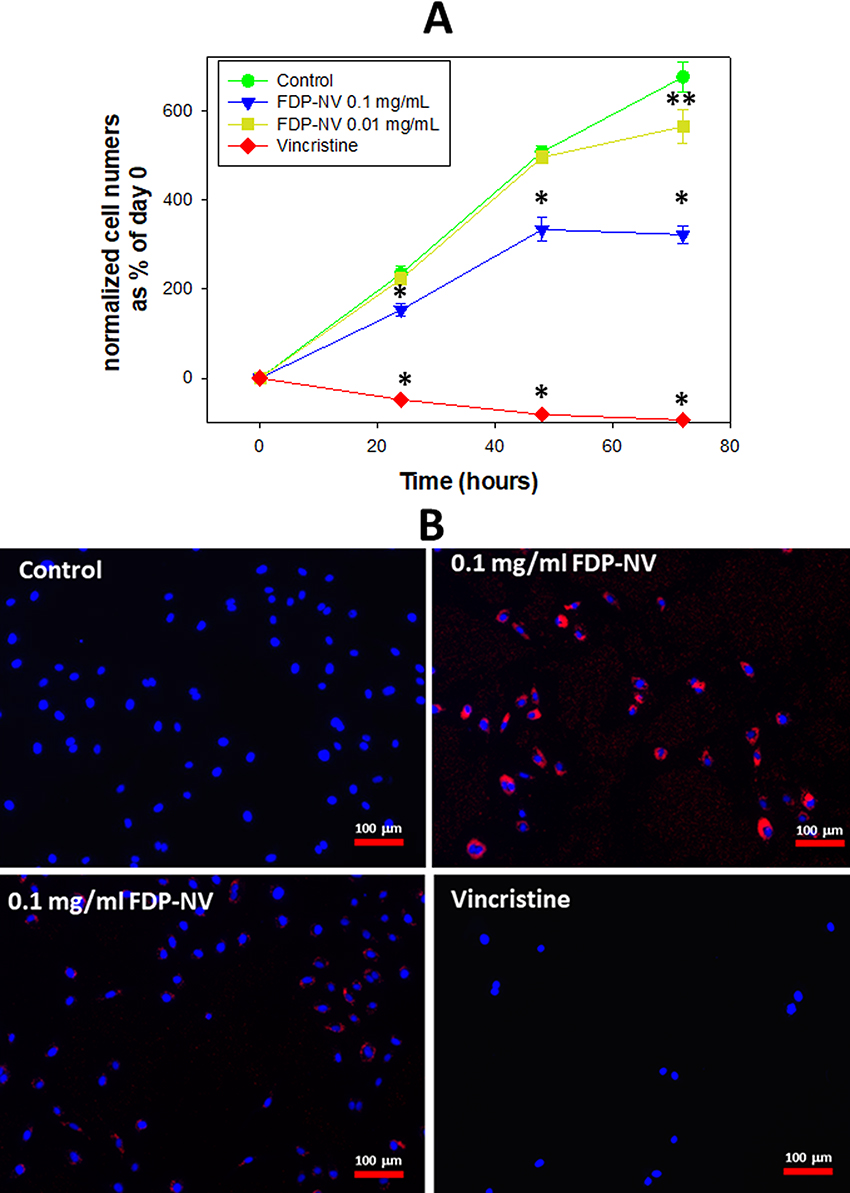 |
Figure 3 Effect of FDP-NV on HUVEC proliferation determined by direct evaluation of cell numbers after 24, 48 and 72 hours. |
Effect of FDP-NV-800nm on Mitochondrial Metabolic Activity of HUVEC and HepG-2 Cells as Measured by MTT Assay
The metabolic activity of NADPH-depended oxidoreductase in cultured HepG-2 cells, as assessed by MTT, was not affected by exposure to FDP-NV at all concentrations tested, including Cmax (0.1 mg/mL, Figure 4A). In contrast, in HUVEC NADPH-dependent oxidoreductase activity was reduced by 30–40% at exposure levels within the Cmax and nadir (0.01 mg/mL) of the pharmacokinetic blood levels reported previously.18 However, at the lowest concentration of FDP-NV tested (0.001 mg/mL), MTT activity as indistinguishable from that of the untreated controls (Figure 4B). Notably, for both cell types, vincristine decreased NADPH-dependent oxidoreductase activity by ~70–75% of the untreated controls.
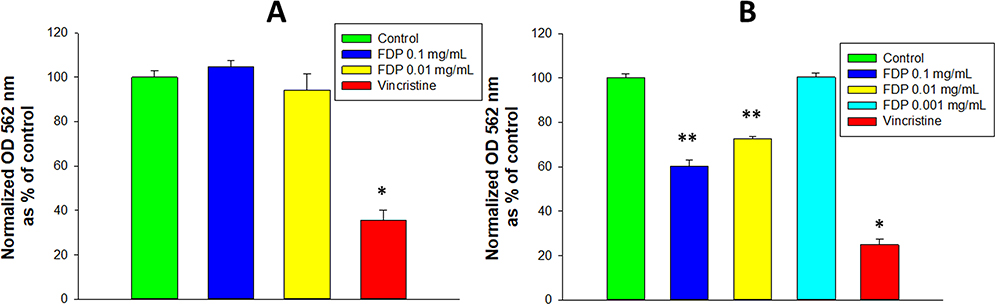 |
Figure 4 Effect of FDP-(NV) on HepG-2 (A) and HUVEC (B) NADPH-dependent oxidoreductase activity tested in the MTT assay. |
Effect of FDP-NV on HUVEC or HepG-2 Cell Cytosolic Esterase Activity
The calcein AM assay yields information on non-specific esterase activities in the cytosol.24 As seen in Figure 5, esterase activity was not affected in HepG-2 (Figure 5A) at all concentrations tested, while in HUVEC (Figure 5B) the fluorescence signal was reduced by ~30% at the highest concentration (0.1 mg/mL) of FDP-NV, with no interference at the level of the nadir (0.01 mg/mL).
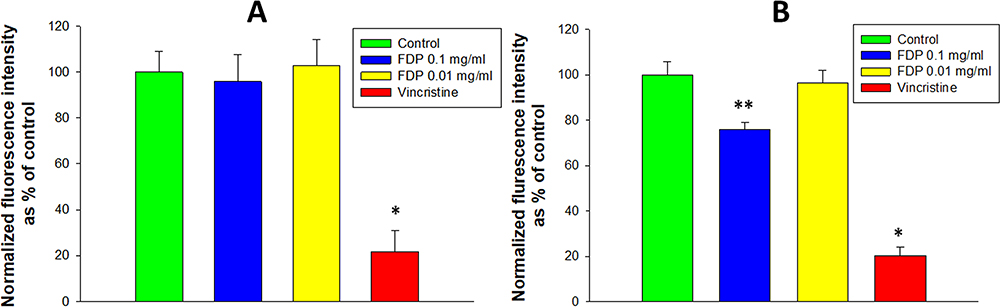 |
Figure 5 Effect of FDP-(NV) on HepG-2 (A) and HUVEC (B) cytoplasmic esterase activity monitored using the calcein AM assay. |
Effect of FDP-NV-800nm on HUVEC Migration Stimulated by FBS in a “Scratch” Injury Model in vitro
The effects of FDP-NV on cell migration were investigated in an in vitro model of “wound healing” (“scratch assay”, Figure 6). This assay was applied only to HUVEC since the pattern of growth of HepG-2 (forming clusters of colonies) was not suitable for this test. Quantification of cell migration across the artificially generated cell-free region (area of scratch) revealed no differences between control, untreated cells and cells exposed to FDP-NV. HUVEC treated with 2% FBS migrated readily, even when exposed to a high concentration of the particles (0.1 mg/mL, Figure 6A). Interestingly, the fluorescence microscopic images revealed a visually similar particle burden of internalized FDP-NV (overlapping blue and red colors) in the active cells (migrating into the “scratch zone”) and in “stationary” cells located outside the scratch zone (Figure 6B).
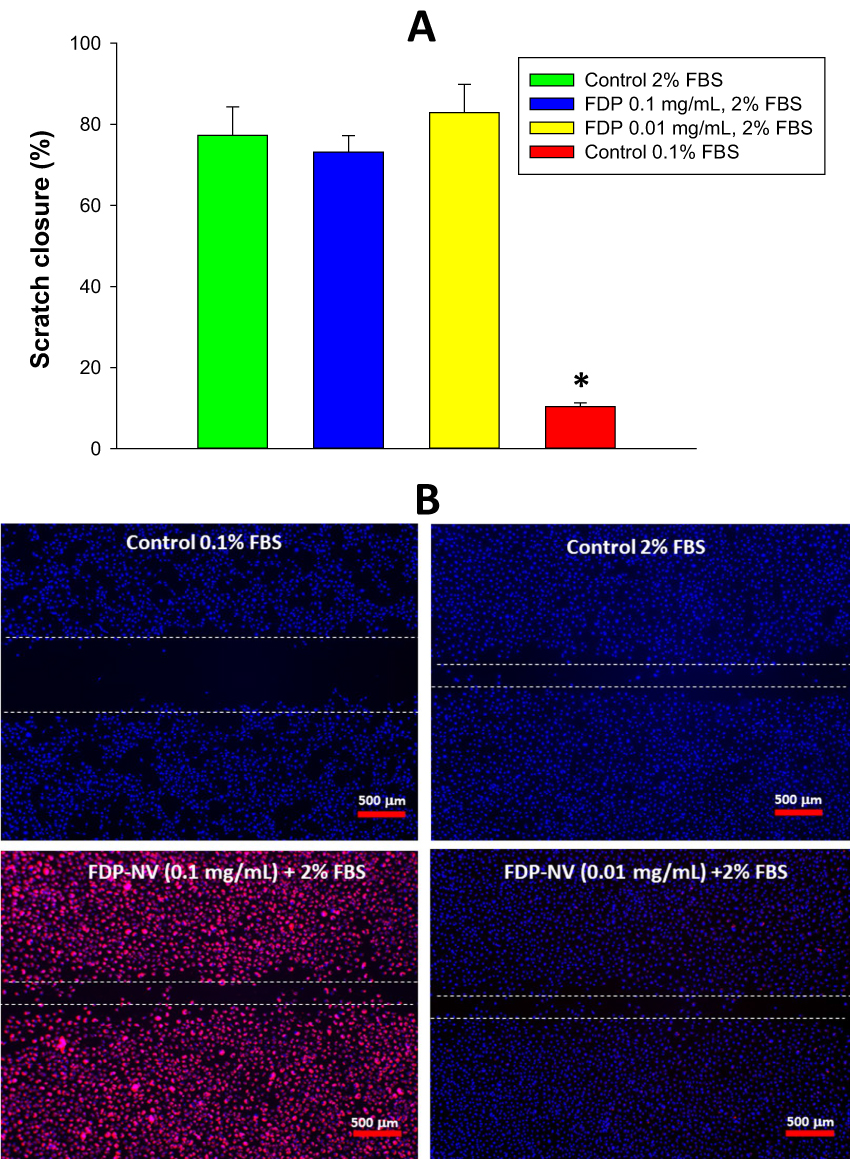 |
Figure 6 Effect of FDP-NV on the migration of HUVEC stimulated by 2% FBS in a scratch assay. |
Effect of FDP-NV-800nm on the Activation of MAPK Erk1/2 in HUVEC and HepG-2 Cells
Figure 7 shows no significant difference in the FBS-induced activation of MAPK Erk1/2 between HUVEC and HepG-2 cells exposed or not to 0.1 mg/μL FDP-NV at two time points (10 and 20 min) post-stimulation. Interestingly, HepG-2 cells reached a plateau of FBS-stimulated Erk 1/2 phosphorylation in 10 min (Figure 7A), whereas in HUVEC phosphorylation of MAPK Erk 1/2 continued to increase over a 20-min period (Figure 7B).
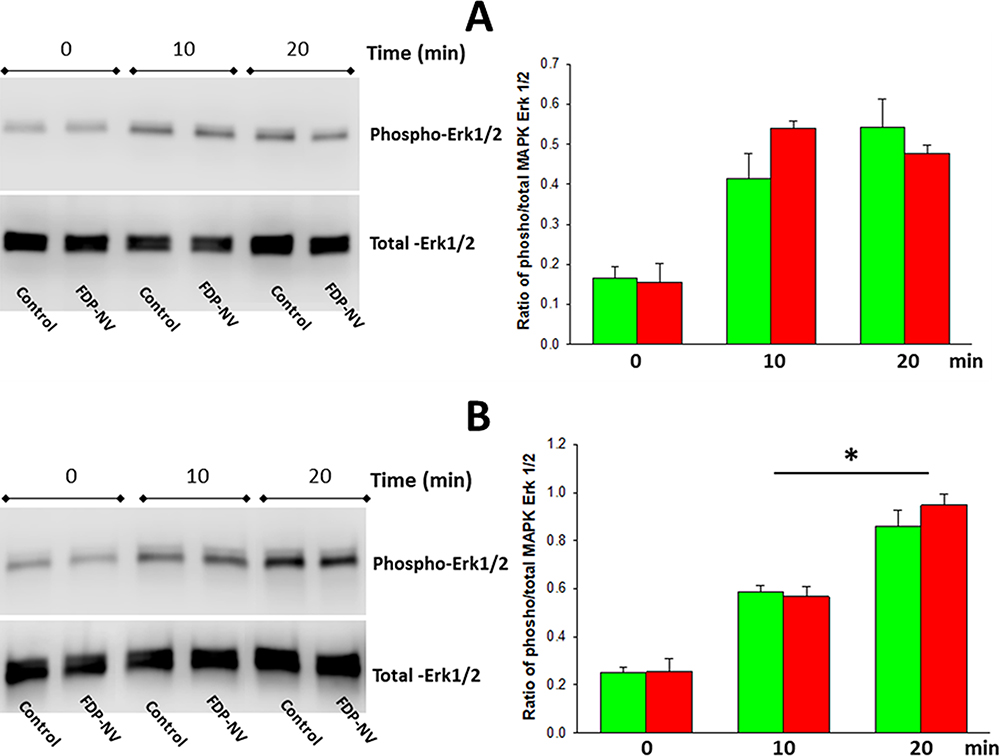 |
Figure 7 Effect of FDP-NV on the phosphorylation of MAPK Erk1/2 induced by FBS. |
Nuclear translocation of cytosolic proteins is one of the fundamental cellular signaling processes that may be affected by the intense peri-nuclear accumulation of FNDP-NV. Therefore, we tested the translocation of phospho-MAPK Erk 1/2 to the nucleus, using a commonly used stimulator of this process, TPA.26 For this, we fractionated the cells and assessed the presence of phospho- and total-MAPK Erk1/2 in the cytoplasmic and nuclear fractions by WB (Figure 8A and B) and by fluorescence microscopy (Figure 8C and D). Neither HepG-2 cells (Figure 7A) nor HUVEC (Figure 8B) showed any difference between FND-NV-exposed and control (no exposure) cells in the amounts of phospho/total MAPK Erk1/2 in their respective nuclei or cytoplasms. Of note, exposure to TPA potentiated the internalization and perinuclear accumulation of FDP-NV, as observed in the fluorescence microscopic images as intensive, yellow color (overlap of red and green in Figure 8C and D).
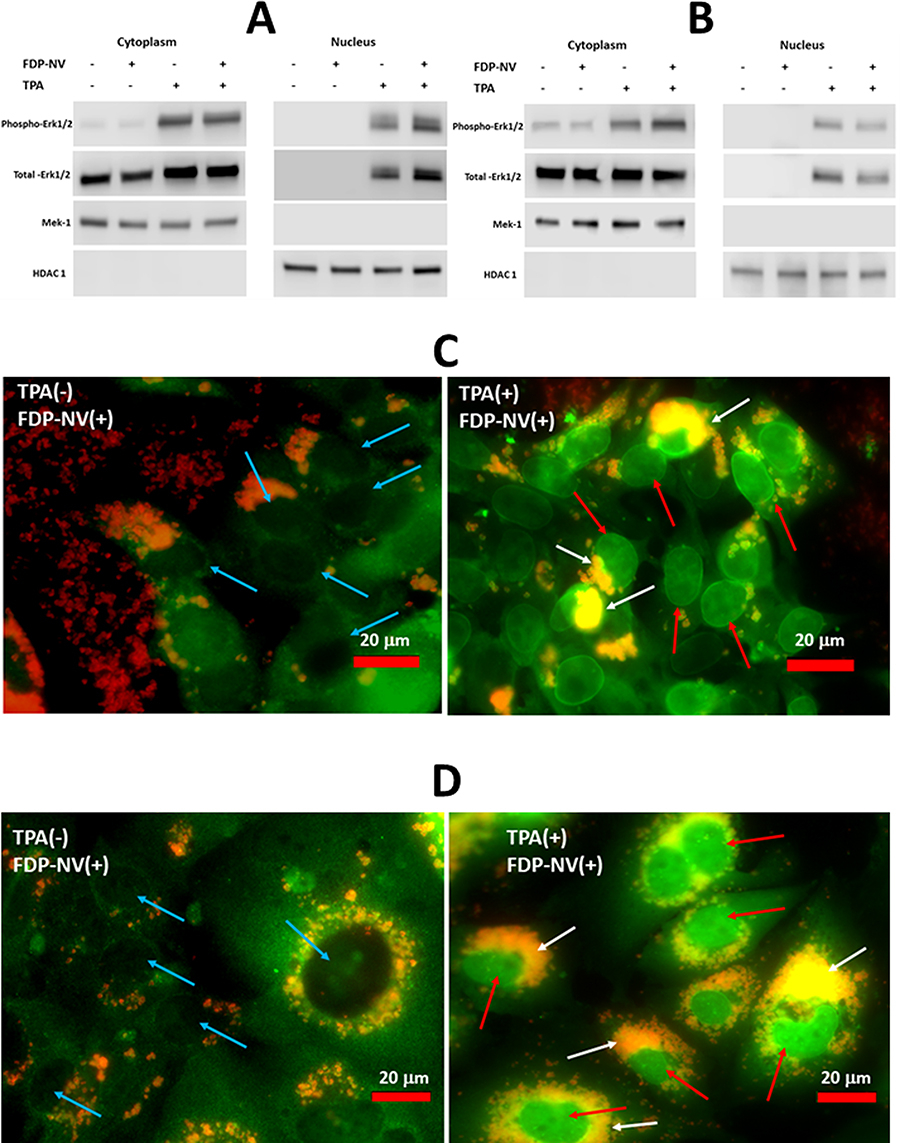 |
Figure 8 Identification of phospho- and total-MAPK Erk1/2 in the cytoplasm and nuclei of HepG-2 cells and HUVEC in the presence and absence of FDP-NV and TPA. |
Effect of FDP-NV-800nm on the Induction of Apoptosis and ER-Stress
Cytoplasmic internalization and perinuclear accumulation of FDP-NV-800nm may also lead to stress conditions as manifested by activation of apoptosis or ER-stress.29 Therefore, we evaluated in both HepG-2 cells and HUVEC biomarkers for stress conditions, such as caspase 3 activation and expression chaperon proteins, CHOP and BiP, using WB (Figure 9). Exposure to FDP-NV (at 0.1 mg/mL) did not result in the activation of caspase 3 in either of the cells, in contrast to the effect of vincristine (positive control, Figure 9A). The expression of two chaperon proteins, CHOP and BiP, was also not impacted by the presence of the FDP-NV. Furthermore, there was no apparent difference between HepG-2 and HUVEC (Figure 9B). Both types of cells were sensitive to tunicamycin, which served as a standard control for ER-stress protein activation.29 Taken together, perinuclear accumulation of FDP-NV appeared to persist without consequences, at least during the experimental time, on key cellular processes, such as nuclear translocation, nor did it elicit detrimental cellular responses, such as induction of apoptosis or ER-stress.
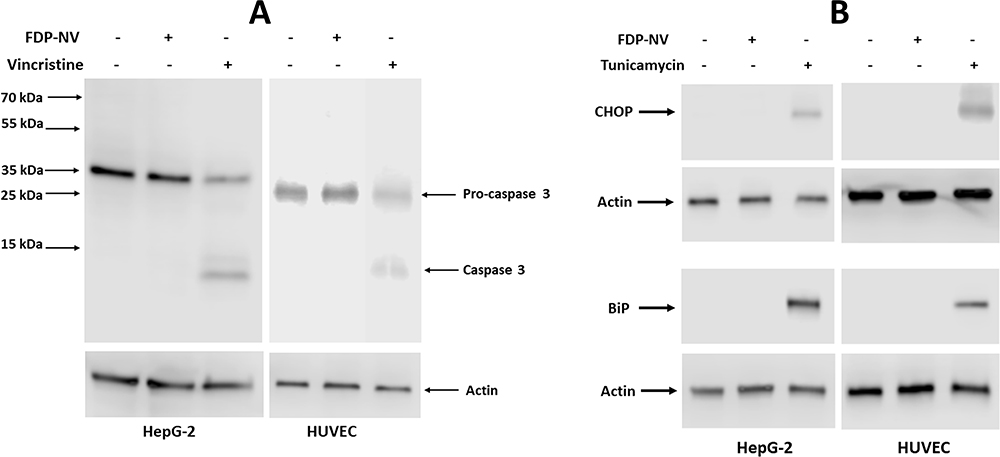 |
Figure 9 Effect of FDP-NV on the induction of apoptosis and ER stress in HepG-2 cells and HUVEC. |
Discussion
The present set of experiments is a continuation of our studies aimed at exploring the safety of FDP-NV (800 nm) and constitute part of the pre-clinical evaluation of these particles, before we commence Good Laboratory Practice (GLP) and Good Manufacturing Practice (GMP) for Phase I clinical studies. In our recent studies on the safety and tolerability of FDP-NV-800nm administered intravenously at a high dose to intact rats, we reported excellent in vivo biocompatibility, as inferred from the lack of morbidity and mortality monitored over 5 days, 14 days or 12 weeks post-exposure. No aberrant hematological and biochemical functions, including blood cells number and differential, or histopathological observations in liver, kidney and lung were detected in all of these studies.18–20 Furthermore, pharmacokinetic studies following acute infusion of a high dose of FDP-NV-800nm, indicated rapid clearance from the systemic circulation18 and fast upload into the liver and spleen. It is important to note that particles deposited in the liver and spleen were retained over the 12-week follow-up.
The present experiments were designed to address potential adverse effects of FDP-NV-800nm in an acute in vitro setting to gain deeper insights into potential biochemical consequences that could not be discerned by evaluating histological and histochemical biomarkers in vivo. Such studies are justified, since to the best of our knowledge no record of public data can be found, investigating the same FDP-NV size (~800nm). Moreover, acute safety biomarkers might not be manifest in the subacute or chronic dosing studies due to compensatory mechanisms following exposure.
Adverse interactions of nanodiamond particles with cellular functions have previously been reported, albeit using different particle sizes, shapes, and adjuvants (for review see ref. 30). These reports stress the importance of probing the effects of FDP-NV-800nm on cellular functions, especially of cells that will be exposed to the maximum blood levels (Cmax) during infusion of the particles and shortly thereafter. Naturally, endothelial cells and circulating blood cells are the prime targets for acute, high-dose exposure, as are cells of the liver, which serve as an instant repository of the FDP-NV-800nm, as recently described.18–20 Indeed, pilot studies with FDP-NV-800nm using HUVEC and HepG-2 cells revealed uptake of particles into each of these cells’ cytoplasm (over 1–2 hrs.) with ultimate peri-nuclear assembly to form “coronation” over 20–24 hours post-exposure. However, cytogenesis and cell division remained (apparently) intact, at least in the acute time frame, suggesting limited if any interferences in nucleus-cytoplasm traffic.20
The present studies extend our recently published observations on the biocompatibility of FDP-NV-800nm by probing the effects of these nanoparticles on additional key cellular functions and biochemical processes, including cell proliferation, migration, signal transduction, ER-stress, and apoptosis that are cardinal for cell integrity. The present studies followed pharmacokinetic data obtained after high-dose (60mg/Kg) infusion in the in vivo (rat) experiments. In the studies described here, cultured cells were exposed to Cmax levels (immediate post-infusion, 0.1mg/mL) or nadir (0.01 mg/mL, 90 minutes post-infusion) over 24 hrs.
We first addressed a well-known issue concerning size changes of FDP-NV-COOH upon suspension in solutions containing electrolytes, proteins and various organic additives.31 Our measurements of the Z-average and ζ-potential of FDP-NV-800nm-COOH in DI water (the native product provided by the manufacturer) revealed close similarity to the manufacturer’s information (778 nm for Z-average) and −48mV for ζ-potential. The marked shifts in Z-average generated by dispersing the particles in PBS or culture media were abrogated in the presence of 3% BSA, yet had only a mild (or negligible) impact on ζ-potential shifts in the various liquids (Figure 1). The possible impact of persistent ζ-potential changes on the experimental outcomes remains to be explored in detail.
The cellular effects of nanodiamond particles (NDP) have been investigated in vitro with a variety of cultured cell types, mainly in terms of cell viability, as reported by the MTT assay.4,32 In general, NDP are well tolerated by most cell types, when incubated in complete culture media. The mitochondria-dependent respiratory chain is not affected by NDP even at extremely high concentrations, 1 mg/mL.4,32 Capping exposure at the Cmax concentration of 0.1 mg/mL, our results suggest no interference in the redox state of the HepG-2 cells (Figure 2), in line with prior reports on other cancer cell lines.33–35 By contrast, a significant inhibitory effect was noted in HUVEC (Figure 3A), in line with previous data using the immortalized HUVEC-ST cell line.36 Direct cell counting and the calcein AM assay also suggested interference of the particles with cytosolic esterase activity in HUVEC at 0.1 mg/mL, although, in contrast to MTT, no effect was observed for lower (nadir) levels of 0.01 mg/mL. These data suggest that primary cells, in contrast to a cell line, may be more sensitive to FDP-NV in terms of vital biochemical processes and overall cell functions.
The pro-proliferative cell signaling pathway MAPK Erk 1/2 was not affected by exposure to FDP-NV at the Cmax dose in either cell type (Figure 7). The extensive peri-nuclear accumulation of particles suggested a potential interference by this “coronation” in the cytosol-nucleus cross trafficking. We tested such a possibility by tracking the translocation of phospho~Erk 1/2 from the cytosol into the nucleus. Figure 8 indicates the presence of phospho-MAPK Erk 1/2 in the nucleus following activation of this signaling pathway by the strong agonist TPA. Likewise, FDP-NV did not activate the central pathway of apoptosis (Caspase-3) in either FDP-NV concentration (Figure 9). Taken together, our data suggest that the physical presence of the FDP-NV appears to subject HUVEC to some stress conditions at the Cmax, but not at the nadir exposure level. However, the ability of HUVEC to fully migrate (Figure 6) even at the highest FDP-NV exposure suggests disparities of functional sensitivity to the intra-cellular particle load.
Our study suggests the resilience of HepG-2 cells across all tests and tested doses as compared to the HUVEC. However, a recent report clearly registers adverse effects of NDP on HepG-2 cell migration at the same exposure levels used in our HUVEC “wound healing” model (“scratch assay”).37 In that study, exposure of HepG-2 cells to 50–100µg/mL FND resulted in 25–50% inhibition of migration, which was further inhibited (90%) at 200 µg/mL over the same time frame (24 hrs.) as in our studies. It is of interest to note that these exposure levels did not interfere with HepG-2 cell proliferation, which is in line with our data (Figure 2). Differences between the two sets of data could represent variances in particle size (100 nm vs 800 nm) and physical properties of non-functionalized NDP (in ref. 38) vs carboxy-functionalized FDP-NV used in our study.
In our in vitro studies, either cell type was exposed to the particles over 24 hrs.; however, our pharmacokinetic data18 indicate that in vivo endothelial cells are exposed to Cmax levels of FDP-NV for no more than 15–30 minutes, as the fast clearance into the liver depletes blood levels to <10µg/mL within 90 min after infusion of the particles. Our previous in vivo studies18–20 indicate that FNDP-NV-800nm enter the cytosol of hepatocytes within 1–2 hrs. post-infusion of particles, which serves for major clearance of particles from the circulation. In the in vitro cell culture studies, particles were exposed for 24 hrs. at a constant concentration as compared to the transient residency time in the circulation, which justifies the minimize exposure and risk to the endothelial cells. Since the HepG-2 line across all conditions tested show resilience to any and all, it lends credibility to our in vivo observation of hepatocytes health following high-dose FDP-NV-800nm infusion to rats over 12 weeks follow up.20
Taken together FDP-NV-800nm had no demonstrable adverse effect when infused into an intact rat,18–20 nor were there any notable toxicological effects in cultured HepG-2 cells line across the 7 different “stress tests” in vitro. We cannot exclude stray consequences related to immune-inflammatory cells or other cells/organs, especially those with a high capacity for phagocytosis or priming effects that could exacerbate underlining pathological conditions. The results obtained in this study indicate that further development of FDP-NV-800nm for in vivo imaging, and as a vehicle for the delivery of drugs and therapeutics is warranted.
Summary
This report expands our knowledge on the biocompatibility of FDP-NV-800nm with respect to endothelial (HUVEC) cells in vitro. Our study is, to our best awareness of publicly available information, distinct in that it probes biocompatibility within the realm of the pharmacokinetics of the particles in vivo (in a rat model). We conclude that HUVEC are more sensitive than HepG-2 cells to FDP-NV-800nm accumulation; this observation has not been described for any negative response at the top exposure level (Cmax). Considering the mild to moderate interferences in certain biochemical functions in HUVEC and in the light of the pharmacokinetics profile of particles in vivo, it is plausible to predict limited aberrant consequences to the endothelium. The resilience of HepG-2 cells to all of the biochemical tests under the top dose of FDP-NV-800nm may support our in vivo data (with the caveat of these cells being abnormal, transformed cells) on normal liver function in spite of the prolonged hepatic retention of the particles. Overall, the results obtained in this paper indicate that further development of FDP-NV-800nm for in vivo imaging, and as a vehicle for the delivery of drugs and therapeutics is clearly warranted.
Disclosure
The authors report no conflict of interest in conducting this work.
References
1. Brachi G, Bussolino F, Ciardelli G, Mattu C. Nanomedicine for imaging and therapy of pancreatic adenocarcinoma. Front Bioeng Biotechnol. 2019;7:307. doi:10.3389/fbioe.2019.00307
2. Yang Y, Wang L, Wan B, Gu Y, Li X. Optically active nanomaterials for bioimaging and targeted therapy. Front Bioeng Biotechnol. 2019;7:320.
3. Gao G, Guo Q, Zhi J. Nanodiamond-based theranostic platform for drug delivery and bioimaging. Small. 2019;15(48):e190223. doi:10.1002/smll.201902238
4. Moore L, Grobarova V, Shen H, et al. Comprehensive interrogation of the cellular response to fluorescent, detonation and functionalized nanodiamonds. Nanoscale. 2014;6(20):11712–11721. doi:10.1039/C4NR02570A
5. Turcheniuk K, Mochalin VN. Biomedical applications of nanodiamond. Nanotechnology. 2017;28(25):252001. doi:10.1088/1361-6528/aa6ae4
6. Perevedentseva E, Lin YC, Jani M, Cheng CL. Biomedical applications of nanodiamonds in imaging and therapy. Nanomedicine (Lond). 2013;8(12):2041–2060. doi:10.2217/nnm.13.183
7. van der Laan KJ, Hasani M, Zheng T, Schirhagl R. Nanodiamonds for in vivo applications. Small. 2018;14(19):e1703838. doi:10.1002/smll.201703838
8. Anselmo AC, Mitragotri S. Nanoparticles in the clinic: an update. Bioeng Transl Med. 2019;4(3):e10143. doi:10.1002/btm2.10143
9. Shenderova OA, Shames AI, Nunn NA, Torelli MD, Vlasov I, Zaitsev A. Synthesis, properties, and applications of fluorescent diamond particles. J Vac Sci Technol B Nanotechnol Microelectron. 2019;37(3):030802. doi:10.1116/1.5089898
10. Shenderova OA, McGuire GE. Science and engineering of nanodiamond particle surfaces for biological applications (Review). Biointerphases. 2015;10(3):030802. doi:10.1116/1.4927679
11. Vaijayanthimala V, Lee DK, Kim SV, et al. Nanodiamond-mediated drug delivery and imaging: challenges and opportunities. Expert Opin Drug Deliv. 2015;12(5):735–749. doi:10.1517/17425247.2015.992412
12. Mochalin VN, Shenderova O, Ho D, Gogotsi Y. The properties and applications of nanodiamonds. Nat Nanotechnol. 2011;7(1):11–23. doi:10.1038/nnano.2011.209
13. Torelli MD, Nunn NA, Shenderova OA. A perspective on fluorescent nanodiamond bioimaging. Small. 2019;15(48):e1902151. doi:10.1002/smll.201902151
14. Quek CH, Leong KW. Near-infrared fluorescent nanoprobes for in vivo optical imaging. Nanomaterials. 2012;2:92–112. doi:10.3390/nano2020092
15. Whitlowa J, Pacellia S, Paul A. Multifunctional nanodiamonds in regenerative medicine: recent advances and future directions. J Control Release. 2017;261:62–86. doi:10.1016/j.jconrel.2017.05.033
16. Marcinkiewicz C, Gerstenhaber JA, Sternberg M, Lelkes PI, Feuerstein G. Bitistatin-functionalized fluorescent nano-diamond particles specifically bind to purified human platelet integrin receptor αIIbβ3 and activated platelets. Int J Nanomedicine. 2017;12:3711–3720. doi:10.2147/IJN.S134128
17. Gerstenhaber JA, Barone FC, Marcinkiewicz C, et al. Vascular thrombus imaging in vivo via near infra-red fluorescent nanodiamond particles bioengineered with the disintegrin bitistatin (Part II). Int J Nanomedicine. 2017;12:8471–8482. doi:10.2147/IJN.S146946
18. Barone FC, Marcinkiewicz CM, Li J, et al. Pilot study on biocompatibility of fluorescent nanodiamond-(NV)-Z-800 particles in rats: safety, pharmacokinetics, and bio-distribution (part III). Int J Nanomedicine. 2018;13:5449–5468. doi:10.2147/IJN.S171117
19. Barone FC, Marcinkiewicz C, Li J, et al. Long-term biocompatibility of fluorescent diamonds-(NV)-Z-800 nm in rats: survival, morbidity, histopathology, particle distribution and excretion studies (Part IV). Int J Nanomedicine. 2019;14:1163–1175. doi:10.2147/IJN.S189048
20. Gerstenhaber JA, Marcinkiewicz C, Barone FC, et al. Biocompatibility studies of fluorescent diamond particles-(NV)-800nm (Part V): in vitro kinetics and in vivo localization in rat liver following long-term exposure. Int J Nanomedicine. 2019;14:6451–6464. doi:10.2147/IJN.S209663
21. Zeilinger K, Freyer N, Damm G, Seehofer D, Knospel F. Cell sources for in vitro human liver cell culture models. Exp Biol Med (Maywood). 2016;241(15):1684–1698. doi:10.1177/1535370216657448
22. Walsh EM, Kim R, Del Valle L, et al. Importance of interaction between nerve growth factor and α9β1 integrin in glial tumor angiogenesis. Neuro Oncol. 2012;14(7):890–901. doi:10.1093/neuonc/nos119
23. Mosmann T. Rapid colorimetric assay for cellular growth and survival: application to proliferation and cytotoxicity assays. J Immunol Methods. 1983;65(1–2):55–63. doi:10.1016/0022-1759(83)90303-4
24. Homolya L, Holló Z, Germann UA, Pastan I, Gottesman MM, Sarkadi B. Fluorescent cellular indicators are extruded by the multidrug resistance protein. J Biol Chem. 1993;268(29):21493–21496.
25. Ventresca EM, Lecht S, Jakubowski P, et al. Association of p75(NTR) and α9β1 integrin modulates NGF-dependent cellular responses. Cell Signal. 2015;27(6):1225–1236. doi:10.1016/j.cellsig.2015.02.029
26. Staniszewska I, Zaveri S, Del Valle L, et al. Interaction of alpha9beta1 integrin with thrombospondin-1 promotes angiogenesis. Circ Res. 2007;100(9):1308–1316. doi:10.1161/01.RES.0000266662.98355.66
27. Plotnikov A, Chuderland D, Karamansha Y, Livnah O, Seger R. Nuclear extracellular signal-regulated kinase 1 and 2 translocation is mediated by casein kinase 2 and accelerated by autophosphorylation. Mol Cell Biol. 2011;31(17):3515–3530. doi:10.1128/MCB.05424-11
28. Brown MC, Staniszwska I, Lazarovici P, Tuszynski GP, Del Valle L, Marcinkiewicz C. Regulatory effect of nerve growth factor in alpha9beta1 integrin-dependent progression of glioblastoma. Neuro Oncol. 2008;10(6):968–980.
29. Marciniak SJ, Yun CY, Oyadomari S, et al. CHOP induces death by promoting protein synthesis and oxidation in the stressed endoplasmic reticulum. Genes Dev. 2004;18(24):3066–3077. doi:10.1101/gad.1250704
30. Chipaux M, Laan KJ, Hemelaar SR, Hasani M, Zheng T, Schirhagl R. Nanodiamonds and their applications in cells. Small. 2018;14(24):1704263. doi:10.1002/smll.201704263
31. Tsai LW, Lin YC, Perevedentseva E, Lugovtsov A, Priezzhev A, Cheng CL. Nanodiamonds for medical applications: interaction with blood in vitro and in vivo. Int J Mol Sci. 2016;17(7):1111. doi:10.3390/ijms17071111
32. Chao JI, Perevedentseva E, Chung PH, et al. Nanometer-sized diamond particle as a probe for biolabeling. Biophys J. 2007;93(6):2199–2208. doi:10.1529/biophysj.107.108134
33. Schrand AM, Huang H, Carlson C, et al. Are diamond nanoparticles cytotoxic? J Phys Chem B. 2007;111(1):2–7. doi:10.1021/jp066387v
34. Zakrzewska KE, Samluk A, Wierzbicki M, et al. Analysis of the cytotoxicity of carbon-based nanoparticles, diamond and graphite, in human glioblastoma and hepatoma cell lines. PLoS One. 2015;10(3):e0122579. doi:10.1371/journal.pone.0122579
35. Liu KK, Cheng CL, Chang CC, Chao JI. Biocompatible and detectable carboxylated nanodiamond on human cell. Nanotechnology. 2007;18(32):325102. doi:10.1088/0957-4484/18/32/325102
36. Solarska-Ściuk K, Gajewska A, Skolimowski J, Gajek A, Bartosz G. Cellular redox homeostasis in endothelial cells treated with nonmodified and fenton-modified nanodiamond powders. Biotechnol Appl Biochem. 2014;61(5):593–602. doi:10.1002/bab.1208
37. Chen X, Wang H, Li D, Yu Y, Zhi J. The effect of carboxylated nanodiamond (cNDs) on the migration of HepG2 cells. Phys Status Solidi A. 2016;213(8):2131–2137. doi:10.1002/pssa.201600094
38. Thomas V, Halloran BA, Ambalavanan N, Catledge SA, Vohra YK. In vitro studies on the effect of particle size on macrophage responses to nanodiamond wear debris. Acta Biomater. 2012;8(5):1939–1947. doi:10.1016/j.actbio.2012.01.033
 © 2020 The Author(s). This work is published and licensed by Dove Medical Press Limited. The full terms of this license are available at https://www.dovepress.com/terms.php and incorporate the Creative Commons Attribution - Non Commercial (unported, v3.0) License.
By accessing the work you hereby accept the Terms. Non-commercial uses of the work are permitted without any further permission from Dove Medical Press Limited, provided the work is properly attributed. For permission for commercial use of this work, please see paragraphs 4.2 and 5 of our Terms.
© 2020 The Author(s). This work is published and licensed by Dove Medical Press Limited. The full terms of this license are available at https://www.dovepress.com/terms.php and incorporate the Creative Commons Attribution - Non Commercial (unported, v3.0) License.
By accessing the work you hereby accept the Terms. Non-commercial uses of the work are permitted without any further permission from Dove Medical Press Limited, provided the work is properly attributed. For permission for commercial use of this work, please see paragraphs 4.2 and 5 of our Terms.