")
Back to Journals » Drug Design, Development and Therapy » Volume 15
Effects of Dezocine and Sufentanil on Th1/Th2 Balance in Breast Cancer Patients Undergoing Surgery
Authors Hu X, Luo B, Wu Q, Chen Q, Lu P, Huang J, Liang X, Ling C, Li Y
Received 28 June 2021
Accepted for publication 14 October 2021
Published 2 December 2021 Volume 2021:15 Pages 4925—4938
DOI https://doi.org/10.2147/DDDT.S326891
Checked for plagiarism Yes
Review by Single anonymous peer review
Peer reviewer comments 3
Editor who approved publication: Dr Georgios Panos
Xudong Hu,1,* Bing Luo,2,* Qing Wu,2 Qingbiao Chen,2 Penghui Lu,2 Jie Huang,3 Xiaoxia Liang,1 Cheng Ling,1 Yiqun Li2
1Department of Anesthesiology, The Second People’s Hospital of Foshan, Foshan, Guangdong, 528000, People’s Republic of China; 2Department of Surgery, The Second People’s Hospital of Foshan, Foshan, Guangdong, 528000, People’s Republic of China; 3Clinical Laboratory, The Second People’s Hospital of Foshan, Foshan, Guangdong, 528000, People’s Republic of China
*These authors contributed equally to this work
Correspondence: Yiqun Li
Department of Surgery, The Second People’s Hospital of Foshan, No. 78 Weiguo Road, Foshan, Guangdong, 528000, People’s Republic of China
Tel +86 13902845621
Fax +86 75788032008
Email [email protected]
Background: It is very important for breast cancer patients undergoing surgery to choose an opioid that has little effect on the immune system. The aim of this study is to compare the effects of dezocine or sufentanil on postoperative pain and Th1/Th2 balance in patients undergoing breast cancer surgery.
Methods: Data from 92 breast cancer patients from January 2019 to July 2020 at Foshan Second People’s Hospital (Guangdong, China) were analyzed. Sufentanil (SF) was used in group SF (n = 44) and dezocine (DE) in group DE (n = 48). The Visual Analog Scale (VAS) scores were assessed, and the percentages of Th1 cells and Th2 cells in peripheral blood were detected before anesthesia and at 2, 12, 24, and 48 hours after surgery.
Results: There was no significant difference in the VAS scores between the two groups at 2, 24, and 48 hours after surgery (P > 0.05). The VAS scores at 12 hours after surgery in group DE were significantly lower than those in group SF with a statistically significant difference (P < 0.05). The percentage of Th1 cells in group DE at 2, 12, 24, and 48 hours after surgery was significantly lower than that in group SF (P < 0.05). The percentage of Th2 cells in group DE at 2, 12, 24, and 48 hours after surgery was significantly lower than that in group SF (P < 0.05). The Th1/Th2 ratio at 2, 12, 24, and 48 hours after surgery was significantly higher in group DE than that in group SF (P < 0.05).
Conclusion: Dezocine for anesthesia induction and postoperative analgesia can maintain the balance of Th1/Th2 more stable than, with the same analgesia efficacy as, sufentanil during the early postoperative period in breast cancer patients undergoing surgery.
Keywords: dezocine, sufentanil, VAS, Th1/Th2 balance, breast cancer
Introduction
Breast cancer is the most common malignant tumor in women, and its global morbidity has recently increased at a rate of over 2 million per year.1,2 Surgery is the main treatment for breast cancer, but postoperative recurrence and metastasis are still the leading causes of death in breast cancer patients, though neoadjuvant therapy improves the tumor-free survival and overall survival in patients with breast cancer.2,3 The immunity of cancer patients, especially cellular immunity, plays a vital role in the body’s antitumor defense mechanisms.4–6 The stress response caused by surgery and postoperative pain may induce the release of certain hormones and cytokines that are mediated by the sympathetic nervous system and the hypothalamic–pituitary–adrenal axis.4–6 which may cause immunosuppression in which the Th1/Th2 balance shifts toward the Th2 phenotype.7,8 Furthermore, nociceptive stimuli such as pain are also involved in immune regulation through the signaling pathways in the central nervous system. Therefore, opioids should be used perioperatively in anesthesia and analgesia to reduce the stress response and alleviate pain, and, especially for cancer patients, to maintain normal immunity.4–7 But the well-known side effects of opioids, suppression of the immune system has been increasingly reported, and the concern that their immunological effects during and after surgery may impact disease processes, especially cancer, has increased proportionally.4,5
T helper cell (Th cell) is the key regulator of host in anti-tumour immunity and its specialized subsets are generated following activation through lineage-specifying cytokines and transcriptional programs, such as T-bet and GATA38,9 in which differentiation of Th1 cells is promoted by the cytokine IL-12, while IL-4 drives Th2 cell differentiation. These cytokines influence each other, in which the balance of Th1/Th2 was maintained stable and the body immunity is in normal.6,7 Th1 cells and Th2 cells were first resigned by Mosmann in 1986,9 and other Th cells such as T regulatory cells (Treg), Th17 cells, T follicular helper (Tfh cells), Th9 cells and Th22 cell, with fewer expression, were described one after another after 30 years.10,11 However, the expression of Th1 cells and Th2 cells and the balance of Th1/Th2 play a very important role in antitumor immunity and are usually used as an indicator for the immunity status of cancer patients.7,8 Optimally, the Th1/Th2 balance would be Th1 predominant in the case of cancer. Th1 cells have been shown to have strong anticancer properties by increasing the activity of NK cells and CD8+ cells. In comparison, Th2 cells inhibit immune function and avoid autoimmune diseases caused by excessive immune function12. The balance of Th1/Th2 and must be maintained stable and predominantly shifted to Th1 and is an important indicator of cellular immune function in patients with breast cancer.9,13,14 Moreover, the perioperative changes of Th1 cells and T2 cells are associated with the size of tumors, pathological parameters, clinical stages and tumor-free survival outcomes,14 and the deviation of Th1/Th2 balance to Th2 style was positively related to the metastasis and recurrence and the prognosis of breast cancer patients.9,14–16 Study also found that an increase in the Th1/Th2 ratio could suppress the growth and proliferation of breast cancer in rats and in mice.18,19
Opioids such as morphine, fentanyl, sufentanil and dezocine were usually used for anesthesia induction and postoperative analgesia in clinical practice.16,17,20 However, clinical studies on opioids usually involve with one opioid such as fentanyl or sufentanil for anesthesia induction and other opioids such as morphine or dezocine for postoperative analgesia16,17,20.
Morphine can inhibit Th cells from differentiating into Th1 cells, resulting in the reduction of the ratio of Th1/Th2 through NF-κB, PI3K/AKT, T-bet and GATA3 and up-regulating IL-2 and IFN-γ expression and down-regulating IL-4 and IL-5 expression.21–24 Though Messmer et al found that morphine enhanced the T cell activation and increased IL-12 secretion, indicating positive effects on immune function.25 Most studies available on the immunological properties of opioids refer to morphine. Although morphine remains a standard opioid for analgesia in clinical practice and for study on the immune function, other semisynthetic and synthetic opioids such as sufentanil and dezocine are frequently used in the anesthesia and postoperative analgesia in cancer patients undergoing surgery. Although most data are derived from preclinical studies, it is emerging that different opioids have different effects on the body immune function.4
Sufentanil, a selective μ opioid-receptor agonist, can rapidly spread to various tissues and penetrate the blood–brain barrier to reach an effective concentration to be of analgesic intensity, long duration, low toxicity, and wide safety range, as well as side effects similar to other opioids, including immune-suppression.26 It was also found that, with the same analgesic effect, sufentanil had a stronger effect than fentanyl on the increase of Treg cells in vitro.27 Moreover, sufentanil may decrease the CD4+/CD8+ ratio and increase the frequency of Treg cells.28,29 Treg cells in the breast cancer were positively associated with disease progression, and the CD8+/Treg ratio was associated with lymph node metastasis and tumor staging.31 Treg cells are considered immuno-suppressive cells, similar to Th2 cells.31 Also, studies found that patients with breast cancer had the proportion of CD4+ and CD8+T cells in the sentinel lymph node reversed, meaning metastasis of breast cancer and significantly associated with both relapse-free survival and overall survival.30,31
Dezocine is widely used in perioperative anesthesia and postoperative analgesia in China due to its effective analgesic efficacy and fewer adverse events.16,17 Dezocine is a partial μ receptor agonist and partial κ receptor agonist, which can inhibit the uptake of serotonin and epinephrine, similar to tramadol, and may have a similar protective effect on immunity.32,33 Studies have found that dezocine can up-regulate the level of IL-12 and down-regulate the level of IL-10 in human umbilical cord blood dendritic cells,34 improve the proliferation and cytotoxicity of CD8+ cells, promote the maturation of BMDC, and inhibit tumor metastasis in rats.35,36
Wang et al found that the postoperative analgesic effect for breast cancer patients is slightly better with sufentanil than with dezocine. However, dezocine can reduce the inhibition of NK cell and CD4+ cell activity and maintain the balance of CD4+/CD8+, which is more conducive to the recovery of immune function.20 However, the effects of dezocine and sufentanil on Th cell differentiation remain unknown at present. This study aims to investigate the effects of dezocine and sufentanil on the Th1/Th2 balance in patients undergoing breast cancer surgery and provide a clinical basis for the selection of opioids with little negative impact on the immunity in breast cancer patients undergoing surgery.
Materials and Methods
Study Subjects
Data from 92 patients with breast cancer at the Second People’s Hospital of Foshan (Guangdong, China) from January 2019 to July 2020 were analyzed. Ethical approval was provided by the Ethics Committee of the hospital on November 1, 2018 (Approval document No: 2018-1105). Prior to the collection of the data, written informed consent was obtained from all participants. Patients with American Society of Anesthesiologist (ASA) status I to III, aged from 25 to 85 years, and scheduled for selective surgery were eligible.37 Exclusion criteria were refusal to participate in the study; allergy to the drugs used in the study; a history of autoimmune, endocrine, or metabolic disease; administration of opioids, steroids, or immunosuppressants; or cognitive impairment (unable to understand the VAS pain scale). All patients were treated with patient-controlled intravenous analgesia (PCIA). Modified radical mastectomy (MRM) or breast-conserving surgery (BCS) or simple mastectomy (SM) was performed on all patients with an axillary lymph node dissection or a sentinel lymph node biopsy, if necessary. Forty-four cases were treated with sufentanil as group SF and 48 cases were treated with dezocine as group DE. The general data of the two groups had no statistical differences (P > 0.05) and were comparable.
Anesthesia Method
All patients fasted for 6–8 hours before surgery. Noninvasive blood pressure (NBP), electrocardiogram (ECG), heart rate (HR), pulse blood oxygen saturation (SPO2), and Bispectral Index (BIS) were monitored with a vital sign monitor (PHILIPS MX50, Philips China Medical Devices Co. Ltd., China). An indwelling venous catheter was inserted into the elbow vein to establish venous access, and sodium lactate solution was infused at a rate of 6–8 mL/kg/min. Before the induction of anesthesia, sufentanil 0.4 μg/kg (Yichang Humanwell Pharmaceutical Co. Ltd., China) and dezocine 0.2 mg/kg (Jiangsu Yangzijiang Pharmaceutical Co. Ltd., China) was injected intravenously into group SF and group DE, respectively. The anesthesia was then induced with propofol TCI set at 4 μg/mL of the plasma concentration. Muscle relaxation was facilitated by the administration of cisatracurium. The anesthesia was maintained with an inhalation concentration of 2–3% sevoflurane in 70% oxygen with a fresh gas flow of 2 mL/min and balanced with propofol TCI set at a plasma concentration of 1.5–2 ug/mL. The BIS was kept between 40 and 60 by adjusting both the inhalation concentration of sevoflurane and the plasma concentration of propofol. An additional bolus of 5–10 μg of sufentanil in group SF or 2.5–5.0 mg of dezocine in group DE was administered if significant tachycardia (above 20% from baseline) or hypertension (above 20% from baseline) occurred that was judged to be caused by a lack of analgesia. Mechanical ventilation was targeted to maintain an end-tidal PCO2 at 35–45 mmHg during surgery. The patients were transferred to the post-anesthesia care unit (PACU) after the surgery was completed. Muscle relaxation was antagonized with neostigmine and atropine before the tracheal catheter was pulled out. Patients were observed in PACU and transferred back to the ward when the Edward score matched the discharge criterion.
Postoperative Analgesia
Patients in both groups received PCIA for 48 hours after surgery. A disposable, mechanical analgesia pump was used (Zhuhai Fornia Medical Equipment Co. Ltd., China). The pump was filled with dezocine 0.8 mg/kg or sufentanil 1.5 μg/kg diluted in 100 mL of normal saline for group DE and group SF, respectively. Dezocine 5 mg in group DE or sufentanil 10 μg in group SF was administered intravenously for pre-charge of the analgesia and citrate tropisetron 2 mg was administered intravenously for the prevention of postoperative nausea and vomiting (PONV), 30 min before the operation concluded. The analgesia pump parameters were set to a background infusion of 2 mL/h, a PCIA dose of 1 mL, and a locking time of 15 min.
It was found that using different opioids in combination may have uncertain agonist/antagonist effects on the opioid receptor, resulting in uncertain pharmacological effects including analgesia, unwanted adverse effects and immune regulation.38–40 Therefore the results of such studies are not reflective of the pharmacological effects of a certain opioids in an accurate manner. A clinical study in which only one opioids involved in both anesthesia induction and postoperative analgesia should be made for a precise understanding of the pharmacodynamics of opioids.
We selected dezocine or sufentanil, as an opiate for anesthesia and analgesia options for breast cancer patients, respectively, with the regimen and the dosage used according to the references or guidelines and the Chinese expert consensus.41,42
Th1 Cells and Th2 Cells Measurement
A 2 mL peripheral blood sample was collected from the elbow vein before surgery and 2, 12, 24, and 48 hours after surgery in an anticoagulant tube containing sodium heparin.
A 100 μll blood sample and 1 μL of mixed stimulants (ION/PMA/MON) (Hangzhou Lianke Biotech Co. Ltd., China) were mixed in a flow tube containing RPMI 1640 culture fluid (Gibco Biotechnology Co. Ltd., USA) 100 μL. The instructions were strictly followed when adding the dosage of all reagents. The flow tube with the specimen was placed in an incubator (Heraeus Scientific Co. Ltd., China) containing 5% CO2 for 4 to 6 hours after blending, then the serum was taken out. Anti-CD3 antibody (PERCP Mouse Anti-Human CD3, 340456, BD Biotechnology Co. Ltd., USA) 20 ul and anti-CD8 antibody (APC Mouse Anti-Human CD8, 347344, BD Biotechnology Co. Ltd., USA) 5μL were added to the flow tube and incubated for 15 min at room temperature in the dark. Lysing solution (BD Biotechnology Co. Ltd., USA) 2 mL diluted to 1× was added to the tube, which was similarly incubated for 10–15 min. PBS 2 mL was added to the flow tube, which was centrifuged at 1500 rpm for 5 min. Next, permeabilization wash buffer (BioLegend, Biotechnology Co. Ltd., USA) 2 mL diluted to 1× was added to the tube, which was incubated in the dark at room temperature for 25 min. The flow tube was centrifuged at 1500 rpm for 5 min after PBS 2 mL was added. Next, anti-IFN-γ/IL-4 antibody (FAST IMMUNE Anti-IFN-γ FITC/IL-4 PE, 340584, BD Biotechnology Co. Ltd., USA) 20 ul was added to the flow tube, which was incubated in the dark at room temperature for 20 min. The flow tube was centrifuged again at 1500 rpm for 5 min after another addition of PBS 2 mL, and the culture supernatant was discarded. At the end, PBS 400 ul was added to the flow tube, which was set to the flow cytometry (BD FACSCantoTM, USA) (SN: V33896001912) for Th cell detection. In this study, CD3 and CD8 gates were used to detect the CD3+CD8− cells represented as CD3+CD4+ cells, and the expression level of Th1/Th2 cells was analyzed according to the positive expression rates of IFN-γ and IL-4 in CD3+CD8− cells. Th1 cells were identified by CD3+CD8−IFN-γ+ and Th2 cells were identified by CD3+CD8−IL-4+ (Figure 1). FACSDiva version 6.1.3 was used for the cell detection analysis.
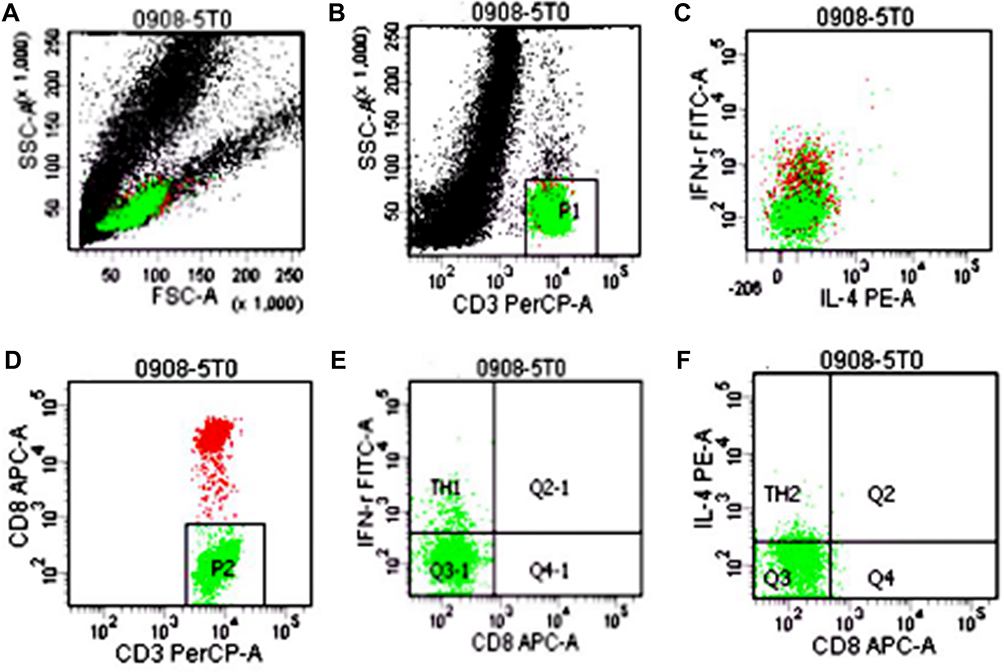 |
Figure 1 Detection chart of flow cytometry. (A) is the lymphocyte portal and P0 is the lymphocytes in the whole blood sample; (B) is the T cell portal and P1 is the CD3+ T cells; (C) is the CD3+ T cell portal and P is the mixture of the CD3+ T cells and the CD8− T cells; (D) is the mixture of the CD3+ T cells and the CD8− T cells portal and P2 is the CD3+ CD8− T cells (T helper cells); (E) is the further analysis of the P2 portal and TH1 in the left upper quarter is the Th1 cells; (F) is the further analysis of the P2 portal and TH2 in the left upper quarter is the Th2 cells. Notes: In the figure, the black scattered points are lymphocytes; Green ones are CD4 + T cells; Red ones are CD8 + T cells. |
Observation Index
General data: The ASA status, patient’s age and body mass index (BMI), intravenous infusion volume and blood loss volume during surgery, the operation time, PCIA bolus times, clinicopathological stage of breast cancer, and surgical procedure were analyzed.
VAS scores: The VAS scores were assessed by a fixed anesthesiologist without prior knowledge of the patients’ grouping at 2, 12, 24, and 48 hours after surgery. The VAS scores ranged from 0 to 10, and the higher the score the higher the patient’s pain index. The VAS is the most widely used tool for estimating both severity of pain and to judge the extent of pain relief. Healthcare workers ask the patient to select a point on a line drawn between the two ends to express how intense he/she perceives pain. In our study, VAS is a continuous scale comprised of a horizontal line, with 100 mm long, anchored by two verbal descriptors (ie, “no pain” and “worst imaginable pain”. Patients are asked to rate “current” pain intensity or pain intensity “in the last 24 hour”. The VAS is an easy-to-use instrument that does not warrant using a sophisticated device. It is also highly sensitive in detecting treatment effects, and its results can be analysed by parametric tests.43 So, the VAS score was used in our study.
Th1 cells, Th2 cells, and Th1/Th2 ratio: The percentages of Th1 cells and Th2 cells in peripheral blood were detected before anesthesia and at 2, 12, 24, and 48 hours after surgery by flow cytometry in all patients. The Th1/Th2 ratio was calculated with the percentages of Th1 cells and Th2 cells, ie, Th1% divided by Th2%.
Statistical Analysis
SPSS 23 (IBM SPSS, Armonk, NY, USA) was used for the data analysis. Test of normality using the Quantile-Quantile (Q-Q) plot on the continuous data was done. The normally distributed continuous data were described as mean ± standard deviation ( ) and tested using the t-test. Two-way ANOVA was used to compare VAS scores at different time points between groups. LSD test was used for the post-hoc analysis followed by the two-way ANOVA. Enumerated data were expressed as a percentage and differences between the two groups were analyzed by the Chi-square test. The grade data were analyzed using the Wilcoxon test. P < 0.05 was considered statistically significant.
Results
General Data
There was no statistical difference between the two groups in the general data of age, BMI, intra-operative intravenous infusion volume, intra-operative blood loss volume, operation time, PCIA bolus times, ASA status, clinicopathological stage of breast cancer, and surgical procedure (P=0.766, 0.313, 0.864, 0.152, 0.891, 0.168, 0.434, 0.224, 0.355, P > 0.05), as shown in Table 1.
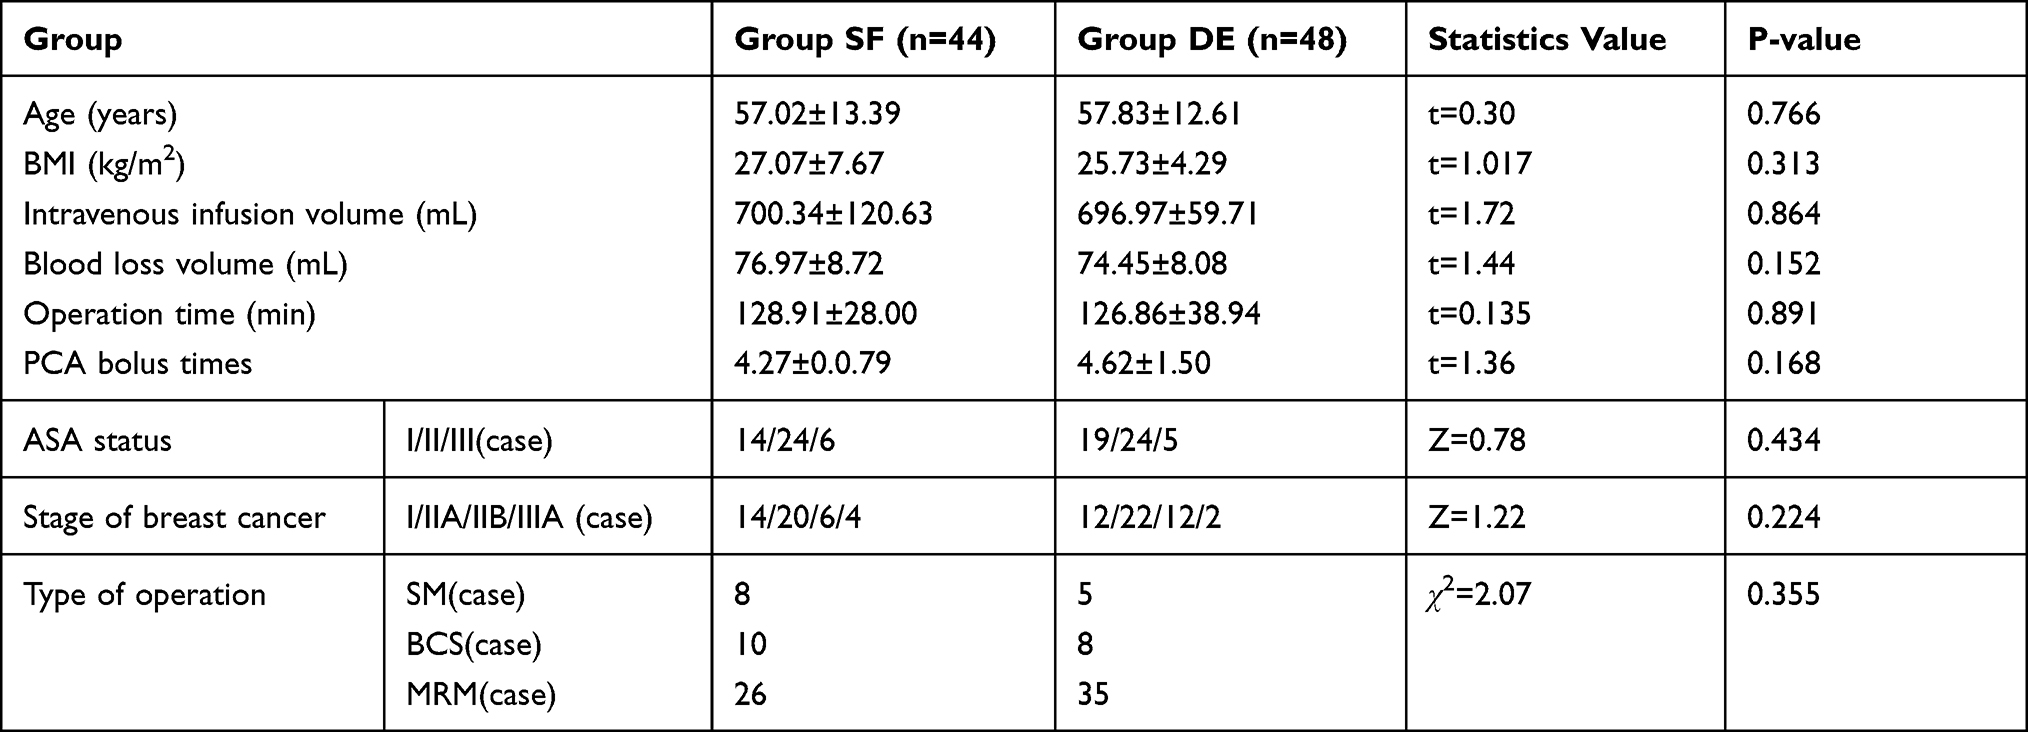 |
Table 1 Comparison of General Conditions of Patients in the Two Groups (x ± S) |
VAS Scores
Tables 2–4 show comparison of postoperative VAS scores in the two groups (Table 2), between time-points in Group SF (Table 3) and between time-points in Group DE (Table 4), and the indications are p-value and t value in the column comparing between the readings in the two groups in individual; F value and p-value in the column comparing between the readings of the two groups in the whole (Table 2); F value and p-value in the row comparing between the readings of the different time-points in the whole in each group; p-value in the column comparing between the readings of the different time-points of each other in each group (Table 3, Table 4).
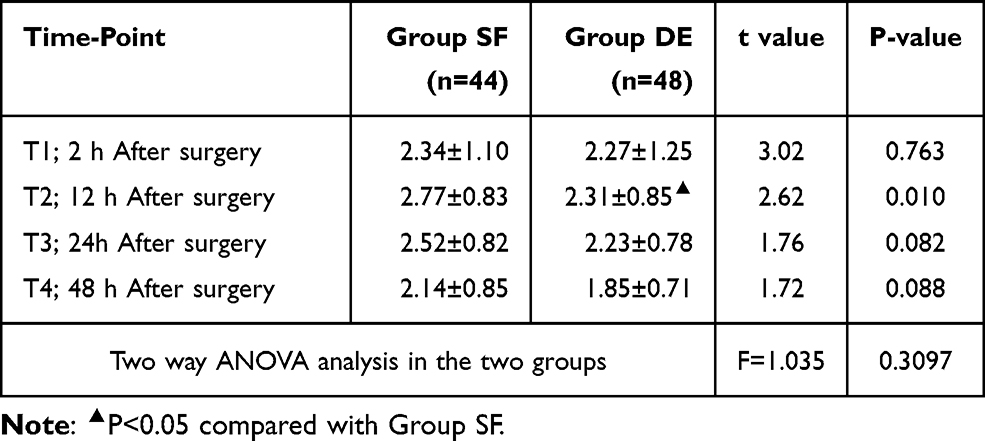 |
Table 2 Comparison of Postoperative VAS Scores in the Two Groups |
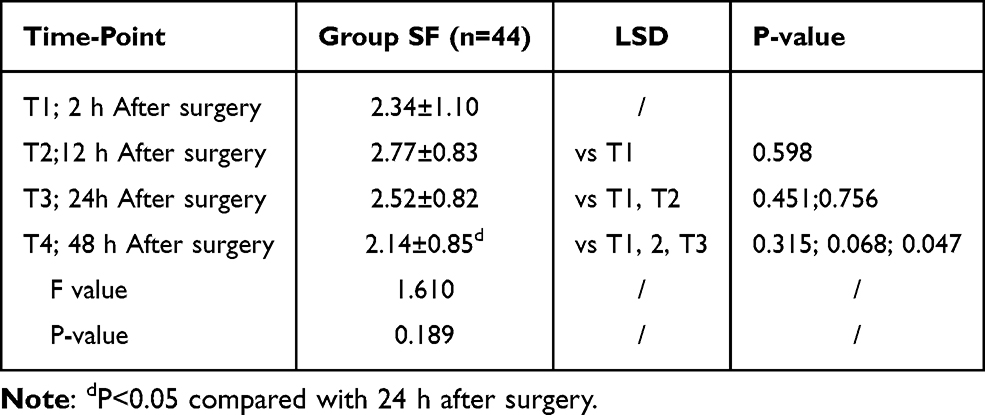 |
Table 3 Comparison of Postoperative VAS Scores Between Time-Points in Group SF |
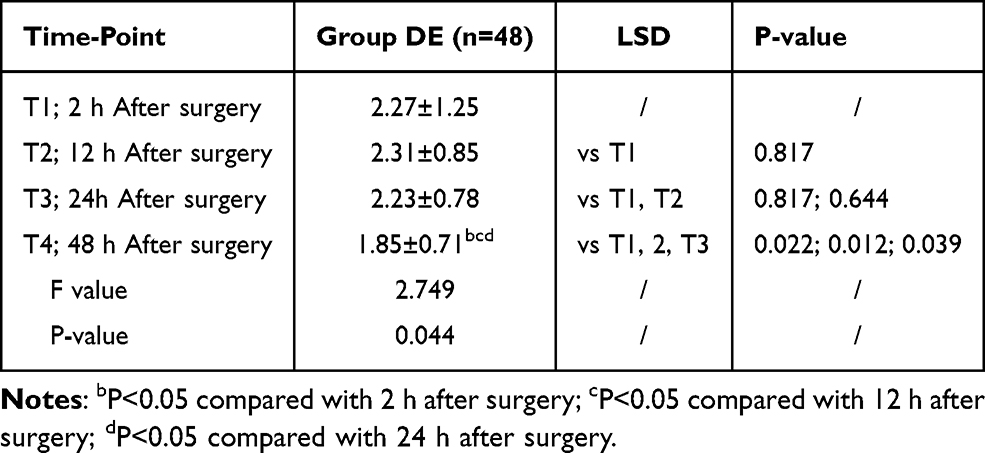 |
Table 4 Comparison of Postoperative VAS Scores Between Time-Point in Group DE |
There was no significant difference in the VAS score between the two groups at 2, 24, and 48 hours after surgery (P = 0.763, 0.082, 0.088, P > 0.05). The VAS scores at 12 hours after surgery in group DE were significantly lower than that in group SF, with a significantly statistical difference (t = 2.62, P = 0.010, P < 0.05). But when the Two-way ANONA analysis is used between the two groups, F = 1.035, P = 0.3097, P > 0.05. It is suggested that the VAS score during the analgesia period in Group DE and Group SF has no significantly statistical difference. The results indicate that dezocine has the same analgesic efficacy as sufentanil, as shown in Table 2, Figure 2.
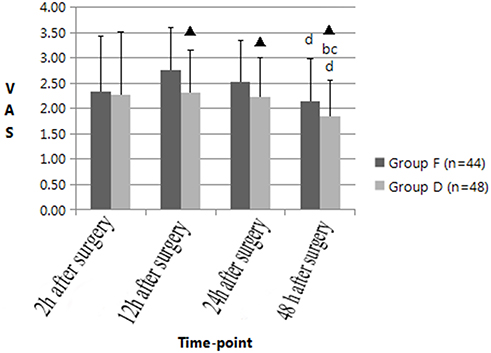 |
Figure 2 Comparison of VAS scores at 2, 12, and 24 hours after surgery between the two groups. bP<0.05 compared with 2 h after surgery; cP<0.05 compared with 12 h after surgery; dP<0.05 compared with 24 h after surgery. ▲P<0.05 compared with Group SF. |
There was no significant difference in the VAS scores at 2, 12, and 24 hours after surgery in group SF (P = 0.598, 0.451, 0.756, P > 0.05), and the VAS score at 48 hours after surgery was significantly lower than those at 12 hours after surgery (P = 0.047, P < 0.05). Table 3, Figure 2.
There was no significant difference in the VAS scores at 2, 12, and 24 hours after surgery in group DE (P = 0.817, 0.817, 0.644, P > 0.05), and the VAS score at 48 hours after surgery was significantly lower than those at 2, 12, and 24 hours after surgery (P = 0.022, 0.012, 0.039, P < 0.05). Table 4, Figure 2.
Th1 Cell Percentage Changes
Research has shown that detecting the expression of internal factors (FN-γ/IL-4) in Th cells (CD4+ cells) by flow cytometry accurately reflects the Th1 and Th2 cell levels. The CD3 and CD4 gate was used for the detection of Th cells (CD4+ cells), and Th1 and Th2 cells were determined by CD4+/IFN-γ+ and CD4+/IL-4+, respectively.44,45 But during detection, the CD4+ molecule endocytosis occurs after PMA/Ionomycin stimulation, and then few CD4+ molecules can be detected. So, the CD3+/CD8− reverse gate can be used for Th cell (CD4+ cells) detection because CD3+ cells consist mainly of CD4+ and CD8+ cells. This method suggested by Yang et al was used in our study.46,47
Tables 5–7 show comparison of Th1% in the two groups (Table 5), between time-points in Group SF (Table 6) and between time-points in Group DE (Table 7), and the indications are p-value and t value in the column comparing between the readings in the two groups in individual; p-value and t value in the column comparing between the readings in the two groups in individual (Table 5); F value and p-value in the row comparing between the readings of the different time-points in the whole in each group; p-value in the column comparing between the readings of the different time-points of each other in each group (Table 6, Table 7).
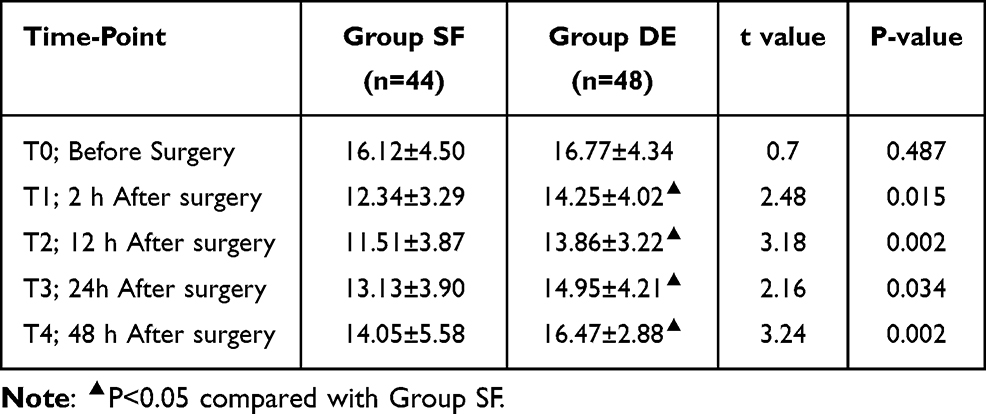 |
Table 5 Comparison of Th1% in the Two Groups |
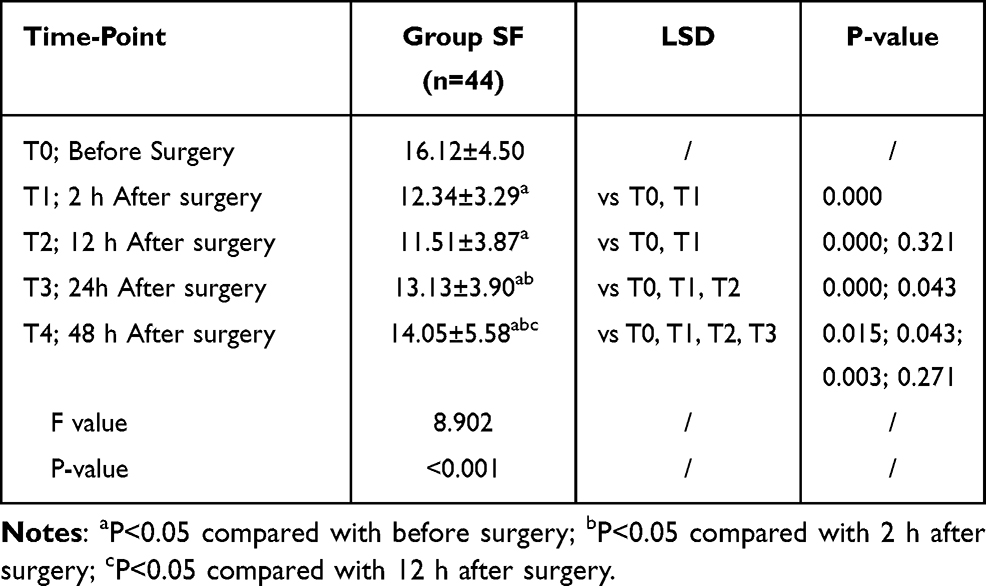 |
Table 6 Comparison of Th1% Between Time-Points in Group SF |
 |
Table 7 Comparison of Th1% Between Time-Points in Group DE |
There was no significant difference in the percentage of Th1 cells between the two groups before surgery (P = 0.487, P > 0.05), but the percentage of Th1 cells at 2, 12, 24, and 48 hours after surgery in group DE was significantly higher than those in group SF, with statistically significant differences (P = 0.015, 0.002, 0.034, 0.002, P < 0.05), as shown in Table 5, Figure 3 (0.000; 0.321, 0.000; 0.043, 0.015; 0.271).
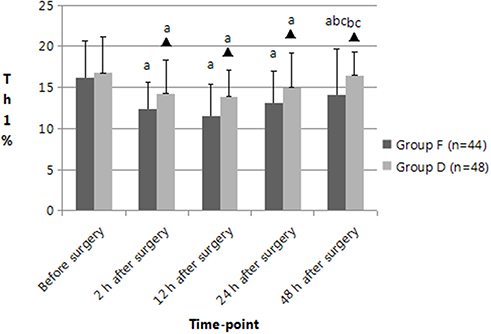 |
Figure 3 Comparison of the percentage of Th1 cells before and after surgery between the two groups. aP<0.05 compared with before surgery, bP<0.05 compared with 2 h after surgery; cP<0.05 compared with 12 h after surgery. ▲P<0.05 compared with Group SF. |
The percentage of Th1 cells at 2, 12, and 24 hours after surgery in group SF was significantly lower than that before surgery, with statistically significant differences (P = 0.000, 0.000, 0.000, P < 0.05). The percentage of Th1 cells at 24 hours after surgery was significantly higher than that at 2 hours after surgery, with a statistically significant difference (P = 0.043, P < 0.05). The percentage of Th1 cells at 48 hours after surgery was significantly higher than those at 2 and 12 hours after surgery, with statistically significant differences (P = 0.043; 0.003, P < 0.05). There was no significant difference in the percentage of Th1 cells before surgery and 48 hours after surgery (P = 0.015, P > 0.05). These results indicate that the percentage of Th1 cells at 48 hours after surgery had not returned to the preoperative levels in group SF (14.05±5.58, vs 16.12±4.50), as shown in Table 6, Figure 3.
The percentage of Th1 cells at 2, 12, 24, and 48 hours after surgery in group DE was significantly lower than that before surgery, with statistically significant differences (P = 0.001, 0.000, 0.020, P < 0.05).
There was no significant difference in the percentage of Th1 cells between 2, 12, and 24 hours after surgery (P = 0.607, 0.365, 0.165, P > 0.05). The percentage of Th1 cells at 48 hours after surgery was significantly higher than that at 2, 12 hours after surgery, with statistically significant differences (P = 0.005, 0.001, P < 0.05). There was no significant difference in the percentage of Th1 cells between before surgery and 48 hours after surgery (16.47±2.88 vs 16.77±4.34, P = 0.697 > 0.05). These results indicate that the percentage of Th1 cells at 48 hours after surgery had returned to the preoperative levels in group DE, as shown in Table 7, Figure 3.
Th2 Cell Percentage Changes
Tables 8–10 show comparison of Th2% in the two groups (Table 8), between time-points in Group SF (Table 9) between time-points in Group DE (Table 10) and the indications are p-value and t value in the column comparing between the readings in the two groups of individuals (Table 8); F value and p-value in the row comparing between the readings of the different time-points in the whole of each group; p-value in the column comparing between the readings of the different time-points of each other in each group (Table 9, Table 10).
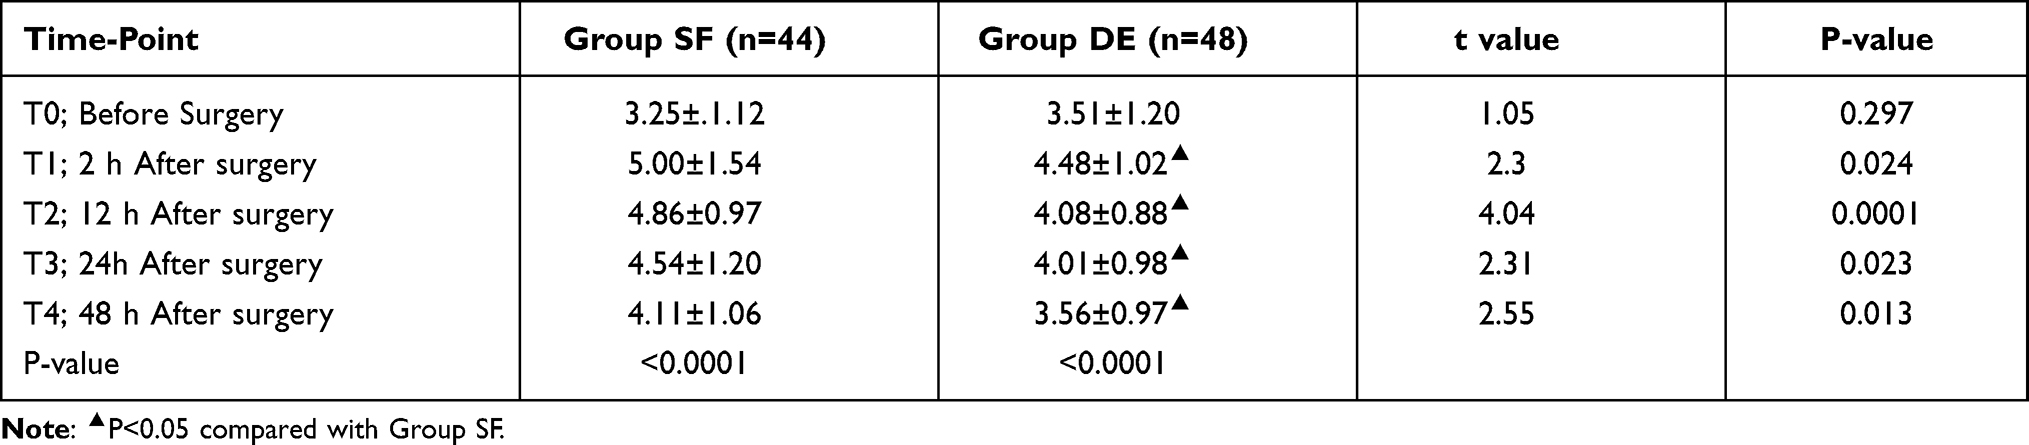 |
Table 8 Comparison of Th2% in the Two Groups |
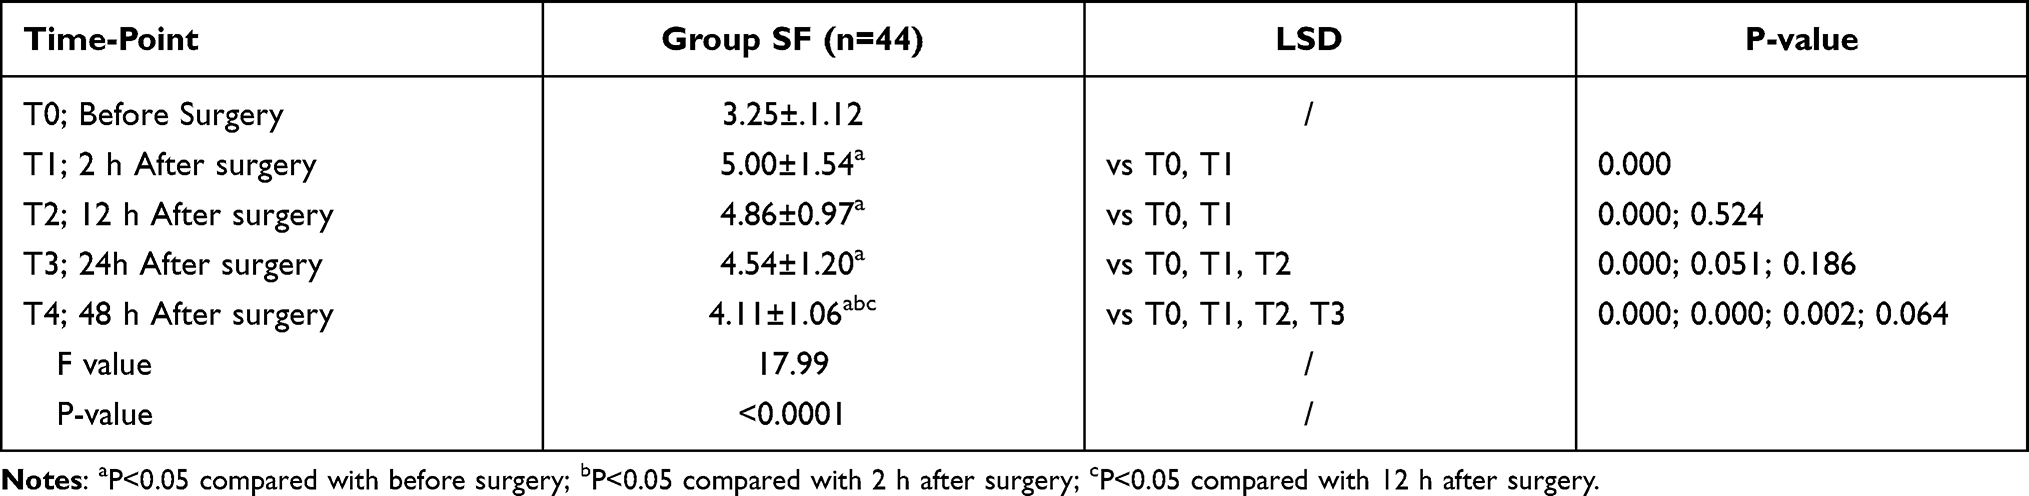 |
Table 9 Comparison of Th2% Between Time-Points in Group SF |
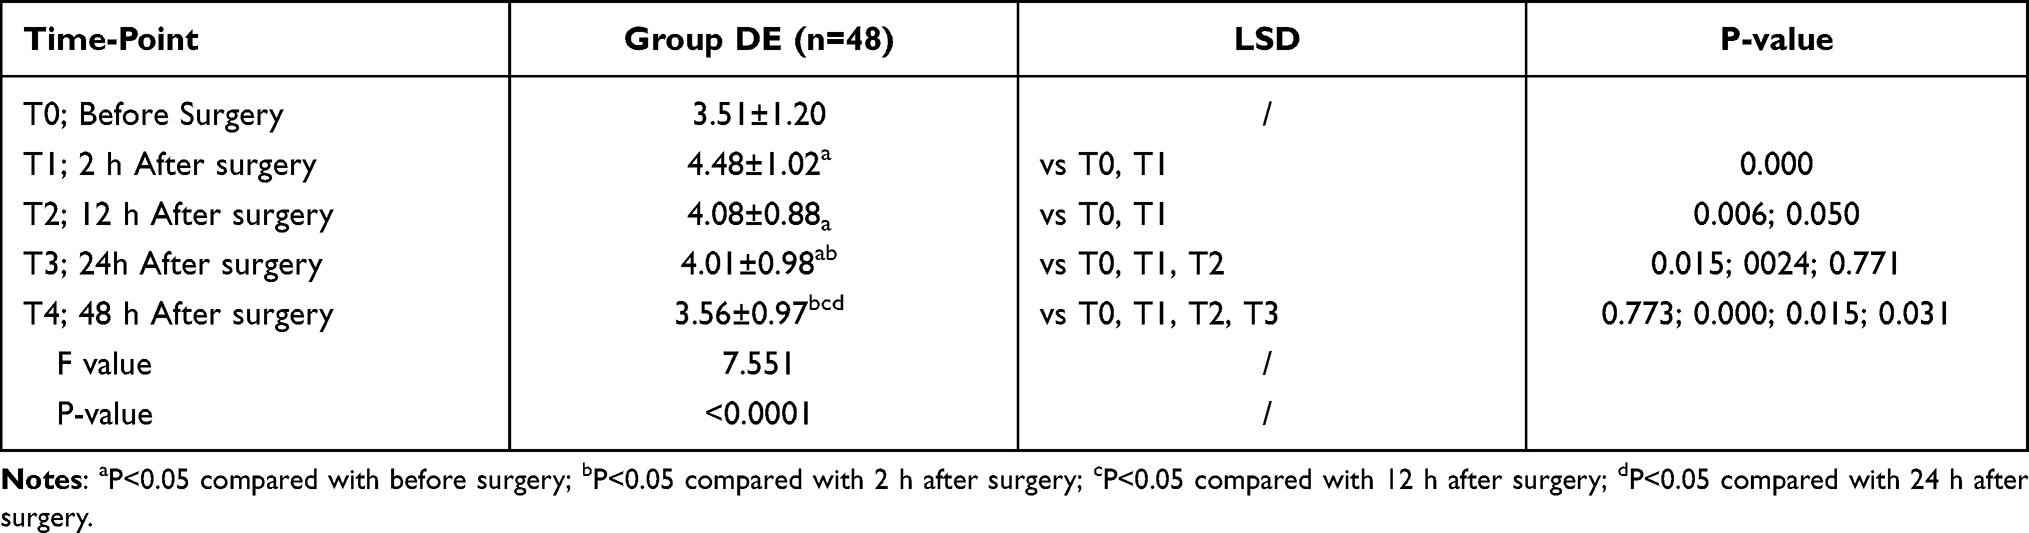 |
Table 10 Comparison of Th2% Between Time-Points in Group DE |
There was no significant difference in the percentage of Th2 cells between the two groups before surgery (P = 0.297, P > 0.05), and the percentage of Th2 cells at 2, 12, 24, and 48 hours after surgery in group DE was significantly lower than those in group SF, with statistically significant differences (P = 0.024.0.0001, 0.023, 0.013, P < 0.05), as shown in Table 8, Figure 4.
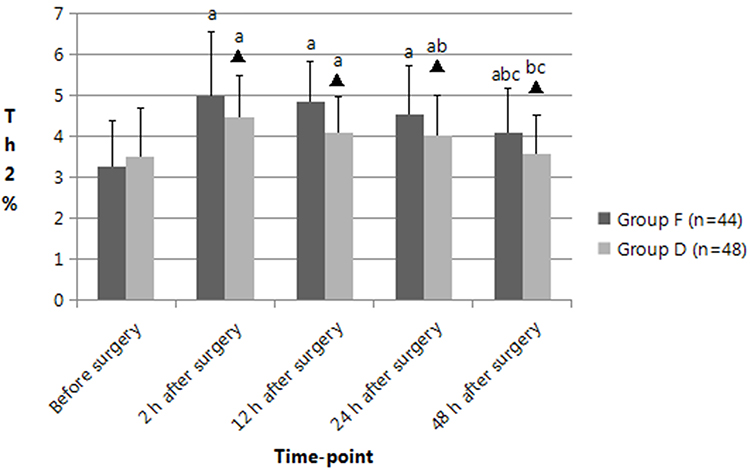 |
Figure 4 Comparison of the percentage of Th2 cells before and after surgery between the two groups. aP<0.05 compared with before surgery, bP<0.05 compared with 2 h after surgery; cP<0.05 compared with 12 h after surgery. ▲P<0.05 compared with Group SF. |
The percentage of Th2 cells at 2, 12, and 24 hours after surgery in group SF was significantly higher than that before surgery, with statistically significant differences (All P = 0.000, P < 0.05). The percentage of Th2 cells at 48 hours after surgery was significantly lower than those at 2 and 12 hours after surgery, with a statistically significant difference (P = 0.000, 0.002, P < 0.05). There was no significant difference in the percentage of Th2 cells between 2, 12, 24 hours after surgery (P = 0.524, 0.051, 0.186, P > 0.05). The percentage of Th2 cells at 48 hours after surgery in group SF was significantly higher than that before surgery, with a statistically significant difference (4.11±1.06 vs 3.25±1.12, P = 0.064, P > 0.05,). These results indicate that the percentage of Th2 cells at 48 hours after surgery had not returned to the preoperative levels in group SF, as shown in Table 9, Figure 4.
The percentage of Th2 cells at 2, 12, 24, and 48 hours after surgery in group DE was significantly higher than those before surgery, with statistically significant differences (P = 0.000, 0.006, 0.015, P < 0.05). The percentage of Th2 cells at 48 hours after surgery was significantly higher than that at 2, 12 and 24 hours after surgery, with statistically significant differences (P = 0.000, 0.015, 0.031, P < 0.05). The percentage of Th2 cells at 24 hours after surgery was significantly higher than that at 2 hours after surgery, with a statistically significant difference (P = 0.024, P < 0.05). There was no significant difference in the percentage of Th2 cells before surgery and 48 hours after surgery (3.56±0.97 vs 3.51±1.20, P = 0.773, P > 0.05). These results indicate that the percentage of Th2 cells at 48 hours after surgery had returned to the preoperative levels in group DE, as shown in Table 10, Figure 4.
Th1/Th2 Ratio Changes
Tables 11–13 show comparison of Th1/Th2 between the two groups (Table 11), between time-points in Group SF (Table 12) between time-points in Group DE (Table 13) and the indications are p-value and t value in the column comparing between the readings of the two groups of individuals (Table 11), and F value and p-value in the row comparing between the readings of the different time-points in the whole in each group; p-value in the column comparing between the readings of the different time-points of each other in each group Table 12, Table 13).
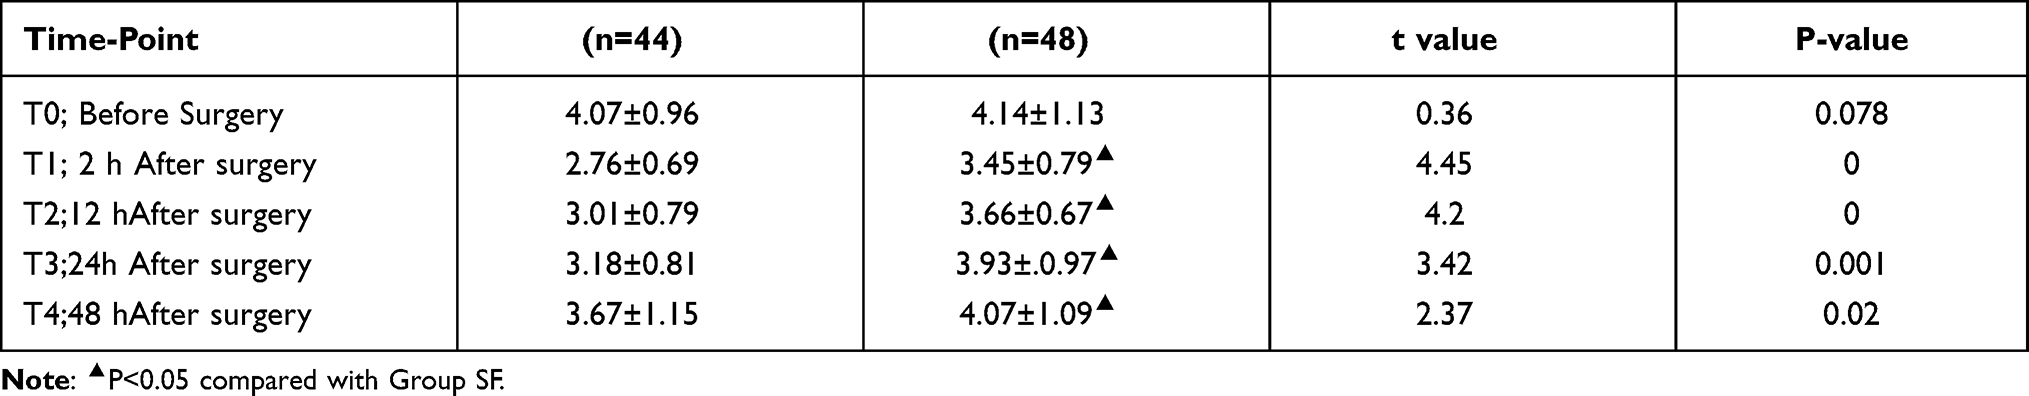 |
Table 11 Comparison of Th1/Th2 in the Two Groups |
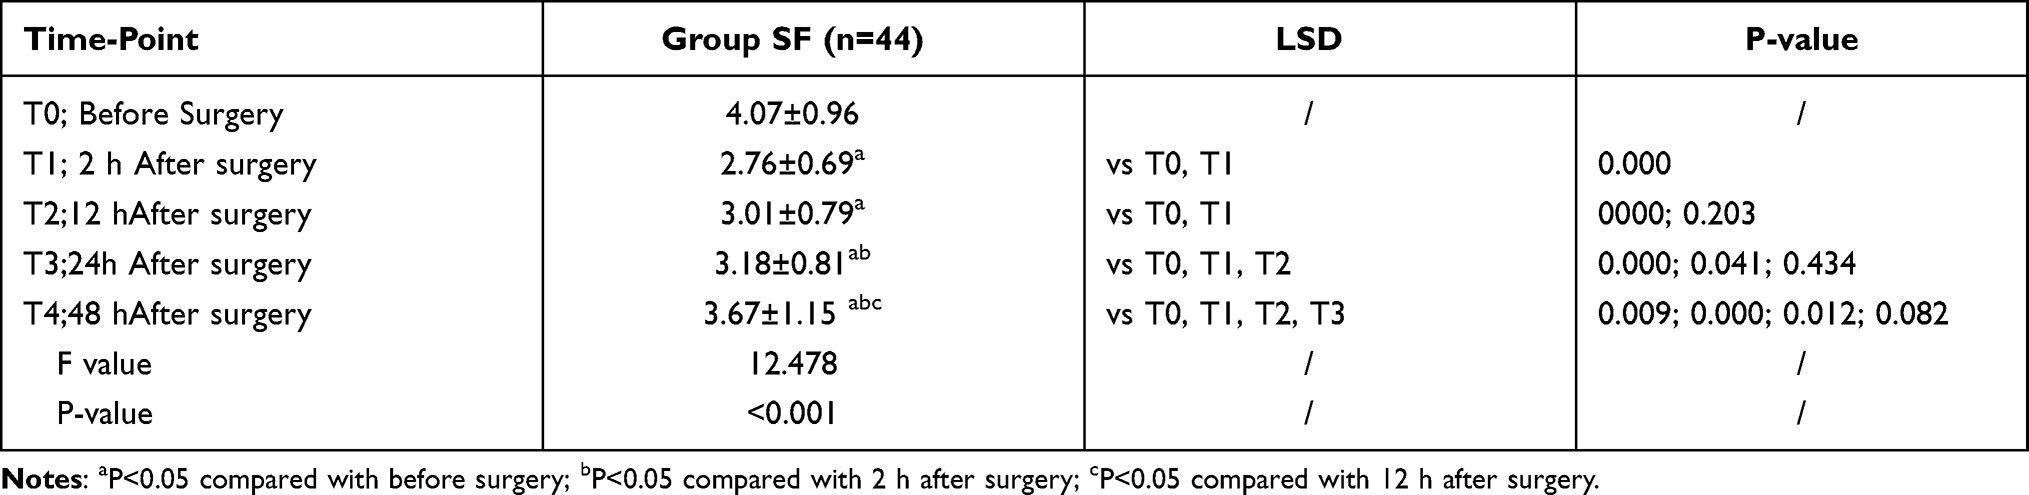 |
Table 12 Comparison of Th1/Th2 Between Time-Points in Group SF |
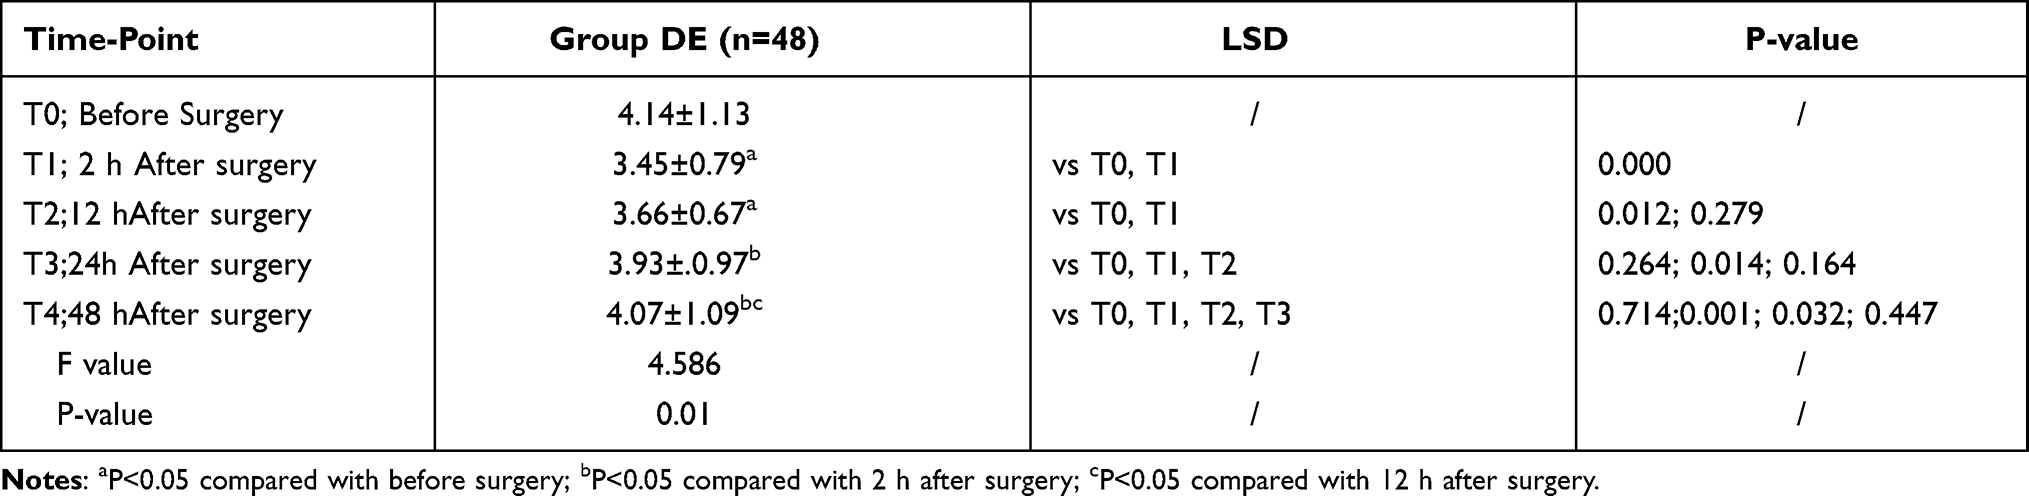 |
Table 13 Comparison of Th1/Th2 Between Time-Points in Group DE |
There was no significant difference in the Th1/Th2 ratio before surgery between the two groups (P = 0.078, P > 0.05), but the Th1/Th2 ratio at 2, 12, 24, and 48 hours after surgery in group DE was significantly higher than that in group SF, with statistically significant differences (P = 0.000, 0.000, 0.001, P < 0.05), as shown in Table 11, Figure 5.
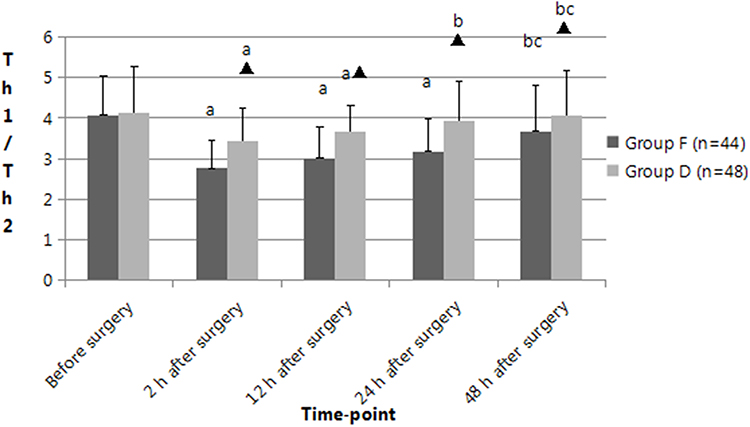 |
Figure 5 Comparison of the Th1/Th2 ratio before and after surgery between the two groups. aP<0.05 compared with before surgery, bP<0.05 compared with 2 h after surgery, cP<O.05 compared with 12 h after surgery. ▲P<0.05 compared with Group SF. |
The Th1/Th2 ratio at 2, 12, and 24 hours after surgery in group SF was significantly lower than that before surgery, with statistically significant differences (All P = 0.000, P < 0.05). The Th1/Th2 ratio at 48 hours after surgery was significantly lower than that at 2 and 12 hours after surgery, with statistically significant differences (P = 0.000, 0.012, P < 0.05). There was no significant difference in the Th1/Th2 ratio between at 24 and 48 hours (P = 0082, P > 0.05). The Th1/Th2 ratio at 48 hours after surgery was significantly lower than that before surgery, with a statistically significant difference (3.67±1.15 vs 4.07±0.96, P=0.009, P < 0.05). These results indicate that the Th1/Th2 ratio at 48 hours after surgery had returned to the preoperative levels in group SF but is still low, as shown in Table 12, Figure 5.
The Th1/Th2 ratio at 2 and 12 hours after surgery in group DE was significantly lower than that before surgery, with statistically significant differences (P = 0.279, 0.164, P < 0.05). The Th1/Th2 ratio at 24 and 48 hours after surgery was significantly lower than that at 2 hours after surgery, with statistically significant differences (P = 0.014, 0.001, P < 0.05). The Th1/Th2 ratio at 48 hours after surgery was significantly lower than that at 12 hours after surgery, with a statistically significant difference (P = 0.032, P < 0.05). There was no significant difference in the Th1/Th2 ratio before surgery and 24 and 48 hours after surgery (P = 0.264, 0.714, 0.447, P > 0.05). These results indicate that Th1/Th2 ratio at 24 and 48 hours after surgery had returned to the preoperative levels in group DE, as shown in Table 13, Figure 5.
Discussion
There is reasonable evidence that opioids themselves can inhibit the immune function, mediating the balance of Th1/Th2 by activating the opioid receptors and beyond them.46–48 Research has shown that morphine can facilitate the differentiation of Th cells into Th2 cells and decrease the Th1/Th2 ratio. This effect can be reversed by naloxone21,25 and can be concealed in rats with the μ receptor gene being knocked out.21,22,48 These results indicate that the μ opioid receptor may, in part, mediate immunosuppression, by binding to μ opioid receptors expressed by T cells.4,10,49 Another study found that the treatment of human T lymphocytes with opioids resulted in a strong induction or reduction of the cytokine IL-448 which is mainly involved in Th cell differentiation.47,48 Opioids also affect the immune system through other non-opioid receptor mechanisms, such as the sympathetic nervous system, the central nervous system, and the hypothalamic–pituitary–adrenal axis.5,50–52 Furthermore, the effect of tramadol on NK cell cytotoxicity following surgery might be the stimulation of NK activity, due to 5-HT reuptake and it can be inhibited by the 5-HT receptor antagonist metergoline.10,53 These results indicate that the 5-HT receptors also involve the immune regulation.
In our study, the decreased expression of Th1 cells and increased expression of Th2 cells resulted in a significantly decreased Th1/Th2 ratio after surgery at 2, 12 and 24 hours in both groups, indicating that Th cells can differentiate to Th2 cells under the influence of surgical stress and postoperative pain. These results are confirmed by previous studies.6–9 Our study also found that the percentages of Th1 and Th2 and the Th1/Th2 ratio were all restored to the preoperative levels at 48 hours after surgery in patients treated with dezocine, but in the patients treated with sufentanil, there was some in difference. Although there was no significant difference in the ratio of Th1/Th2 between 48 hours after surgery and before surgery (P = 0.82), the ratio of Th1/Th2 at 48 hours after surgery was still lower than that before surgery (3.67 ±1.15 vs 4.07 ±0.96).
Furthermore, the percentage of Th1 cells at 2, 12, 24, and 48 hours after surgery in patients treated with dezocine were significantly higher than those with sufentanil accompanied with the percentage of Th2 cells in reverse, resulting in higher Th1/Th2 ratio in the dezocine group at 2, 12, 24, and 48 hours after surgery than those with sufentanil. These results suggest that dezocine can inhibit the shift of the Th1/Th2 balance to Th2 phenotype in the early postoperative period, whereas sufentanil has the weaker effect, and this immune protective effect may be beneficial to the recovery of cancer patients after surgery. These results can be explained as follows: First, as described above, opioid immunomodulatory effects are mediated, in part, by μ opioid receptors.4–6,48 Sufentanil, similar to morphine, is a μ receptor agonist, can suppress the expression of s, IL-2, IFN-γ, and IL-12. The down-regulation of these cytokines inhibits Th cell differentiation in Th1 cells.48,49 However, dezocine, a partial κ agonist, can prompt Th cell differentiation to Th1 cells by increasing the level of IL-12, decreasing the level of IL-10, and improving the activity of CD4+T cells.34,35 IL-12 is a key cytokine in mediating cellular immunity, especially in inducing Th1 differentiation both in vivo and in vitro.25,27 In contrast to IL-12, IL-10 is a suppressive factor acting on antigen-presenting cells to inhibit cytokine secretion by Th1 cells.48,55 Second, studies have shown that tramadol, as a weak agonist of μ receptors, can reduce the differentiation of Th cells into Th2 types.52–54 Dezocine, with similar pharmacological characteristics to tramadol, such as partial activation on μ receptors and inhibiting noradrenaline and serotonin reuptake17,32,33 may have an immune-stimulating effect. Previous studies have confirmed that serotonin (5-HT) may mediate the Th1 transition.56 Finally, we found that the analgesic efficacy of dezocine is the same as that of sufentanil in the whole but is better at 12 hours after surgery, and the decrease in pain may be beneficial to the immunity.53,57 All these mechanisms resulted in a slight decrease in the percentage of Th1 and the Th1/Th2 ratio in the early postoperative period and fast recovery in breast cancer patients undergoing surgery.
There are some limitations to this study. First, the study is retrospective and the results need to be confirmed by a randomized controlled blind study. Second, the changes in Th cells were only observed for 48 hours after surgery and the long-term immune response after surgery was not involved in this study. Finally, this study did not involve clinical outcomes such as postoperative recurrence and survival.
Conclusion
In conclusion, dezocine or sufentanil, used for anesthesia induction and postoperative analgesia, can achieve the same analgesic efficacy and dezocine can maintain the balance of Th1/Th2 more stable than sufentanil during the early postoperative periods and protect the body’s antitumor immunity in breast cancer patients undergoing surgery.
Ethics Approval
This study was conducted in accordance with the declaration of Helsinki. This study was conducted with approval from the Ethics Committee of The Foshan Hospital of Southern Medical University on November 5 with the approval document No: 2018 (2018-1105).
Consent
A written informed consent was obtained from all participants. Consent for publication was obtained from every individual whose data are included in this manuscript.
Funding
This work was supported by the Fund of Science and Technology Project of Guangdong Province of China (No. 2012A030400042).
Disclosure
The authors report no conflicts of interest in this work.
References
1. Brentnall AR, Cuzick J, Buist DSM, et al. Long-term accuracy of breast cancer risk assessment combining classic risk factors and breast density. JAMA Oncol. 2018;4(9):e180174. doi:10.1001/jamaoncol.2018.0174
2. Bray F, Ferlay J, Soerjomataram I, et al. Global cancer statistics 2018: GLOBOCAN estimates of incidence and mortality worldwide for 36 cancers in 185 countries. CA Cancer J Clin. 2018;68(6):394–424. doi:10.3322/caac.21492
3. Wang H, Mao X. Evaluation of the efficacy of neoadjuvant chemotherapy for breast cancer. Drug Des Devel Ther. 2020;14:2423–2433. doi:10.2147/DDDT.S253961
4. Franchi S, Moschetti G, Amodeo G, et al. Do all opioid drugs share the same immunomodulatory properties? A review from animal and human studies. Front Immunol. 2019;10:2914. doi:10.3389/fimmu.2019.02914
5. Scarborough BM, Smith CB. Optimal pain management for patients with cancer in the modern era. CA Cancer J Clin. 2018;68(3):182–196. doi:10.3322/caac.21453
6. Zhou D, Gu FM, Gao Q, et al. Effects of anesthetic methods on preserving anti-tumor T-helper polarization following hepatectomy. World J Gastroenterol. 2012;18(24):3089–3098. doi:10.3748/wjg.v18.i24.3089
7. Wada H, Seki S, Takahashi T, et al. Combined spinal and general anesthesia attenuates liver metastasis by preserving TH1/TH2 cytokine balance. Anesthesiology. 2007;106(3):499–506. doi:10.1097/00000542-200703000-00014
8. Kaur RP, Vasudeva K, Singla H, et al. Analysis of pro- and anti-inflammatory cytokine gene variants and serum cytokine levels as prognostic markers in breast cancer. J Cell Physiol. 2018;233(12):9716–9723. doi:10.1002/jcp.26901
9. Mosmann TR, Cherwinski H, Bond MW, et al. Two types of murine helper T cell clone. I. Definition according to profiles of lymphokine activities and secreted proteins. 1986. J Immunol. 2005;175(1):5–14.
10. Harrington LE, Hatton RD, Mangan PR, et al. Interleukin 17-producing CD4+ effector T cells develop via a lineage distinct from the T helper type 1 and 2 lineages. Nat Immunol. 2005;6(11):1123–1132. doi:10.1038/ni1254
11. Saravia J, Chapman NM, Chi H. Helper T cell differentiation. Cell Mol Immunol. 2019;16(7):634–643. doi:10.1038/s41423-019-0220-6
12. Mahlangu T, Dludla PV, Nyambuya TM, et al. A systematic review on the functional role of Th1/Th2 cytokines in type 2 diabetes and related metabolic complications. Cytokine. 2020;126:154892. doi:10.1016/j.cyto.2019.154892
13. Kennedy R, Celis E. Multiple roles for CD4+ T cells in anti-tumor immune responses. Immunol Rev. 2008;222:129–144. doi:10.1111/j.1600-065X.2008.00616.x
14. Fu G, Miao L, Wang M, et al. The postoperative immunosuppressive phenotypes of peripheral T helper cells are associated with poor prognosis of breast cancer patients. Immunol Invest. 2017;46(7):647–662. doi:10.1080/08820139.2017.1360337
15. Moyano J, Aguirre L. Opioids in the immune system: from experimental studies to clinical practice. Rev Assoc Med Bras (1992). 2019;65(2):262–269. doi:10.1590/1806-9282.65.2.262
16. Wang L, Liu X, Wang J, et al. Comparison of the efficacy and safety between dezocine injection and morphine injection for persistence of pain in Chinese cancer patients: a meta-analysis. Biosci Rep. 2017;37(3):BSR20170243. doi:10.1042/BSR20170243
17. Childers WE, Abou-Gharbia MA. “I’ll Be Back”: the resurrection of dezocine. ACS Med Chem Lett. 2021;12(6):961–968. doi:10.1021/acsmedchemlett.1c00233
18. Zhao X, Liu J, Ge S, et al. Saikosaponin A inhibits breast cancer by regulating Th1/Th2 balance. Front Pharmacol. 2019;10:624. doi:10.3389/fphar.2019.00624
19. Zhang W, Pan Y, Gou P, et al. Effect of xanthohumol on Th1/Th2 balance in a breast cancer mouse model. Oncol Rep. 2018;39(1):280–288. doi:10.3892/or.2017.6094
20. Yao ZY, Jia Z, Xie YH, et al. Analgesic effect of dezocine in different doses on elderly patients undergoing abdominal operation under general anesthesia and its influence on stress response to postoperative tracheal extubation. Eur Rev Med Pharmacol Sci. 2017;21(22):5223–5229. doi:10.26355/eurrev_201711_13845
21. Nair MP, Schwartz SA, Polasani R, et al. Immunoregulatory effects of morphine on human lymphocytes. Clin Diagn Lab Immunol. 1997;4(2):127–132. doi:10.1128/cdli.4.2.127-132.1997
22. Roy S, Balasubramanian S, Sumandeep S, et al. Morphine directs T cells toward T(H2) differentiation. Surgery. 2001;130(2):304–309. doi:10.1067/msy.2001.116033
23. Mao M, Qian Y, Sun J. Morphine suppresses T helper lymphocyte differentiation to Th1 type through PI3K/AKT pathway. Inflammation. 2016;39(2):813–821. doi:10.1007/s10753-016-0310-x
24. Gao M, Sun J, Jin W, Qian Y. Morphine, but not ketamine, decreases the ratio of Th1/Th2 in CD4-positive cells through T-bet and GATA3. Inflammation. 2012;35(3):1069–1077. doi:10.1007/s10753-011-9413-6
25. Messmer D, Hatsukari I, Hitosugi N, et al. Morphine reciprocally regulates IL-10 and IL-12 production by monocyte-derived human dendritic cells and enhances T cell activation. Mol Med. 2006;12(11–12):284–290.
26. Thomson IR, Harding G, Hudson RJ. A comparison of fentanyl and sufentanil in patients undergoing coronary artery bypass graft surgery. J Cardiothorac Vasc Anesth. 2000;14(6):652–656. doi:10.1053/jcan.2000.18307
27. Lee HM, Kil HK, Koo BN, et al. Comparison of sufentanil- and fentanyl-based intravenous patient-controlled analgesia on postoperative nausea and vomiting after laparoscopic nephrectomy: a prospective, double-blind, randomized-controlled trial. Int J Med Sci. 2020;17(2):207–213. doi:10.7150/ijms.39374
28. Peng Y, Yang J, Guo D, et al. Sufentanil postoperative analgesia reduce the increase of T helper 17 (Th17) cells and FoxP3+ regulatory T (Treg) cells in rat hepatocellular carcinoma surgical model: a randomised animal study. BMC Anesthesiol. 2020;20(1):212. doi:10.1186/s12871-020-01129-0
29. Gong L, Qin Q, Zhou L, et al. Effects of fentanyl anesthesia and sufentanil anesthesia on regulatory T cells frequencies. Int J Clin Exp Pathol. 2014;7(11):7708–7716.
30. Jagtap SV. Evaluation of CD4+ T-cells and CD8+ T-cells in triple-negative invasive breast cancer. Indian J Pathol Microbiol. 2018;61(4):477–478. doi:10.4103/IJPM.IJPM_201_18
31. Solis-Castillo LA, Garcia-Romo GS, Diaz-Rodriguez A, et al. Tumor-infiltrating regulatory T cells, CD8/Treg ratio, and cancer stem cells are correlated with lymph node metastasis in patients with early breast cancer. Breast Cancer. 2020;27(5):837–849. doi:10.1007/s12282-020-01079-y
32. Wang YH, Chai JR, Xu XJ, et al. Pharmacological characterization of dezocine, a potent analgesic acting as a κ partial agonist and μ partial agonist. Sci Rep. 2018;8(1):14087. doi:10.1038/s41598-018-32568-y
33. Mao XF, Ahsan MZ, Apryani E, et al. Dual μ-opioid receptor and norepinephrine reuptake mechanisms contribute to dezocine- and tapentadol-induced mechanical antiallodynia in cancer pain. Eur J Pharmacol. 2020;876:173062. doi:10.1016/j.ejphar.2020.173062
34. Feng C, Feng M, Jiao R, et al. Effect of Dezocine on IL-12 and IL-10 secretion and lymphocyte activation by culturing dendritic cells from human umbilical cord blood. Eur J Pharmacol. 2017;796:110–114. doi:10.1016/j.ejphar.2016.12.035
35. Song Q, Liu G, Liu D, et al. Dezocine promotes T lymphocyte activation and inhibits tumor metastasis after surgery in a mouse model. Invest New Drugs. 2020;38(5):1342–1349. doi:10.1007/s10637-020-00921-6
36. Ye Z, Zhang M, Ding N, et al. Antinociceptive effects of dezocine on complete Freund’s adjuvant-induced inflammatory pain in rats. Exp Ther Med. 2018;15(6):5469–5474. doi:10.3892/etm.2018.6110
37. Wang F, Zhang X, Wang H, et al. Effects of dezocine and sufentanyl for postoperative analgesia on activity of NK, CD4+ and CD8+ cells in patients with breast cancer. Oncol Lett. 2019;17(3):3392–3398. doi:10.3892/ol.2019.9964
38. Wu L, Dong YP, Sun L, et al. Low concentration of dezocine in combination with morphine enhance the postoperative analgesia for thoracotomy. J Cardiothorac Vasc Anesth. 2015;29(4):950–954. doi:10.1053/j.jvca.2014.08.012
39. Morgan D, Cook CD, Smith MA, et al. An examination of the interactions between the antinociceptive effects of morphine and various mu-opioids: the role of intrinsic efficacy and stimulus intensity. Anesth Analg. 1999;88(2):407–413. doi:10.1097/00000539-199902000-00035
40. Li NN, Huang YQ, Huang LE, et al. Dezocine antagonizes morphine analgesia upon simultaneous administration in rodent models of acute nociception. Pain Physician. 2017;20(3):E401–E409.
41. Zhang L, Xu J, Wang G, et al. [Consensus of clinical analgesic experts on dizocine]. Chin J Anesthesiol. 2020;40(6):641–664. Chinese.
42. Raigon-Ponferrada A, Recio MED, Guerrero-Orriach JL, et al. Breast Cancer and Anesthesia. Curr Pharm Des. 2019;25(28):2998–3004. doi:10.2174/1381612825666190712183436
43. Karcioglu O, Topacoglu H, Dikme O, et al. A systematic review of the pain scales in adults: which to use? Am J Emerg Med. 2018;36(4):707–714. doi:10.1016/j.ajem.2018.01.008
44. Rostaing L, Tkaczuk J, Durand M, et al. Kinetics of intracytoplasmic Th1 and Th2 cytokine production assessed by flow cytometry following in vitro activation of peripheral blood mononuclear cells. Cytometry. 1999;35(4):318–328. doi:10.1002/(sici)1097-0320(19990401)35:4<318::aid-cyto4>3.0.co;2-4
45. Maino VC, Suni MA, Ruitenberg JJ. Rapid flow cytometric method for measuring lymphocyte subset activation. Cytometry. 1995;20(2):127–133. doi:10.1002/cyto.990200205
46. Yang W, Chen X, Hu H. CD4+ T-Cell Differentiation In Vitro. Methods Mol Biol. 2020;2111:91–99. doi:10.1007/978-1-0716-0266-9_8
47. Ye W, Zhang X, Sun X. [Effects of on the expression of CD4 molecules on the surface of Th cells cultured in vitro]. J Immunol. 2018;21(2):104–106. Chinese.
48. Boland JW, Pockley AG. Influence of opioids on immune function in patients with cancer pain: from bench to bedside. Br J Pharmacol. 2018;175(14):2726–2736. doi:10.1111/bph.13903
49. Börner C, Lanciotti S, Koch T, Höllt V, Kraus J. μ opioid receptor agonist-selective regulation of interleukin-4 in T lymphocytes. J Neuroimmunol. 2013;263(1–2):35–42. doi:10.1016/j.jneuroim.2013.07.012
50. Eisenstein TK. The role of opioid receptors in immune system function. Front Immunol. 2019;10:2904. doi:10.3389/fimmu.2019.02904
51. Stowell RD, Sipe GO, Dawes RP, et al. Noradrenergic signaling in the wakeful state inhibits microglial surveillance and synaptic plasticity in the mouse visual cortex [published correction appears in Nat Neurosci. 2020 Jan;23(1):152]. Nat Neurosci. 2019;22(11):1782–1792. doi:10.1038/s41593-019-0514-0
52. Franchi S, Panerai AE, Sacerdote P. Buprenorphine ameliorates the effect of surgery on hypothalamus-pituitary-adrenal axis, natural killer cell activity and metastatic colonization in rats in comparison with morphine or fentanyl treatment. Brain Behav Immun. 2007;21(6):767–774. doi:10.1016/j.bbi.2007.01.001
53. Sacerdote P, Bianchi M, Gaspani L, et al. The effects of tramadol and morphine on immune responses and pain after surgery in cancer patients. Anesth Analg. 2000;90(6):1411–1414. doi:10.1097/00000539-200006000-00028
54. Sacerdote P, Bianchi M, Gaspani L, et al. Effects of tramadol and its enantiomers on Concanavalin-A induced-proliferation and NK activity of mouse splenocytes: involvement of serotonin. Int J Immunopharmacol. 1999;21(11):727–734. doi:10.1016/s0192-0561(99)00048-x
55. Martino M, Rocchi G, Escelsior A, Fornaro M. Immunomodulation mechanism of antidepressants: interactions between serotonin/norepinephrine balance and Th1/Th2 balance. Curr Neuropharmacol. 2012;10(2):97–123. doi:10.2174/157015912800604542
56. Russo MA, Fiore NT, van Vreden C, et al. Expansion and activation of distinct central memory T lymphocyte subsets in complex regional pain syndrome [published correction appears in J Neuroinflammation. 2019 Apr 3;16(1):70]. J Neuroinflammation. 2019;16(1):63. doi:10.1186/s12974-019-1449-9
57. Machelska H, Celik MÖ. Opioid receptors in immune and glial cells-implications for pain control. Front Immunol. 2020;11:300. doi:10.3389/fimmu.2020.00300
 © 2021 The Author(s). This work is published and licensed by Dove Medical Press Limited. The full terms of this license are available at https://www.dovepress.com/terms.php and incorporate the Creative Commons Attribution - Non Commercial (unported, v3.0) License.
By accessing the work you hereby accept the Terms. Non-commercial uses of the work are permitted without any further permission from Dove Medical Press Limited, provided the work is properly attributed. For permission for commercial use of this work, please see paragraphs 4.2 and 5 of our Terms.
© 2021 The Author(s). This work is published and licensed by Dove Medical Press Limited. The full terms of this license are available at https://www.dovepress.com/terms.php and incorporate the Creative Commons Attribution - Non Commercial (unported, v3.0) License.
By accessing the work you hereby accept the Terms. Non-commercial uses of the work are permitted without any further permission from Dove Medical Press Limited, provided the work is properly attributed. For permission for commercial use of this work, please see paragraphs 4.2 and 5 of our Terms.