")
Back to Journals » Breast Cancer: Targets and Therapy » Volume 9
Effects of CYP2D6 and CYP3A5 polymorphisms on tamoxifen and its metabolites in Thai breast cancer patients
Authors Charoenchokthavee W , Areepium N, Panomvana D, Sriuranpong V
Received 26 October 2016
Accepted for publication 1 February 2017
Published 15 April 2017 Volume 2017:9 Pages 249—256
DOI https://doi.org/10.2147/BCTT.S125745
Checked for plagiarism Yes
Review by Single anonymous peer review
Peer reviewer comments 2
Editor who approved publication: Professor Pranela Rameshwar
Wanaporn Charoenchokthavee,1 Nutthada Areepium,2 Duangchit Panomvana,2 Virote Sriuranpong2
1Department of Pharmacy Practice, Faculty of Pharmaceutical Science, Chulalongkorn University, 2Medical Oncology Unit, Department of Medicine, Faculty of Medicine, Chulalongkorn University, Pathumwan, Bangkok, Thailand
Purpose: This study aimed to determine the effects of CYP2D6 and CYP3A5 polymorphisms on the levels of tamoxifen (TAM) and its metabolites in the plasma of breast cancer patients. The protocol was designed to test the associations between CYP2D6, CYP3A5 genotypes and phenotypes (extensive metabolizer [EM], intermediate metabolizer [IM] and poor metabolizer [PM]) and TAM, N-desmethyl tamoxifen (NDMT), endoxifen (END) and 4-hydroxytamoxifen (4OHT) concentrations.
Patients and methods: One hundred and thirty-four Thai breast cancer patients from the Thai Tamoxifen Project undergoing TAM treatment who met the inclusion/exclusion criteria were recruited. Plasma samples were assessed for the concentrations of TAM and its metabolites using high-performance liquid chromatography. The data are presented as actual values and metabolic ratios (MR). The hypotheses were tested using Kruskal–Wallis or Mann–Whitney U test, including the simple main effects analysis.
Results: The patients had stage 0–IV breast cancer. The mean age and body mass index were 51.6±11.6 years and 24.0±4.3, respectively. Also, 53.0% of them were premenopausal, 10.4% were perimenopausal and 36.6% were postmenopausal, while 23.1% were CYP2D6-EM/CYP3A5-EM and 20.9% carried only CYP2D6 and CYP3A5 incomplete alleles. The median concentrations of TAM, NDMT, END and 4OHT were 374.7 (interquartile range [IQR] 230.2) ng/mL, 1,064.9 (IQR 599.6) ng/mL, 54.5 (IQR 52.5) ng/mL and 5.0 (IQR 3.1) ng/mL, respectively. MR (TAM-NDMT) and MR (NDMT-END) were statistically different (p=0.013 and p=0.014, respectively), while MR (4OHT-END) was not statistically different within the CYP2D6 phenotype (p=0.594). MR (TAM-4OHT) was not statistically different within the CYP2D6 phenotype (p=0.079), but it was potentially different from CYP3A5-PM (p=0.056). None of the MR was statistically different within the CYP3A5 phenotype.
Conclusion: CYP2D6 polymorphisms appear to affect END concentration through an NDMT subpathway and potentially affect 4OHT concentrations through a 4OHT subpathway in CYP3A5-PM group.
Keywords: endoxifen, cytochrome P450, single nucleotide polymorphisms, pharmacogenetics, pharmacogenomics, human
Introduction
Tamoxifen (TAM) has been widely used for breast cancer prevention and treatment.1 Interindividual variability because of the effects of single-nucleotide polymorphisms in genes encoding cytochrome P450 (CYP450) enzymes involved in Phase I of the TAM metabolic pathway has been shown in many studies.2–5 The CYP450 enzymes (CYP2D6, CYP2C9, CYP2C19, CYP3A4 and CYP3A5) are essential for the transformation of TAM from a prodrug form to its active metabolites (endoxifen [END] and 4-hydroxytamoxifen [4OHT]).1,6,7 The END and 4OHT active metabolites demonstrate a 30- to 100-fold higher suppression of cell proliferation and nearly 100-fold higher affinity for the estrogen receptor, compared with TAM. However, the 4OHT levels are found to be five to ten times lower than those of END in the plasma.6 END can be formed through two subpathways: the main pathway involves N-desmethyl tamoxifen (NDMT subpathway; 90%) and the other pathway is through 4OHT (4OHT subpathway; 10%).1,2,8–10 Previous studies have investigated the associations between TAM and its metabolites, including studying the relevant CYP450 enzyme activity in the TAM metabolic subpathways,9–11 but conclusive results have not been obtained because of the heterogeneity of the studies.12,13 The prevalence and type of incomplete functional allele (null allele and reduced allele) that is involved in CYP450 enzyme activity are different in different populations;14 the prevalence of CYP2D6*4 (null allele) has been found to be higher in Caucasians15 than in Asians16 or Thais,17 while that of CYP2D6*10 (reduced allele) has been found to be higher in Asians,16 including Thais,18 than in Caucasians15 and CYP3A5*3 (null allele) is the major allele in Caucasians15 and Asians,16 including Thais.18 Previous research has suggested that the low activities of CYP2D6 and CYP3A5 enzymes account for 25%–55% and 40%–50% of the polymorphisms, respectively, in Thai breast cancer patients.17–19 Early researches suggested that CYP2D6*10/*10 patients had shorter disease-free survival than heterozygous CYP2D6*10 (p=0.046)17 and lower END concentrations than those patients with CYP2D6*1/*10 and CYP2D6*1/*1 (p=0.045)19 among Thai breast cancer patients; however, the result was not completely generalized to target population because of the limited sample size.19 Furthermore, the associations between CYP3A5 polymorphisms and levels of TAM and its metabolites have never been explored in Thai breast cancer patients, even though a high prevalence of CYP3A5 incomplete allele (CYP3A5*3) has been suggested in a previous study.18 The purpose of the present study was to determine the associations of CYP2D6 and CYP3A5 polymorphisms and the concentrations of TAM and its metabolites in large numbers of Thai breast cancer patients undergoing TAM treatment.
Patients and methods
Patients and samples preparation
A total of 134 Thai breast cancer patients undergoing TAM treatment were recruited from the Thai Tamoxifen Project.18,20 In brief, the patients took 20 mg of TAM once daily for at least 2 months to ensure a steady-state concentration and visited the outpatient clinic at King Chulalongkorn Memorial Hospital between February and March 2015. All patients were 18 years or older, with normal hepatic and renal functions (aspartate aminotransferase and alanine aminotransferase ≤2 upper normal limit, serum creatinine ≤1.2 mg/dL) in the previous 4 weeks.18,20 Medication nonadherence was evaluated through self-reporting. Medication records were screened for drug–drug interactions by a clinical pharmacist. Patients who reported <80% adherence, showed an evident drug–drug interaction or were diagnosed for psychiatric illness/cognitive impairment were excluded from the study. A sample size calculation was performed using G*Power version 3.1 program21 using the priori method22 with type-I errors 0.05 (two-tailed) and type-II errors 0.2. Ten milliliters of whole blood was drawn from each patient by a professional nurse and stored in a Vacutainer® (K2EDTA [di-potassium salts of ethylenediaminetetraacetic acid]; 10 mL) tube (BD, Franklin Lakes, NJ, USA).18 The DNA extraction for assessing CYP2D6 and CYP3A5 polymorphisms and the determination of the polymorphisms have been described in previous research.18
The plasma section was separated from the collected whole blood and stored at −80°C until use. Then 10 μL of internal standard (IS; Mexiletine 5 mg/mL; Sigma-Aldrich, Singapore) was added to 1 mL of plasma sample, followed by 1 mL of acetonitrile (RCI Labscan, Bangkok, Thailand) and 500 μL of methanol (Fisher Scientific, Loughborough, UK) in a 15 mL centrifuge tube (Corning Incorporated, Corning, NY, USA). The tube was capped and vortexed for 10 minutes and subsequently centrifuged twice at 3,000 rpm (4°C) for 30 and 10 minutes, respectively. The supernatant was filtered through a 0.22 μm nylon filter and thereafter derivatized using an ultraviolet lamp at a wavelength of 366 nm for 20 minutes before being injected into a high-performance liquid chromatography (HPLC) column.
Quantification of TAM and its metabolites
HPLC system with a fluorescent (FLU) detector: The concentrations of TAM and its metabolites concentrations in plasma were quantified using reverse-phase HPLC with a FLU detector. The HPLC-FLU method validation and the plasma extraction protocol were modified from the methods developed by Zhu et al23 and Areepium et al.19 The HPLC-FLU system was set as follows: Prostar (model 363) with autosampler (model 410) and column oven (model 510) with fluorescence detector and Varian Star software (Agilent Technologies, Santa Clara, CA, USA), column: Luna 5U C18 (2) 100 A, 250×4.6 mm (35°C; Phenomenex, Torrance, CA, USA), mobile phase: 1% trimethylamine and methanol (19:81 %V/V) with flow rate 1.1 mL/min. TAM and metabolites standards: TAM (Fluka, Singapore), (E/Z)-4OHT (Fluka), NDMT (Sigma-Aldrich) and (E/Z)-END (Sigma-Aldrich) and IS: mexiletine (Sigma-Aldrich).
Standards and chemicals
The methanolic standard stock solutions of TAM, NDMT, END, 4OHT and mexiletine (IS) were prepared using powder dissolution to obtain 5 mg/mL of mexiletine, 0.01 mg/mL of END and 4OHT, 0.1 mg/mL of TAM and 0.3 mg/mL of NDMT. The working solutions were prepared from each stock solution with a sufficient volume of methanol to obtain six non-zero standard solutions containing TAM (25, 50, 100, 500, 750 and 1,000 ng/mL), NDMT (25, 50, 100, 500, 750 and 1,000 ng/mL), END (5, 10, 50, 75, 100 and 300 ng/mL) and 4OHT (2.5, 5.0, 7.5, 12.5, 25 and 50 ng/mL). All stock solutions were stored at −20°C and protected from light. Trimethylamine HPLC grade (Sigma-Aldrich), methanol HPLC grade (Fisher Scientific), acetonitrile HPLC grade (RCI Labscan) and ultrapure analytical grade type I water were used for the mobile phase and plasma extraction.
Method validation and calibration curve
The chromatogram of a blank sample (six sources of plasma) with the IS was compared with the chromatograms of TAM 750 ng/mL, NDMT 750 ng/mL, END 75 ng/mL and 4OHT 25 ng/mL in blank plasma to assess the selectivity of each metabolite. The retention times of IS, TAM, NDMT, END and 4OHT were 5.0, 26.1, 19.6, 6.9 and 7.3 minutes, respectively. The recovery of those metabolites was 118.0%±12.0%, 123.7%±7.5%, 130.7%±17.5% and 98.0%±13.1% for TAM 750 ng/mL, NDMT 750 ng/mL, END 100 ng/mL and 4OHT 100 ng/mL, respectively, and 122.3%±23.8%, 109.0%±23.8%, 72.3%±13.4% and 108.4%±20.1% for TAM 50 ng/mL, NDMT 100 ng/mL, END 50 ng/mL and 4OHT 50 ng/mL, respectively. The coefficient of determination (R2) of those calibration curves was 0.991, 0.995, 0.990 and 0.991 for TAM, NDMT, END and 4OHT, respectively. The accuracy of detection of TAM 100 ng/mL, NDMT 750 ng/mL, END 75 ng/mL and 4OHT 25 ng/mL was 85.0–115.0, 637.5–862.5, 63.8–86.3 and 21.3–28.8 ng/mL, respectively. The coefficients of variation of TAM, NDMT, END and 4OHT were 11.6%, 12.4%, 14.0% and 19.0%, respectively. The concentration of TAM and its metabolites in the plasma samples was determined from the constructed calibration curves and is presented in ng/mL. The metabolic ratios (MR) of TAM (ng/mL)/NDMT (ng/mL): MR (TAM-NDMT), NDMT (ng/mL)/END (ng/mL): MR (NDMT-END), TAM (ng/mL)/4OHT (ng/mL): MR (TAM-4OHT) and 4OHT (ng/mL)/END (ng/mL): MR (4OHT/END) were calculated for use in hypothesis testing.
Data analysis
Kolmogorov–Smirnov and Shapiro–Wilk tests were performed to test for normality. Mean and standard deviation (SD) were used to describe normally distributed data, while median and interquartile range were used to describe non-normally distributed data. The genetic data were described as genotypes (CYP2D6*1, CYP2D6*2, CYP2D6*4, CYP2D6*10, CYP3A5*1 and CYP3A5*3) and phenotypes (extensive metabolizer [EM], intermediate metabolizer [IM] and poor metabolizer [PM]). The phenotypes were classified using a conventional method which is described in a previous report.18 Briefly, the genotypes were firstly divided into two groups (complete and incomplete alleles). The complete alleles included all wild-type alleles (CYP2D6*1, CYP2D6*2 and CYP3A5*1), while the incomplete alleles consisted of CYP2D6*4 (null allele), CYP2D6*10 (reduced allele) and CYP3A5*3 (null allele). Secondly, the phenotype was classified as EM if at least one wild-type allele was present. It was classified as IM if at least one reduced allele was present. The rest of them were classified as PM.
Kruskal–Wallis test and Mann–Whitney U test were used to perform hypothesis testing. If conflicting results were produced, the interaction effect was taken into account and a simple main effects analysis24 was performed to confirm the results.
Ethical approval
This study was approved by the Institutional Review Board of the Faculty of Medicine, Chulalongkorn University (IRB No. 406/57). Written informed consent was obtained from all individual participants included in the study.
Results
The subjects consisted of 134 breast cancer patients undergoing TAM treatment. The demographic data of the patients have been described in previous research.18 In brief, these patients demonstrated stage 0–IV breast cancer. Their mean age and body mass index (BMI) were 51.6±11.6 years and 24.0±4.3, respectively. Of these patients, 53.0% were premenopausal, 10.4% were perimenopausal and 36.6% were postmenopausal. The majority of the patients were estrogen positive/progesterone positive (71.6%). The median duration of TAM administration was 17.2 (interquartile range 16.1) months. CYP2D6-EM/CYP3A5-EM was found in 23.1% of the patients, while 20.9% carried CYP2D6 and CYP3A5 incomplete alleles (CYP2D6*4, CYP2D6*10 or CYP3A5*3).18 One patient was excluded from determination of levels of TAM and its metabolites because of extremely low levels of TAM (44.9 ng/mL). The descriptive data concerning the concentration of TAM and its metabolites are shown in Table 1.
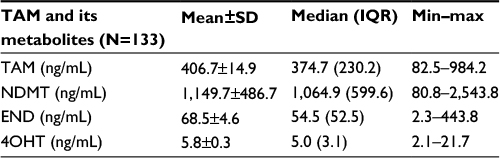 | Table 1 Descriptive data concerning the concentrations of TAM and its metabolites (ng/mL) Abbreviations: 4OHT, 4-hydroxytamoxifen; END, endoxifen; IQR, interquartile range; NDMT, N-desmethyl tamoxifen; SD, standard deviation; TAM, tamoxifen. |
CYP2D6 polymorphisms and TAM and its metabolites
The concentrations of TAM and its metabolites were not significantly affected by CYP2D6 genotype or phenotype, with the exception that the concentration of TAM was found to be significantly affected by CYP2D6 phenotype (p=0.031; Table 2). Patients demonstrating CYP2D6-PM had low TAM, NDMT and END concentrations compared with those with CYP2D6-EM and CYP2D6-IM, while CYP2D6-IM resulted in lower END and 4OHT concentrations compared with CYP2D6-EM, but had higher TAM and NDMT concentrations than CYP2D6-EM (Table 2). These inconclusive findings suggest that considering the original values of the concentrations of TAM and its metabolites might not accurately reveal the effects of CYP2D6 polymorphisms because of the effects of several TAM-metabolizing enzymes involved in END transformation including the two subpathways for END formation (through NDMT and 4OHT).18 Therefore, the concentration values of TAM and its metabolites were converted to MR to compare the baseline concentration of the input metabolite with that of the output metabolite in each subpathway of the TAM-metabolizing process. The MR (TAM-NDMT) was significantly different between different CYP2D6 genotypes (p=0.000) and phenotypes (p=0.013). MR (NDMT-END) and MR (TAM-4OHT) were significantly different between different CYP2D6 phenotypes (p=0.014 and p=0.017, respectively), but were not significantly different between different CYP2D6 genotypes (p=0.078 and p=0.094, respectively), while MR (4OHT-END) was not statistically different among CYP2D6 phenotypes or genotypes (p=0.594 and p=0.470, respectively; Table 3).
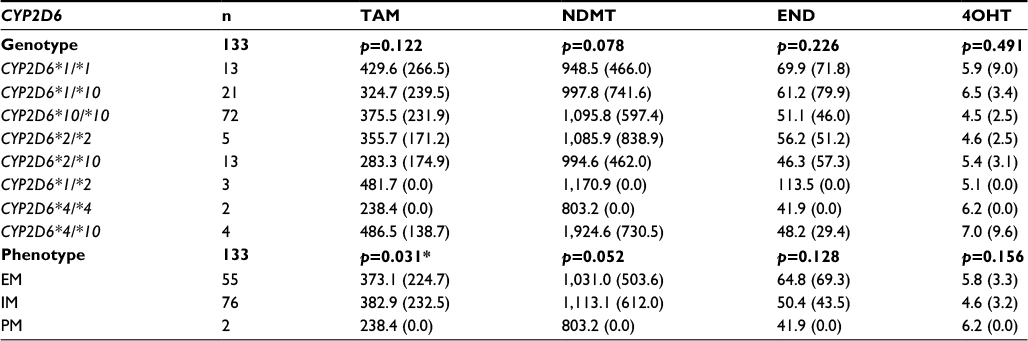 | Table 2 The concentrations of TAM and its metabolites (ng/mL) among different CYP2D6 polymorphisms Note: The concentrations of TAM and its metabolites are presented as median (interquartile range). p=p value from Kruskal–Wallis test, *p<0.05. Abbreviations: 4OHT, 4-hydroxytamoxifen; EM, extensive metabolizer; END, endoxifen; IM, intermediate metabolizer; NDMT, N-desmethyl tamoxifen; PM, poor metabolizer; TAM, tamoxifen. |
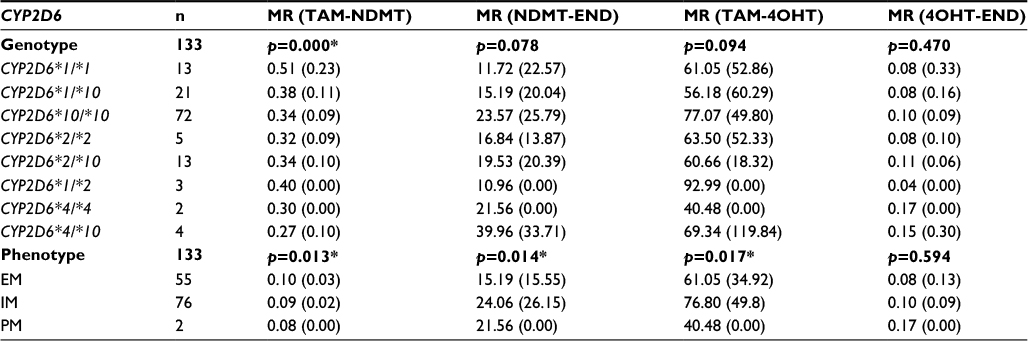 | Table 3 The MR of TAM and its metabolites among different CYP2D6 polymorphisms Note: The concentrations of TAM and its metabolites are presented as median (interquartile range). p=p value from Kruskal–Wallis test, *p<0.05. Abbreviations: 4OHT, 4-hydroxytamoxifen; EM, extensive metabolizer; END, endoxifen; IM, intermediate metabolizer; MR, metabolic ratios; NDMT, N-desmethyl tamoxifen; PM, poor metabolizer; TAM, tamoxifen. |
CYP3A5 polymorphisms and TAM and its metabolites
The concentrations of TAM and its metabolites were not significantly different between different CYP3A5 genotypes or phenotypes. The MR of the metabolites was also not significantly different between different CYP3A5 genotypes (p=0.307, p=0.786, p=0.742 and p=0.642) or phenotypes (p=0.831, p=0.657, p=0.508 and p=0.400), including those for MR (TAM/NDMT), MR (NDMT/END), MR (TAM/4OHT) and MR (4OHT/END), respectively (Table 4).
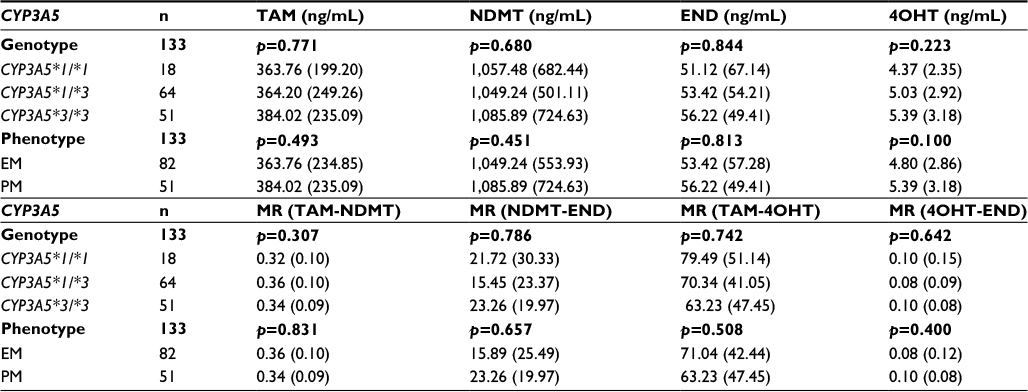 | Table 4 The concentrations and MR of TAM and its metabolites among different CYP3A5 polymorphisms Notes: The concentrations of TAM and its metabolites are presented as median (interquartile range). p=p value from Kruskal–Wallis test. Abbreviations: 4OHT, 4-hydroxytamoxifen; EM, extensive metabolizer; END, endoxifen; IM, intermediate metabolizer; MR, metabolic ratios; NDMT, N-desmethyl tamoxifen; PM, poor metabolizer; TAM, tamoxifen. |
CYP2D6 with CYP3A5 polymorphisms and TAM and its metabolites
The concentrations of TAM and its metabolites were significantly different between different CYP2D6 phenotypes (Table 2), but these differences were not significant when both CYP2D6 and CYP3A5 were combined in the analysis (p=0.265; Table 5). The NDMT, END and 4OHT concentrations were not significantly different between different combined CYP2D6 and CYP3A5 phenotypes (p=0.114, p=0.244 and p=0.224, respectively; Table 5). The MR (TAM-NDMT) and MR (NDMT-END) were significantly different between different combined CYP2D6 and CYP3A5 phenotypes (p=0.032 and p=0.026, respectively), while the MR (TAM-4OHT) and MR (4OHT-END) were not significantly different between different combined CYP2D6 and CYP3A5 phenotypes (p=0.079 and p=0.622, respectively). The MR of TAM and its metabolites between different combined CYP2D6 and CYP3A5 polymorphisms are presented in Table 5.
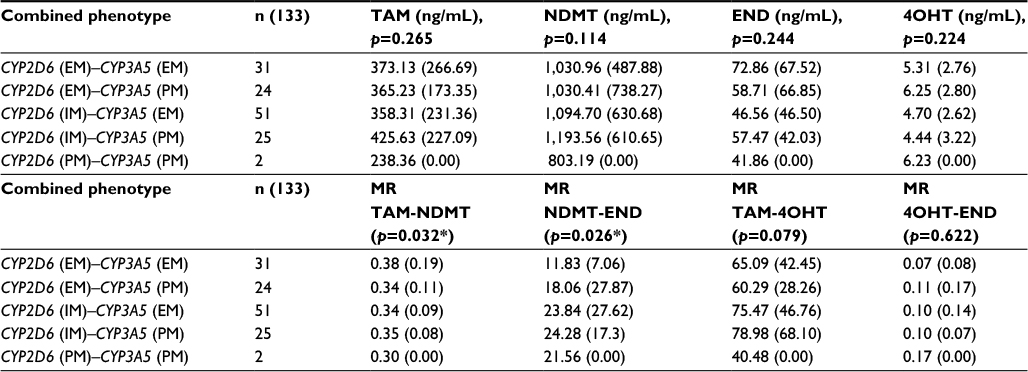 | Table 5 The MR of TAM and its metabolites between different combinations of CYP2D6 and CYP3A5 polymorphisms Notes: The concentration of TAM and its metabolites are presented in median (interquartile range). p=p value from Kruskal–Wallis test, *p<0.05. Abbreviations: 4OHT, 4-hydroxytamoxifen; EM, extensive metabolizer; END, endoxifen; IM, intermediate metabolizer; MR, metabolic ratios; NDMT, N-desmethyl tamoxifen; PM, poor metabolizer; TAM, tamoxifen. |
Discussion
The patients consisted of 134 Thai women with breast cancer who demonstrated all stages of breast cancers and were both premenopausal and postmenopausal. Saladores et al suggested that a combination of genetic factors (CYP2C9, CYP2C19 and CYP3A5) and nongenetic factors (age and BMI) produced a 2.8% contribution to MR (NDMT-END),25 and Lien et al reported that age was positively correlated to TAM, NDMT and END concentrations.26 Therefore, in the present study, the associations between these factors (age and BMI) and the concentration of TAM and its metabolites were explored to determine other possible effects. Age showed a significant nonparametric correlation to MR (TAM-4OHT; p=0.026) and BMI showed a significant nonparametric correlation to MR (TAM-NDMT; p=0.020) and MR (TAM-4OHT; p=0.023; data not shown) However, the distribution of these factors (BMI and age) was not statistically different between CYP2D6, CYP3A5 and combined CYP2D6 and CYP3A5 phenotypes (data not shown) which indicated the same distribution of age and BMI among those analyzed phenotype groups.
One patient was excluded from the gene polymorphisms–concentration association analysis because of an extremely low concentration of TAM (44.9 ng/mL) which was lower than 20% of the median concentration. This low concentration might result from nonadherence or other unknown factors. The patient interview nonadherence screening method may overestimate medication adherence in some instances. Saladores et al reported the use of plasma TAM concentration as a criterion for medication adherence screening in breast cancer patients and they found that 39/587 of patients were excluded from the analysis based on this adherence screening method.25
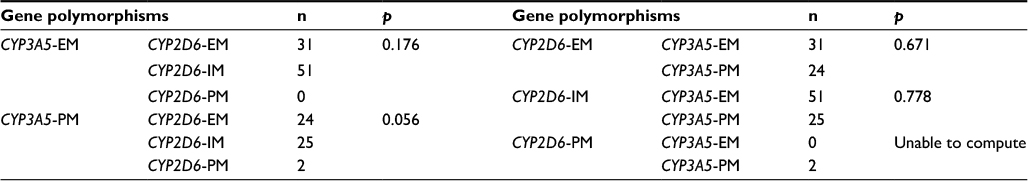
The concentrations of TAM and its metabolites were not significantly different between the combined CYP2D6 and CYP3A5 phenotypes (Table 5), even though TAM concentration was significantly different between the CYP2D6 phenotypes (Table 2) which might have resulted from the effect of several enzymes involved in the TAM metabolic pathway.1,2,8–10 However, the same baseline concentration of TAM was present before applying the gene polymorphisms–concentrations association analysis. Since there are several TAM metabolic subpathways and several enzymes are involved in each subpathway,1,2,8–10,18 the MR of these metabolites were used to adjust the baseline concentration of each metabolite formed in each TAM metabolic subpathway. The MR (TAM-NDMT) and MR (NDMT-END) were significantly different between different combined CYP2D6 and CYP3A5 phenotypes (p=0.032 and p=0.026, respectively; Table 5) and the CYP2D6 phenotype (p=0.013 and p=0.014, respectively; Table 3), but were not significantly different between different CYP3A5 phenotypes (p=0.831 and p=0.657, respectively; Table 4). These results revealed the main effect of the CYP2D6 phenotype on MR (TAM-NDMT) and MR (NDMT-END) without the effect of CYP3A5 phenotype on those metabolites. On the contrary, the MR (TAM-4OHT) was not significantly different between the combined CYP2D6 and CYP3A5 phenotypes (p=0.079; Table 5) or the CYP3A5 phenotype (p=0.508; Table 4), but was significantly different between the CYP2D6 phenotypes (p=0.017; Table 3). These conflicting results indicate the potential interaction between the CYP2D6 and CYP3A5 phenotypes in affecting MR (TAM-4OHT); therefore, the interaction between CYP2D6 and CYP3A5 was considered. According to the nonparametric tests that were used to perform the hypotheses testing in this research, the usual interaction test was of limited use. Instead, the trend graphs of the CYP2D6 and CYP3A5 phenotypes were plotted to see the possible interaction effect and the simple main effect test24 was subsequently performed to determine the effect of CYP2D6 and CYP3A5 on the MR (TAM-4OHT). No significant differences were detected when the CYP2D6 or CYP3A5 phenotypes were fixed in these simple main effect analyses, which confirmed that neither the CYP2D6 nor the CYP3A5 phenotypes affected the MR (TAM-4OHT; Table 6). However, the significance level between the different CYP2D6 phenotypes in the CYP3A5-PM group was such that the null hypothesis was nearly rejected, which implied that it is possible that the CYP2D6 polymorphisms might affect MR (TAM-4OHT) in the CYP3A5-PM group and might be responsible for the statistically significant results concerning MR (TAM-4OHT) between the different CYP2D6 phenotypes (Table 3).
 | Table 6 Simple main effect analysis of CYP2D6 and CYP3A5 phenotypes on MR (TAM-4OHT) Notes: The concentrations of TAM and its metabolites are presented as median (interquartile range). p=p value from Kruskal–Wallis test. Abbreviations: 4OHT, 4-hydroxytamoxifen; EM, extensive metabolizer; IM, intermediate metabolizer; MR, metabolic ratios; PM, poor metabolizer; TAM, tamoxifen. |
The MR (4OHT-END) was not significantly different between the combined CYP2D6 and CYP3A5 phenotype (p=0.622; Table 5), the CYP2D6 phenotype (p=0.594; Table 3) or the CYP3A5 phenotype (p=0.400; Table 4), which suggested that CYP2D6 or CYP3A5 phenotype did not affect the MR (4OHT-END).
These results suggested that the effect of the CYP2D6 phenotype on MR (TAM-NDMT) and MR (NDMT-END) does not involve effects from the CYP3A5 phenotype on these metabolites. These results correspond to those of a study by Mürdter et al which found that the CYP2D6 phenotype was associated with MR (NDMT-END; p<10−16),9 another study by Saladores et al which suggested that CYP2D6 made 53% of the contribution toward an MR (NDMT-END)25 and previous studies by Lim et al16 and Fernández-Santander et al15 which suggested no association between CYP3A5 polymorphisms and plasma concentrations of TAM and its metabolites.
In Figure 1, the CYP2D6 and CYP3A5 phenotypes are represented by the CYP2D6 and CYP3A5 polymorphisms, respectively, while the MR (TAM-NDMT) and MR (TAM-4OHT) are represented by the NDMT and 4OHT concentrations, respectively, and the MR (NDMT-END) is represented by the END concentrations through the NDMT subpathway (Figure 1) and the MR (4OHT-END) is represented by the END concentrations through the 4OHT subpathway (Figure 1). These MR analyses were useful for discriminating END concentrations through the NDMT subpathway, which is the main pathway for END formation from another minor subpathway through 4OHT. In conclusion, this study suggests that the effects of the CYP2D6 polymorphisms on NDMT and END concentrations occur through the NDMT subpathway, but the CYP3A5 polymorphisms did not produce these effects on the concentrations of TAM and its metabolites.
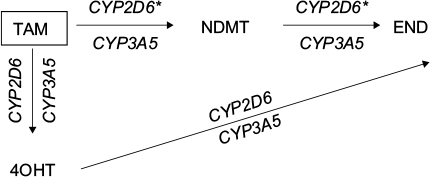 | Figure 1 TAM metabolic pathways and their interaction with CYP2D6 and CYP3A5 polymorphisms. Note: *Shows significant differences. Abbreviations: 4OHT, 4-hydroxytamoxifen; END, endoxifen; NDMT, N-desmethyl tamoxifen; TAM, tamoxifen. |
Limitations
Firstly, a comedications list was collected from a hospital database and patient medical records were used for drug–drug interaction screening without plasma drug level determination, which might lead to over- or underestimation of the drug–drug interaction problem. Secondly, medication adherence was assessed using a face-to-face interview with the patients without other medication adherence assessment tools, which might lead to overestimation of patient medication adherence. Thirdly, plasma concentrations of TAM and its metabolites were determined using HPLC with a fluorescence detector. Some extrapolations for NDMT concentration (78 patients) and END concentration (1 patient) need to be taken into account when reporting the accuracy of the quantification of these metabolites. However, the relevant hypotheses testing results should not be affected by these limitations, according to the nonparametric analyses which were based on the rank sum test rather than their actual values. Finally, genes encoding other metabolizing enzymes that are involved in the TAM metabolic pathway, such as CYP2C9, CYP2C19 or CYP3A4, might need to be explored to yield more concise findings.
These results can be further applied to identify a high-risk patient group for potential ineffective TAM treatment, in terms of their genetic background resulting in low concentrations of its active metabolites. This information could be used to improve medication plans by adjusting TAM dosage based on individual genetic factors. However, the associations between the polymorphisms, plasma concentrations of TAM and its metabolites and true clinical outcomes should be confirmed before these results can be applied in clinical practice.
Acknowledgments
This research was funded by the thesis grant for doctoral degree student of the National Research Council of Thailand (NRCT; 2015) and the 90th Anniversary of Chulalongkorn University Scholarship (2015).
Disclosure
The authors report no conflicts of interest in this work.
References
Klein DJ, Thorn CF, Desta Z, Flockhart DA, Altman RB, Klein TE. PharmGKB summary: tamoxifen pathway, pharmacokinetics. Pharmacogenet Genomics. 2013;23(11):643–647. | ||
Saladores PH, Precht JC, Schroth W, Brauch H, Schwab M. Impact of metabolizing enzymes on drug response of endocrine therapy in breast cancer. Expert Rev Mol Diagn. 2013;13(4):349–365. | ||
Rae JM, Drury S, Hayes DF, et al. CYP2D6 and UGT2B7 genotype and risk of recurrence in tamoxifen-treated breast cancer patients. J Natl Cancer Inst. 2012;104(6):452–460. | ||
Karle J, Bolbrinker J, Vogl S, et al. Influence of CYP2D6-genotype on tamoxifen efficacy in advanced breast cancer. Breast Cancer Res Treat. 2013;139(2):553–560. | ||
Regan MM, Leyland-Jones B, Bouzyk M, et al. CYP2D6 Genotype and tamoxifen response in postmenopausal women with endocrine-responsive breast cancer: the breast international group 1–98 trial. J Natl Cancer Inst. 2012;104(6):441–451. | ||
Westbrook K, Stearns V. Pharmacogenomics of breast cancer therapy: an update. Pharmacol Ther. 2013;139(1):1–11. | ||
Binkhorst L, Mathijssen RHJ, Ghobadi Moghaddam-Helmantel IM, et al. Quantification of tamoxifen and three of its phase-I metabolites in human plasma by liquid chromatography/triple-quadrupole mass spectrometry. J Pharm Biomed Anal. 2011;56(5):1016–1023. | ||
Kiyotani K, Mushiroda T, Nakamura Y, Zembutsu H. Pharmacogenomics of tamoxifen: roles of drug metabolizing enzymes and transporters. Drug Metab Pharmacokinet. 2012;27(1):122–131. | ||
Mürdter TE, Schroth W, Bacchus-Gerybadze L, et al. Activity levels of tamoxifen metabolites at the estrogen receptor and the impact of genetic polymorphisms of phase I and II enzymes on their concentration levels in plasma. Clin Pharmacol Ther. 2011;89(5):1–10. | ||
Barginear MF, Jaremko M, Peter I, et al. Increasing tamoxifen dose in breast cancer patients based on CYP2D6 genotypes and endoxifen levels: effect on active metabolite isomers and the antiestrogenic activity score. Clin Pharmacol Ther. 2011;90(4):605–611. | ||
Zafra-Ceres M, de Haro T, Farez-Vidal E, et al. Influence of CYP2D6 polymorphisms on serum levels of tamoxifen metabolites in Spanish women with breast cancer. Int J Med Sci. 2013;10(7):932–937. | ||
Ratain MJ, Nakamura Y, Cox NJ. CYP2D6 genotype and tamoxifen activity: understanding interstudy variability in methodological quality. Clin Pharmacol Ther. 2013;94(2):185–187. | ||
Hertz DL, McLeod HL, Irvin Jr WJ. Tamoxifen and CYP2D6: a contradiction of data. Oncologist. 2012;17(5):620–630. | ||
Teh LK, Bertilsson L. Pharmacogenomics of CYP2D6: molecular genetics, interethnic differences and clinical importance. Drug Metab Pharmacokinet. 2012;27(1):55–67. | ||
Fernández-Santander A, Gaibar M, Novillo A, et al. Relationship between genotypes Sult1a2 and Cyp2d6 and tamoxifen metabolism in breast cancer patients. PLoS One. 2013;8(7):e70183. | ||
Lim JS, Chen XA, Singh O, et al. Impact of CYP2D6, CYP3A5, CYP2C9 and CYP2C19 polymorphisms on tamoxifen pharmacokinetics in Asian breast cancer patients. Br J Clin Pharmacol. 2011;71(5):737–750. | ||
Chamnanphon M, Pechatanan K, Sirachainan E, et al. Association of CYP2D6 and CYP2C19 polymorphisms and disease-free survival of Thai post-menopausal breast cancer patients who received adjuvant tamoxifen. Pharmacogenomics Pers Med. 2013;6(1):37–48. | ||
Charoenchokthavee W, Panomvana D, Sriuranpong V, Areepium N. Prevalence of CYP2D6*2, CYP2D6*4, CYP2D6*10, and CYP3A5*3 in Thai breast cancer patients undergoing tamoxifen treatment. Breast Cancer (Dove Med Press). 2016;8:149–155. | ||
Areepium N, Panomvana D, Rungwanonchai P, Sathaporn S, Voravud N. Effects of CYP2D6 and UGT2B7 polymorphisms on pharmacokinetics of tamoxifen in Thai breast cancer patients. Breast Cancer (Dove Med Press). 2013;5:73–78. | ||
Charoenchokthavee W, Ayudhya DP, Sriuranpong V, Areepium N. Effects of SULT1A1 copy number variation on estrogen concentration and tamoxifen-associated adverse drug reactions in premenopausal Thai breast cancer patients: a preliminary study. Asian Pac J Cancer Prev. 2016;17(4):1851–1855. | ||
Faul F, Erdfelder E, Lang A-G, Buchner A. G*Power 3: a flexible statistical power analysis program for the social, behavioral, and biomedical sciences. Behav Res Methods. 2007;39(2):175–191. | ||
Cohen Jacob. Statistical Power Analysis for the Behavioral Sciences. 2nd ed. Hillsdale, NJ: Lawrence Erlbaum Associates; 1988. | ||
Zhu YB, Zhang Q, Zou JJ, Yu CX, Xiao DW. Optimizing high-performance liquid chromatography method with fluorescence detection for quantification of tamoxifen and two metabolites in human plasma: application to a clinical study. J Pharm Biomed Anal. 2008;46(2):349–355. | ||
Kirk RE. Experimental Design: Procedures for the Behavioral Sciences. 4th ed. Thousand Oaks, CA: SAGE; 2013. | ||
Saladores P, Murdter T, Eccles D, et al. Tamoxifen metabolism predicts drug concentrations and outcome in premenopausal patients with early breast cancer. Pharmacogenomics J. 2014;15(1):84–94. | ||
Lien EA, Søiland H, Lundgren S, et al. Serum concentrations of tamoxifen and its metabolites increase with age during steady-state treatment. Breast Cancer Res Treat. 2013;141(2):243–248. |
 © 2017 The Author(s). This work is published and licensed by Dove Medical Press Limited. The full terms of this license are available at https://www.dovepress.com/terms.php and incorporate the Creative Commons Attribution - Non Commercial (unported, v3.0) License.
By accessing the work you hereby accept the Terms. Non-commercial uses of the work are permitted without any further permission from Dove Medical Press Limited, provided the work is properly attributed. For permission for commercial use of this work, please see paragraphs 4.2 and 5 of our Terms.
© 2017 The Author(s). This work is published and licensed by Dove Medical Press Limited. The full terms of this license are available at https://www.dovepress.com/terms.php and incorporate the Creative Commons Attribution - Non Commercial (unported, v3.0) License.
By accessing the work you hereby accept the Terms. Non-commercial uses of the work are permitted without any further permission from Dove Medical Press Limited, provided the work is properly attributed. For permission for commercial use of this work, please see paragraphs 4.2 and 5 of our Terms.