")
Back to Journals » Drug Design, Development and Therapy » Volume 16
Effects of Cartilage Progenitor Cells, Bone Marrow Mesenchymal Stem Cells and Chondrocytes on Cartilage Repair as Seed Cells: An in vitro Study
Authors Gu J, Wang B, Wang T, Zhang N, Liu H, Gui J, Lu Y
Received 3 January 2022
Accepted for publication 11 April 2022
Published 28 April 2022 Volume 2022:16 Pages 1217—1230
DOI https://doi.org/10.2147/DDDT.S356936
Checked for plagiarism Yes
Review by Single anonymous peer review
Peer reviewer comments 3
Editor who approved publication: Dr Georgios Panos
Jiaxiang Gu,1,2,* Bin Wang,1,2,* Tianliang Wang,1,2 Naichen Zhang,1,2 Hongjun Liu,1,2 Jianchao Gui,3 Yiming Lu1,2
1Clinical Medical College, Yangzhou University, Yangzhou, People’s Republic of China; 2Department of Foot and Hand Surgery, Northern Jiangsu People’s Hospital, Yangzhou, People’s Republic of China; 3Department of Orthopedics, Nanjing Medical University Affiliated Nanjing First Hospital, Nanjing, People’s Republic of China
*These authors contributed equally to this work
Correspondence: Yiming Lu, Email [email protected]
Purpose: To determine the effects of cartilage progenitor cells, bone marrow mesenchymal stem cells and chondrocytes on cartilage repair as seed cells.
Methods: Porcine cartilage progenitor cells (CPCs), bone marrow mesenchymal stem cells (BMSCs) and chondrocytes (CCs) were obtained from the femoropatellar joints of young pigs, and seeded in agarose gel as a graft. During the 28-day culture, proliferation ability was measured by MTT assay, and gene expression of Collagen I, Collagen II, Aggrecan and SOX 9 were measured by qPCR. Qualitative and quantitative analysis of collagen, glycosaminoglycan and DNA were appraised by immunohistochemical staining and biochemical assay, and integration strength was analyzed by push-out tests.
Results: After 28-day culture, proliferation ability of CPCs and BMSCs was higher than CCs. Collagen, glycosaminoglycan, DNA content and chondrocyte-related genes expression in the cartilage progenitor cells seeded gel were significantly higher than the other two gels. Integration strength in the cartilage progenitor cells seeded gel was also higher compared with the other two gels.
Conclusion: Compared with CCs and BMSCs, CPCs in vitro have dominance in the ability of cell proliferation and differentiation as seed cells in tissue engineering.
Keywords: cartilage progenitor cells, tissue engineering, cartilage repair
Introduction
Osteoarthritis (OA) is the most common degenerative joint disease characterized by progressive destruction of articular cartilage, subchondral bone changes, bone hyperplasia, and inflammation of the synovium. The pathogenesis of OA has not been fully elucidated, and lack of effective treatments to prevent, delay or reverse the course of the disease is currently one of the main reasons for pain and disability in the middle-aged and elderly people.1 Injury of articular cartilage plays an important role in the pathogenesis of OA; due to the absence of vessels and nerves, articular cartilage has limited capacity for intrinsic healing and regeneration upon injury, and various repair treatment strategies have not achieved satisfactory results.2,3
Articular cartilage is hyaline cartilage essentially. It is composed of dense extra-cellular matrix (ECM) with a sparse distribution of highly specialized cells called chondrocytes (CCs), which account for only 5% of normal cartilage tissue and synthesise collagen, proteoglycan and other ECM components. The ECM primarily includes water, various collagens, proteoglycans, non-collagenous proteins and other ECM components.4 Because of the strong self-renewal ability to differentiate into specific tissues, mesenchymal stem cells (MSCs) have been used as seed cells for cartilage repair.2 There have been many reports of MSCs derived from different tissues, including bone marrow mesenchymal stem cells (BMSCs), adipose-derived MSCs (ADSCs) and synovial fluid-derived stem cells. After being expanded in vitro, they can be implanted in the body by local transplantation or injection. To a certain extent, this promotes the regeneration of cartilage and delays the process of OA.5,6 But after in vitro expansion, MSCs are prone to changes such as senescence and terminal differentiation. At the same time, there are some tissue-specific problems, that is, the regeneration and differentiation ability of MSCs are closely related to their tissue sources.6 For example, BMSCs have a strong potential for spontaneous osteogenic differentiation. Even under the conditions of in vitro chondrogenesis, the synthesized matrix is mainly type I collagen, which produces fibrocartilage instead of normal hyaline cartilage. Moreover, the potential hypertrophic differentiation ability of BMSCs can induce the calcification of new fibrocartilage tissue through the endochondral osteogenesis pathway.7,8 Therefore, the application of non-cartilage-derived MSCs has certain limitations in cartilage repair.
Previously scholars believed that mature CCs are the only cell type present in articular cartilage tissue, but Barbero et al. found that after monolayer culture and expansion, a small number of cells have the ability of osteogenic, chondrogenic and adipogenic differentiation.9 Subsequently, a number of studies have confirmed that there is indeed a subgroup of CCs with self-proliferation, stem cell surface antigen expression characteristics and multidirectional differentiation potential into articular cartilage, namely cartilage progenitor cells (CPCs).10 This provides new seed cells and intervention targets for the repair of articular cartilage in OA. We hope to compare the pros and cons of BMSCs, CCs and CPCs as seed cells through in vitro integrated models, and provide a theoretical basis for autologous chondrocyte implantation (ACI). We hypothesize that, among the three cells, CPCs will have the best proliferation and differentiation and can best repair the full-thickness cartilage defect in vitro, which is not well studied.
Materials and Methods
Cell Isolation and Culture
About 50 mL bone marrow (BM) was harvested from porcine anterior superior spine after anesthesia. BM was incubated in hypotonic buffer (154 mM NH4Cl, 10 mM KHCO3, 0.1 mM EDTA) for 10 min at room temperature under constant shaking. After centrifuging for 5 min at 400× g, the pellet was washed with 1× phosphate-buffered saline (PBS) and centrifuged once again. The cell pellet was resuspended in 1 mL expansion medium.11 The remaining cartilage blocks after the construct in cartilage-ring model described below were chopped into small cubes which were less than 1 cubic millimeters, and digested by 0.2% collagenase in Dulbecco’s modified Eagle’s medium (DMEM, GIBCO, USA) for 16 h in an incubator at 37°C and 5% CO2. The digested tissue was sieved through a 150 mM sieve immediately after digesting by fetal bovine serum (FBS, GIBCO, Australia) was stopped, then collected by centrifugation (1200 r/min, 5 min) and washed with PBS three times. Petri dishes (35 mm) were coated with 10 g/mL fibronectin in 0.1 M PBS containing 1 mM MgCl2 and 1 mM CaCl2 overnight at 4°C. CCs and CPCs were separated on the basis of the differential adhesion to fibronectin as described previously.12 BMSCs, CCs and CPCs were cultured in DMEM containing 10% FBS, 200 mM glutamine, 50 ug/mL ascorbate, penicillin and streptomycin. Specific markers of CPCs, including Notch-1, integrin ɑ5β1, SOX-9, and RUNX-2, were examined. CD105, CD166, CD34, and CD45 were also examined by flow cytometry and immunocytochemistry at Passage 3.13
Construction of Agarose Gels
Cells at Passage 3 were collected and re-suspensed in PBS for use at a concentration of 20×106 cells/mL, then mixed with equal parts of 4% low melting point agarose in PBS at 40°C to yield 2% (w/v) hydrogel suspension. The above hydrogels were added into the 24-well culture plate at a height of 4 mm, and cooled down in refrigerator at 4°C for 10 min. Later the gels were collected by a 3-mm biopsy punch and pushed out using the vessel forceps and cultured in DMEM supplemented with 10% FBS in 12-well culture plates at 37°C and 5% CO2; the culture medium was changed every 3 days.
Cartilage Integration Construct Assembly and Culture
An established “construct in cartilage-ring model” was applied as described previously.14,15 Articular cartilage was aseptically harvested from the femoropatellar joints of young pigs (7 months old). Cartilage rings (Ø6×2 mm thickness) with a 3 mm inner hole were created as cartilage explants. The cartilage tissues, left after harvesting the explants, were used for CCs and CPCs isolation. Cartilage rings and cells were harvested from ten different animals, and each integration construct containing the cells introduced above was formed from the same animal. The explants were incubated in DMEM culture medium supplemented with 10% FBS, 200 mM glutamine, 50 ug/mL ascorbate, penicillin and streptomycin in an incubator at 37°C and 5% CO2. The hydro gels described above were put into the inner hole, then explant-gel constructs were cultured in DMEM supplemented with 10% FBS, 200 mM glutamine, 50 ug/mL ascorbate, penicillin and streptomycin in an incubator at 37°C and 5% CO2; the culture medium was changed every 3 days.
Cell Proliferation Measurement
The proliferation of cells in gels was measured by MTT assay in vitro at Days 1, 4, 7, 10, 14, 21. 400 mL MTT solution (0.5 mg/mL) was added to the samples and incubated for 4 h at 37°C in a 96-well culture plate. At the end of incubation time (1, 4, 7, 10, 14 and 21 days), the culture media was removed and MTT dye solution was added for 4 hours. At the end of 4 hours, the MTT solution was removed and formazan crystals were dissolved in DMSO. The optical density (OD) of each well was measured using a plate analyzer (BD, USA) in a dual wavelength measuring system at a test wavelength of 540 nm, with a reference wavelength of 630 nm.
Histology and Immunohistochemistry
Samples were put into liquid nitrogen after leaving the culture medium immediately and then frozen-embedded, sectioned at 10 mM thickness by using a Leica CM 3000 cryostat (Leica, Germany). Safranin O staining was observed. Immunohistochemical staining was performed to verify the presence of Collagen II. Briefly, slides were rinsed with PBS, quenched of peroxidase activity, and blocked with goat serum for 2 h. Sections were then incubated overnight with mouse monoclonal anti-collagen II (clone ab3092, 1:100 dilution; Abcam), followed by a 1 h treatment with the secondary goat anti mouse polyclonal antibody. Then, the sections were exposed to the Peroxidase DAB substrate kit (Vector Laboratories). The first antibody was replaced by PBS washed three times. Finally, the samples were incubated in 3, 3’-diaminobenzidine tetrahydrochloride solution (Keygen, China). The nuclei were counterstained with hematoxylin.
Biochemical Assay
The three types of gels which were incorporated with cells were harvested at Weeks 1, 2 and 4 for biochemical assay. All samples were digested by papain solution (5 mM L-cysteine, 100 mM Na2HPO4, 5 mM EDTA, 125 mg/mL papain) at 60°C for 18 h. Glycosaminoglycan (GAG) content was quantified by the 1,9-dimethyl methylene blue (DMMB) dye binding assay kit (Blyscan, Biocolor Ltd, Northern Ireland). DNA content was determined by the Hoechst 33,258 dye method using the DNeasy blood tissue assay kit (QIAgen, Germany). Total collagen content was determined by measuring the hydroxyproline content, using a hydroxyproline-to-collagen ratio of 1:7.69. Each biochemical constituent (DNA, GAG and collagen) was normalized to the tissue wet weight.
Real-Time Quantitative Polymerase Chain Reaction
The expression levels of the Collagen I, Collagen II, Aggrecan and SOX 9 were measured by real-time polymerase chain reaction (RT-PCR).16 Total RNA was extracted from samples using TRIzol extraction buffer (Invitrogen, USA). The samples were harvested at Weeks 1, 2 and 4 and dissolved in 1 mL TRIzol and the total RNA was extracted following the manufacturer’s instruction. Briefly, 2 µg total RNA was reverse transcribed into cDNA using a cDNA first strand synthesis kit (Fermentas, Lithuania) in a 20 µL reaction using a real-time fluorescent quantitative polymerase chain reaction (PCR) instrument (DA7600, Daan Gene, China). An aliquot (1 µL) of a 10× cDNA template solution was used for each 20 µL reaction together with 10 µM forward and reverse primers, and Real-time PCR Master Mix (TOYOBO, Japan). RT-PCR analysis was conducted and monitored using a real-time fluorescent quantitative PCR instrument (DA7600, Daan Gene, China). The primer sequences in the RT-PCR reaction were chosen according to Park.17 Three samples under each condition were used for measurement to calculate the means and standard deviations (n = 3).
Mechanical Testing
The integrative strength of the native/engineered tissue interface was measured by the push-out test, using the ELF3200 system (Enduratec) and was calculated as the failure stress. Briefly, the integration construct was rested on a custom-made rigid ring with a 4-mm-diameter central hole (Changzhou Orthopedics Instrument Factory). The inside core was then pushed out by a plunger with a diameter (2.5 mm) slightly less compared with the gel. The maximum force recorded before separation of the interface was normalized to the lateral surface area of the core, and the resulting value was considered the failure stress.
Statistical Analysis
The mean ± standard deviations was calculated for each group of samples and all data were assessed for normal distribution using the Anderson–Darling test. Three independent experiments were performed. Statistical significance was calculated using one-way analysis of variance and Bonferroni post-hoc test, with P < 0.05 considered as being statistically significant.
Results
Isolation and Characterization of CPCs
The morphology of CPCs was shown using a microscope (Figure 1A). Most of the cells expressed specific markers of CPCs, including Notch-1, integrin ɑ5β1, SOX-9, and RUNX-2 (Figure 1B). Moreover, the CPCs expressed cell surface antigens that are typically found on stem cells. CPCs at Passage 3 were homogeneously positive for CD105 (94.30%) and CD166 (95.11%) but were negative for the hematopoietic surface antigen CD34 (3.91%) and the leukocyte common antigen CD45 (4.61%) (Figure 1C).
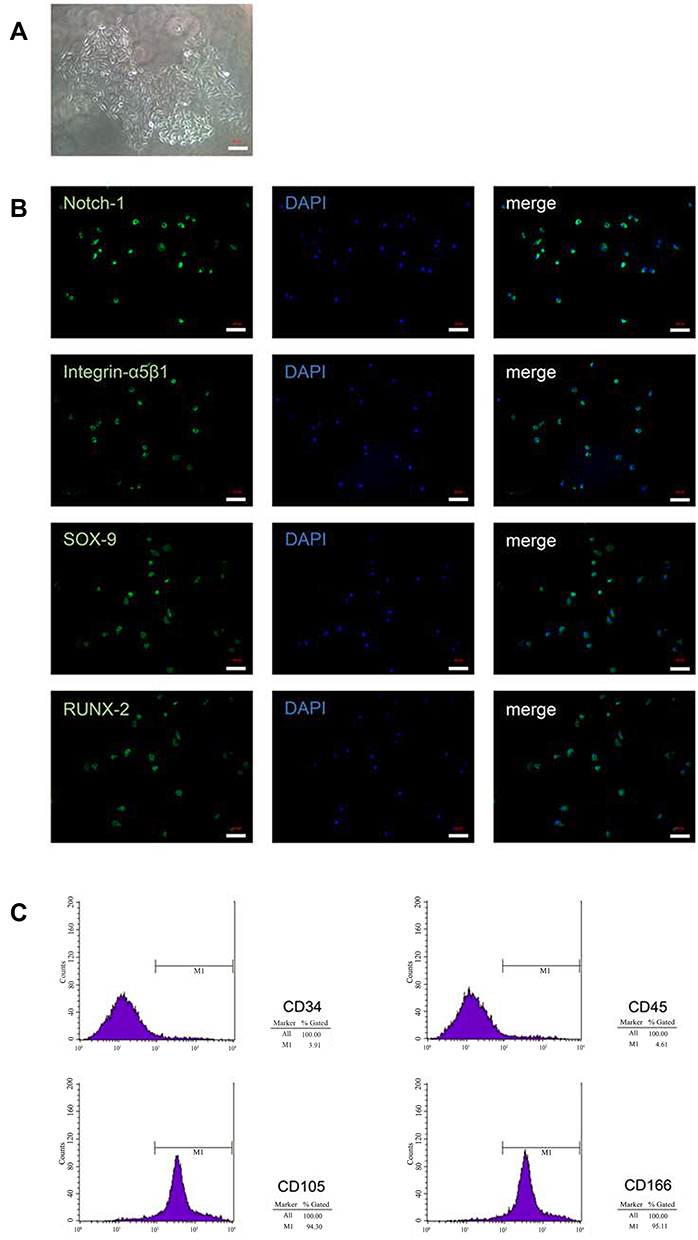 |
Figure 1 Isolation and characterization of CPCs. (A) Morphological characteristics were shown for colonies obtained from full-thickness cartilage after cells were cultured for 7 days (×20). (B) Immunofluorescence results for marker proteins (Notch-1, Integrin ɑ5β1, SOX-9 and RUNX-2) in CPCs (×20). (C) Flow cytometric analysis for CPCs surface markers. Scale bar = 100 µm. Abbreviation: CPCs, chondrogenic progenitor cells. |
Cartilage Integration Model Formation and Culture
The cartilage tissue mass was aseptically harvested from the femoropatellar joints of young pigs with 2 mm thickness (Figure 2A). The macroscopic view of the three types of gels and cartilage rings are displayed in Figure 2B (above: BMSCs; middle: CCs; below: CPCs). The diameter of the gels was 6 mm and the height was 4 mm. Cartilage rings (Ø6×2 mm thickness) with a 3 mm inner hole were created as cartilage explants (Figure 2C) and with gel inside cultured for 28 days (Figure 2D).
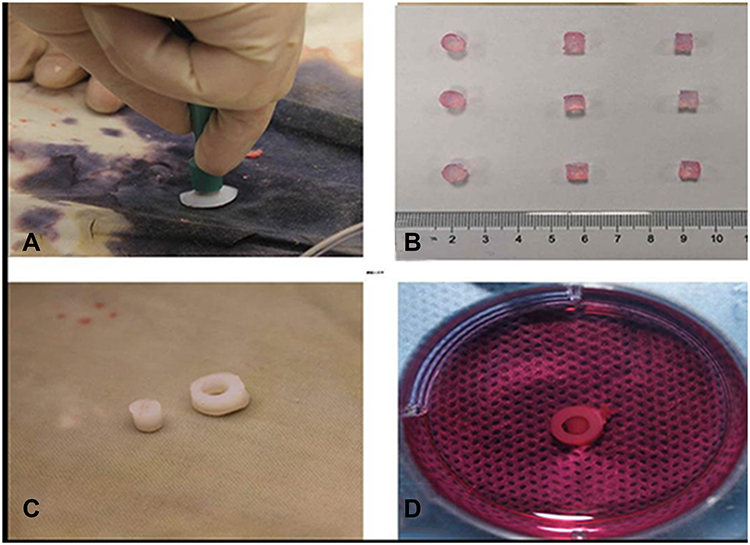 |
Figure 2 Construct in cartilage-ring model. (A) The cartilage tissue mass with 2 mm thickness. (B) The macroscopic view of the three types of gels (above: BMSCs; middle: CCs; below: CPCs). (C) Cartilage rings (Ø6×2 mm thickness) with a 3 mm inner hole were created as cartilage explants. (D) The cartilage-ring with CPCs gel inside was cultured for 28 days. |
Cell Proliferation Assay by MTT
The proliferation of cells which seeded in the agarose was assessed by MTT assay (Figure 3). In the figure, cells proliferation was monotonously increased from Day 1 to Day 21. The OD values of the three types of cells seeded in gels were similar on Day 0, suggested that almost the same cell density of three types of cells was seeded in gels. The OD values of BMSCs on Day 7 was 2.23-fold compared with CCs, and the OD values of CPCs on Day 7 was 2.69-fold compared with CCs. The OD values of BMSCs and CPCs on Day 7 increased 5.81-fold and 7.02-fold compared with on Day 1. The results showed that the BMSCs and CPCs seeded in agarose proliferated more quickly than CCs in the first 7 days. Meanwhile, the OD values of BMSCs on Day 14 and Day 21 were only 2.44-fold and 2.16-fold compared with CCs in agarose, while the OD values of CPCs on Day 14 and Day 21 were only 2.67-fold and 2.42-fold compared with CCs respectively. However, the OD values of CPCs on Day 7 increased only 1.41-fold compared with on Day 21, while the OD values of BMSCs increased only 1.31-fold compared with on Day 21. Obviously, the proliferation of all three types of cells slowed down significantly after 10 days. There were no statistical significances between the OD values of BMSCs and CPCs at all points in time, while there were statistical significances between the OD values of CCs and BMSCs or CPCs at Days 4, 7, 10, 14, 21.
 |
Figure 3 Cell proliferation assay by MTT. This result showed that during the 21 culture days, the BMSCs and CPCs showed the faster proliferation rate than CCs, especially in the initial 7 days. *p <0.05. Abbreviations: CCs, chondrocytes; CPCs, cartilage precursor cells; BMSCs, bone marrow mesenchymal stem cells. |
Biochemical Assay
The contents of GAG, collagen and DNA were examined in the three groups on Days 7, 14 and 28 (Figure 4). The contents of GAG, collagen and DNA were increased in the three groups over the culture time. There was no significant difference between GAG content (CCs: 0.223±0.016%; BMSCs: 0.215±0.014%; CPCs: 0.243±0.014%) and collagen content (CCs: 0.229±0.014%; BMSCs: 0.243±0.018%; CPCs: 0.242±0.02%) on Day 7 in three groups, while there were significant differences between DNA content (CCs: 0.0057±0.0006%; BMSCs: 0.014±0.0006%; CPCs: 0.017±0.0006%) in the three groups. However, at the time point of Day 14, the contents of GAG and collagen in CPCs (GAG: 1.345±0.038%; collagen: 1.350±0.073%) were significantly higher than in BMSCs (GAG: 0.516±0.030%; collagen: 0.521±0.071%) and CCs (GAG: 0.449±0.030%; collagen: 0.467±0.071%), while the content of DNA in CPCs (0.0638 ±0.003%) and BMSCs (0.0617±0.005%) was significantly higher than in CCs (0.0130 ±0.005%). Meanwhile, the GAG and collagen contents in CPCs (GAG: 2.897±0.153%, collagen: 2.825±0.138%) were significantly higher than in BMSCs (GAG: 0.957±0.026%; collagen: 0.876±0.035%) and CCs (GAG: 0.873±0.026%; collagen: 0.821±0.035%) on Day 28. The DNA content in CPCs (0.068±0.004%) and in BMSCs (0.064±0.005%) were significantly higher than in CCs (0.017±0.001%). In summary, the proliferation of BMSCs and CPCs was faster than CCs in the initial 10 days, all types of cells slowed down significantly after 10 days, which was similar to the result of MTT assay. CPCs have a better response in proliferation and differentiation compared with BMSCs.
 |
Figure 4 Biochemical assays and push-out test: (A) GAG content. (B) collagen content. (C) DNA content of three types of cells seeded in agarose gels on Days 7, 14, 28. (D) amount of GAG normalized to the corresponding DNA values. (E) amount of collagen normalized to the corresponding DNA values. (F) failure stress during push-out testing for three groups on Day 28. **p <0.01, *p <0.05. Abbreviations: GAG, glycosaminoglycan; CCs, chondrocytes; CPCs, cartilage precursor cells; BMSCs, bone marrow mesenchymal stem cells. |
Histological and Immunohistochemical Analysis
Histological staining by Safranin O from 5A to 5I and immunohistochemical staining by Collagen II from 5J to 5R, were used to examine the presence of proteoglycan which were mainly composed of ECM, and Collagen II (Figure 5). It demonstrated that the accumulation of sulfated proteoglycan increased more slowly in BMSCs than in CCs, which was also more slow than CPCs in the initial 2 weeks. After 28 days culture, CPCs showed more proteoglycan accumulation rather than in BMSCs and CCs. Immunohistochemical staining of Collagen II also demonstrated a similar result with histological staining of Safranin O.
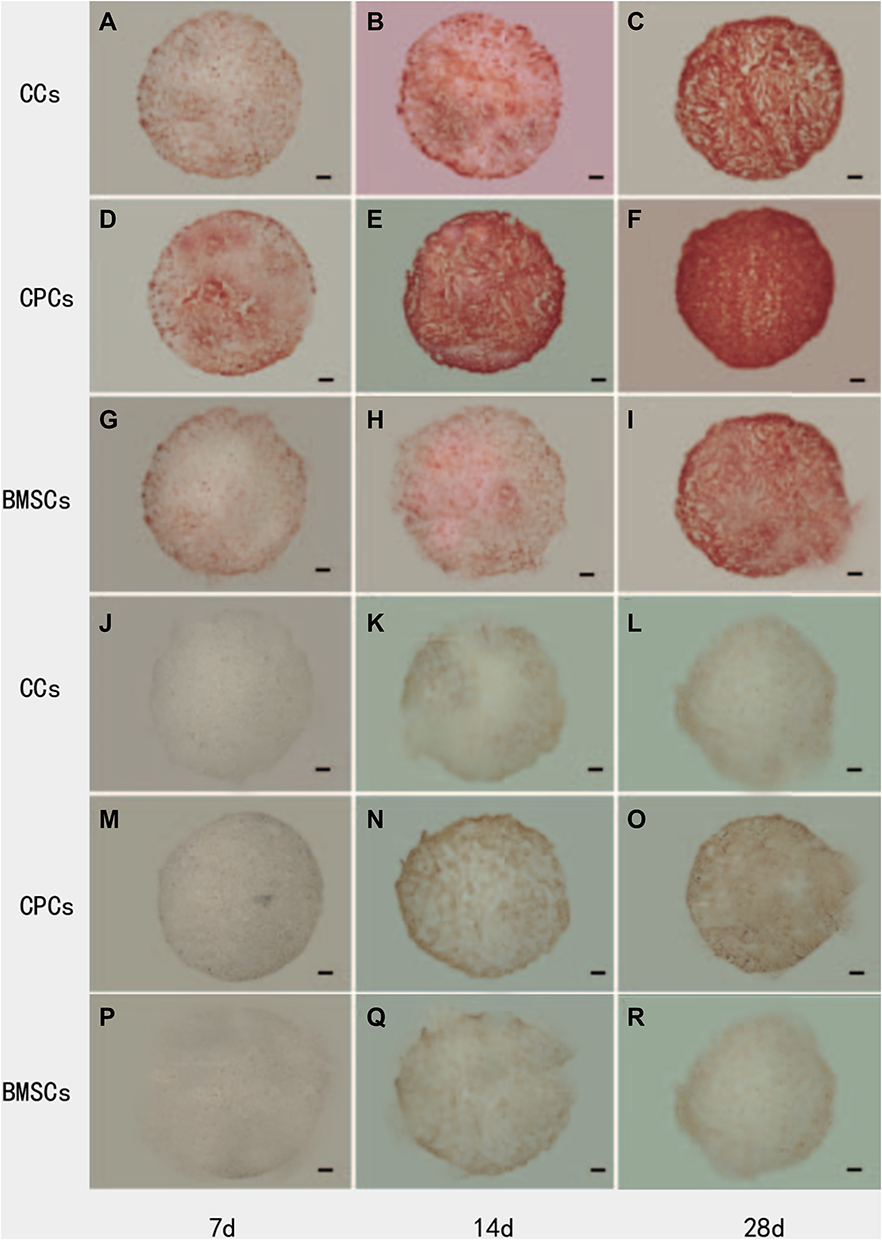 |
Figure 5 Safranin O (SO) staining for the presence of sulfated proteoglycans and immunohistochemical staining for the presence of Collagen II (Col II). (A–C) SO staining of CCs group at Day 7, Day 14 and Day 28; (D–F) SO staining of CPCs group at Day 7, Day 14 and Day 28; (G–I) SO staining of BMSCs group at Day 7, Day 14 and Day 28; (J–L) Col II staining of CCs group at Day 7, Day 14 and Day 28; (M–O) Col II staining of CPCs group at Day 7, Day 14 and Day 28; (P–R) Col II staining of BMSCs group at Day 7, Day 14 and Day 28. Proteoglycans was gradually accumulated in the three groups with time. However, the denser staining of Safranin O first appeared in CPCs at 14-days culture. Similar distribution and trend of Collagen II staining were found compared with proteoglycans. Scale bar = 500 mm. |
Real-Time Polymerase Chain Reaction
The characteristics of the CCs, BMSCs and CPCs and their multilineage differentiation and cartilaginous matrix formation in vitro was evaluated by quantitative polymerase chain reaction (qPCR). The expression levels of Collagen I, Collagen II, Aggrecan and SOX 9 increased in all groups during the culture days (Figure 6). The expression levels of Collagen I, Collagen II and Aggrecan and SOX 9 were higher in CCs than in BMSCs and CPCs on Day 7. However, the expression levels rose quickly in CPCs compared with CCs and BMSCs on Day 14, especially on Day 28.
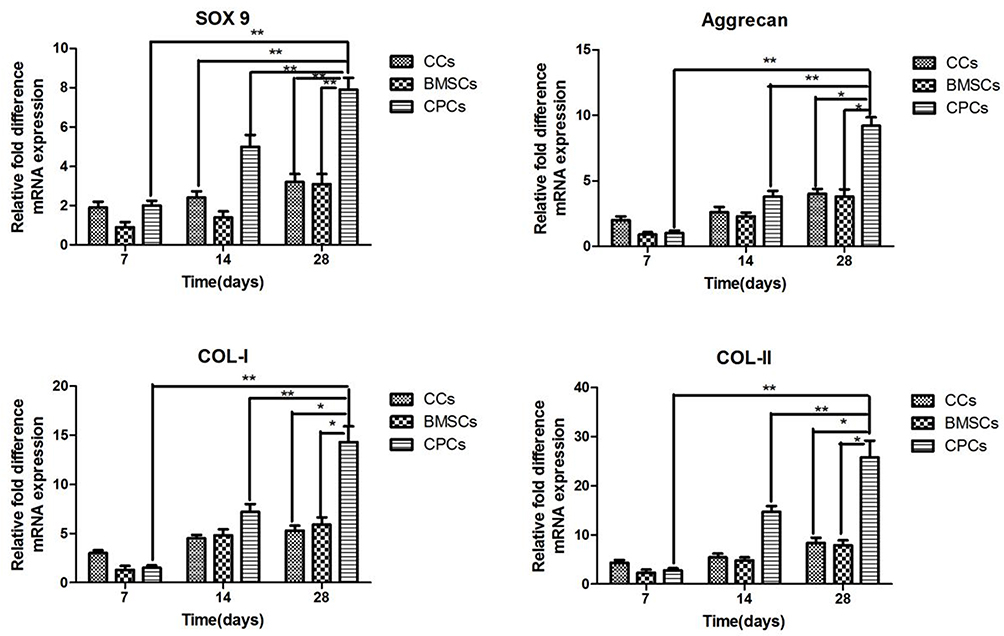 |
Figure 6 Multilineage differentiation and cartilaginous matrix formation of CCs, BMSCs and CPCs were evaluated by qPCR for the expression levels of Aggrecan, Collagen I, Collagen II and Sox-9. All samples were collected and normalized by GAPDH on Days 7, 14, 28. **p <0.01, *p <0.05. Abbreviations: GAPDH, glyceraldehyde 3-phosphate dehydrogenase; CCs, chondrocytes; CPCs, cartilage precursor cells; BMSCs, bone marrow mesenchymal stem cells. |
Integration of the Hydrogels with Cartilage Ring
The integration of the cartilage construct was examined by the presence of proteoglycans (Safranin O staining, Figure 7) and biomechanical test (Figure 4F). There was increasingly more ECM accumulated in the integration area during the culture. The gap between the engineered cartilage and the surrounding native cartilage was becoming smaller and smaller during the culture. It was detected that CPCs has the smallest gap and much more ECM in the integration area which led to the higher strength values (92±8.4 kPa) on Day 28 compared with BMSCs (68±7.6 kPa) and CCs (71.7±4.5 kPa).
 |
Figure 7 The integration area of neocartilage with the surrounding native cartilage was examined for the presence of proteoglycans by Safranin O (SO) on Days 7, 14 and 28. (A–C) SO staining of CCs group at Day 7, Day 14 and Day 28; (D–F) SO staining of CPCs group at Day 7, Day 14 and Day 28; (G–I) SO staining of BMSCs group at Day 7, Day 14 and Day 28. CPCs has the smallest gap and much more ECM in the integration area compared with BMSCs and CCs. Scale bar = 100 mm. Abbreviations: CCs, chondrocytes; CPCs, cartilage precursor cells; BMSCs, bone marrow mesenchymal stem cells. |
Discussion
Previous studies suggested that cartilage has poor repair ability.18–20 Therefore, the focus of cartilage repair is to culture and amplify cells in vitro and deliver the cells with scaffold into the lesions.18 However, CCs cultured in vitro are prone to dedifferentiation, the large defects at articular cartilage are often repaired by fibrocartilage rather than normal hyaline cartilage.19 BMSCs have a strong potential for spontaneous osteogenic differentiation. Even under the conditions of in vitro chondrogenesis, the synthesized matrix is mainly type I collagen, which produces fibrocartilage instead of normal hyaline cartilage. Therefore, there is no technique in use that can produce hyaline cartilage like normal cartilage at present. All techniques partially repair the function of cartilage, meaning degeneration of the joint is not avoided. According to a new study,20 CPCs from osteoarthritic knee joints have proved better chondrogenic ability than BMSCs and CCs in OA. There was doubt that CPCs could also play a crucial role in full thickness cartilage damage. It is extremely important to determine the role of CPCs in the repair of full-thickness cartilage damage in order to avoid the later development of OA.
Tissue engineering can be divided into three basic components: scaffold, seeded cells in the scaffold, and bioactive factors. The cells in the scaffold play the most important role during the process of tissue regeneration. They could migrate, proliferate, or differentiate to generate the main population in the new tissue and contribute to the tissue repair, just like a seed could grow into a great tree. CCs, BMSCs, ADSCs and synovial fluid-derived stem cells, were commonly used as seeded cells in cartilage repair. But all of them did not achieve the desired effect. CPCs provide new seed cells and intervention targets for the repair of articular cartilage in OA. CPCs were first identified in calf cartilage as a subpopulation of superficial zone cells characterized by a multipotential capacity, especially toward the chondrogenic lineage.21 In 2014, an article demonstrated that CPCs can be obtained from the full thickness of articular cartilage, although the superficial one-third layer has significantly more progenitor cells than the deeper two-thirds layer.22 To isolate and characterize CPCs, we utilized the adhesion to fibronectin and found that several biomarkers, such as SOX-9 and RUNX-2, which are the biomarkers for chondrogenic and osteogenic differentiation, are positive. Meanwhile, CPCs are positive for CD105 and CD166 and negative for CD34 and CD45. These biomarkers are consistent with the stem-cell standards defined by the International Society for Cellular Therapy (ISCT) in 2016.
It was reported that CPCs and CCs could be isolated by differential adhesion to fibronectin.12,21 CPCs can be separated using this method. CPCs can be harvested by flow cytometry based on the stem-cell characteristics or by collecting migratory cells from cartilage block cultures based on the different migration ability of CPCs and CCs. Admittedly, both of the two methods are laborious for getting a large number of CPCs in a short time, especially the second method, which needs 14 days to allow the migrating CPCs to transfer to a monolayer culture and reach 80% confluence.23–25 Therefore, we chose to enrich CPCs on the basis of their differential adhesion to fibronectin. The harvested cells were further characterized by flow cytometry and were shown to possess stem-cell characteristics.
Pretzel and Alsalameh found that the proportion of CPCs (CD105/CD166) in OA CCs was slightly higher than that in normal CCs.26,27 Mazor reported that the levels of CD105, CD166 and SOX9 mRNA in CCs from moderate OA were higher than those in CCs from severe OA.28 Meanwhile, it was reported that the proportion of CPCs in cartilage of severe OA (10.61%±6.97%) was significantly lower than normal cartilage (18.44%±9.97%).29 It is suggested that CPCs are closely related to the occurrence and development of OA. With a fluorescence protein labeled tracer technique, Seol found that cartilage injury could stimulate the initiation of the homing mechanism of CPCs by inducing CPCs.30 It was found that the multidirectional differentiation ability of CPCs was similar to that of BMSCs, but the spontaneous chondrogenic differentiation ability and cartilage regeneration function of CPCs was superior to BMSCs.31 However, Tao reported that there was a certain amount of CPCS aggregation at the early cartilage injury site of OA, but the ability of autonomous activation and chondrogenic differentiation cannot meet the requirements of autonomous cartilage repair.32 Induction and activation of CPCs is a potential strategy to promote the repair of early cartilage injury in OA.
Agarose gel is a common scaffold used in cartilage tissue engineering, and CCs seeded in agarose have been demonstrated to make a functional ECM in vitro and can form high quality neocartilage.33 In our study, we evaluated the seeded cells in the carrier/scaffold only, so agarose gel is suitable instead of ECM scaffold or other scaffold containing bioactive factors. Our experiment suggested that all three types of cells were highly concentrated and GAG and collagen were uniformly distributed inside the gel. There were less GAG and collagen synthesized in all three groups initially by histological and immunohistochemical staining. However, denser GAG and collagen were observed on Days 14 and 28, indicating higher proteoglycans and type II collagen accumulation in CPCs seeded agarose gel compared with the other two agarose gels. The genes expression of Collagen II, Aggrecan and Sox-9 were relatively upregulated in CPCs seeded agarose gel compared with the other two agarose gels on Days 14 and 28. Biochemical and gene assay supported that CPCs play a positive role in neo-cartilaginous formation in tissue engineering compared with CCs and BMSCs.
Nevertheless, the genes expression of Collagen I was also relatively upregulated in CPCs seeded agarose gel compared with the other two agarose gels on Days 14 and 28. The ratios of GAG and collagen to DNA in CPCs and BMSCs were lower than in CCs on Day 7. After another 7 days culture, the ratios of GAG and collagen to DNA were almost the same in the three groups. Meanwhile, the ratio was significantly higher in CPCs rather than BMSCs and CCs after 28 days culture. Although fibrocartilage is dominated by Collagen I, Collagen II can also be found largely in fibrocartilage.34 This phenomenon may reflect the natural behavior of CCs: proliferation and differentiation cannot occur simultaneously in a cell. When CCs are proliferating, they secrete highly Collagen I production rather than Collagen II and differentiated CCs may secrete highly Collagen II instead of Collagen I.34,35 In other words, the more the CCs proliferate, the more Collagen I is produced. Combining this with the outcome of the MTT assay, we conclude that during the initial 7 days, the CPCs and BMSCs may mainly focus on proliferation. In the next 21 days, both proliferation and differentiation play equally important roles in CPCs, while differentiation plays a dominant role gradually in BMSCs and CCs. The increase of Collagen I mRNA expression in CPCs and BMSCs agarose group might be caused by the increase in proliferation. So, it clarified the fact that CPCs seeded agarose scaffold was in the more proliferative behavior in the initial 7 days and in the proliferative and differentiative behavior during the next 3 weeks. This is why cartilage defect of animal models showed fibrocartilage repair in early stage, and the neo-tissue would show under remodeling by Collagen II through mechanical stimulation.36
In addition, we evaluated the integration area of neocartilage with the surrounding native cartilage by Safranin O staining and push-out test as integration is an important key of long-term cartilage repair. In the integration area, matrix deposition in BMSCs and CCs agarose was less, while significantly more matrix deposition was observed in CPCs agarose group on Day 7 for BMSCs as proliferation and CPCs as dominant proliferation and differentiation which led to a good result in the push-out test.37 Meanwhile, the gap between the engineered cartilage with the surrounding native cartilage was smaller in CPCs than the other two groups. There was more and more ECM accumulated in the integration area during the culture. The gap between the engineered cartilage and the surrounding native cartilage became smaller and smaller until it disappeared during the culture. After 28 days culture, we could find ECM uniformly deposited in the integration area in CPCs group, which led to the high integrative strength.
Our study also has some limitations. Our experiment is an ideal environment, without considering the complex microenvironment in the human body. As seed cells for repair, the current techniques for obtaining CPCs from cartilage in large quantities are relatively immature in patients with joint degeneration. However, Togo et al. found that there are a large number of CPCs in the perichondrium of rabbit ears, and this was thought to be a prime source of CPCs.38 That means CPCs can be derived from many different tissues, the differences of which need to be further studied.39
Conclusion
Compared with CCs and BMSCs, CPCs in vitro have dominance in the ability of cell proliferation and differentiation as seed cells in tissue engineering.
Data Sharing Statement
All data generated during this study are included in this published article. Data will be made available from the corresponding author on reasonable request.
Ethics Approval and Consent to Participate
The study was performed according to the international, national and institutional rules considering animal experiments, clinical studies and biodiversity rights. The study protocol was approved by the Ethics Committee of Northern Jiangsu People’s Hospital.
Consent for Publication
All authors have seen the manuscript and approved the submission and publication.
Acknowledgments
The authors would like to thank all participants in the study.
Author Contributions
All authors made a significant contribution to the work reported, whether that is in the conception, study design, execution, acquisition of data, analysis and interpretation, or in all these areas; took part in drafting, revising or critically reviewing the article; gave final approval of the version to be published; have agreed on the journal to which the article has been submitted; and agree to be accountable for all aspects of the work.
Funding
This research did not receive any specific grant from funding agencies in the public, commercial, or not-for-profit sectors.
Disclosure
The authors declare that they have no competing interests.
References
1. Loeser RF, Collins JA, Diekman BO. Ageing and the pathogenesis of osteoarthritis. Nat Rev Rheumatol. 2016;12(7):412–420. doi:10.1038/nrrheum.2016.65
2. Park YB, Ha CW, Rhim JH, et al. Stem cell therapy for articular cartilage repair: review of the entity of cell populations used and the result of the clinical application of each entity. Am J Sports Med. 2018;46(10):2540–2552. doi:10.1177/0363546517729152
3. McGonagle D, Baboolal TG, Jones E. Native joint-resident mesenchymal stem cells for cartilage repair in osteoarthritis. Nat Rev Rheumatol. 2017;13(12):719–730. doi:10.1038/nrrheum.2017.182
4. Chen D, Shen J, Zhao W, et al. Osteoarthritis: toward a comprehensive understanding of pathological mechanism. Bone Res. 2017;5(1):16044. doi:10.1038/boneres.2016.44
5. Lee WY, Wang B. Cartilage repair by mesenchymal stem cells: clinical trial update and perspectives. J Orthop Translat. 2017;9:76–88. doi:10.1016/j.jot.2017.03.005
6. Li CY, Wu XY, Tong JB, et al. Comparative analysis of human mesenchymal stem cells from bone marrow and adipose tissue under xeno-free conditions for cell therapy. Stem Cell Res Ther. 2015;6(1):55. doi:10.1186/s13287-015-0066-5
7. Confalonieri D, Schwab A, Walles H, et al. Advanced therapy medicinal products: a guide for bone marrow-derived MSC application in bone and cartilage tissue engineering. Tissue Eng Part B Rev. 2018;24(2):155–169.
8. Goldberg A, Mitchell K, Soans J, et al. The use of mesenchymal stem cells for cartilage repair and regeneration: a systematic review. J Orthop Surg Res. 2017;12(1):39. doi:10.1186/s13018-017-0534-y
9. Barbero A, Ploegert S, Heberer M, et al. Plasticity of clonal populations of dedifferentiated adult human articular chondrocytes. Arthritis Rheum. 2003;48(5):1315–1325. doi:10.1002/art.10950
10. Mantripragada VP, Bova WA, Boehm C, et al. Progenitor cells from different zones of human cartilage and their correlation with histopathological osteoarthritis progression. J Orthop Res. 2018;38(6):1728–1738. doi:10.1002/jor.23829
11. Peterbauer-Scherb A, van Griensven M, Meinl A, et al. Isolation of pig bone marrow mesenchymal stem cells suitable for one-step procedures in chondrogenic regeneration. J Tissue Eng Regen Med. 2010;4(6):485–490. doi:10.1002/term.262
12. Li Y, Zhou J, Yang X, et al. Intermittent hydrostatic pressure maintains and enhances the chondrogenic differentiation of cartilage progenitor cells cultivated in alginate beads. Dev Growth Differ. 2016;58(2):180. doi:10.1111/dgd.12261
13. Adibkia K, Ehsani A, Jodaei A, et al. Silver nanoparticles induce the cardiomyogenic differentiation of bone marrow derived mesenchymal stem cells via telomere length extension. Beilstein J Nanotechnol. 2021;12:786–797. doi:10.3762/bjnano.12.62
14. Enders JT, Otto TJ, Peters HC, et al. A model for studying human articular cartilage integration in vitro. J Biomed Mater Res A. 2010;94(2):509. doi:10.1002/jbm.a.32719
15. Yin Z, Yang X, Jiang Y, et al. Platelet-rich plasma combined with agarose as a bioactive scaffold to enhance cartilage repair: an in vitro study. J Biomater Appl. 2013;28(7):1039–1050. doi:10.1177/0885328213492573
16. Fathi E, Farahzadi R, Valipour B. Alginate/gelatin encapsulation promotes NK cells differentiation potential of bone marrow resident C-kit+ hematopoietic stem cells. Int J Biol Macromol. 2021;177:317–327. doi:10.1016/j.ijbiomac.2021.02.131
17. Park K, Huang J, Azar F, et al. Scaffold-free, engineered porcine cartilage construct for cartilage defect repair– in vitro and in vivo study. Artif Organs. 2006;30(8):586–596. doi:10.1111/j.1525-1594.2006.00267.x
18. Panagopoulos A, van Niekerk L, Triantafillopoulos I. Autologous chondrocyte implantation for knee cartilage injuries: moderate functional outcome and performance in patients with high-impact activities. Orthopedics. 2012;35(1):6–14. doi:10.3928/01477447-20111122-07
19. Lu Y, Xu Y, Yin Z, et al. Chondrocyte migration affects tissue-engineered cartilage integration by activating the signal transduction pathways involving Src, PLCγ1, and ERK1/2.Tissue. Eng Part A. 2013;19(21–22):2506–2516. doi:10.1089/ten.tea.2012.0614
20. Vinod E, Parameswaran R, Amirtham SM, et al. Comparative analysis of human bone marrow mesenchymal stem cells, articular cartilage derived chondroprogenitors and chondrocytes to determine cell superiority for cartilage regeneration. Acta Histochem. 2021;123(4):151713. doi:10.1016/j.acthis.2021.151713
21. Dowthwaite GP, Bishop JC, Redman SN, et al. The surface of articular cartilage contains a progenitor cell population. J Cell Sci. 2004;117(pt 6):889–897. doi:10.1242/jcs.00912
22. Yu Y, Zheng H, Buckwalter JA, et al. Single cell sorting identifies progenitor cell population from full thickness bovine articular cartilage. Osteoarthritis Cartilage. 2014;22(9):1318–1326. doi:10.1016/j.joca.2014.07.002
23. Baptista LS, Silva KR, Pedrosa CS, et al. Cartilage in a scaffold-free method by human cartilage-derived progenitor cells: a comparison with human adipose-derived mesenchymal stromal cells. Artif Organs. 2013;37(12):1068. doi:10.1111/aor.12121
24. Joos H, Wildner A, Hogrefe C, et al. Interleukin-1 beta and tumor necrosis factor alpha inhibit migration activity of chondrogenic progenitor cells from non-fibrillated osteoarthritic cartilage. Arthritis Res Ther. 2013;15(5):R119. doi:10.1186/ar4299
25. Koelling S, Kruegel J, Irmer M, et al. Migratory chondrogenic progenitor cells from repair tissue during the later stages of human osteoarthritis. Cell Stem Cell. 2009;4(4):324. doi:10.1016/j.stem.2009.01.015
26. Pretzel D, Linss S, Rochler S, et al. Relative percentage and zonal distribution of mesenchymal progenitor cells in human osteoarthritic and normal cartilage. Arthritis Res Ther. 2011;13(2):R64. doi:10.1186/ar3320
27. Alsalameh S, Amin R, Gemba T, et al. Identification of mesenchymal progenitor cells in normal and osteoarthritic human articular cartilage. Arthritis Rheum. 2004;50(5):1522–1532. doi:10.1002/art.20269
28. Mazor M, Cesaro A, Ali M, et al. Progenitor cells from cartilage: grade specific differences in stem cell marker expression. Int J Mol Sci. 2017;18(8):E1759. doi:10.3390/ijms18081759
29. Xia Z, Ma P, Wu N, et al. Altered function in cartilage derived mesenchymal stem cell leads to OA-related cartilage erosion. Am J Transl Res. 2016;8(2):433–446.
30. Seol D, McCabe DJ, Choe H, et al. Chondrogenic progenitor cells respond to cartilage injury. Arthritis Rheum. 2012;64(11):3626–3637. doi:10.1002/art.34613
31. McCarthy HE, Bara JJ, Brakspear K, et al. The comparison of equine articular cartilage progenitor cells and bone marrow derived stromal cells as potential cell sources for cartilage repair in the horse. Vet J. 2012;192(3):345–351. doi:10.1016/j.tvjl.2011.08.036
32. Tao T, Li Y, Gui C, et al. Fibronectin enhances cartilage repair by activating progenitor cells through integrin ɑ5β1 receptor. Int J Mol Sci. 2018;24(13–14):1112–1124.
33. Ng KW, Lima EG, Bian L, et al. Passaged adult chondrocytes can form engineered cartilage with functional mechanical properties: a canine model. Tissue Eng Part A. 2010;16(3):1041–1051. doi:10.1089/ten.tea.2009.0581
34. Drengk A, Zapf A, Sturmer EK, et al. Influence of platelet-rich plasma on chondrogenic differentiation and proliferation of chondrocytes and mesenchymal stem cells. Cells Tissues Organs. 2009;189(5):317–326. doi:10.1159/000151290
35. Hardingham T, Tew S, Murdoch A. Tissue engineering: chondrocytes and cartilage. Arthritis Res. 2002;4(Suppl 3):S63–S68. doi:10.1186/ar561
36. Boopalan PR, Arumugam S, Livingston A, et al. Pulsed electromagnetic field therapy results in healing of full thickness articular cartilage defect. Int Orthop. 2011;35(1):143–148. doi:10.1007/s00264-010-0994-8
37. Kruger JP, Hondke S, Endres M, et al. Human platelet-rich plasma stimulates migration and chondrogenic differentiation of human subchondral progenitor cells. J Orthop Res. 2012;30(6):845–852. doi:10.1002/jor.22005
38. Togo T, Utani A, Naitoh M, et al. Identification of cartilage progenitor cells in the adult ear perichondrium: utilization for cartilage reconstruction. Lab Invest. 2006;86(5):445–457. doi:10.1038/labinvest.3700409
39. Vinod E, Johnson NN, Kumar S, et al. Migratory chondroprogenitors retain superior intrinsic chondrogenic potential for regenerative cartilage repair as compared to human fibronectin derived chondroprogenitors. Sci Rep. 2021;11(1):23685. doi:10.1038/s41598-021-03082-5
 © 2022 The Author(s). This work is published and licensed by Dove Medical Press Limited. The full terms of this license are available at https://www.dovepress.com/terms.php and incorporate the Creative Commons Attribution - Non Commercial (unported, v3.0) License.
By accessing the work you hereby accept the Terms. Non-commercial uses of the work are permitted without any further permission from Dove Medical Press Limited, provided the work is properly attributed. For permission for commercial use of this work, please see paragraphs 4.2 and 5 of our Terms.
© 2022 The Author(s). This work is published and licensed by Dove Medical Press Limited. The full terms of this license are available at https://www.dovepress.com/terms.php and incorporate the Creative Commons Attribution - Non Commercial (unported, v3.0) License.
By accessing the work you hereby accept the Terms. Non-commercial uses of the work are permitted without any further permission from Dove Medical Press Limited, provided the work is properly attributed. For permission for commercial use of this work, please see paragraphs 4.2 and 5 of our Terms.