")
Back to Journals » Drug Design, Development and Therapy » Volume 14
Effects of Apatinib on the Pharmacokinetics of Nifedipine and Warfarin in Patients with Advanced Solid Tumors
Authors Zhu YT, Teng Z, Zhang YF , Li W, Guo LX, Liu YP , Qu XJ, Wang QR, Mao SY, Chen XY, Zhong DF
Received 5 November 2019
Accepted for publication 27 April 2020
Published 20 May 2020 Volume 2020:14 Pages 1963—1970
DOI https://doi.org/10.2147/DDDT.S237301
Checked for plagiarism Yes
Review by Single anonymous peer review
Peer reviewer comments 2
Editor who approved publication: Prof. Dr. Yan Zhu
Yun-Ting Zhu,1,* Zan Teng,2,3,* Yi-Fan Zhang,1 Wei Li,1 Li-Xia Guo,1 Yun-Peng Liu,2,3 Xiu-Juan Qu,2,3 Quan-Ren Wang,4 Si-Yuan Mao,4 Xiao-Yan Chen,1 Da-Fang Zhong1
1State Key Laboratory of Drug Research, Shanghai Institute of Materia Medica, Chinese Academy of Sciences, Shanghai, People’s Republic of China; 2Department of Medical Oncology, The First Hospital of China Medical University, Shenyang, People’s Republic of China; 3Key Laboratory of Anticancer Drugs and Biotherapy of Liaoning Province, The First Hospital of China Medical University, Shenyang, People’s Republic of China; 4Department of Clinical Research and Development, Jiangsu Hengrui Medicine Co., Ltd., Shanghai, People’s Republic of China
*These authors contributed equally to this work
Correspondence: Yi-Fan Zhang; Da-Fang Zhong
State Key Laboratory of Drug Research, Shanghai Institute of Materia Medica, Chinese Academy of Sciences, 501 Haike Road, Shanghai 201203, People’s Republic of China
Tel/ Fax +86 21 50800738
Email [email protected]; [email protected]
Background and Purpose: Apatinib is a small-molecule tyrosine kinase inhibitor for the treatment of recurrent or progressive advanced-stage gastric adenocarcinoma or gastroesophageal junction cancer. The in vitro inhibition studies suggested that apatinib exerted potent inhibition on CYP3A4 and CYP2C9. To evaluate the potential of apatinib as a perpetrator in CYP450-based drug–drug interactions in vivo, nifedipine and warfarin were, respectively, selected in the present study as the probe substrates of CYP3A4 and CYP2C9 for clinical drug–drug interaction studies. Since hypertension and thrombus are common adverse effects of vascular targeting anticancer agents, nifedipine and warfarin are usually coadministered with apatinib in clinical practice.
Methods: A single-center, open-label, single-arm, and self-controlled trial was conducted in patients with advanced solid tumors. The patients received a single dose of 30 mg nifedipine on Day 1/14 and a single dose of 3 mg warfarin on Day 3/16. On Day 9– 21, the subjects received a daily dose of 750 mg apatinib, respectively. The pharmacokinetics of nifedipine and warfarin in the absence or presence of apatinib was, respectively, investigated.
Results: Compared with the single oral administration, coadministration with apatinib contributed to the significant increases of AUC0– 48h and Cmax of nifedipine by 83% (90% confidence interval [CI] 1.46– 2.31) and 64% (90% CI 1.34– 2.01), respectively. Similarly, coadministration with apatinib contributed to the significant increases of AUC0-t and Cmax of S-warfarin by 92% (90% CI 1.68– 2.18) and 24% (90% CI 1.10– 1.39), respectively.
Conclusion: Concomitant apatinib administration resulted in significant increases in systemic exposure to nifedipine and S-warfarin. Owing to the risk of pharmacokinetic drug–drug interactions based on CYP3A4/CYP2C9 inhibition by apatinib, caution is advised in the concurrent use of apatinib with either CYP2C9 or CYP3A4 substrates.
Keywords: apatinib, drug-drug interaction, CYP3A4, CYP2C9, nifedipine, warfarin
Introduction
Apatinib is a small-molecule vascular endothelial growth factor receptor (VEGFR) tyrosine kinase inhibitor, which was approved by the Chinese Food and Drug Administration in 2014 to treat the patients suffering from recurrent or progressive advanced-stage gastric adenocarcinoma or gastroesophageal junction cancer after receiving at least 2 systematic chemotherapy regimens. Apatinib suppresses tumor growth by angiogenesis blocking through the inhibition of the activity of VEGFR tyrosine kinases.1,2 Despite the agreeable clinical efficacy of apatinib, further research of its potential involvement in drug–drug interactions (DDIs) is needed since cancer patients normally receive combination therapies. Risk evaluation of the potential DDIs associated with apatinib will also be of great significance to its rational clinical administration.
As the substrate of CYP450 isoforms, apatinib was reported to be mainly metabolized via CYP3A4 to form hydroxylated and N-oxide metabolites.3 The contribution of CYP3A4 to the in vitro metabolism of apatinib was 62.6%. Coadministration with itraconazole (a potent CYP3A inhibitor) or rifampin (a potent CYP3A inducer) significantly affected the plasma concentrations of apatinib in humans: itraconazole increased the AUC0–t by 75%, whereas rifampin decreased the AUC0–t by 83%, which indicated the high potential of apatinib as a victim for DDIs associated with CYP3A.4
In this study, the inhibition potencies of apatinib on CYP450 isoforms and its potential for clinical DDIs based on CYP450 inhibition were investigated. Our previous in vitro inhibition studies suggested that apatinib exerted potent inhibition on CYP3A4 and CYP2C9, with the IC50 values of 0.44, 1.80, and 0.83 μM for CYP2C9 (tolbutamide hydroxylation), CYP3A4 (midazolam hydroxylation), and CYP3A4 (testosterone hydroxylation), respectively. Further inhibition studies demonstrated that the Ki values of apatinib for CYP2C9 (tolbutamide hydroxylation), CYP3A4 (midazolam hydroxylation), and CYP3A4 (testosterone hydroxylation) were 0.31, 0.71, and 0.27 μM, respectively (data not published). CYP3A4 and CYP2C9 are vital drug-metabolizing enzymes for humans as they are responsible for the metabolism of vast clinically used agents.5 The results of the in vitro inhibition studies indicated that apatinib might influence the exposures of CYP3A4 and CYP2C9 substrates when adopting combination therapies, thus leading to clinical efficacy and safety issues. However, detailed in vivo information of apatinib as CYP3A4 and CYP2C9 inhibitor is lacking.
To evaluate the potential of apatinib as a perpetrator in CYP450-based DDIs, nifedipine and warfarin were, respectively, selected in the present study as the probe substrates of CYP3A4 and CYP2C9 for clinical DDI studies. Nifedipine is a typical substrate of CYP3A4 and commonly used antihypertensive drug in clinical practice. For the patients who receive apatinib, hypertension is a commonly reported adverse event, and nifedipine is most frequently prescribed due to its satisfactory antihypertensive efficacy. Thus, the investigation of the potential DDI between apatinib and nifedipine is of great significance to clinical practice. Warfarin is prescribed as an anticoagulant drug, and an increased risk for arterial thromboembolic events (ATEs) has been linked to the use of the therapy targeting tumor vasculatures including apatinib.6 Moreover, warfarin is the index substrate of CYP2C9 with a narrow therapeutic index.7 The effect of apatinib on warfarin could be representative of the effects on other sensitive CYP2C9 substrates. In addition, it has been reported that the combination of warfarin and tyrosine kinase inhibitors such as gefitinib and erlotinib could increase the bleeding risk owing to CYP2C9 inhibition.8 Considering the likeliness of coadministration with apatinib, nifedipine and warfarin were chosen as the probe substrates in vivo to investigate the magnitudes of the DDIs with apatinib in patients.
In the present study, the pharmacokinetic (PK) parameters of nifedipine and warfarin in cancer patients with and without apatinib were, respectively, calculated for the evaluation of the DDI potentials via CYP3A4 and CYP2C9. The results of the present study could clarify the risk of pharmacokinetic DDIs via inhibition on CYP3A4 and CYP2C9 by apatinib, so as to provide data basis for guiding clinical medicine application.
Materials and Methods
Study Participants
The study protocol was approved by the Ethics Committee of the First Hospital of China Medical University. The studies complied with the ethical principles of Good Clinical Practice, in accordance with the Declaration of Helsinki. The studies were registered in the United States National Library of Medicine (www.clinicaltrials.gov) with a registration number of NCT03245307. All the participants provided written informed consent before the study.
Adult patients (aged 18–70 years with a minimum life expectancy of 3 months) with histologically or cytologically confirmed advanced solid tumors and ECOG (Eastern Cooperative Oncology Group) performance status of 0–1 were included. Unresponsiveness to/intolerance of the standard therapy or unavailability of suitable therapy was also required. Eligible patients could not receive any surgery, radiotherapy, cytotoxic drugs or cytostatic agents within 4 weeks prior to the study, and could not use nitroso or mitomycin within 6 weeks prior to the study. Grapefruit, orange, alcohol, and tobacco were prohibited within 72 h prior to the administration and during the study.
Patients with primary hepatic carcinoma or squamous cell lung carcinoma with a high risk of bleeding were excluded. Other diseases involved in exclusion criteria included ileus, chronic diarrhea, total gastrectomy, uncontrolled high blood pressure, coagulation disorders, hemorrhage symptom, and thrombus. Patients who had received strong CYP3A4/CYP2C9 inhibitors or inducers within 14 days prior to the study were also not eligible.
Study Design
This was a single-center, open-label, single-arm, and self-controlled trial on cancer patients. The design of the study is shown in (Figure 1). The patients received a single oral dose of 30 mg nifedipine controlled-release tablet (30 mg/tablet, Bayer Healthcare AG, Leverkusen, Germany) on days 1/14 and a single oral dose of 3 mg warfarin tablet (3 mg/tablet, Orion Corporation, Espoo, Finland) on days 3/16. On days 9–21, the subjects received a daily dose of 750 mg apatinib tablets (250 mg/tablet, Jiangsu Hengrui Medicine Co., Ltd., Lianyungang, China). On days 14/16, nifedipine or warfarin was administrated after apatinib. Blood samples were collected on days 1/14 with the time points of 0, 1, 2, 3, 4, 6, 8, 12, 24, and 36 h for nifedipine, and on days 3/16 with the time points of 0, 0.5, 1, 2, 3, 5, 8, 12, 24, 48, 72, and 120 h for warfarin.
 |
Figure 1 Study design. |
Analytical Methods
The concentrations of nifedipine and warfarin were, respectively, determined by validated liquid chromatography–tandem mass spectrometry methods previously published.9,10
For nifedipine, chromatographic separation was performed on a BEH C18 column (50 × 2.1 mm, 1.7 μm; Waters). The mobile phase consisted of acetonitrile and 0.2% formic acid in water. Gradient elution started from 15% acetonitrile for 0–0.2 min, climbed 15–95% for 0.2–0.7 min, maintained 95% acetonitrile for 0.7–1.4 min, and re-equilibrated to 15% acetonitrile for 1.4–2.2 min. For warfarin, chromatographic separation was performed on a Chiralcel OI-RH column (150 × 4.6 mm, 5 μm; Daicel). The mobile phase consisted of acetonitrile and 0.1% formic acid in 10 mM ammonium acetate. Isocratic elution was employed with 45% acetonitrile.
Mass spectrometric detection was conducted on QTRAP 5500 triple quadrupole mass spectrometer (Applied Biosystems, Concord, Ontario, Canada) in positive ion electrospray mode. Optimized multiple reaction monitoring fragmentation transitions were m/z 347 → 315 for nifedipine, m/z 353 → 318 for nifedipine-D6, m/z 307 → 160 for warfarin, and m/z 312 → 161 for warfarin-D5.
Pharmacokinetic Analysis
Pharmacokinetic data were analyzed with non-compartment model using Phoenix WinNonlin 7.0 (Pharsight Corp., Mountain View, California). The pharmacokinetic parameters were listed as follows: the time of the maximum concentration (Tmax), the maximum observed plasma concentration (Cmax), the area under the plasma concentration–time curve from time 0 to the time of the last measurable concentration (AUC0–t), the area under the plasma concentration–time curve from time 0 to infinity (AUC0–∞), terminal elimination rate constant (λz), apparent terminal half-life (t1/2z), apparent volume of distribution (Vz/F), and apparent clearance (CL/F).
Cmax and Tmax were directly obtained from the observed data. AUCs were calculated using the linear trapezoidal with linear interpolation method based on actual sampling times. λz was determined from a linear regression of the terminal log-transformed concentration versus time data. t1/2z was calculated as 0.693/λz. CL/F was calculated by dividing the dose by AUC0–∞.
Statistical Analysis
The statistical differences of Cmax and AUC between single and combination therapies were analyzed using bioequivalence tool available in Phoenix WinNonlin 7.0. Statistical analysis was conducted based on the log-transformed Cmax and AUC. The geometric mean ratios for the Cmax and AUC of nifedipine or warfarin with and without apatinib and the corresponding 90% confidence intervals were, respectively, calculated to evaluate the magnitude of the DDIs. The 90% confidence intervals falling entirely within 0.80–1.25 was considered as no clinically significant DDIs.7
Tmax differences between single and combination therapies were examined using a nonparametric test (Wilcoxon signed-rank test). A difference would be considered significant when the P value was smaller than 0.05.
Safety Assessment
Safety assessment included adverse events record, laboratory inspection, life signs investigation, physical examination, 12-lead electrocardiogram, and ultrasonic cardiogram tests. All the adverse events were collected and recorded based on severity levels and relationships to the investigational drug. Adverse events were defined and graded according to the National Cancer Institute Common Terminology Criteria (NCI-CTC) for Adverse Events v4.03.
Medical history assessment, physical examinations, and hematologic and biochemical laboratory evaluations were carried out at screening, on days 8, 15, and 21.
Results
Demographics
The study enrolled a total of 23 patients, including 11 males and 12 females. For 23 subjects, the mean age was 53.3 (range: 26–70) years, and the mean BMI was 24.5 (range: 20.8–32.5). Tumor types included lung cancer (10/23, 43.5%), breast cancer (7/23, 30.4%), esophagus cancer (1/23, 4.35%), colon cancer (1/23, 4.35%), synovial sarcoma (1/23, 4.35%), cyst carcinoma (1/23, 4.35%), thymic malignancy (1/23, 4.35%), and cholangiocarcinoma (1/23, 4.35%).
One subject quitted due to the infection of unknown cause before the administration of apatinib. Two subjects withdrew from the study during the successive administration of apatinib (withdrew consent). The rest 20 subjects fulfilled the study and provided data for statistical analysis. Pharmacokinetic analysis was conducted based on the data from the 23 subjects.
Effect of Apatinib on the PK of Nifedipine
The mean plasma concentration-time profiles of nifedipine following a single oral administration of nifedipine alone or in combination with apatinib are shown in (Figure 2). The corresponding PK parameters of nifedipine are summarized in (Table 1).
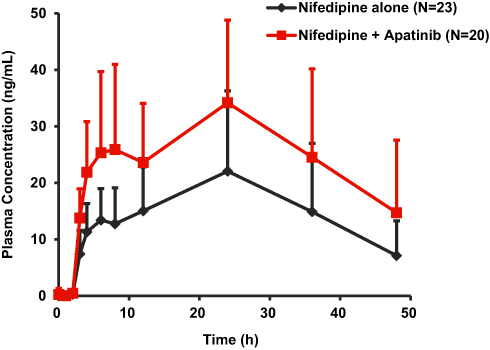 |
Figure 2 Mean (standard deviation) plasma concentration-time profiles of nifedipine following a single oral administration of 30 mg nifedipine alone or in combination with 750 mg apatinib in patients with advanced solid tumors. |
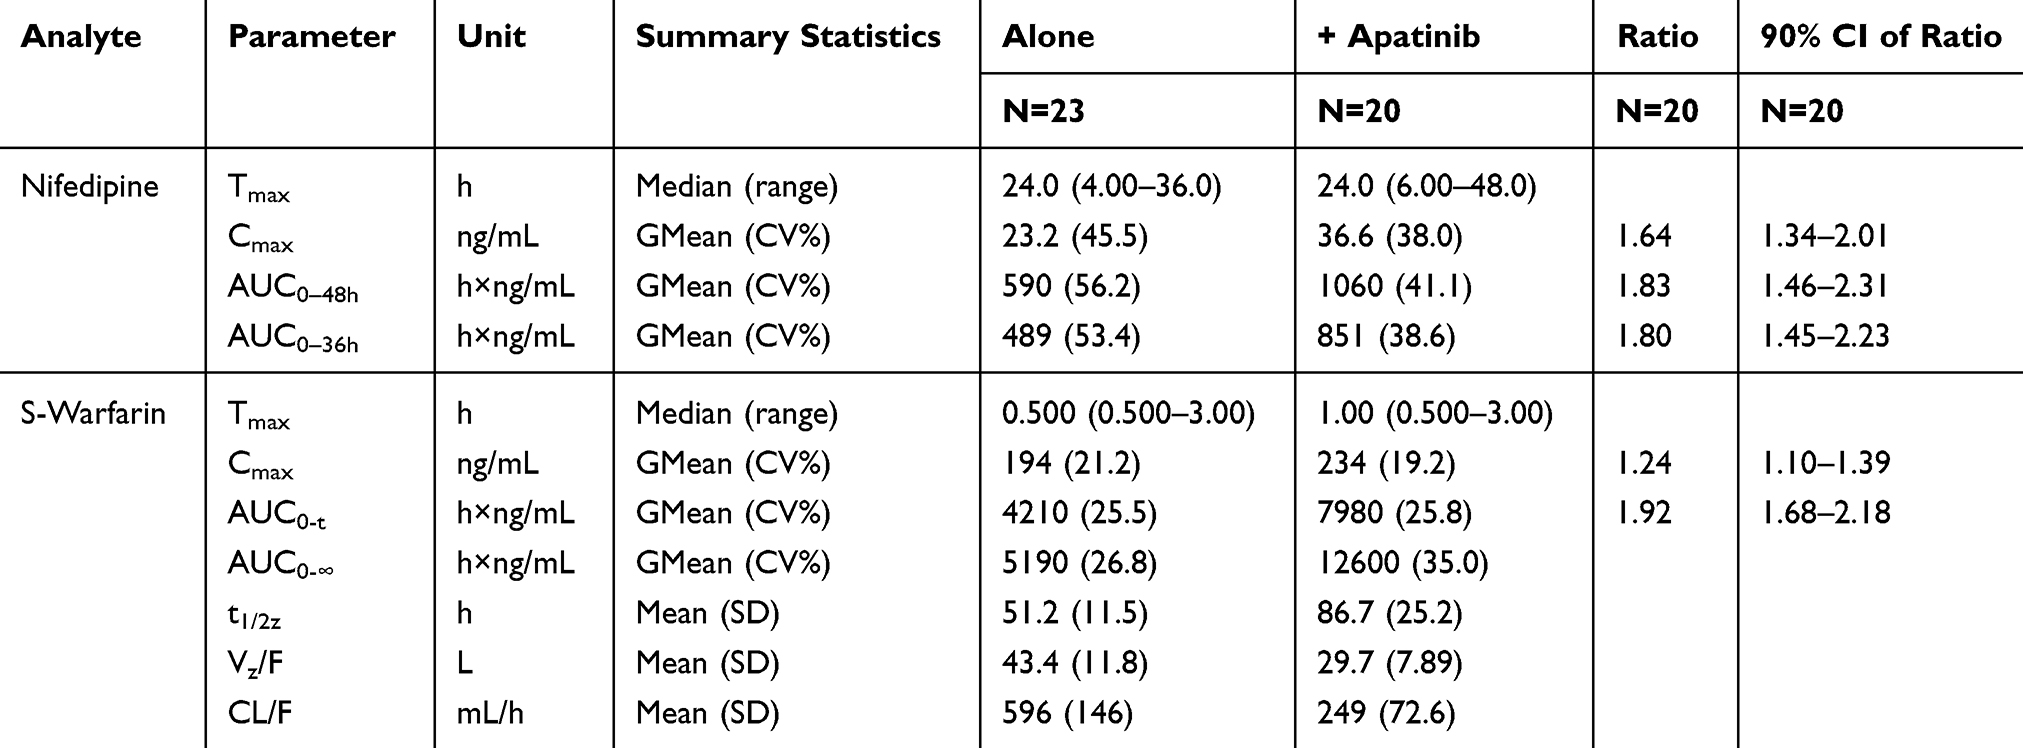 |
Table 1 Pharmacokinetic Parameters of Nifedipine and S-Warfarin Following a Single Oral Administration of 30 mg Nifedipine/3 mg Warfarin Alone or in Combination with 750 mg Apatinib in Patients with Advanced Solid Tumors |
Compared with single oral administration, coadministration with apatinib contributed to the significant increases of nifedipine Cmax and AUC0–48h by 64% and 83%, respectively. For Cmax, the geometric mean ratio with and without the combination of apatinib was 1.64, and the 90% CI resulted in 1.34–2.01, falling outside the boundary of 0.80–1.25. For AUC0–48h, the geometric mean ratio with and without the combination of apatinib was 1.83, with the 90% CI as 1.46–2.31, also extending beyond the boundary of 0.80–1.25. However, there existed no significant difference between the values of Tmax before and after the coadministration of apatinib.
Effect of Apatinib on the PK of S-Warfarin
The mean plasma concentration-time profiles of S-warfarin following a single oral administration of warfarin alone or in combination with apatinib are shown in (Figure 3). The corresponding PK parameters of S-warfarin are summarized in (Table 1).
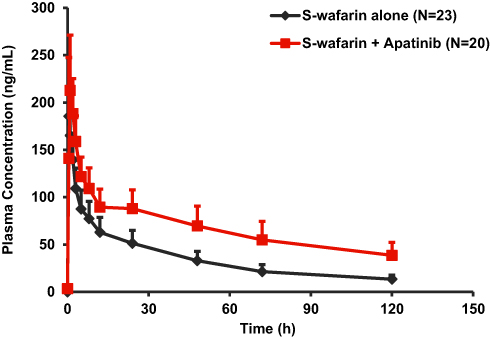 |
Figure 3 Mean (standard deviation) plasma concentration–time profiles of S-warfarin following a single oral administration of 3 mg warfarin alone or in combination with 750 mg apatinib in patients with advanced solid tumors. |
Compared with single oral administration, coadministration with apatinib contributed to the significant increases of S-warfarin Cmax and AUC0–t by 24% and 92%, respectively. For Cmax, the geometric mean ratio with and without the combination of apatinib was 1.24, with the 90% CI as 1.10–1.39, partially falling within 0.80–1.25. For AUC0–t, the geometric mean ratio with and without the combination of apatinib was 1.92, and the 90% CI resulted in 1.68–2.18, falling out of the boundary of 0.80–1.25. In addition, the t1/2z was 70% prolonged after the concurrent use of apatinib, coupled with a 60% reduced CL/F. However, there existed no significant difference between the values of Tmax before and after the coadministration of apatinib.
Safety Summary
In the present study, all 23 patients were included in the safety population, and all the patients experienced at least 1 adverse event of any grade. Drug-related adverse events were seen in 22 patients, primarily grade 1/2. One subject withdrew from the study before the administration of apatinib due to the infection of unknown cause. The most common adverse events considered to be related to apatinib included hypertension (17/23, 73.9%), headache (11/23, 47.8%), thrombocytopenia (7/23, 30.4%), proteinuria (6/23, 26.1%), bilirubin increased (5/23, 21.7%), fatigue (5/23, 21.7%), leukopenia (5/23, 21.7%), and hand-foot syndrome (4/23, 17.4%). The most frequent grade 3/4 drug-related adverse events were hypertension (4/23, 17.4%), which was related to the antiangiogenic mechanism of apatinib. No deaths were reported in this study.
Discussion
The results of the in vitro inhibition studies revealed that apatinib exerted potent inhibition on CYP2C9 and CYP3A4 with the Ki values of 0.31, 0.71, and 0.27 μM for CYP2C9 (tolbutamide hydroxylation), CYP3A4 (midazolam hydroxylation), and CYP3A4 (testosterone hydroxylation), respectively. According to the Guidance for Industry on In Vitro Metabolism- and Transporter-Mediated Drug–Drug Interaction Studies released by the US Food and Drug Administration (FDA),11 the predicted AUC ratios for the CYP2C9 (R) and CYP3A4 (R and Rgut) substrates in the presence and absence of apatinib in vivo were, respectively, calculated using Imax,u (apatinib) = 0.16–0.34 μM,4,12,13 and Igut (apatinib) = dose (750 mg)/250 mL = 6078 μM. For CYP2C9, R = 1 + (Imax,u/Ki) = 1.52–2.10. For CYP3A4, R = 1 + (Imax,u/Ki) = 1.23–1.48/1.59–2.26, and Rgut = 1 + (Igut/Ki) = 8562/22,512. The guidance also mentioned that if R ≥ 1.02 or Rgut ≥ 11,14,15 a clinical DDI study with a sensitive index substrate should be conducted to further investigate the potential of DDI. For apatinib, the predicted AUC ratios (R and Rgut) extended far beyond the criteria, which highlighted the necessity of conducting clinical DDI studies. In order to calculate the true AUC ratios and further investigate the magnitudes of DDIs for apatinib as a CYP2C9 or CYP3A4 inhibitor, clinical DDI studies with sensitive substrates of CYP2C9 and CYP3A4 were conducted.
For DDI studies, healthy volunteers are preferred because patients usually take multiple medications and suffer disease progressions, which may complicate the evaluation of the target DDIs. Nonetheless, the present study was carried out in cancer patients rather than healthy volunteers as multiple doses of apatinib for nearly 2 weeks might not be tolerable for the healthy. In addition, considering the difficulty in recruiting the patients, the study was designed to synchronously evaluate the DDI potential of apatinib with nifedipine and warfarin in the same patients. Before the combination therapy of apatinib with nifedipine or warfarin, apatinib was administrated once daily for 5 successive days to reach steady-state (the t1/2 of apatinib in cancer patients is 8.01–10.2 h), followed by coadministration to maintain the plasma level. At last, the PK parameters of nifedipine and warfarin were respectively calculated in the absence and presence of apatinib.
Nifedipine is one of the most frequently used antihypertensive drugs in the clinic and is also a sensitive substrate of CYP3A4.16,17 For VEGFR inhibitors such as apatinib, sorafenib, and sunitinib, calcium channel blockers including nifedipine are usually prescribed for drug-induced hypertension.18,19 In the current study, the occurrence rate of hypertension as the adverse event of apatinib reached 73.9%, which necessitated the concurrent use of antihypertensive drugs. Therefore, it is of great significance to assess the magnitude of the DDI between nifedipine and apatinib. In the present study, nifedipine controlled-release tablets were used. As high levels of nifedipine remained in the last 36 h samples, the blood samples collected at predose for warfarin were determined for nifedipine as the 48 h samples. Both AUC0–36h and AUC0–48h were calculated for the statistical analysis. In addition, due to the insufficient sampling time points for the elimination phase of controlled-released nifedipine, the values of t1/2z were not provided in the present study.
Despite the limitation in study design, the results exhibit practical and clinical significance as the combination of nifedipine controlled-release tablets occurs often during the apatinib therapy. In fact, for the cancer patients suffering from apatinib-induced hypertension, angiotensin-converting enzyme inhibitors (ACEIs) remain the most recommended agents in clinical practice because ACEIs undergo limited metabolism via CYP450, thus rarely leading to pharmacokinetic DDIs. However, most patients prefer calcium channel blockers due to their better antihypertensive responses. Moreover, the pharmacokinetic DDI of nifedipine via CYP3A4 in humans has rarely been reported. In the present study, similar statistical results were reached for nifedipine based on the AUC0–36h and AUC0–48h increases of 80% and 83%, respectively, after the coadministration with apatinib. The results suggested that concomitant apatinib administration could significantly increase the exposure of nifedipine. The present study has confirmed that the pharmacokinetics of controlled-released nifedipine is affected by the CYP3A4 inhibitor, apatinib, in clinical application. Blood pressure monitoring and dosage modification might be taken into consideration during the concomitant apatinib administration.
Warfarin is widely acknowledged as an effective anticoagulant with a narrow therapeutic index and a high risk of bleeding. Nonetheless, the combination of warfarin and apatinib was frequently adopted as thrombus is one of the adverse events of vascular targeting anticancer agents. Warfarin is clinically prescribed as racemates. As the pharmacological activity of S-warfarin is 4 times more than that of R-warfarin, more attention has been paid to the exposure of S-warfarin in vivo.20 S-warfarin is mainly metabolized by CYP2C9 to 7-hydroxylated warfarin, while R-warfarin is metabolized via CYP1A1, CYP1A2, CYP3A4, and CYP2C19 to 6-, 7-, 8-, and 10-hydroxylated warfarin.21 CYP2C9 plays an absolutely dominant role in the metabolism of S-warfarin since compensatory metabolism leaning on other CYP450 isoforms was not observed for S-warfarin when CYP2C9 allele was deficient.22,23 Moreover, the Guidance for Industry on Clinical Drug Interaction Studies released by the FDA listed S-warfarin as a moderate index substrate for CYP2C9. Therefore, S-warfarin was used in the present study to assess the magnitude of the DDI with CYP2C9 inhibitor, apatinib. Based on the guidance, the effect of the investigational drug (apatinib) on the index substrate (S-warfarin) could be representative of the effects on other sensitive substrates via CYP2C9 inhibition by apatinib.7
Bleeding risk of warfarin is normally evaluated using international normalized ratio (INR) as an indicator. It has been reported that the concomitant warfarin administration with tyrosine kinase inhibitors such as gefitinib and erlotinib could induce DDI, resulting in the increases of INR and bleeding complications. The mechanism referred to the inhibition of S-warfarin 7-hydroxylation by tyrosine kinase inhibitors.8 The elevated INRs associated with the concurrent use of sorafenib/axitinib/regorafenib and warfarin were also observed.24–26 It was also reported that the coadministration of warfarin and statins could lead to clinically significant DDIs caused by CYP450 inhibition.27 In the current study, the concomitant apatinib administration increased the exposure of S-warfarin by 92%, nearly two times. The 90% CI for systemic exposure ratio extended beyond the range of 0.80–1.25. The results suggested that the inhibition of CYP2C9 by apatinib led to a significant increase in S-warfarin exposure. Given that warfarin is generally prescribed using multiple dosage regimen, it is suggested to monitor the level of warfarin and INR during the concomitant therapy in clinical practice as the slight changes in warfarin in vivo pharmacokinetics would directly relate to higher bleeding risks and lead to safety issues, and dosage modification of warfarin might be necessary when apatinib and warfarin are coadministered.
CYP3A4 is principally responsible for the metabolism of apatinib, with a major contribution of 62.6% to its oxidative metabolism among human CYP450 isoenzymes. CYP2C9 also mediates the metabolism of apatinib, with a minor contribution of 13.1%.3 However, comparable inhibition potencies on CYP3A4 and CYP2C9 were observed for apatinib in vitro with Ki of 0.31, 0.71, and 0.27 μM for CYP2C9 (tolbutamide hydroxylation), CYP3A4 (midazolam hydroxylation), and CYP3A4 (testosterone hydroxylation), respectively. The results of the present clinical DDI trial conformed to the results of the in vitro inhibition studies. Apatinib demonstrated comparable inhibition capabilities on CYP3A4 and CYP2C9 in vivo and led to similar magnitudes of DDI for nifedipine and warfarin with the AUC0–t values increased by 83% and 92%, respectively. The results of the current study indicated that more attention should be paid to the clinical DDIs between apatinib with either CYP2C9 or CYP3A4 substrates.
Conclusion
In summary, this study demonstrated that coadministration of apatinib resulted in significant increases in systemic exposure to nifedipine (CYP3A4 substrate) and S-warfarin (CYP2C9 substrate), which might lead to safety issues in clinical combination therapies. The results exhibited practical significance in clarifying the potential of pharmacokinetic DDIs via inhibition on CYP3A4 and CYP2C9 by apatinib and provided important information for the clinical rational drug use of apatinib.
Abbreviations
Tmax, the time of the maximum concentration; Cmax, the maximum observed plasma concentration; AUC0–t, the area under the plasma concentration–time curve from time 0 to the time of the last measurable concentration; AUC0–∞, the area under the plasma concentration–time curve from time 0 to infinity; AUC0–48h, the area under the plasma concentration–time curve from time 0 to 48 h; AUC0–36h, the area under the plasma concentration–time curve from time 0 to 36 h; t1/2z, apparent terminal half-life; Vz/F, apparent volume of distribution; CL/F, apparent clearance; GMean, geometric mean; CV, coefficient of variation; Mean; arithmetic mean; SD, standard deviation; CI, confidence interval.
Data Sharing Statement
Individual deidentified participant data are not going to be shared. All available data have been shown in the article. No other study-related document will be made available.
Disclosure
Quan-Ren Wang and Si-Yuan Mao are employees of Jiangsu Hengrui Medicine Co., Ltd. The authors report no other conflicts of interest in this work.
References
1. Geng R, Li J. Apatinib for the treatment of gastric cancer. Expert Opin Pharmacother. 2015;16:117–122. doi:10.1517/14656566.2015.981526
2. Roviello G, Ravelli A, Fiaschi AI, et al. Apatinib for the treatment of gastric cancer. Expert Rev Gastroenterol Hepatol. 2016;10:887–892. doi:10.1080/17474124.2016.1209407
3. Liu X, Zhang Y, Chen Q, et al. Pharmacokinetic drug interactions of apatinib with rifampin and itraconazole. J Clin Pharmacol. 2018;58:347–356. doi:10.1002/jcph.1016
4. Ding J, Chen X, Gao Z, et al. Metabolism and pharmacokinetics of novel selective vascular endothelial growth factor receptor-2 inhibitor apatinib in humans. Drug Metab Dispos. 2013;41:1195–1210. doi:10.1124/dmd.112.050310
5. Zanger UM, Schwab M. Cytochrome P450 enzymes in drug metabolism: regulation of gene expression, enzyme activities, and impact of genetic variation. Pharmacol Ther. 2013;138:103–141. doi:10.1016/j.pharmthera.2012.12.007
6. Choueiri TK, Sonpavde G, Goldberg RM, Larson RA, Tirnauer JS Toxicity of molecularly targeted antiangiogenic agents: non-cardiovascular effects. UpToDate [homepage on the Internet]; 2014. Available from: https://www.uptodate.com/contents/zh-Hans/toxicity-of-molecularly-targeted-antiangiogenic-agents-non-cardiovascular-effects.html.
7. US Food and Drug Administration: Center for Drug Evaluation and Research (CDER). Guidance for Industry: Clinical Drug Interaction Studies—study Design, Data Analysis, and Clinical Implications (Draft). US Food and Drug Administration; 2017.
8. Hiraide M, Minowa Y, Nakano Y, et al. Drug interactions between tyrosine kinase inhibitors (gefitinib and erlotinib) and warfarin: assessment of international normalized ratio elevation characteristics and in vitro CYP2C9 activity. J Oncol Pharm Pract. 2019;25:1599–1607. doi:10.1177/1078155218801061
9. Chen XF, Hou XY, Chen XY, Zhong DF. Rapid and simultaneous determination of nifedipine and dehydronifedipine in human plasma. Yao Xue Xue Bao. 2019;54:360–365.
10. Jin S, Zhang YF, Chen XY, Liu K, Zhong DF. Enantioselective determination of R-warfarin/S-warfarin in human plasma using liquid chromatography-tandem mass spectrometry and its application in a drug-drug interaction study. Yao Xue Xue Bao. 2012;47:105–109.
11. US Food and Drug Administration: Center for Drug Evaluation and Research (CDER). Guidance for Industry: In Vitro Metabolism- and Transporter-Mediated Drug-Drug Interaction Studies (Draft). US Food and Drug Administration; 2017.
12. Li J, Zhao X, Chen L, et al. Safety and pharmacokinetics of novel selective vascular endothelial growth factor receptor-2 inhibitor YN968D1 in patients with advanced malignancies. BMC Cancer. 2010;10:529. doi:10.1186/1471-2407-10-529
13. Yu M, Gao Z, Dai X, et al. Population pharmacokinetic and covariate analysis of apatinib, an oral tyrosine kinase inhibitor, in healthy volunteers and patients with solid tumors. Clin Pharmacokinet. 2017;56:65–76. doi:10.1007/s40262-016-0427-y
14. Tachibana T, Kato M, Watanabe T, Mitsui T, Sugiyama Y. Method for predicting the risk of drug-drug interactions involving inhibition of intestinal CYP3A4 and P-glycoprotein. Xenobiotica. 2009;39:430–443. doi:10.1080/00498250902846252
15. Vieira MD, Kim MJ, Apparaju S, et al. PBPK model describes the effects of comedication and genetic polymorphism on systemic exposure of drugs that undergo multiple clearance pathways. Clin Pharmacol Ther. 2014;95:550–557. doi:10.1038/clpt.2014.43
16. Lang CC, Jamal SK, Mohamed Z, Mustafa MR, Mustafa AM, Lee TC. Evidence of an interaction between nifedipine and nafcillin in humans. Br J Clin Pharmacol. 2003;55:588–590. doi:10.1046/j.1365-2125.2003.01789.x
17. Filgueira GCO, Filgueira OAS, Carvalho DM, et al. Effect of type 2 diabetes mellitus on the pharmacokinetics and transplacental transfer of nifedipine in hypertensive pregnant women. Br J Clin Pharmacol. 2017;83:1571–1579. doi:10.1111/bcp.13226
18. Touyz RM, Lang NN, Herrmann J, van den Meiracker AH, Danser AHJ. Recent advances in hypertension and cardiovascular toxicities with vascular endothelial growth factor inhibition. Hypertension. 2017;70:220–226. doi:10.1161/HYPERTENSIONAHA.117.08856
19. Bono P, Rautiola J, Utriainen T, Joensuu H. Hypertension as predictor of sunitinib treatment outcome in metastatic renal cell carcinoma. Acta Oncol. 2011;50:569–573. doi:10.3109/0284186X.2010.543696
20. Lane S, Al-Zubiedi S, Hatch E, et al. The population pharmacokinetics of R- and S-warfarin: effect of genetic and clinical factors. Br J Clin Pharmacol. 2012;73:66–76. doi:10.1111/j.1365-2125.2011.04051.x
21. Maddison J, Somogyi AA, Jensen BP, James HM, Gentgall M, Rolan PE. The pharmacokinetics and pharmacodynamics of single dose (R)- and (S)-warfarin administered separately and together: relationship to VKORC1 genotype. Br J Clin Pharmacol. 2013;75:208–216. doi:10.1111/j.1365-2125.2012.04335.x
22. Flora DR, Rettie AE, Brundage RC, Tracy TS. CYP2C9 genotype-dependent warfarin pharmacokinetics: impact of CYP2C9 genotype on R- and S-warfarin and their oxidative metabolites. J Clin Pharmacol. 2017;57:382–393. doi:10.1002/jcph.813
23. Shaul C, Blotnick S, Muszkat M, Bialer M, Caraco Y. Quantitative assessment of CYP2C9 genetic polymorphisms effect on the oral clearance of s-warfarin in healthy subjects. Mol Diagn Ther. 2017;21:75–83. doi:10.1007/s40291-016-0247-7
24. Moretti LV, Montalvo RO. Elevated international normalized ratio associated with concurrent use of sorafenib and warfarin. Am J Health Syst Pharm. 2009;66:2123–2125. doi:10.2146/ajhp080436
25. Primeaux B, Burton B, Shuey S. Supratherapeutic INR resulting from the initiation of warfarin in a patient receiving axitinib. J Oncol Pharm Pract. 2018;24:74–75. doi:10.1177/1078155216677853
26. Kitade H, Hiromasa-Yamasaki A, Hokkoku K, et al. Elevated prothrombin time/international normalized ratio associated with concurrent administration of regorafenib and warfarin in a patient with advanced colorectal cancer. J Pharma Health Care Sci. 2016;2:15. doi:10.1186/s40780-016-0050-y
27. Shaik AN, Bohnert T, Williams DA, Gan LL, LeDuc BW. Mechanism of drug-drug interactions between warfarin and statins. J Pharm Sci. 2016;105:1976–1986. doi:10.1016/j.xphs.2016.03.011
 © 2020 The Author(s). This work is published and licensed by Dove Medical Press Limited. The full terms of this license are available at https://www.dovepress.com/terms.php and incorporate the Creative Commons Attribution - Non Commercial (unported, v3.0) License.
By accessing the work you hereby accept the Terms. Non-commercial uses of the work are permitted without any further permission from Dove Medical Press Limited, provided the work is properly attributed. For permission for commercial use of this work, please see paragraphs 4.2 and 5 of our Terms.
© 2020 The Author(s). This work is published and licensed by Dove Medical Press Limited. The full terms of this license are available at https://www.dovepress.com/terms.php and incorporate the Creative Commons Attribution - Non Commercial (unported, v3.0) License.
By accessing the work you hereby accept the Terms. Non-commercial uses of the work are permitted without any further permission from Dove Medical Press Limited, provided the work is properly attributed. For permission for commercial use of this work, please see paragraphs 4.2 and 5 of our Terms.