")
Back to Journals » Veterinary Medicine: Research and Reports » Volume 11
Effects of Age on Inflammatory Profiles and Nutrition/Energy Metabolism in Domestic Cats
Authors Mizorogi T, Kobayashi M, Ohara K, Okada Y , Yamamoto I, Arai T , Kawasumi K
Received 15 August 2020
Accepted for publication 27 October 2020
Published 23 November 2020 Volume 2020:11 Pages 131—137
DOI https://doi.org/10.2147/VMRR.S277208
Checked for plagiarism Yes
Review by Single anonymous peer review
Peer reviewer comments 2
Editor who approved publication: Professor Young Lyoo
Takayuki Mizorogi,1,2 Motoo Kobayashi,2 Kenji Ohara,1,3 Yuki Okada,1 Ichiro Yamamoto,1 Toshiro Arai,1 Koh Kawasumi1
1Laboratory of Veterinary Biochemistry, School of Veterinary Medicine, Nippon Veterinary and Life Science University, Tokyo, Japan; 2Seijyo Kobayashi Veterinary Clinic, Tokyo, Japan; 3National Veterinary Assay Laboratory, Ministry of Agriculture, Forestry & Fisheries, Government of Japan, Tokyo, Japan
Correspondence: Koh Kawasumi
Nippon Veterinary and Life Science University, Tokyo, Japan
Tel +81 422 31 4151
Fax +81 422 31 7841
Email [email protected]
Background: Animals tend to increase in body weight and body condition score (BCS) with aging. Serum diagnostic markers related to energy metabolism may show changes even in healthy cats with aging.
Materials and Methods: Seventy domestic cats were recruited for this study. Based upon the modified AAFP-AAHA Feline Life Stage Guidelines, animals were divided into six groups: Junior (7 months– 2 years), Prime (3 − 6 years), Mature (7– 10 years), Senior (11– 14 years), Geriatric-obese (15 years ≤) and Geriatric-thin (15 years ≤). Their body condition scores (BCS) ranged from 3/9 to 9/9. Changes in metabolites, inflammatory markers, hormone concentrations and enzyme activities related to energy metabolism were investigated in serum of 70 domestic cats of various ages.
Results: Serum glucose (GLU) concentrations in the Mature, Senior, and Geriatric-obese groups were significantly higher than those in the Junior group. Serum amyloid A (SAA) concentrations in the Geriatric-thin group were significantly increased compared with the Junior group. SAA concentrations in the Geriatric-obese group tended to increase although there were no statistically significant differences. In the Mature, Senior, Geriatric-obese and Geriatric-thin groups, malate dehydrogenase/lactate dehydrogenase (M/L) ratio, an energy metabolic indicator, tended to decrease compared with the Junior group. In the Senior group, triglyceride (TG) concentrations were significantly increased compared with the Junior group. In the Geriatric-obese and Geriatric-thin groups, blood urea nitrogen (BUN) concentrations were significantly increased compared with the Junior group. In the Geriatric-obese group, albumin (ALB) concentrations were decreased compared with the Junior group.
Conclusion: Aged domestic cats tend to increase in body weight and BCS. In addition, serum GLU, TG, SAA, and BUN concentrations increased and serum ALB concentrations and M/L ratio decreased. These diagnostic markers may be useful to detect small changes related to energy metabolism with aging that may cause obesity with light inflammation in healthy cats.
Keywords: aging, domestic cats, M/L ratio, obesity, SAA
Introduction
In humans, physical activities decrease with aging and body mass index (BMI) and fat distribution change.1,2 Energy metabolism is downregulated in aged humans and excess calories are prone to be accumulated as ectopic fat in the abdominal cavity. Aged mice exhibited altered nutrient handling (glucose intolerance, insulin resistance, reduced fatty acid oxidation, and reduced ketogenesis), decreased mitochondrial biogenesis, oxidative phosphorylation, expression of stress defense genes, and apoptosis regulation.3 Obesity is an excessive accumulation of triglyceride in adipose tissues, due to an energy imbalance where energy intake exceeds energy expenditure. Prevalence of obesity has increased rapidly in recent years in humans, with aging and obesity associated with various metabolic abnormalities that can lead to cardiovascular morbidity and mortality.4 Metabolic syndrome has been related to the increasing prevalence of obesity, which is escalating among older age groups.5
Cats are more prone to become obese compared with dogs due to their unique characteristics in glucose and lipid metabolism such as a lack of hepatic glucokinase activities and low insulin signaling activities.6,7 Cats are also prone to be insulin resistant compared with dogs due to low mRNA expression of insulin receptor substrate-1 (IRS-1), insulin receptor substrate-2 (IRS-2), and phosphatidylinositol 3-kinase (PI3-K) P-85 in insulin-responsive tissues (liver, skeletal muscle, abdominal fat, white blood cells).8 In cats, the prevalence of obesity has increased with aging in recent decades as it has in humans.9,10 However, alteration in energy metabolism with aging in cats is not well investigated.
In this study, we investigated changes in serum metabolites, hormone concentrations and enzyme activities as diagnostic markers for energy metabolism in healthy cats of various ages. Changes in these reference values of healthy cats with aging seem to be useful to understand onset mechanisms of aging-related disorders, including obesity. The aim of this study is to investigate changes in serum diagnostic markers associated with energy metabolism in healthy cats with aging.
Materials and Methods
Animals
Seventy domestic cats having a medical examination at a veterinary clinic in Tokyo from October 1 to December 5, 2018 were recruited. Written informed consent was obtained from each client. Based upon modified AAFP-AAHA Feline Life Stage Guidelines,11 animals were divided into six groups: Junior (7 months–2 years), Prime (3−6 years), Mature (7–10 years), Senior (11–14 years), Geriatric-obese (15 years <) and Geriatric-thin (15 years <) (Table 1). Breeds of Mix, Scottish Fold, Munchkin, Japanese Cat, American Shorthair, Ragdoll, Selkirk Rex, Norweigian Forest Cat, and Persian were included (Table 1). Eight cats with clinical symptoms were investigated to evaluate serum SAA concentrations compared with those in healthy cats (Table 3). Ethical approval for this study was obtained from Nippon Veterinary and Life Science University (27S-1). We confirm this study was conducted following best veterinary practice procedures.
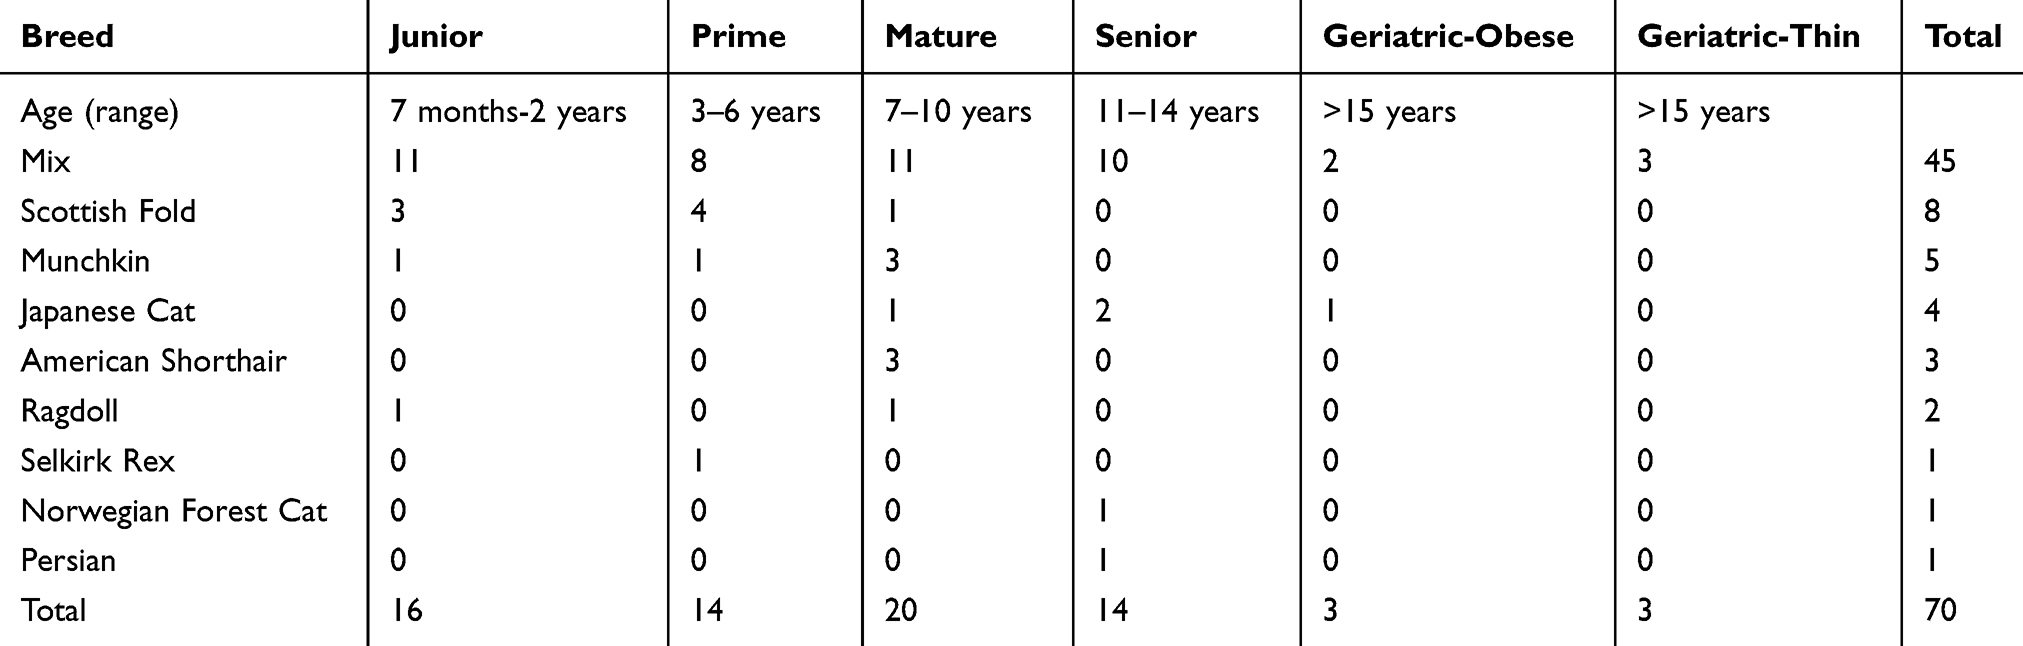 |
Table 1 Profile of the Age, Breed and Gender of 70 Cats in This Study |
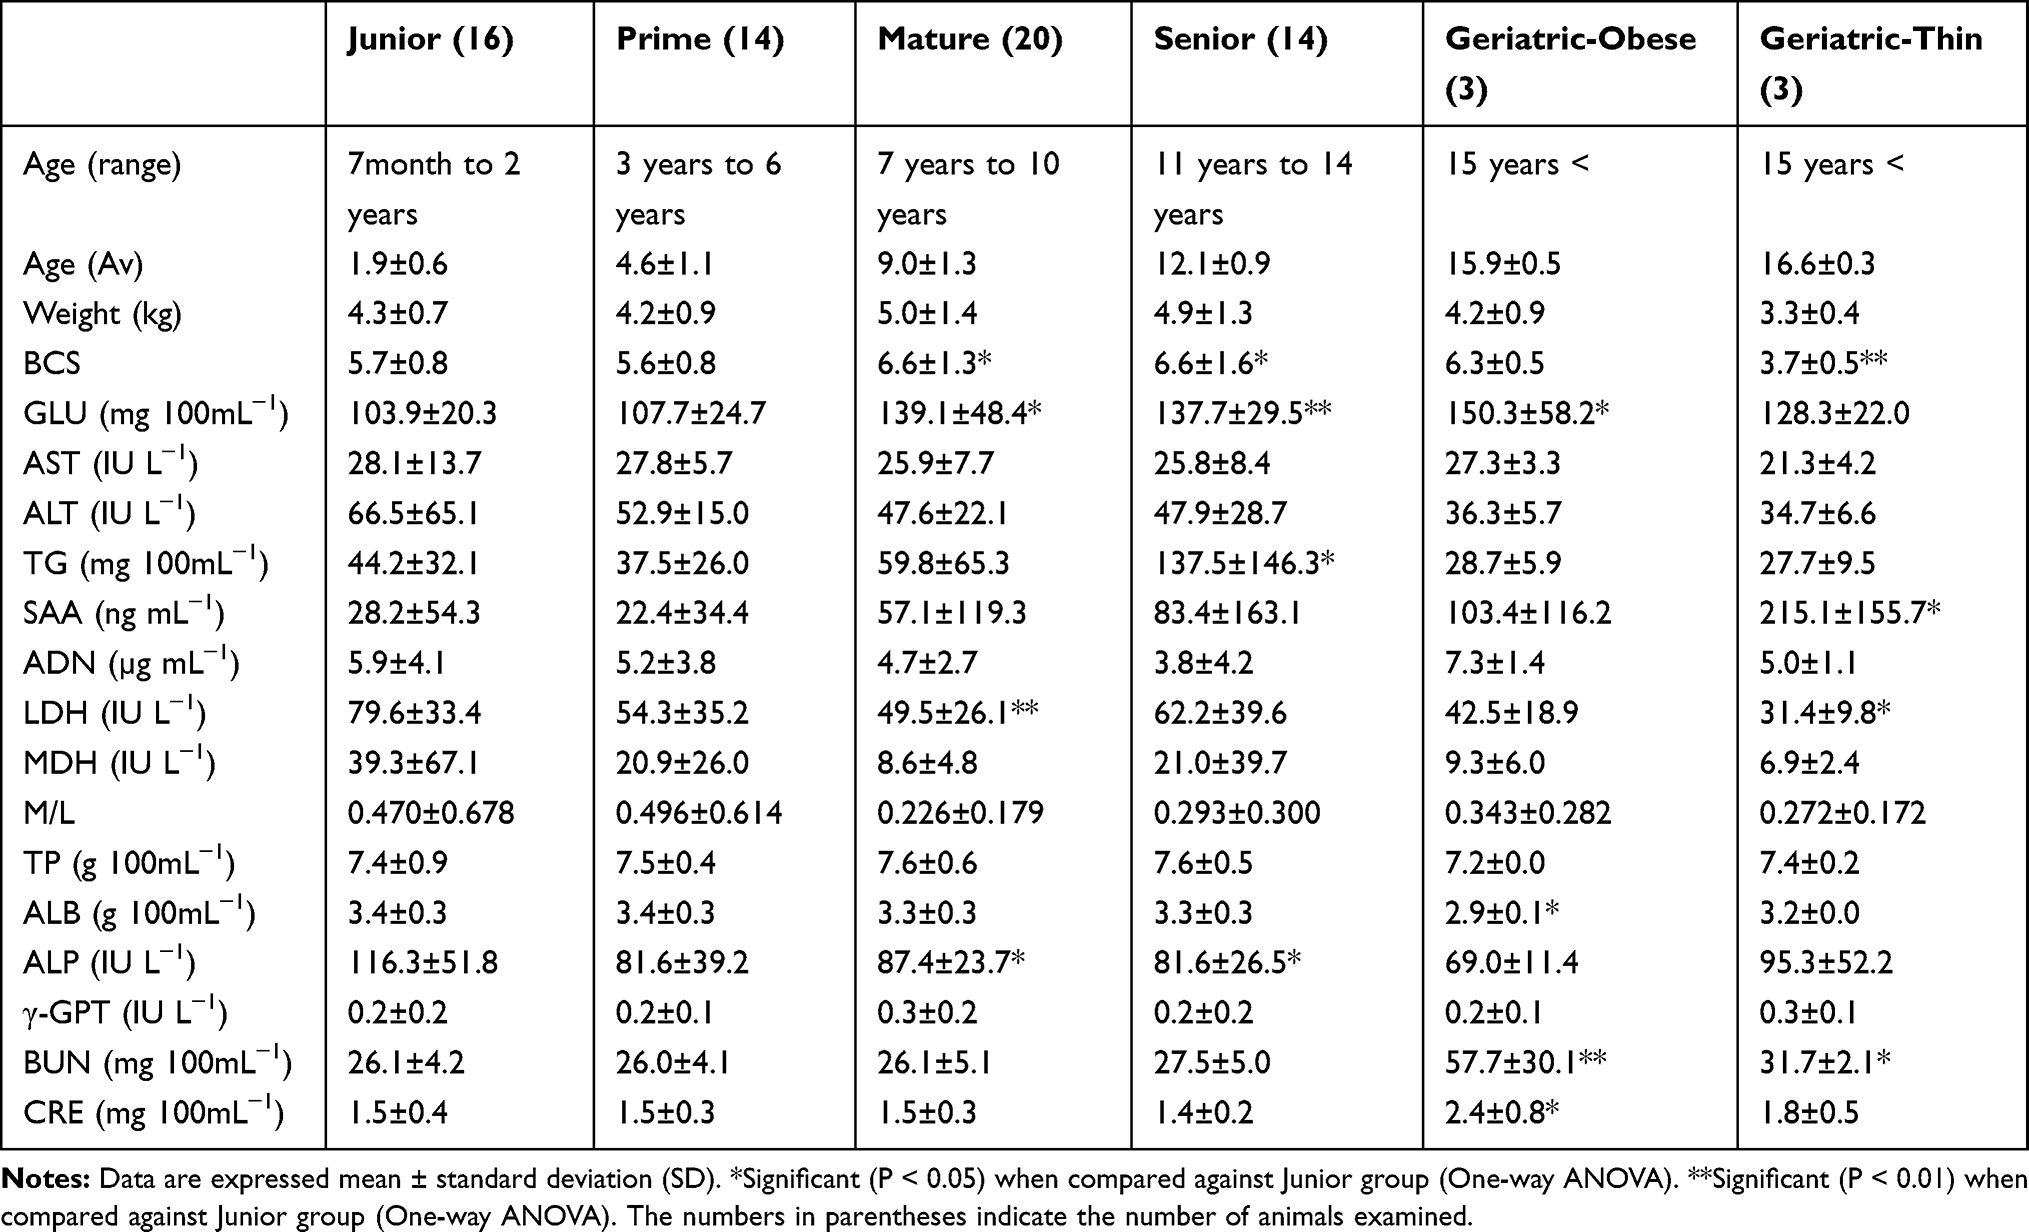 |
Table 2 Changes in Biomarkers Among Different Ages in 70 Cats |
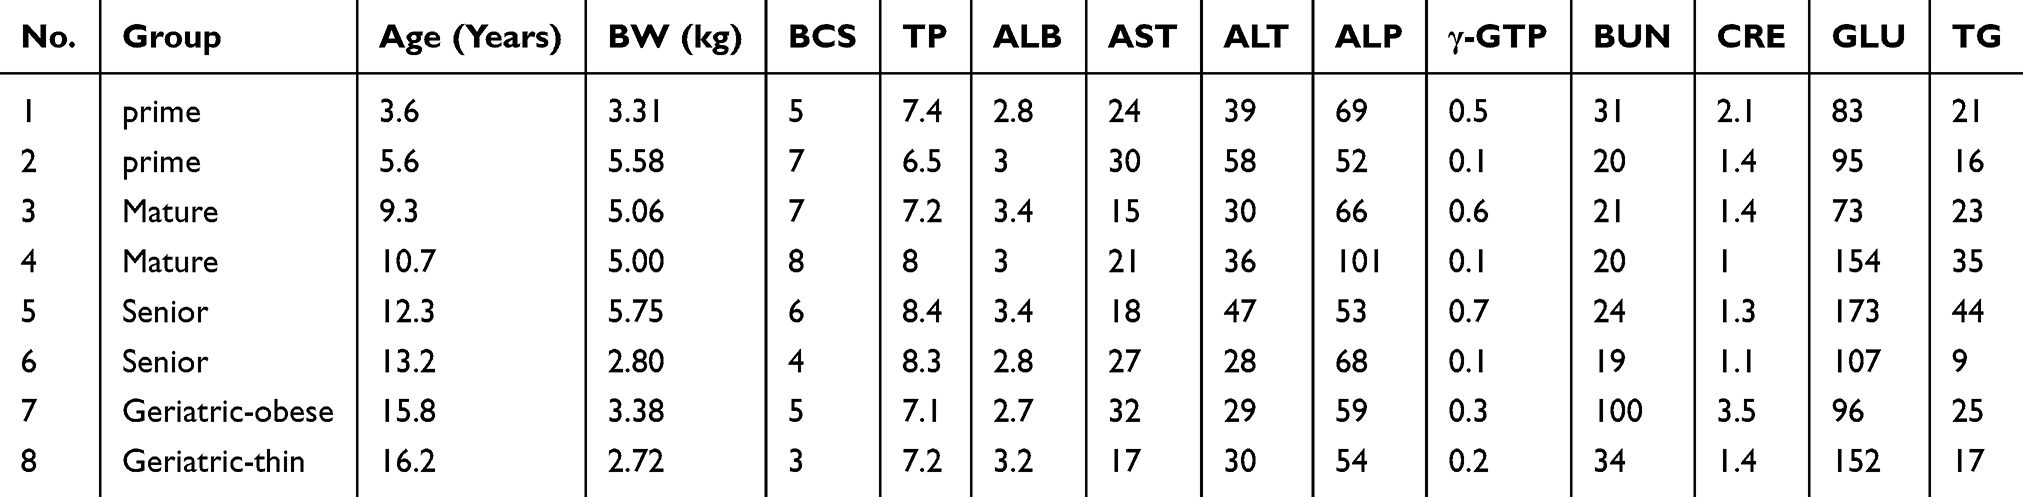 |
Table 3 The Profile of Biomarkers of 8 Cats with Clinical Symptoms |
Body Weight (BW) and Body Conditioning Score (BCS) Measurement
Body weight (BW) was measured at the health checkup. In Japan, body condition scores (BCS) of cats are usually examined with a 5-point system. However, this system is vague. To evaluate in detail, we employed a 9-point system: 1/9, emaciated; 2/9, very thin; 3/9, thin; 4/9, underweight; 5/9, ideal; 6/9, overweight; 7/9, heavy; 8/9; obese; 9/9, severely obese).12 In the Geriatric groups, ≦4 of BCS was classified as the Geriatric-thin group while ≧6 of BCS was classified as the Geriatric-obese group in this study.
Blood Sampling and Analysis
Fasting blood samples at least 8 h after last meal were taken from jugular veins of cats. Serum was recovered by centrifugation at 3000 g, for 5 min at 4°C and stored at −80°C until use. GLU, TG, total protein (TP), BUN, creatinine (CRE) and ALB concentrations and alanine aminotransferase (ALT), aspartate aminotransferase (AST), alkaline phosphatase (ALP), γ-glutamyl transpeptidase (γ-GTP) activities were measured using an auto analyzer (JCA-BM2250, JEOL Ltd, Tokyo, Japan) with the manufacturer’s reagents at FUJIFILM Monolith Co., Ltd (Tokyo, Japan). Serum lactate dehydrogenase (LDH)13 and malate dehydrogenase (MDH)14 activities were measured by previously described methods. The serum MDH/LDH (M/L) ratio was calculated as MDH activities divided by LDH activities. Serum adiponectin (ADN) concentrations were measured with commercial ELISA kits, mouse/rat adiponectin ELISA kit (Otsuka Pharmaceutical Co., Ltd, Tokyo, Japan). Ten thousand-fold diluted serum was applied for ADN measurement. Acceptable detection range was estimated as from 0.25 ng/mL to 8.0 ng/mL by calibration curve15 Serum amyloid A (SAA) concentrations were measured with commercial ELISA kit (CAT SERUM AMYLOID A (SAA) ELISA, Life Diagnostics, Inc., West Chester, USA). Denatured (at 60°C, for 1 h) serum was diluted at least 50-fold for SAA measurement according to the instructions. Acceptable detection range was estimated to be 0.94 ng/mL to 15 ng/mL16 by calibration curve.
Statistical Analysis
Results are presented as means ± standard deviation (SD). Statistical significance was determined by One-way ANOVA. The significance level was set at P < 0.05 or P < 0.01. Correlation coefficients and P values between the age and examined parameters were calculated by a multivariable regression analysis. Significance levels were set at P< 0.05 or P<0.01. Correlation coefficients were evaluated as follows: |0.7–1.0|: excellent, |0.4–0.7|: moderate, |0.2–0.4|: weak, | 0–0.2|: no correlation.
Results
Changes in Body Condition Score (BCS)
As shown in Table 2, BCSs in Junior (7 months to 2 years), Prime (3–6 years), Mature (7–10 years), Senior (11–14 years), Geriatric-obese (15 years <), and Geriatric-thin (15 years <) groups were 5.7 ± 0.8, 5.6 ± 0.8, 6.6 ± 1.3, 6.6 ± 1.6, 5.3 ± 0.5, and 3.7 ± 0.5 respectively. In Junior group, 3 of 16 (18.8%) cats were ≧ 7/9 of BCS. In Prime group, 3 of 14 (21.4%) cats were ≧ 7/9 of BCS. In Mature group, 10 (50.0%) of 20 cats were ≧ 7/9 of BCS. In Senior group, 7 (50.0%) of 14 cats were ≧ 7/9 of BCS. Three (50.0%) of 6 geriatric group cats were ≧ 6/9 of BCS while 3 (50.0%) of 6 cats were ≦4/9 of BCS.
Changes in Serum Metabolites
As shown in Table 2, serum GLU concentrations in Mature, Senior, and Geriatric-obese groups were significantly higher than those in Junior group (mean ± SD, 139.1±48.4137.7 ± 29.5150.3 ± 58.2 mg 100 mL−1 vs 103.9 ± 20.3 mg 100 mL−1, P value 0.028, P value 0.001, P value 0.031) respectively.
Serum TG concentrations in Senior group were significantly increased compared with those in Junior group. (137.5±146.3 mg 100 mL−1 vs 44.2±32.1 mg 100 mL−1, P value 0.029). Serum BUN concentrations in Geriatric-obese and Geriatric-thin group were significantly increased compared to those in Junior group (57.7± 30.1 mg 100mL−1, 31.7±2.1 mg 100 mL−1vs 26.1± 4.2 mg 100 mL−1, P value 0.001, P value 0.048) respectively.
Changes in Inflammatory Biomarker
As shown in Table 2, SAA concentrations in Geriatric-thin group were significantly increased compared to those in Junior group (215.1 ng mL−1 vs 28.2 ±54.3 ng mL−1, P value 0.010). As shown in Table 4, 3 of 8 cats with clinical symptoms showed high levels of SAA concentrations with > upper detection limit (15 ng/mL−1). Five of 8 cats with clinical symptoms showed 218.4 ng mL−1, 486.4 ng mL−1, 601.4 ng mL−1, 206.0 ng mL−1, 265.8 ng mL−1, respectively using 100-fold diluted sera.
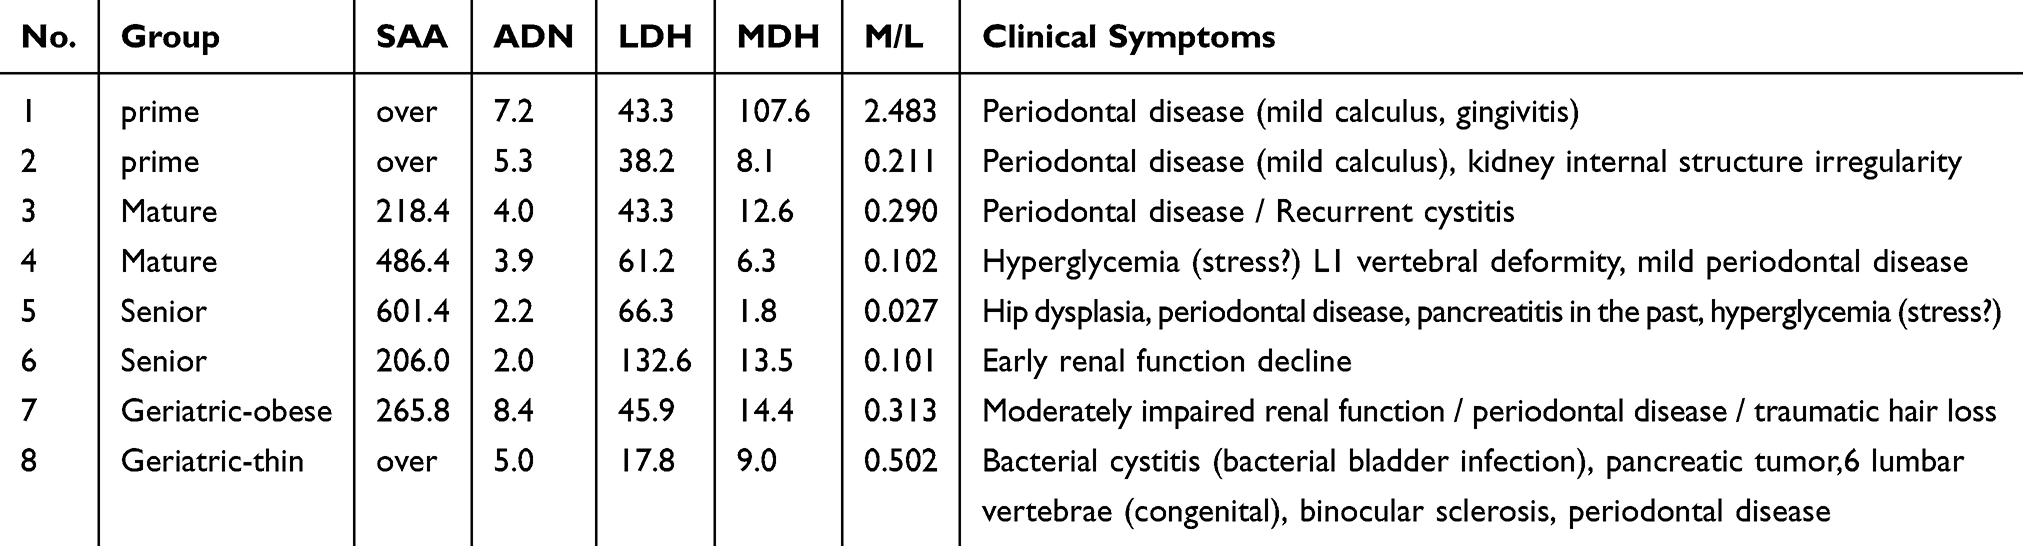 |
Table 4 The Profile of Biomarkers of 8 Cats with Clinical Symptoms |
Changes in Energy Metabolism Marker
As shown in Table 2, malate dehydrogenase/lactate dehydrogenase (M/L) ratio, as an energy metabolic indicator, decreased with aging although statistical significances were not shown.
Changes in Serum Adiponectin
As shown in Table 2, significant differences in serum ADN concentrations were not shown among Junior (5.9±4.1 µg mL−1), Prime (5.2 ±3.8 µg mL−1), Mature (4.7±2.7 µg mL−1), Senior (3.8±4.2 µg mL−1) Geriatric-obese (7.3±1.4 µg mL−1) or Geriatric-thin (5.0±1.1 µg mL−1) groups.
The Profile of Biomarkers of 8 Cats with Clinical Symptoms
As shown in Tables 3 and 4, 8 cats showed clinical symptoms with high serum SAA levels. Seven of 8 cats were affected with periodontal disease.
Correlation Coefficients and P values Between Age and Examined Parameters
As shown in Table 5, correlation coefficients and P values between age and examined parameter were calculated by multivariate regression analysis. Positive weak correlations between age and GLU (coefficient 0.351, P value 0.003), SAA (coefficient 0.320, P value 0.013), BUN (coefficient 0.306, P value 0.010) were shown while a negative weak correlation between age and ALB (coefficient −0.306, P value 0.010), ALP (coefficient −0.237, P value 0.049) was shown.
 |
Table 5 Correlation Coefficients and P values Between the Age and Examined Parameters in This Study |
Discussion
In this study, we investigated values of metabolites, enzymes and hormones in serum of 70 domestic cats with various ages. Body weight and BCS of cats increased with aging. In Japan, body condition scores (BCS) of cats are usually examined with a 5-point system. However, this system is vague. In this study, we employed a 9-point system to evaluate in detail. We divided the geriatric group into Geriatric-obese and Geriatric-thin groups since we found two types in the geriatric group. Generally, domestic cats seemed to increase body weight and BCS with aging. In this study, we investigated values of metabolites, enzymes and hormones in serum of 70 healthy cats of various ages. Three of 70 (4.3%) cats investigated were thin at geriatric stage. Almost all cats seemed to increase body weight and BCS with aging. Serum GLU and TG concentrations increased with aging. Nine breeds of cats were recruited in this study. It is difficult to clarify breed difference in aging since there are many influential factors in domestic cats.
In cats, GLU uptake to the liver is considerably lower than dogs since glucokinase activity is lacking in the livers of cats6 and cats are more prone to suffer from insulin resistance and type 2 diabetes mellitus due to a decrease of the insulin signaling gene (IRS-1, IRS-2 and PI3-K) expression.8 Cats may tend to be obese compared with dogs.
MDH is a key enzyme for the malate-aspartate shuttle, an NADH shuttle which produces ATPs from glucose metabolism. LDH is an enzyme which catalyzes the conversion of lactate to pyruvate consuming cytosolic NADH. M/L ratio is regarded as a good indicator for evaluating energy metabolism in animals.17,18 In this study, M/L ratio in Junior group was higher than in the Geriatric group although there was no statistical significance. In healthy cats, energy metabolism (ATP production via glycolysis) seems to attenuate gradually with aging. It now seems evident that the aging process is accompanied by mitochondrial dysfunction in humans and experimental animals.19
SAA, an inflammatory marker, gradually increased with aging in healthy cats. SAA, a protein of ~12 kDa, is an acute phase reactant that can be detected in blood when inflammation occurs. In humans, serum SAA concentrations increase up to 1000-fold within 24–48 h after inflammatory stimuli.20 Feline SAA concentrations are also recognized as a useful inflammatory marker. When inflammation and/or tissue damage occurs, feline SAA concentrations also increase up to 1000-fold.21 We reported that SAA concentrations significantly increase in cats with obesity.22 In this study, we observed an increase in high SAA concentrations in geriatric cats. It suggests that some slight inflammation occurs in the body with aging.
We have previously reported serum ADN concentrations tended to decrease in obese cats with visceral fat accumulation.23,24 However, serum ADN concentrations in geriatric cats in this study are not different from those in other younger cats since their BCS is not significantly different. No adiponectin variation would be expected for healthy geriatric cats.
Serum ALB concentrations in geriatric-obese cats were lower than those in other younger cats. We suggest that decrease of ALB and M/L ratio may indicate attenuation of liver functions related to nutrition/energy metabolism with aging.
From the above results, serum GLU, TG, SAA, ALB concentrations and M/L ratio seem to be useful markers for detecting small changes related to energy metabolism in aged cats. Chandler reported that the peak age for obesity in cats is between 10 and 12 years old.25 Therefore, we have to pay much attention to feline health condition at pre-senior stages.
The limitations of this study are as follows. 1) Kitten group (< 6 months) cats according to the AAFP-AAHA Feline Life Stage Guidelines are not recruited in this study. 2) Gender and breed differences on aging are not investigated due to the small number of animals examined. 3) Influences of nutritional factors are not considered since pet foods given from pet owners are varied. 4) Energy metabolic markers, such as 5ʹadenosine monophosphate-activated protein kinase (AMPK), were not measured in this study.
In this study, we clarified that a part of small changes related to energy metabolism including increases in body weight and BCS result in the occurrence of obesity in healthy cats with aging. These changes seem to be owing to declines in liver and kidney function. Some diagnostic markers such as GLU, TG, SAA, ALB, BUN concentrations and M/L ratio can reflect small reactions related to energy metabolism in healthy cats. These phenomena may suggest that energy metabolism in liver and kidney may be attenuated with slight inflammation in aged cats.
Conclusion
Healthy cats tend to increase their body weight and BCS with aging. These changes seem to be owing to attenuation related to energy metabolism in their liver and kidneys. In healthy cats, serum GLU, TG BUN, and SAA concentrations increased and serum ALB concentrations and M/L ratio decreased. These diagnostic markers may be useful to detect small changes related to energy metabolism with aging which can cause obesity with light inflammation in healthy cats.
Abbreviation
ADN, adiponectin; ALB, albumin; ALP, alkaline phosphatase; ALT, alanine aminotransferase; AMPK, 5ʹ-adenosine monophosphate-activated protein kinase; AST, aspartate aminotransferase; BCS, body condition score; BMI, body mass index, BUN, blood urea nitrogen; BW, body weight; CRE, creatinine; GLU, glucose; γ-GTP, γ-glutamyl transpeptidase; IRS-1, insulin receptor substrate-1; IRS-2, insulin receptor substrate; LDH, lactate dehydrogenase; MDH, malate dehydrogenase; M/L, malate dehydrogenase/lactate dehydrogenase; NADH, nicotinamide adenine dinucleotide; PIP3-K, phosphatidylinositol3-kinase; SAA, serum amyloid A; SD, standard deviation; TG, triglyceride; TP, total protein.
Acknowledgments
We would like to thank the staff of Seijo Kobayashi Veterinary Clinic for serum sampling on animal health checks.
Disclosure
The authors report no conflicts of interest and declare that this study was conducted in the absence of any commercial or financial relationships that could be construed as a potential conflict of interest.
References
1. Krotkiewski M, Bjorntorp P, Stostrom L, Smith U. Impact of obesity on metabolism in man and women. Importance of regional adipose tissue distribution. J Clin Invest. 1983;72:1150–1162. doi:10.1172/JCI111040
2. Lind L, Figarska S, Sundstrom J, Fall T, Arnlov J, Ingelsson E. Changes in proteomic profiles are related to changes in BMI and fat distribution during 10 years of aging. Obesity. 2020;28:178–186. doi:10.1002/oby.22660
3. Azzu V, Valencak TG. Energy metabolism and aging in the mouse: A mini review. Gerontology. 2017;63:327–336. doi:10.1159/000454924
4. Bastin M, Poirier P, Lemieux I, Despres JP. Overview of epidemiology and contribution of obesity to cardiovascular disease. Prog Cardiovasc Dis. 2014;56(4):369–381. doi:10.1016/j.pcad.2013.10.016
5. Dominguez LJ, Barbagallo M. The biology of the metabolic syndrome and aging. Curr Opin Clin Nutr Metab Care. 2016;19:5–11. doi:10.1097/MCO.0000000000000243
6. Tanaka A, Inoue A, Takeguchi A, Washizu T, Bonkobara M, Arai T. Comparison of expression of glucokinase gene and activities of enzymes related to glucose metabolism in livers between dog and cat. Vet Res Commun. 2005;29:477–485. doi:10.1007/s11259-005-1868-1
7. Lee P, Mori A, Takemitsu H, Yamamoto I, Arai T. Lipogenic gene expression in abdominal adipose and liver tissues of diet-induced overweight cats. Vet J. 2011;190:e150–e153. doi:10.1016/j.tvjl.2011.04.003
8. Mori A, Lee P, Takemitsu H, Sako T, Arai T. Comparison of insulin signaling gene expression in insulin sensitive tissues between cats and dogs. Vet Res Commun. 2009;33:211–226. doi:10.1007/s11259-008-9168-1
9. Edney AT, Smith PM. Study of obesity in dogs visiting veterinary practices in the United Kingdom. Vet Rec. 1986;118:391–396. doi:10.1136/vr.118.14.391
10. Mori N, Iwasaki E, Okada Y, Kawasumi K, Arai T. Overall prevalence of feline overweight/obesity in Japan as determined from a cross-sectional sample pool of healthy veterinary clinic-visiting cats in Japan. Turk J Vet Anim Sci. 2016;40:304–312. doi:10.3906/vet-1502-31
11. AAFP–AAHA Feline Life Stage Guidelines. Journal of the American Hospital Association. Available from: https://www.aaha.org/globalassets/02-guidelines/feline-life-stage/felinelifestageguidelines.pdf.
12. Bjornvad CR, Nielsen DH, Armstrong PJ, et al. Evaluation of a nine-point body condition scoring system in physically inactive pet cats. Am J Vet Res. 2011;72:433–437. doi:10.2460/ajvr.72.4.433
13. Kaloustain HD, Stolzenbach FE, Everse J, Kaplan NO. Lactate dehydrogenase of lobster (Homarus americanus) tail muscle Ⅰ. Physical and chemical properties. J Biol Chem. 1969;244:2891–2901.
14. Bergmeyer HU, Bernet E Maltate dehydrogenase UV-Assay. In: Methods of Enzymatic Analysis, Bergmeyer HU (Ed.).
15. Ostuka Pharmaceutical. Mouse/Rat adiponectin ELISA kit. 2006. TI25462309 (Instruction manual in Japanese. Available from: http://www2.otsuka.co.jp/research_reagents/research/category02/images/pdf_direction-sheet.pdf. Accessed October 8,2020.
16. Life Diagnostics, Inc. Cat serum amyloid A (SAA) ELISA Catalog Number: SAA-8 (Instruction manual). Available from: http://www.lifediagnostics.com/wp-content/uploads/SAA-8.pdf. Accessed October 8,2020.
17. Li G, Lee P, Mori N, Yamamoto I, Arai T. Long term intensive exercise training leads to a higher plasma malate/lactate dehydrogenase (M/L) ratio and increased level of lipid mobilization in horses. Vet Res Commun. 2012;36:149–155. doi:10.1007/s11259-012-9515-0
18. Okada Y, Kawasumi K, Koide M, et al. Changes in energy metabolic indicators with aging in Thoroughbred riding horses. AJAVA. 2016;11:253–257. doi:10.3923/ajava.2016.253.257
19. Akbari M, Kirkwood TBL, Bohr VA. Mitochondria in the signaling pathway that control longevity and health span. Aging Res Rev. 2019;54:100940. doi:10.1016/j.arr.2019.100940
20. Husby G, Marhaug G, Dowtor B, Sletten K, Sipe JD. Serum amyloid A (SAA): biochemistry, genetics and the pathogenesis of AA amyloidosis. j Protein Folding Disorders. 1994;1:119–137. doi:10.3109/13506129409148635
21. Tamamoto T, Ohno K, Ohmi A, Goto-Koshino Y, Tsujimoto H. Verification of measurement of the feline serum amyloid A (SAA) concentration by human SAA turbidimetric immunoassay and its clinical application. J Vet Sci. 2008;70:1247–1252. doi:10.1292/jvms.70.1247
22. Okada Y, Ueno H, Mizorogi T, Ohara K, Kawasumi K, Arai T. Diagnostic criteria for obesity disease in cats. Front Vet Sci. 2019;4:17. doi:10.3389/fvets.2019.00284
23. Okada Y, Kobayashi M, Sawamura M, Arai T. Comparison of visceral fat accumulation and metabolome markers among cats of varying BCS and novel classification of feline obesity and metabolic syndrome. Front Vet Sci. 2017;4:17. doi:10.3389/fvets.2017.00017
24. Gulcelik NE, Halil M, Ariogul S, Usman A. Adipokines and aging: adiponectin and leptin. Minerva Endocrinol. 2013;38:203–210.
25. Chandler M, Cunningham S, Lund EM, et al. Obesity and associated comorbidities in people and companion animals: a one health perspective. J Comp Pathol. 2017;156:296–309. doi:10.1016/j.jcpa.2017.03.006
 © 2020 The Author(s). This work is published and licensed by Dove Medical Press Limited. The full terms of this license are available at https://www.dovepress.com/terms.php and incorporate the Creative Commons Attribution - Non Commercial (unported, v3.0) License.
By accessing the work you hereby accept the Terms. Non-commercial uses of the work are permitted without any further permission from Dove Medical Press Limited, provided the work is properly attributed. For permission for commercial use of this work, please see paragraphs 4.2 and 5 of our Terms.
© 2020 The Author(s). This work is published and licensed by Dove Medical Press Limited. The full terms of this license are available at https://www.dovepress.com/terms.php and incorporate the Creative Commons Attribution - Non Commercial (unported, v3.0) License.
By accessing the work you hereby accept the Terms. Non-commercial uses of the work are permitted without any further permission from Dove Medical Press Limited, provided the work is properly attributed. For permission for commercial use of this work, please see paragraphs 4.2 and 5 of our Terms.